
Crypto World
Oil and Gold Surge as Middle East Tensions Rattle Global Markets

Editor’s note: Geopolitical tensions in the Middle East are triggering a rapid market reaction, with oil and gold rallying while regional equities reel from disruptions. This editor’s briefing previews the immediate market response as UAE exchanges pause trading and investors weigh reopening scenarios. Market color from Josh Gilbert of eToro underscores the uncertainty and the central question: how long this disruption lasts and whether we see escalation or de-escalation in the coming days.
Markets hate uncertainty, and right now investors are facing one of the most unpredictable geopolitical backdrops in years. The key question is not just what has happened, but how long this disruption lasts and whether we see escalation or de-escalation in the coming days.
Rising Middle East tensions push oil and gold higher, rattling regional equities and shaping the near-term global outlook as markets await any de-escalation.
Key points
- Oil prices surged to around US$82 per barrel, with Brent rising on disruption fears in the Strait of Hormuz.
- Gold climbed above US$5,350 per ounce, reinforcing safe-haven demand amid geopolitical risk.
- Abu Dhabi and Dubai exchanges were closed, highlighting the seriousness of the situation and uncertainty around reopening.
- Risk assets weakened as capital rotated toward defensive positions, awaiting clarity on escalation or de-escalation.
Why this matters
As energy and precious metal prices respond to geopolitical risk, the near-term outlook for regional economies and global inflation remains sensitive to sentiment and policy signals. The UAE’s diversified, services-driven economy may weather disruption better than markets fear, but confidence and capital flows could face headwinds until de-escalation appears likely.
What to watch next
- Reopening trajectory for UAE exchanges after the pause, with the next 48–72 hours critical for sentiment.
- Oil price movement and its potential impact on transport costs and global inflation.
- Gold’s continued safe-haven demand versus any shift in risk appetite.
- Any changes in UAE tourism, aviation, and real estate activity tied to connectivity and confidence.
Disclosure: The content below is a press release provided by the company/PR representative. It is published for informational purposes.
Oil and Gold Surge as Middle East Tensions Rattle Global Markets
Abu Dhabi, UAE – 2 March 2026: Escalating tensions in the Middle East have sent shockwaves through global markets, pushing oil and gold sharply higher and raising fresh questions about the near-term outlook for regional equities.

Josh Gilbert, Market Analyst at eToro, said: “Markets hate uncertainty, and right now investors are facing one of the most unpredictable geopolitical backdrops in years. The key question is not just what has happened, but how long this disruption lasts and whether we see escalation or de-escalation in the coming days.”
The Abu Dhabi Securities Exchange (ADX) and Dubai Financial Market (DFM) remain closed on Monday and Tuesday in a rare move outside scheduled holidays, highlighting the seriousness of the situation. Investors are now focused on what reopening could look like once trading resumes.
“History shows that outcomes vary widely,” Gilbert added. “When Turkey suspended trading after the 2023 earthquake, markets rallied strongly on reopening. When Russia halted trading after invading Ukraine, the outcome was far more severe. For UAE markets, the next 48 to 72 hours will be critical.”
Oil in Focus
Oil has been the immediate flashpoint. Brent crude surged as much as 13% to around US$82 per barrel, driven by fears of disruption in the Strait of Hormuz, which carries roughly 20% of the world’s crude oil and LNG supply.
“Even without a full closure of the Strait of Hormuz, disruption to tanker traffic is enough to rattle energy markets,” said Gilbert. “Conflicting signals from Iran have added to the uncertainty investors are trying to price in.”
There are, however, short-term buffers in place. The global oil market entered this period with relative oversupply, and OPEC+ had already announced a production increase of 206,000 barrels per day for April. Major consumers such as the US and China also hold substantial strategic reserves, while Saudi Arabia has pipeline capacity to reroute some exports.
“These measures provide short-term cushioning,” Gilbert noted. “But if tensions persist, sustained higher oil prices will filter through to transport costs and ultimately inflation globally.”
Gold Surges, Risk Assets Weaken
Gold has once again acted as the clearest safe haven, climbing above US$5,350 per ounce and gaining roughly 22% year-to-date.
“Gold remains the asset investors turn to in times of geopolitical stress,” Gilbert said. “Unless we see meaningful de-escalation, that safe-haven demand is unlikely to fade.”
Meanwhile, higher-risk assets, including cryptocurrencies, have come under pressure as investors rotate toward defensive positions.
“In risk-off environments, capital typically flows to traditional safe havens rather than more volatile assets,” he added.
Direct Impact on the UAE
For the UAE, the implications extend beyond market volatility. Real estate, tourism, aviation, and retail — key pillars of economic diversification — are particularly exposed.
Dubai averaged approximately 13,000 home sales per month last year at an average price of AED 2.5 million, largely supported by foreign investment and expatriate inflows. With around 350,000 new units expected to come to market over the next two years, any sustained hit to confidence or capital flows could challenge demand absorption.
Tourism is another critical sector. Travel and tourism accounted for around 13% of UAE GDP in 2025. With hundreds of flights cancelled and temporary airport disruptions reported, the impact is already being felt.
“Dubai’s retail and hospitality ecosystem depends on connectivity,” Gilbert said. “Any prolonged disruption to airspace or tourism confidence will weigh on near-term growth.”
While higher oil prices may offer fiscal support, the UAE economy today is far more diversified and services-driven than it was a decade ago.
“That means disrupted tourism, grounded flights, and shaken investor sentiment matter more than ever,” Gilbert explained.
Staying Focused on the Long Term
Gilbert cautioned against reactive decision-making.
“The instinct in moments like this is to act, but for most long-term investors, doing very little is often the wiser approach. Selling into panic rarely proves to be the right decision in hindsight.”
He concluded: “There is room for volatility when UAE markets reopen, particularly as very little geopolitical risk had been priced in. However, if de-escalation emerges quickly, the long-term fundamentals of the UAE — strong infrastructure, a pro-business regulatory framework, and its role as a regional hub — remain intact. Short-term turbulence does not undo decades of structural progress.”
About eToro
eToro is the trading and investing platform that empowers you to invest, share and learn. Founded in 2007 with the vision of a world where everyone can trade and invest in a simple and transparent way, today eToro has 40 million registered users from 75 countries.
eToro believes in the power of shared knowledge and that investors can become more successful by investing together. The platform has built a collaborative investment community designed to provide users with the tools they need to grow their knowledge and wealth. On eToro, users can hold a range of traditional and innovative assets and choose how they invest: trade directly, invest in a portfolio, or copy other investors.


The aftershocks of the Saturday’s KelpDAO hack are spreading through stablecoin markets in ways that were not immediately obvious.
Int he first 24 hours post the attack, users on Aave borrowed approximately $300 million against their tether deposits of stablecoin tether on the platform, according to Chaos Labs data.
The borrowing spike isn’t a sign of demand; it is a sign users can’t withdraw. With stablecoin pools maxed out, depositors are taking loans against their own funds at a loss just to access liquidity.
Think of it this way: Imagine a bank refusing to process customer fiat deposit withdrawal requests. So, out of desperation, customers take out loans on these deposits. This credit creation isn’t healthy, but a desperate move for liquidity.
“We’re now seeing some negative secondary effects of illiquidity in Aave stablecoin markets,” said monetsupply.eth, the pseudonymous head of strategy at Spark, a rival DeFi lending platform. “Because users can’t withdraw due to 100% utilization, there has been a ~$300 million increase in borrowing with USDT collateral in just the past day since the rsETH exploit.”
To understand how a single exploit on KelpDAO ended up locking every stablecoin exit on Aave simultaneously, you need to understand how the system is supposed to work — and exactly where it broke.
What is Aave and how it’s supposed to work
Aave is a decentralized finance (DeFi) protocol that enables users to lend and borrow cryptocurrencies without intermediaries. Think of it as a bank, except it runs entirely on code on a public blockchain, with no human gatekeepers.
Users deposit assets into lending pools and earn interest. Others borrow from those same pools by posting crypto assets as collateral, which exceeds the loan amount. The system is designed to self-correct automatically through interest rates. When lots of people want to borrow, rates rise, making borrowing more expensive and encouraging lenders to deposit more. When demand falls, rates drop.
The whole system operates on one core assumption: that there is always enough liquidity – enough assets in the pool – for lenders to withdraw their deposits when they want to, and for borrowers to unwind their positions when they need to.
When that assumption breaks down, everything else breaks with it. That’s what happened after the KelpDAO exploit.
rsETH and the KelpDAO exploit
rsETH is a liquid re-staking ether token issued by KelpDAO.
When you stake ether (ETH), you lock it up to help secure the Ethereum network in exchange for a yield, similar to earning interest on a bond. Some protocols issue a liquid staking token (LST) that represents your staked ETH.
Re-staking goes a step further, reusing those already-staked assets to secure additional systems, effectively stacking yield on yield. In return, you receive a receipt token representing your position. rsETH is one such receipt token and it has been widely used as collateral across the DeFi world.
On April 18, an attacker manipulated KelpDAO’s bridge infrastructure into releasing 116,500 rsETH — roughly 18% of the token’s circulating supply, worth approximately $292 million. These fake, unbacked tokens were immediately deposited into lending protocols, mostly Aave, to borrow real ETH and other assets such as wrapped ether (wETH) against them. Fake tokens in, real money out.
“That [borrowed] WETH is gone. The rsETH holding its place in the vaults is worth whatever an unbacked claim is worth — approaching zero on the L2 side, where 20+ chains held bridged rsETH backed by a now-empty mainnet lockbox,” 0xyanshu, a pseudonymous crypto operator known for work around on-chain finance and risk, said.
Aave froze rsETH markets on V3 and V4 within hours, with founder Stani Kulechov affirming the exploit was external and Aave’s contracts were not compromised. That freeze stopped the bleeding. But it also set off the chain reaction that produced the $300 million borrowing surge.
How $300 million in borrowing materialized in a single day
When the exploit news broke, whales and big funds withdrew billions of dollars worth of cryptocurrencies from Aave’s liquidity pools within hours. Because they moved first and in large numbers, their withdrawals drained liquidity pools.
“When the rsETH exploit happened and AAVE incurred bad debt, whales like Justin Sun, MEXC exchange, and others immediately withdrew billions from AAVE,” analyst Duo Nine, said in an explainer. “Initially, the ETH market hit 100% utilization, meaning you could not withdraw your ETH from AAVE.”
This soon spread to USDT and USDC pools, raising their utilization rates to 100%, as over $6 billion in assets left the protocol within hours. Every lending pool holds a fixed amount of assets deposited by users. When every dollar of those assets has been borrowed out, nothing remains for withdrawals.
“That’s because AAVE lost over $6 billion in liquidity in the past 24h,” Duo Nine wrote. “As whales took out their money, USDT and USDC also hit 100% utilization. These markets are now also stuck with money locked.”
This is when the $300 million secondary borrowing surge began.
Trapped USDT and USDC depositors, unable to simply withdraw their money, reached for the only exit still available to them. They began by drawing loans from their locked deposits.
“Some users decided to borrow against USDT/USDC and exit via other markets at a 10-25% loss,” Duo Nine explained. “Basically you borrow GHO/DAI/USDe against your locked USDT/C.” It was not a trading strategy.
It has been a desperate act of borrowing against their own money at a loss, accepting 75 cents on the dollar, just to extract any liquidity from the system at all. Aave allows users to borrow up to 75% of the total loan-to-value (LTV) of their deposited collateral, depending on the asset and its risk parameters.
“With a 75% max LTV, users with stuck USDT deposits can take out up to 3/4 of the value of their Aave position. But this ends up reducing liquidity in other markets, with USDC and USDe markets now at 100% utilization as well,” monetsupply.eth, the pseudonymous head of strategy at Spark, a rival DeFi lending platform, observed.
For anyone watching DeFi from the outside, the message is clear: “Decentralized” does not mean “without risk.”

Coinbase is accelerating its internal use of AI by piloting agents that assist employees with day-to-day work, including integration with Slack and email. The rollout marks another step in the crypto exchange’s broader push to weave artificial intelligence into its operations, a trend unfolding across the tech sector as firms lean on automation to cope with hiring constraints and scale knowledge work.
In a post on X this weekend, Coinbase chief executive Brian Armstrong announced that the company has already deployed two AI agents modeled after former Coinbase executives. He suggested that the number of agents could eventually exceed the company’s human headcount, signaling a future where AI handles a growing share of internal tasks and decision-making. The comments come as Coinbase has publicly foregrounded AI as a strategic lever, including ambitions to push more of the company’s coding work toward AI-assisted workflows.
Coinbase’s AI push sits within a broader industry context where tech giants have been trimming staff while expanding AI capabilities. Armstrong has been explicit about ambitions to automate more workflows, including a notable claim last year that AI could contribute to a substantial portion of the company’s code. The exchange has also highlighted plans to transform its workforce into “AI-Natives,” a goal it described as part of its productivity strategy. In parallel, Coinbase operates the x402 protocol, a framework introduced to enable agentic AI payments on crypto and fiat rails, illustrating how AI agents could move beyond internal use to handle real-world financial transactions.
Key takeaways
- Coinbase is testing AI agents to support internal work processes, with a Slack and email workflow integration as the initial environment.
- The two agents are named Fred and Balaji, each designed with distinct roles reflecting Coinbase’s culture and governance needs.
- Fred serves as a strategic executive agent, while Balaji acts as an “agent of chaos and creativity” to challenge assumptions and spark innovation.
- The initiative aligns with Coinbase’s broader AI strategy, including a push toward an AI-native workforce and the x402 agentic AI payments protocol.
Coinbase’s AI agents: Fred and Balaji
Armstrong introduced the two agents with a nod to Coinbase’s history. Fred, named after co-founder Fred Ehrsam, is envisioned as the company’s strategic executive agent. In practice, Fred is meant to help teams maintain strategic clarity and align priorities, offering executive-level feedback that can guide high-impact decisions. Balaji, modeled after former Coinbase chief technology officer Balaji Srinivasan, is described as the “agent of chaos and creativity.” The intent behind Balaji is to push employees to rethink assumptions, explore unconventional approaches, and catalyze innovative thinking across projects.
The naming of the agents is not just symbolic. It signals Coinbase’s approach to embedding AI into leadership and ideation processes—using AI personas that mirror the company’s own leadership archetypes to guide how the agents prompt, critique, and shape workstreams. The experiment also reflects a broader trend of “agentic” AI, where digital assistants aren’t merely task bots but integral partners in strategic initiatives and experimentation.
From internal pilots to a payments rails ecosystem
Coinbase’s internal AI experiment sits alongside the firm’s ongoing broader AI strategy. In May 2025, Coinbase rolled out the x402 protocol to enable agentic AI payments on both crypto and fiat rails, a development that signals how AI-driven agents could eventually perform real-world financial transactions within a regulated framework. The x402 framework is positioned as a precursor to widespread use of AI agents for financial operations, potentially expanding the scope of automation from internal productivity to customer-facing and partner-facing payments processes.
Armstrong’s public remarks this year have underscored a belief that AI agents will increasingly transact online, with him suggesting that “more AI agents transacting online than humans very soon.” Those views echo similar forecasts from other tech leaders who see AI agents as a new class of actors in the digital economy. Earlier commentary from Circle CEO Jeremy Allaire has — at times — pointed toward billions of AI agents operating on-chain within a few years, highlighting the scale at which such agents could participate in financial ecosystems. While these predictions illustrate a powerful narrative about AI-enabled commerce, they also place Coinbase’s initiative within a wider debate about governance, reliability, and the regulatory considerations surrounding automated agents in finance.
Industry context remains nuanced. While industry leaders have celebrated the potential of AI agents to reduce friction and accelerate decision-making, they have also warned of the challenges involved in aligning AI behavior with corporate goals, maintaining security, and ensuring accountability when AI agents act on behalf of human teams. The emergence of agentic AI in crypto payments—still in its early stages—will likely attract close scrutiny from investors, regulators, and users alike as practical pilots mature and scale.
What to watch next for AI in crypto tooling
Investors and builders should monitor how Coinbase scales its internal AI agent program: whether traditional workflows see measurable productivity gains, how governance and oversight evolve as agents take on more complex tasks, and what new security and compliance controls emerge as agents interact with internal systems. The broader crypto industry will also be watching for how the x402 protocol evolves, and whether other exchanges or crypto companies adopt similar agent-based models for payments, settlement, and governance-related processes.
Beyond Coinbase, the momentum around AI agents in crypto payments raises questions about the mix of internal automation and external-facing capabilities. As major players debate the balance between automation and human oversight, the market will likely see a split between tasks that benefit most from AI-assisted decision-making and those requiring direct human input or regulatory compliance checks. For now, Coinbase’s two-armed experiment with Fred and Balaji signals both the ambition and the caution that define enterprise-grade AI in crypto—an approach that blends internal productivity gains with a longer-term bets on how AI agents could reshape the payments landscape.
Readers should watch for updates on the agents’ performance metrics, any expansion beyond internal Slack and email tasks, and how regulators respond to increasingly autonomous decision-making within crypto infrastructures. As Armstrong and his peers push the envelope on AI-native operations, the coming quarters will test whether the promised productivity gains translate into durable competitive advantages while preserving the trust and safeguards that define responsible crypto innovation.

Key Takeaways
- Following a two-day trading pause, ARK Invest executed significant portfolio adjustments on Friday
- The firm acquired 26,161 Netflix shares valued at approximately $2.5M following a nearly 10% post-earnings decline
- Circle holdings worth $1.21M were liquidated as the company faces legal challenges related to the Drift Protocol incident
- ARK divested $1.36M in Bullish shares while Bitcoin climbed past $76,000
- The firm invested roughly $11.96M in Alamar Biosciences during its Nasdaq debut
Cathie Wood’s ARK Invest resumed active trading Friday, April 17, 2026, following a 48-hour hiatus. The investment firm executed a notable strategic pivot: liquidating cryptocurrency-related equities while accumulating positions in established technology and biotechnology companies.
The firm purchased 26,161 Netflix shares representing approximately $2.5 million in capital. This move came immediately after Netflix disclosed its Q1 financial results, revealing revenue of $12.25 billion alongside profits reaching $5.28 billion — figures that surpassed analyst expectations.
Despite delivering impressive financial metrics, Netflix stock plummeted nearly 10% to settle at $97.31. The decline followed co-founder Reed Hastings’ announcement that he wouldn’t pursue board reelection, coupled with the company’s conservative revenue projections for the remainder of 2026.
ARK’s acquisition indicates confidence that the market overreacted to the news. Netflix continues expanding into live sports broadcasting and advertising initiatives, with revenue projections approaching $3 billion for the current year.
Cryptocurrency-Linked Stock Divestment
Regarding sales activity, ARK liquidated Circle shares totaling $1.21 million. Circle operates as the issuer of USDC, ranking among the most significant stablecoins by total market capitalization.
The company currently confronts a class-action legal proceeding stemming from the Drift Protocol security breach. Plaintiffs allege Circle neglected to freeze compromised assets during the incident, introducing considerable legal exposure for shareholders.
Additionally, ARK disposed of $1.36 million in Bullish stock, despite the shares appreciating approximately 5% that trading session amid declining Middle East tensions.
Bitcoin maintained levels above $76,999 Friday, experiencing temporary upward momentum following reports of the Strait of Hormuz reopening. Crude oil prices declined roughly 10% on this development.
The optimism proved fleeting. By Saturday evening, Iranian officials declared the Strait closed once more, citing a U.S. naval blockade. This reversal underscored persistent geopolitical volatility.
Biotech Investment on Debut Trading Day
ARK acquired 537,463 Alamar Biosciences shares for approximately $11.96 million during the company’s inaugural Nasdaq trading session.
Alamar experienced a remarkable 33% surge during its debut, achieving a market capitalization of $1.53 billion. This transaction demonstrates ARK’s ongoing commitment to emerging biotechnology ventures alongside established technology positions.
Combined cryptocurrency-related divestments totaled $2.57 million spanning Circle and Bullish. Both positions saw reductions despite the broader cryptocurrency market maintaining strength above critical price thresholds.
These transactions illustrate a calculated adjustment in ARK’s Friday holdings — transitioning capital from elevated-risk cryptocurrency exposures toward large-capitalization technology and biotechnology assets amid continued global uncertainty.
ARK’s simultaneous purchases of Netflix and Alamar Biosciences shares represents one of the firm’s most substantial single-session portfolio rebalancing events in recent trading periods.


The National Security Agency is utilizing Anthropic’s most sophisticated AI model, Mythos Preview, despite the Department of Defense labeling the startup a “supply chain risk.”
Summary
- The National Security Agency has secured access to Anthropic’s most advanced AI model despite official Pentagon warnings that the company poses a supply chain risk.
- The Pentagon is currently arguing in court that Anthropic’s tools threaten national security while it simultaneously expands the use of those same tools across military departments.
Two sources told Axios that the NSA has secured access to the high-powered model, which Anthropic has kept under tight wraps due to its potent offensive cyber capabilities.
While the Pentagon officially moved to sever ties with the company in February—even directing its vendors to do the same—internal demand for the technology appears to be overriding that directive.
This friction has led to a legal standoff where military officials are arguing in court that Anthropic’s tools threaten national security, while simultaneously expanding their use of those same tools across various departments.
The standoff over “all lawful purposes”
Renegotiations between the two parties soured earlier this year when the Pentagon demanded the company make its Claude model available for “all lawful purposes.”
Anthropic leadership pushed back, insisting on specific prohibitions against mass domestic surveillance and the development of autonomous weaponry. As a result of this, some Defense officials claimed the company cannot be trusted in critical military scenarios, a characterization Anthropic has denied.
The government’s interest in the model stems largely from its specialized utility. Most of the 40 organizations granted access to Mythos Preview use the tool to scan their own digital environments for exploitable vulnerabilities.
While Anthropic has publicly named only 12 of these partners, including the U.K.’s AI Security Institute, the NSA is reportedly among the undisclosed group of agencies.
Recent efforts to resolve the impasse have moved beyond the Pentagon’s halls. Anthropic CEO Dario Amodei met on Friday with White House Chief of Staff Susie Wiles and Treasury Secretary Scott Bessent to discuss how Mythos could be integrated across other government sectors.
Sources described the meeting as productive, indicating that the administration may look for ways to bypass the Pentagon feud to ensure other departments can utilize the cutting-edge technology.

The Strait of Hormuz is back under Iranian control, Trump is threatening to level Iran’s power grid, and somehow BTC is still standing where altcoins would already be bleeding out. Something in the structure of this market has changed, but the Bitcoin price prediction is still bullish.
The weekend’s flare-up hit hard across traditional assets. Brent crude surged to $88, European natural gas futures spiked as much as 11%, and S&P 500 futures dropped 0.6% after Friday’s record close. Bitcoin’s 0.5% pullback looked almost serene by comparison.
— Jesse Cohen (@JesseCohenInv) April 19, 2026
 Futures are down big after this weekend’s Iran developments.
Dow Futures are down 500 points. pic.twitter.com/ZNDPeEb2Wv
This is now the fourth major Iran-related escalation since the conflict began on February 28, and the pattern is consistent. Each successive crypto sell-off is shallower than the last. Bank of England Deputy Governor Sarah Breeden warned April 18 that the war “heightens combined market stress risks,” yet BTC held above $70,000 throughout.
Discover: The best crypto to diversify your portfolio with
Bitcoin Price Prediction: $80K Still The Target
Bitcoin hit its 2026 low of $63,000 on February before bouncing to $78,000 on the ceasefire talk last week, liquidating $200 million in shorts in the process. The current $74K level sits in the middle of a well-defined five-week range between $73,000 and $78,000.
RSI showed a slightly oversold rebound after the April 1 wick; Chaikin Money Flow data points to active dip-buying despite elevated volatility, the same pattern as Bitcoin’s post-Ukraine invasion consolidation in 2022, with EMA 100 and 200 closing in for a golden cross.
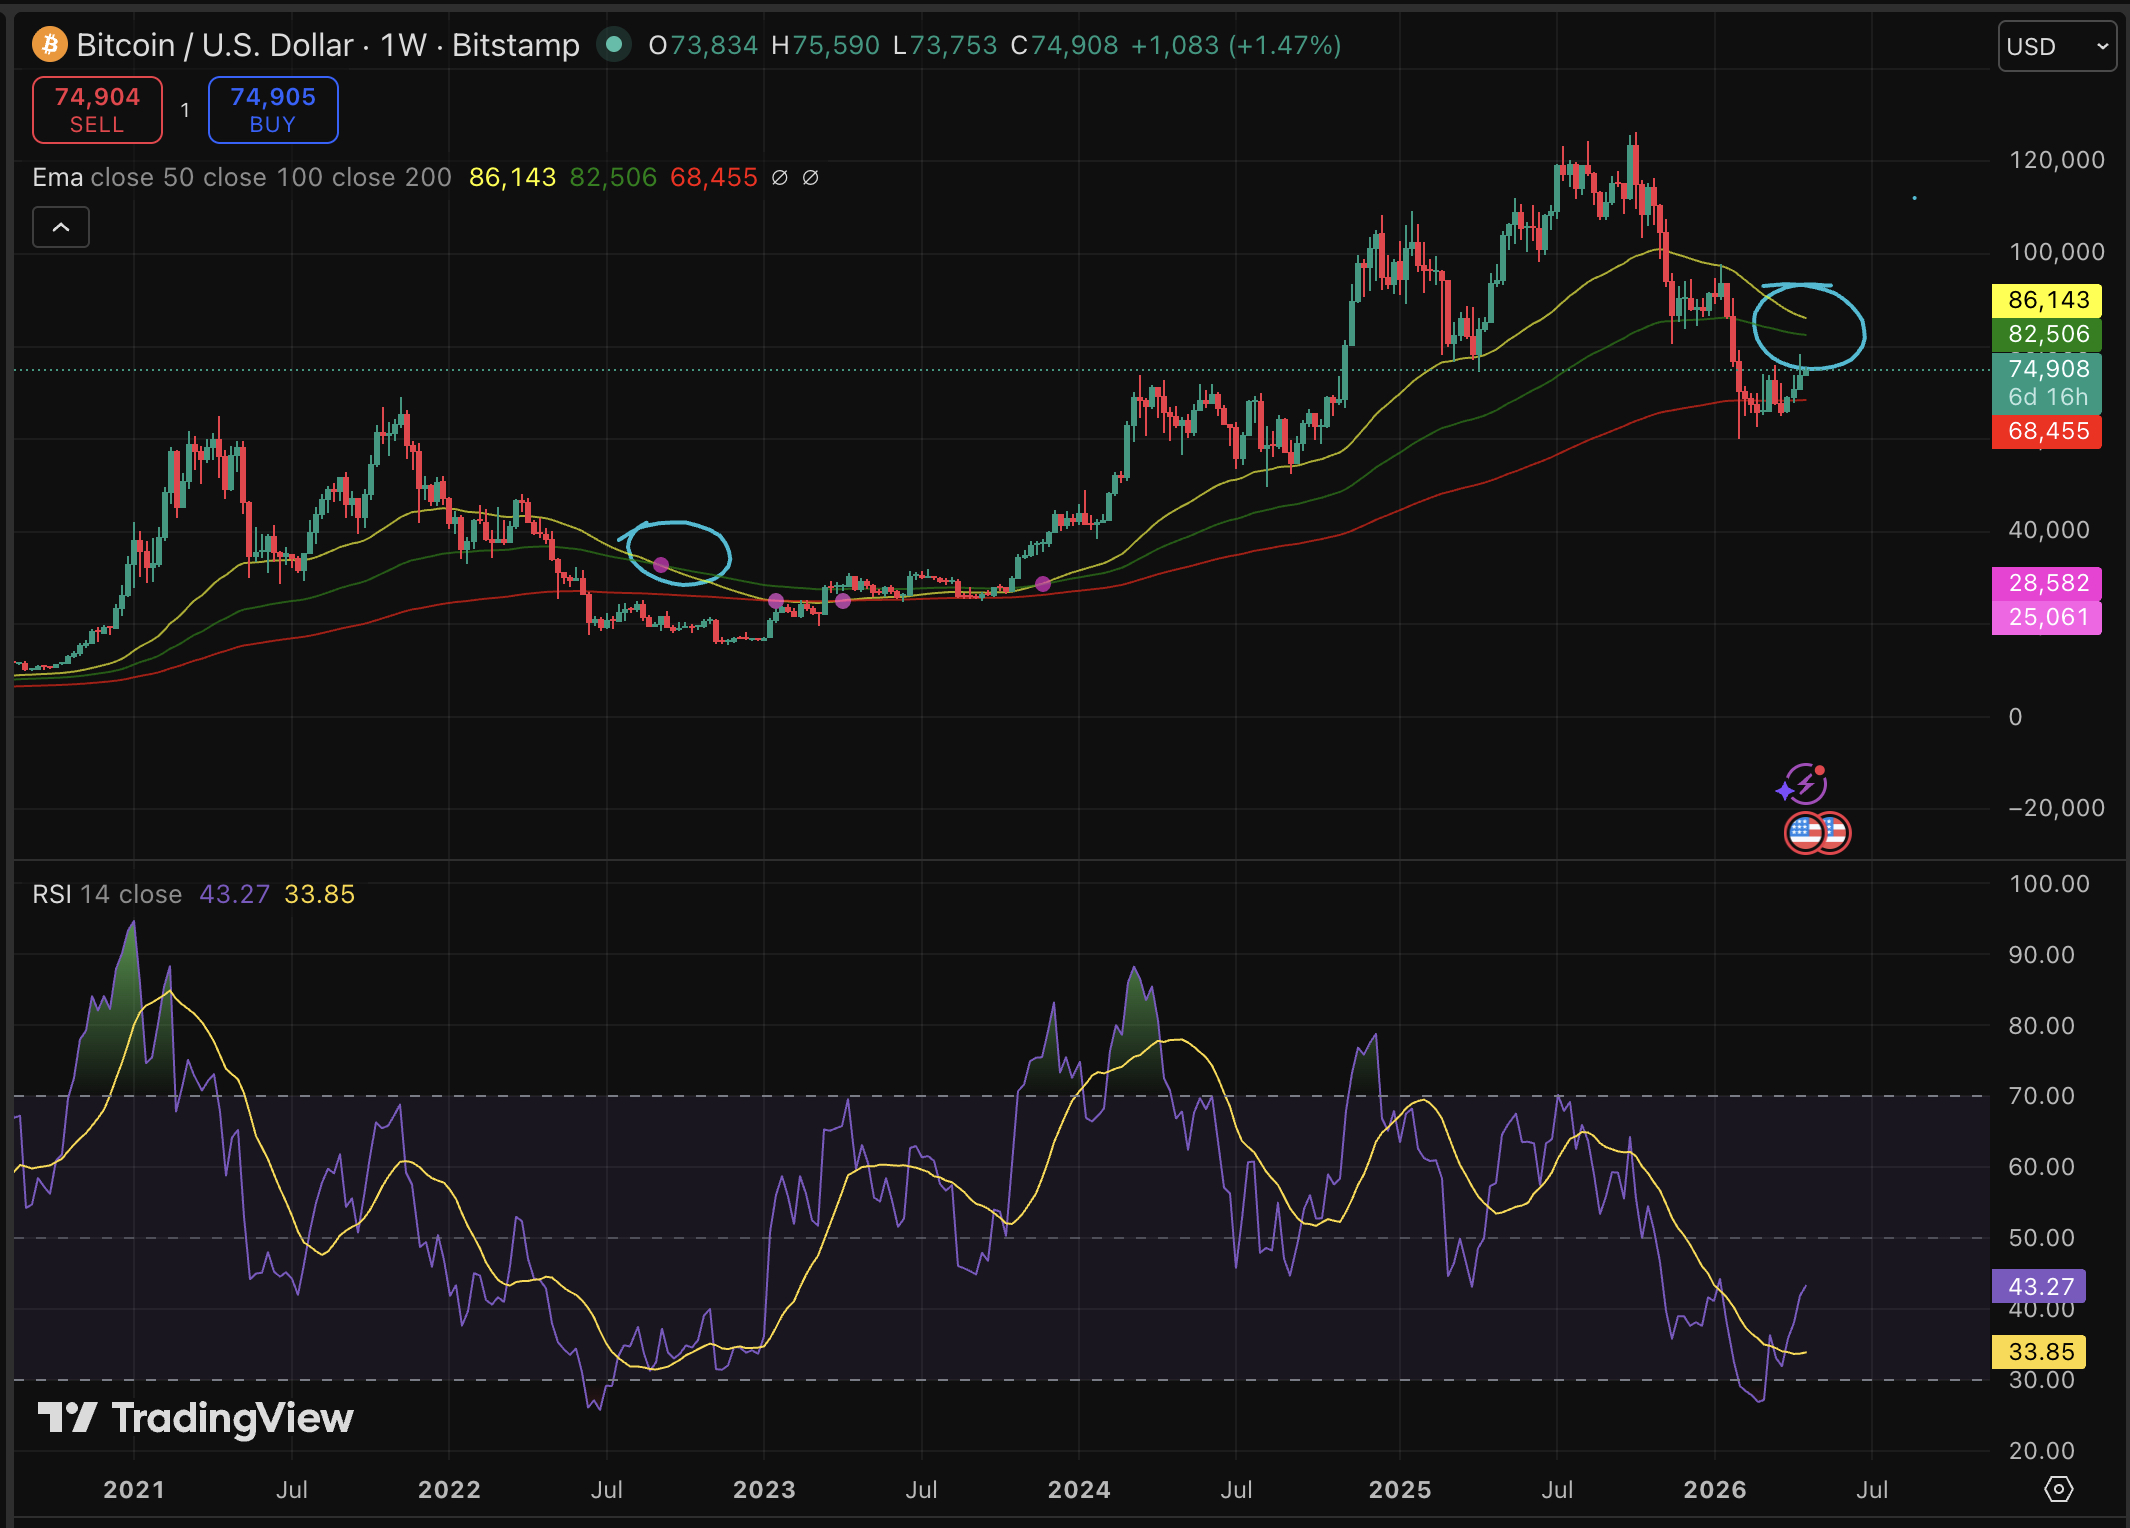
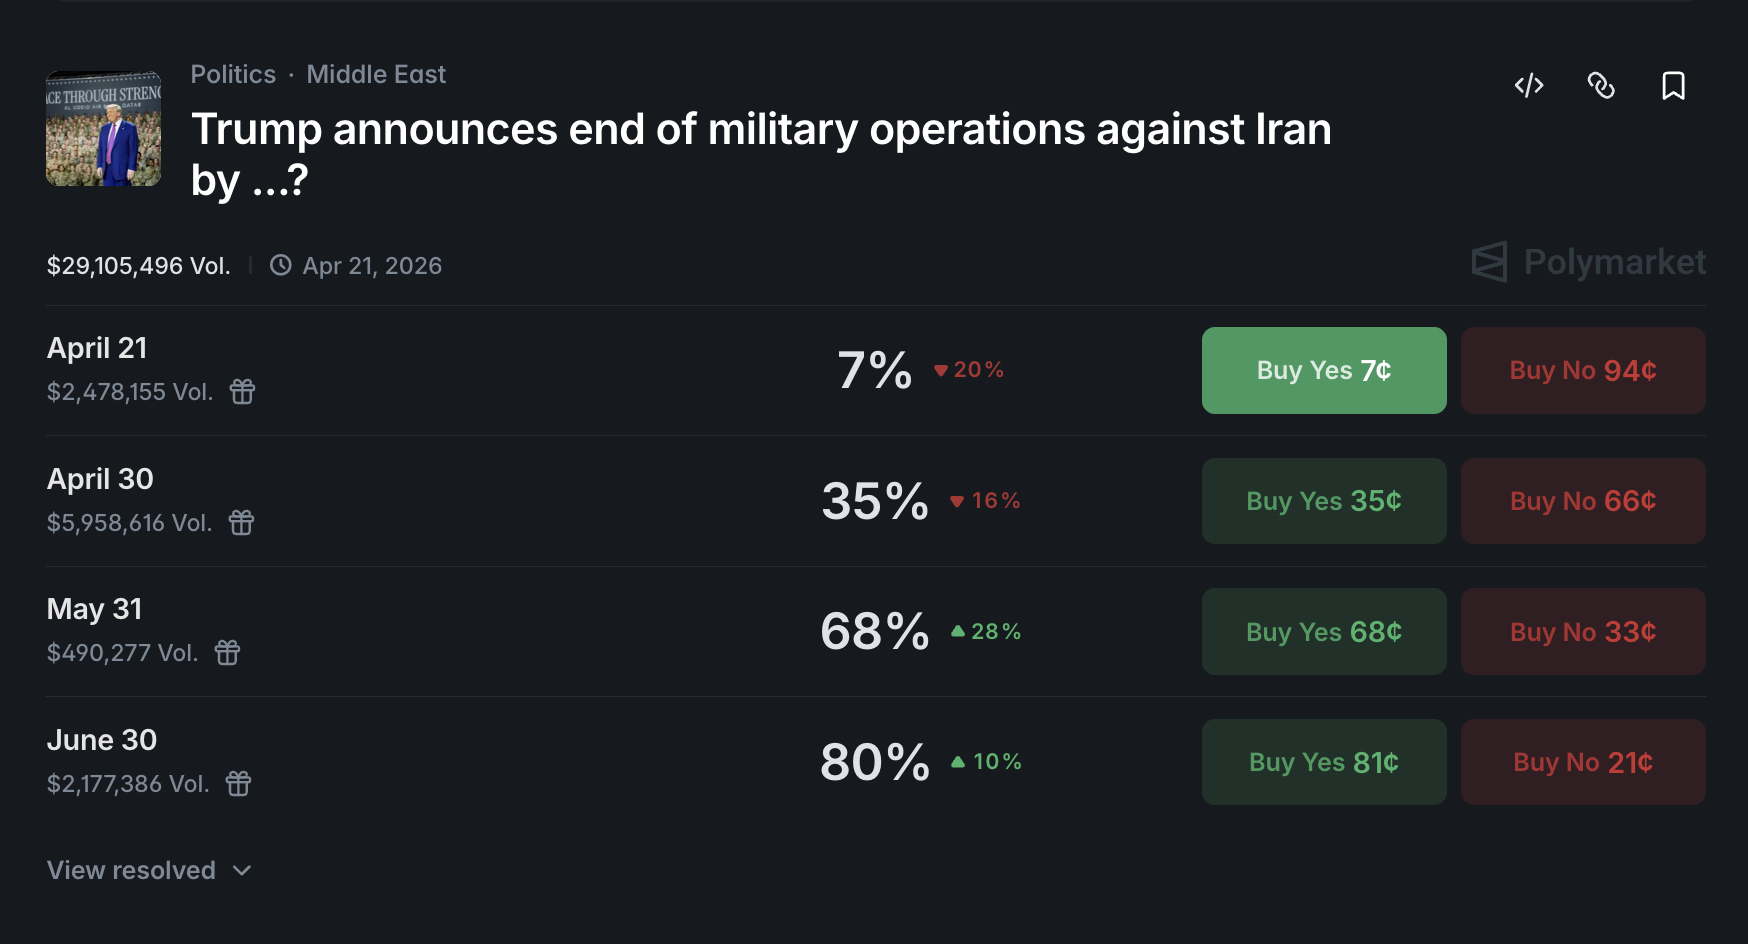
Key support sits higher, after the jump last week, at $73,000. Resistance is clustered at $76,000–$78,000. Polymarket currently prices an 80%+ probability of a deal by the end of June, which sets up a good scenario. Ceasefire confirmed, Strait reopens, then BTC breaks $78,000, targets $80,000–$94,000 range within weeks.
Bernstein maintains a $150,000 year-end 2026 target in a call backed, in part, by MicroStrategy’s purchase of 4,871 BTC ($329.9 million) between April 1–5, right into the conflict’s worst week.
Long-term holders are buying the fear. That doesn’t guarantee a near-term breakout, but it sets a credible demand floor.
Discover: The best pre-launch token sales
Bitcoin Hyper Bullish as BTC Grinds Through War-Risk Consolidation
Bitcoin above $74,000 sounds bullish until you map the resistance. $76,000 is a ceiling that’s been rejected twice already, and a full move to Bernstein’s $150,000 target implies months of sustained catalyst flows like a ceasefire, ETF inflows, and macro easing, all arriving in sequence.
There are a lot of dominoes to be pushed. Those looking for asymmetric upside without waiting for BTC to clear four layers of resistance are increasingly looking at the infrastructure layer being built on top of Bitcoin itself.
Bitcoin Hyper ($HYPER) is positioned at that intersection. It’s built as the first-ever Bitcoin Layer 2 with full Solana Virtual Machine (SVM) integration, bringing sub-second smart contract execution to the Bitcoin ecosystem without sacrificing Bitcoin’s base-layer security.
The pitch is direct: fix Bitcoin’s core limitations of slow transactions, high fees, and zero programmability, while preserving the trust that makes BTC worth building on. The presale has raised $32 million at a current price of $0.0136, with 36% APY staking available.
Hyper offers a real capital stack at a seed-stage price. Dig into the mechanics, because the raised size suggests this isn’t flying under the radar.
The post Bitcoin Price Prediction: Iran War Goes On, Crypto Can’t Catch A Break appeared first on Cryptonews.


Gold, silver, and platinum prices declined on Monday as escalating tensions between the United States and Iran weighed on precious metals markets.
The US Navy fired on and seized an Iranian cargo ship in the Gulf of Oman, reviving concerns before the US-Iran ceasefire expires this week.
Gold, Silver, and Platinum Record Losses as Geopolitical Tensions Escalate
Precious metals have started to unwind last week’s rally. Silver had climbed more than 6% Friday to over $83 on hopes of de-escalation. Iran also temporarily reopened the Strait of Hormuz for commercial vessels.
However, that move reversed once shipping stalled again. Today, the silver price fell 1.07% to $79.89, per Trading Economics data. Platinum led the sell-off with a 2.22% drop to $2,094.20. Gold slid 0.85% to $4,792.48.
Copper retreated 0.80% to $6.0544, coming off its highest close since early February. Zinc and lead also declined.
Follow us on X to get the latest news as it happens
On the other hand, industrial and battery metals held up better than precious metals. Lithium gained 1.77%, while iron ore and steel nudged higher.
Brent jumped as much as 7.9%, and WTI climbed over 7% toward $90, reviving inflation concerns that trim Fed rate-cut expectations and weigh on non-yielding metals.
The crypto market was also part of the broader sell-off. BeInCrypto Markets data showed that the total market capitalization declined 1.15% over the past 24 hours. Bitcoin (BTC) dropped below $74,000 in early Asian trading hours today before settling at $74,190 by press time.
All attention now shifts to Wednesday’s ceasefire deadline and a possible new round of negotiations. Trump said US negotiators would fly to Islamabad on Monday.
Iranian state broadcaster IRIB said Tehran had no plans to join the next round, citing unnamed Iranian sources.
“There are currently no plans to participate in the next round of Iran-US talks.”
However, Al Jazeera reported that Iranian officials would “most probably” attend, citing preparations already underway in Islamabad. Further losses in precious metals hinge on whether either side returns to the table and on the outcome.
Subscribe to our YouTube channel to watch leaders and journalists provide expert insights
The post Precious Metals Fall as US-Iran Conflict Escalates Ahead of Ceasefire Deadline appeared first on BeInCrypto.


- RaveDAO token plunged 95% from $26 to under $1.
- RAVE launched in December 2025 on Binance Alpha.
- ZachXBT’s on-chain analysis also highlights MemeCore, River and MYX among questionable projects.
RaveDAO (RAVE) has plunged below $1, erasing more than 95% of its earlier rally to an all-time high of $26.
The sharp decline follows an investigation by blockchain analyst ZachXBT, which alleged clear signs of price manipulation.
The findings have raised broader concerns about potential insider-driven schemes affecting multiple tokens listed on centralised exchanges, contributing to selling pressure across the segment.
RaveDAO token dumps amid ZachXBT’s explosive allegations
ZachXBT, a pseudonymous investigator celebrated for dismantling multimillion-dollar crypto frauds, took to X on April 18, 2026, to dissect RAVE’s suspicious trajectory.
He pinpointed concentrated wallet activity controlling the token’s liquidity, engineering artificial pumps to trap retail buyers before orchestrated dumps.
“RAVE launched in Dec 2025 on Binance Alpha with a 1B total supply. The addresses below, linked to the initial distribution, control ~95% of the RAVE supply,” the on-chain sleuth posted.
Labelling it a textbook “pump-and-dump,” ZachXBT offered a $25,000 bounty for transaction proofs, urging platforms like Binance, Bitget, and Gate.io to launch probes.
He notes that the exchanges acknowledged his call, a move that could mirror past successes in securing refunds and bans.
Yet ZachXBT questioned why CEXs have waited for his call to acknowledge potential manipulation.
“While it’s good the exchanges responded, I find it unlikely this activity wasn’t spotted internally before I raised it publicly.”
RAVE’s price carnage unfolded mercilessly, plummeting from $26 to under $1 within 24 hours, with trading volume surging amid mass liquidations.
Billions of dollars in market cap vaporised, leaving holders stunned. The declines saw the token’s value drop to lows of $0.50, where it hovered as of writing on April 20, 2026.
Update: Three hours ago multisig 0x53d7 linked to the RAVE initial distribution which I flagged above sent ~23M RAVE ($23M) to two Bitget deposit addresses and the price dropped 40% from $1 to $0.6.
Deposit addresses
0x26aC542f5a04D574580881723224DAcD1EDB9B45… pic.twitter.com/Qi1asiFWsB— ZachXBT (@zachxbt) April 19, 2026
ZachXBT also hits other tokens
The potential price manipulation extends to similar tokens.
“RAVE is not the only token with manipulation we have seen on major centralized exchanges,” he posted.
“It’s just the most blatant, reaching a top 15 market cap within 10 days before dropping 95% in hours. Other projects with highly questionable price action recently include: SIREN, MYX, COAI, M, PIPPIN, RIVER.”
According to ZachXBT, all projects have exhibited “highly questionable price action” and supply dominance by the team.
MemeCore, RIVER and PIPPIN prices echoed the Rave token bleed, dumping double digits to erase recent gains.
Some retail traders commented on ZachXBT’s post, noting this could be an opportunity to short. His response:
I do not recommend shorting manipulated tokens with a high insider concentration.
— ZachXBT (@zachxbt) April 20, 2026
Data on CoinMarketCap showed M, River and Siren were down 7-9% in the past 24 hours as of writing.


Bitcoin price briefly fell below $74,000 on Monday as fading prospects of U.S. Iran peace talks and escalating tensions in the Strait of Hormuz weighed on sentiment.
Summary
- Bitcoin briefly dropped below $74,000 as Iran ruled out U.S. peace talks and tensions escalated in the Strait of Hormuz.
- Iran retaliated to a U.S. ship seizure with drone and missile strikes, while conflicting signals over negotiations kept markets on edge.
- Oil prices surged, with WTI nearing $90 and Brent above $95, as renewed conflict raised fears of supply disruptions and broader market volatility.
According to reports, Iranian sources recently said that Iran will not show up for the peace negotiations with the U.S. that were set to be held in Islamabad today. This comes after the nation promised to retaliate against the U.S. for intercepting and seizing one of its cargo ships in the Strait of Hormuz.
The heightened volatility in the surrounding Gulf region after the war began had left markets on edge, with economists expressing concerns of a global recession if supply lines remained blocked.
Shortly following the U.S. intervention on the ship, Iran responded with its own offensive strategy, attacking U.S. military ships with drones and ballistic missiles.
The tensions between the two nations flared up earlier in the weekend. On Friday, Iran reopened the Strait of Hormuz amid its stated commitment to de-escalate. However, Tehran decided to close it again just hours later as the U.S. continued to maintain the naval blockade.
While the U.S. later announced that both parties would attend peace negotiations on Monday, Iran has refuted these claims entirely. Earlier, Iran had also dismissed Trump’s suggestion that it would give up on its uranium enrichment plan as part of any future deal.
Crude oil price, which fell earlier due to expectations of peace discussions between the nations and reopening of the strait, surged significantly following the recent breakdown in communication. Notably, West Texas Intermediate crude oil rose 6.7% to nearly $90 while Brent crude rose 6% to above $95 again.
Since crypto markets operate around the clock, they reacted immediately to the latest geopolitical developments over the weekend, with prices largely trending lower.
Bitcoin (BTC) had rallied to $78,400 on Friday, but the move was swiftly rejected, with the price slipping below $74,000 as hostilities resumed. At press time, the bellwether asset was trading just under the $75,000 level.
Further price swings may lie ahead as the ceasefire deadline passes without any clear extension. Overnight attacks have added to the uncertainty, while the absence of any concrete peace negotiations continues to weigh on market sentiment. Traders are now bracing for continued volatility as geopolitical risks remain elevated.
As such, if Bitcoin sharply falls below $74,000 again, it could slide further to $72,000, which acts as a major support level. Failure below the $72,000 mark might invite a broader selloff toward the $68,000 zone. On the other hand, if Bitcoin stabilizes over $76,000, it could embolden bulls to target a return to the $80,000 psychological threshold.
Disclosure: This article does not represent investment advice. The content and materials featured on this page are for educational purposes only.

Key Points
- The Chinese technology firm Huawei has entered a strategic partnership with Vietnam’s SHB bank this past weekend
- The collaboration encompasses technology infrastructure design and comprehensive data platform construction
- Security and operational stability for banking systems form core components of the agreement
- This partnership joins existing Huawei collaborations with SCB, SeABank, and Home Credit across Vietnam
- Huawei secured major contracts in 2024 for Vietnam’s 5G infrastructure development
The Chinese technology conglomerate Huawei Technologies Group has formalized a strategic partnership with SHB, a prominent Vietnamese banking institution, signaling the company’s accelerating expansion throughout Vietnam’s financial landscape.
SHB publicly disclosed the partnership on Sunday. According to the arrangement, Huawei will provide expertise in crafting the bank’s technological framework and establishing robust data infrastructure. The agreement additionally ensures that SHB’s operational systems maintain consistent reliability and comprehensive security.
“The cooperation with SHB is an important milestone in the group’s market expansion in Vietnam,” said Spawn Fan, a senior Huawei executive, in the bank’s statement.
This isn’t Huawei’s inaugural venture into Vietnam’s banking industry. The technology powerhouse maintains established partnerships with multiple financial institutions including SCB, SeABank, and Home Credit, spanning initiatives in digital transformation, security protocols, data intelligence, cloud infrastructure, and banking platform optimization.
Strategic Expansion in Southeast Asia
The newly announced SHB collaboration strengthens Huawei’s increasingly substantial position within one of Southeast Asia’s most dynamic and rapidly expanding markets. Vietnamese financial institutions have aggressively prioritized digital infrastructure modernization, creating opportunities that Huawei has strategically pursued.
Huawei’s expanding influence in Vietnam represents a significant shift from previous policy positions. Until quite recently, Vietnamese authorities maintained strict restrictions preventing Chinese corporations from participating in the nation’s 5G telecommunications infrastructure.
This policy underwent a dramatic reversal in 2024 when Huawei successfully secured multiple contracts to develop significant portions of Vietnam’s 5G network. The current SHB partnership reflects a continuation of this evolving relationship — demonstrating strengthening connections between Vietnamese organizations and Huawei spanning both telecommunications and financial technology sectors.
Partnership Scope and Implementation
SHB ranks among Vietnam’s most significant privately-owned commercial banking institutions. The comprehensive partnership with Huawei encompasses multiple critical domains: architectural design for technology infrastructure, comprehensive data platform construction, and continuous operational assistance ensuring system stability and security.
These initiatives represent substantial commitments. Constructing data platforms and architectural frameworks for commercial banking operations requires extensive integration with fundamental banking technology systems.
According to statements from the Vietnam Banks Association, Huawei’s activities throughout Vietnam’s financial industry concentrate on digital transformation initiatives, cybersecurity enhancement, advanced data analytics, cloud computing solutions, and banking operational efficiency — capabilities that align directly with the SHB partnership framework.
The 5G infrastructure contracts Huawei won in 2024 marked a fundamental policy transformation from Vietnamese government authorities. This strategic pivot created pathways for expanded collaboration, with the SHB agreement representing one of the most substantial manifestations of this revised approach.
Spawn Fan, the Huawei representative referenced in SHB’s official announcement, characterized the partnership as a significant achievement — not solely for SHB’s technological advancement, but for Huawei’s comprehensive Vietnam market strategy.
The Vietnam Banks Association has verified that Huawei’s current financial sector engagements include SCB, SeABank, and Home Credit, with the SHB partnership now expanding that portfolio.

Strategy co-founder Michael Saylor has stoked expectations of another large Bitcoin purchase just days after Strategy disclosed a roughly $1 billion buy in mid-April. The company revealed that between April 6 and 12 it acquired 13,927 BTC for about $1 billion, at an average price of $71,902 per coin. In a sign that Saylor may be signaling more activity, he posted on X with the message Think Even ₿igger, accompanied by a chart of Strategy’s purchase history—a pattern he has used in the past to hint at forthcoming buys, according to coverage of the episode.
In the same period, Strategy’s leadership publicly discussed a broader capital management move: paying its dividend more frequently, with a plan to double the cadence to semi-monthly payments. The intention, said Strategy CEO Phong Le, is to stabilize the STRC price, dampen cyclicality, improve liquidity, and expand demand for the stock. The stance comes as Strategy has prepared a preliminary proxy filing with the U.S. Securities and Exchange Commission; the definitive proxy is expected on April 28, with shareholder voting running through June 8 and potential implementation slated for mid-July if approved.
Key takeaways
- Strategy hints at another Bitcoin purchase after disclosing a $1 billion acquisition of 13,927 BTC in early April, with Saylor signaling via a post comparing Strategy’s past buys.
- The company is proposing to shift STRC dividend payments to a semi-monthly schedule (twice a month, on the 15th and month-end), aiming for 24 payments a year at an 11.5% yield.
- The move to semi-monthly dividends is framed as a way to stabilize price and liquidity, with Strategy describing it as a unique approach among preferred equities.
- Strategy holds the largest Bitcoin treasury among publicly traded companies, with 780,897 BTC worth about $58.2 billion, according to Bitbo data, and it has a habit of recurring weekly purchases.
- Despite the Bitcoin buys, the company reports significant unrealized losses on digital assets, totaling about $14.46 billion in its first-quarter results.
Strategy’s latest Bitcoin move and the social signal
The disclosed purchase of 13,927 BTC for roughly $1 billion occurred over a one-week window in April, at an average price near $71,902 per coin. The social signal accompanying the filing—Saylor’s “Think Even ₿igger” post with a chart of Strategy’s purchase history—has historically coincided with additional buying or hints of future transactions, a pattern analysts monitor as a potential short-term predictor of capital deployment. The development sits within a broader narrative of corporate Bitcoin treasury management where large hodlers weigh ongoing accretion against volatility and capital allocation priorities.
Dividend plan to stabilize price and liquidity
Le framed the dividend proposal as a mechanism to reduce price volatility and encourage steady demand for STRC. If approved, Strategy would pay semi-monthly dividends on the 15th and the last day of each month, totaling 24 payments per year at the current rate of 11.5%. Le noted that this cadence would position STRC as a highly distinctive instrument in the market, and the company has worked through multiple iterations to reach a viable schedule that accommodates NASDAQ’s rules on record and payment dates. Nasdaq-listed STRC would still need to comply with minimum gaps between record and payment dates—an issue the company acknowledged as an operational constraint.
The plan was detailed in an investor presentation linked to the proxy materials, with the preliminary filing submitted to the SEC and a definitive filing expected by April 28. If shareholders approve the proposal, the new semi-monthly schedule would take effect mid-July, subject to the usual regulatory and procedural approvals.
BTC treasury size, market backdrop, and investor reaction
Strategy’s balance sheet remains anchored in Bitcoin, with the company holding 780,897 BTC, the largest stash among publicly traded firms. Bitbo’s data places Strategy’s BTC holdings at approximately $58.2 billion in value, underscoring the scale of its treasury position. The stock market reaction to the ongoing program has been nuanced: Strategy’s shares (MSTR) rose by about 11.8% on a recent session to around $166.50, though they remain down roughly 47% over the past year. The dynamic underscores a complex investor calculus: large-scale BTC exposure paired with sensitive equity pricing and the potential impact of dividend policy changes.
On the accounting side, Strategy reported substantial unrealized losses on its digital asset holdings for the first quarter, tallying about $14.46 billion. The disclosures reflect the market’s swing in BTC prices and the accounting treatment for crypto holdings at scale, contributing to a broader conversation about risk management and liquidity needs for corporate treasuries tied to digital assets.
What to watch next
Investors will be keeping a close eye on the proxy process and whether the semi-monthly dividend plan gains shareholder approval. The timing of the next BTC purchase remains uncertain, but the social signaling by Saylor adds an element of anticipation around Strategy’s treasury strategy. As regulators and markets continue to refine frameworks for corporate crypto holdings and investor protections, Strategy’s moves could serve as a barometer for how publicly traded companies balance growth, income, and risk in a volatile asset class.
Sources and context for these developments were reported in coverage detailing Strategy’s recent Bitcoin purchases, the proposed dividend schedule, and the company’s regulatory filings. For reference, strategic data on Strategy’s Bitcoin holdings is tracked by market trackers such as Bitbo, and the proxy filing timeline aligns with the SEC’s typical review and voting windows.
Evercore ISI reiterates IBM stock rating on Q1 beat expectations

A $300 million borrowing spike on Aave signals liquidity crunch after exploit

The Best ‘Doctor Who’ Spin-Off Proves It’s Still a Masterpiece From Start to Finish After 20 Years


-

 Crypto World7 days ago
The SEC Conditionalises DeFi Platforms to Be Avoided for Broker Registration
-

 NewsBeat6 days ago
Trump and Pope Leo: Behind their disagreement over Iran war
-

 Fashion3 days ago
Weekend Open Thread: Theodora Dress
-

 Crypto World6 days ago
SEC Signals Exemption for Crypto Interfaces From Broker Registration
-

 News Videos5 days ago
Secure crypto trading starts with an FIU-registered
-

 Sports3 days ago
NWFL Suspends Two Players Over Post-Match Clash in Ado-Ekiti
-

 Crypto World6 days ago
SEC Proposes Certain Crypto Interfaces Don’t Need to Register as Brokers
-

 Business19 hours ago
Powerball Result April 18, 2026: No Jackpot Winner in Powerball Draw: $75 Million Rolls Over
-

 Crypto World2 days ago
Russia Pushes Bill to Criminalize Unregistered Crypto Services
-

 Politics3 days ago
Palestine barred from entering Canada for FIFA Congress
-

 Sports7 days ago
NWFL opens Pathway for new Clubs ahead of 2026 Season
-
 Business4 days ago
Creo Medical agree sale of its manufacturing operation
-

 Politics24 hours ago
Zack Polanski demands ‘council homes not luxury flats for foreign investors’
-
 Entertainment6 days ago
Brand New Day’ Footage Reveals the Devastating Impact of ‘Now Way Home’
-

 Tech5 days ago
Microsoft adds Windows protections for malicious Remote Desktop files
-
 Entertainment6 days ago
Karol G’s ‘Ultra Raunchy’ Coachella Set Gave ‘Satanic Vibes’
-

 Sports7 days ago
Aaron Judge says Yankees need to ‘simplify’ approach amid offensive slump
-
 Entertainment7 days ago
Pete Davidson Reveals ‘Brutal’ Mom Moment That Got Him Sober
-

 Entertainment6 days ago
How Babylon 5 Turned Brief Side Story Into Emotional Masterpiece
-

 Tech6 days ago
What was the first ransomware attack to demand payment in Bitcoin?
You must be logged in to post a comment Login