
Crypto World
Petroyuan Rises as Physical Oil, Yuan Settlements, and Rare Earth Markets Decouple From Dollar Systems

TLDR:
- Dated Brent physical oil trades at $141 while futures sit at $107, marking the widest gap recorded since the 2008 financial crisis.
- Twenty-six ghost fleet tankers settled yuan-based oil trades through CIPS, which hit 928 billion renminbi in daily volume by March 9.
- China controls 95 percent of heavy rare earth processing, and its 2025 export bans have already disrupted auto production lines in the US and Europe.
- The MAG7 lost $1.1 trillion in market cap since the conflict began, as physical supply constraints continue pressing paper-based equity valuations lower.
The petroyuan is gaining momentum as four key global markets send converging signals. Physical oil, equity valuations, yuan settlements, and rare earth supply chains are all drifting away from dollar-based systems.
China appears positioned on the favorable side of each shift. The gap between physical and paper oil markets has not been this wide since 2008, drawing growing attention from analysts tracking commodity and currency flows worldwide.
Physical Oil and Equity Markets Break From Paper Valuations
Physical oil prices have separated sharply from futures markets in recent weeks. Dated Brent is now trading at $141, while futures remain at $107, a $34 gap. Dubai physical hit $140, and Oman physical reached $166. That spread is the widest since 2008.
Equity markets, however, continue to price in a temporary disruption. The MAG7 has lost $1.1 trillion in market capitalization since the conflict began.
Microsoft is 32 percent off its peak, and the S&P technology sector is down 8 percent since February 28. Energy stocks are up 6.6 percent over the same period.
Market analyst Shanaka Anslem Perera wrote on social media that “the paper market prices a resolution. The physical market prices the molecules that are not there.”
That observation reflects a widening divide between financial pricing and real-world supply conditions. Force majeures have spread across ten countries, with zero restarts reported so far.
The longer the disruption continues, the more pressure builds on paper-based valuations. Analysts say the gap between physical delivery and financial claims may not close without actual supply restoration. The current trajectory points toward structural, not cyclical, dislocation.
Yuan Settlements and Rare Earth Controls Reshape Global Trade Flows
Yuan-based oil settlements are rising sharply through China’s CIPS payment system. Twenty-six ghost fleet tankers have left the Persian Gulf since February 28, settling trades in yuan.
CIPS daily volume surged to 928 billion renminbi by March 9. Iran is sending 1.22 million barrels per day to China entirely outside the dollar system.
The dollar still holds 58 percent of global reserves, but settlement flows are shifting. China is capturing the yuan volumes the ongoing conflict generates daily.
The IRGC is also moving to legislate this yuan-based oil architecture into permanent law. That adds a regulatory layer to what began as an informal arrangement.
China also controls 95 percent of heavy rare earth output and processing globally. Export bans introduced in 2025 have already shut automotive production lines across the US and Europe.
The $8.5 billion American diversification push remains years away from producing separated dysprosium at scale. No near-term substitute has emerged.
Deutsche Bank described the conflict as the making of the petroyuan. Analysts, though, say that framing is too narrow.
The war is revealing that the global financial architecture rests on paper claims converting reliably to physical delivery. The April 19 waiver expiry is the next key date markets are watching closely.


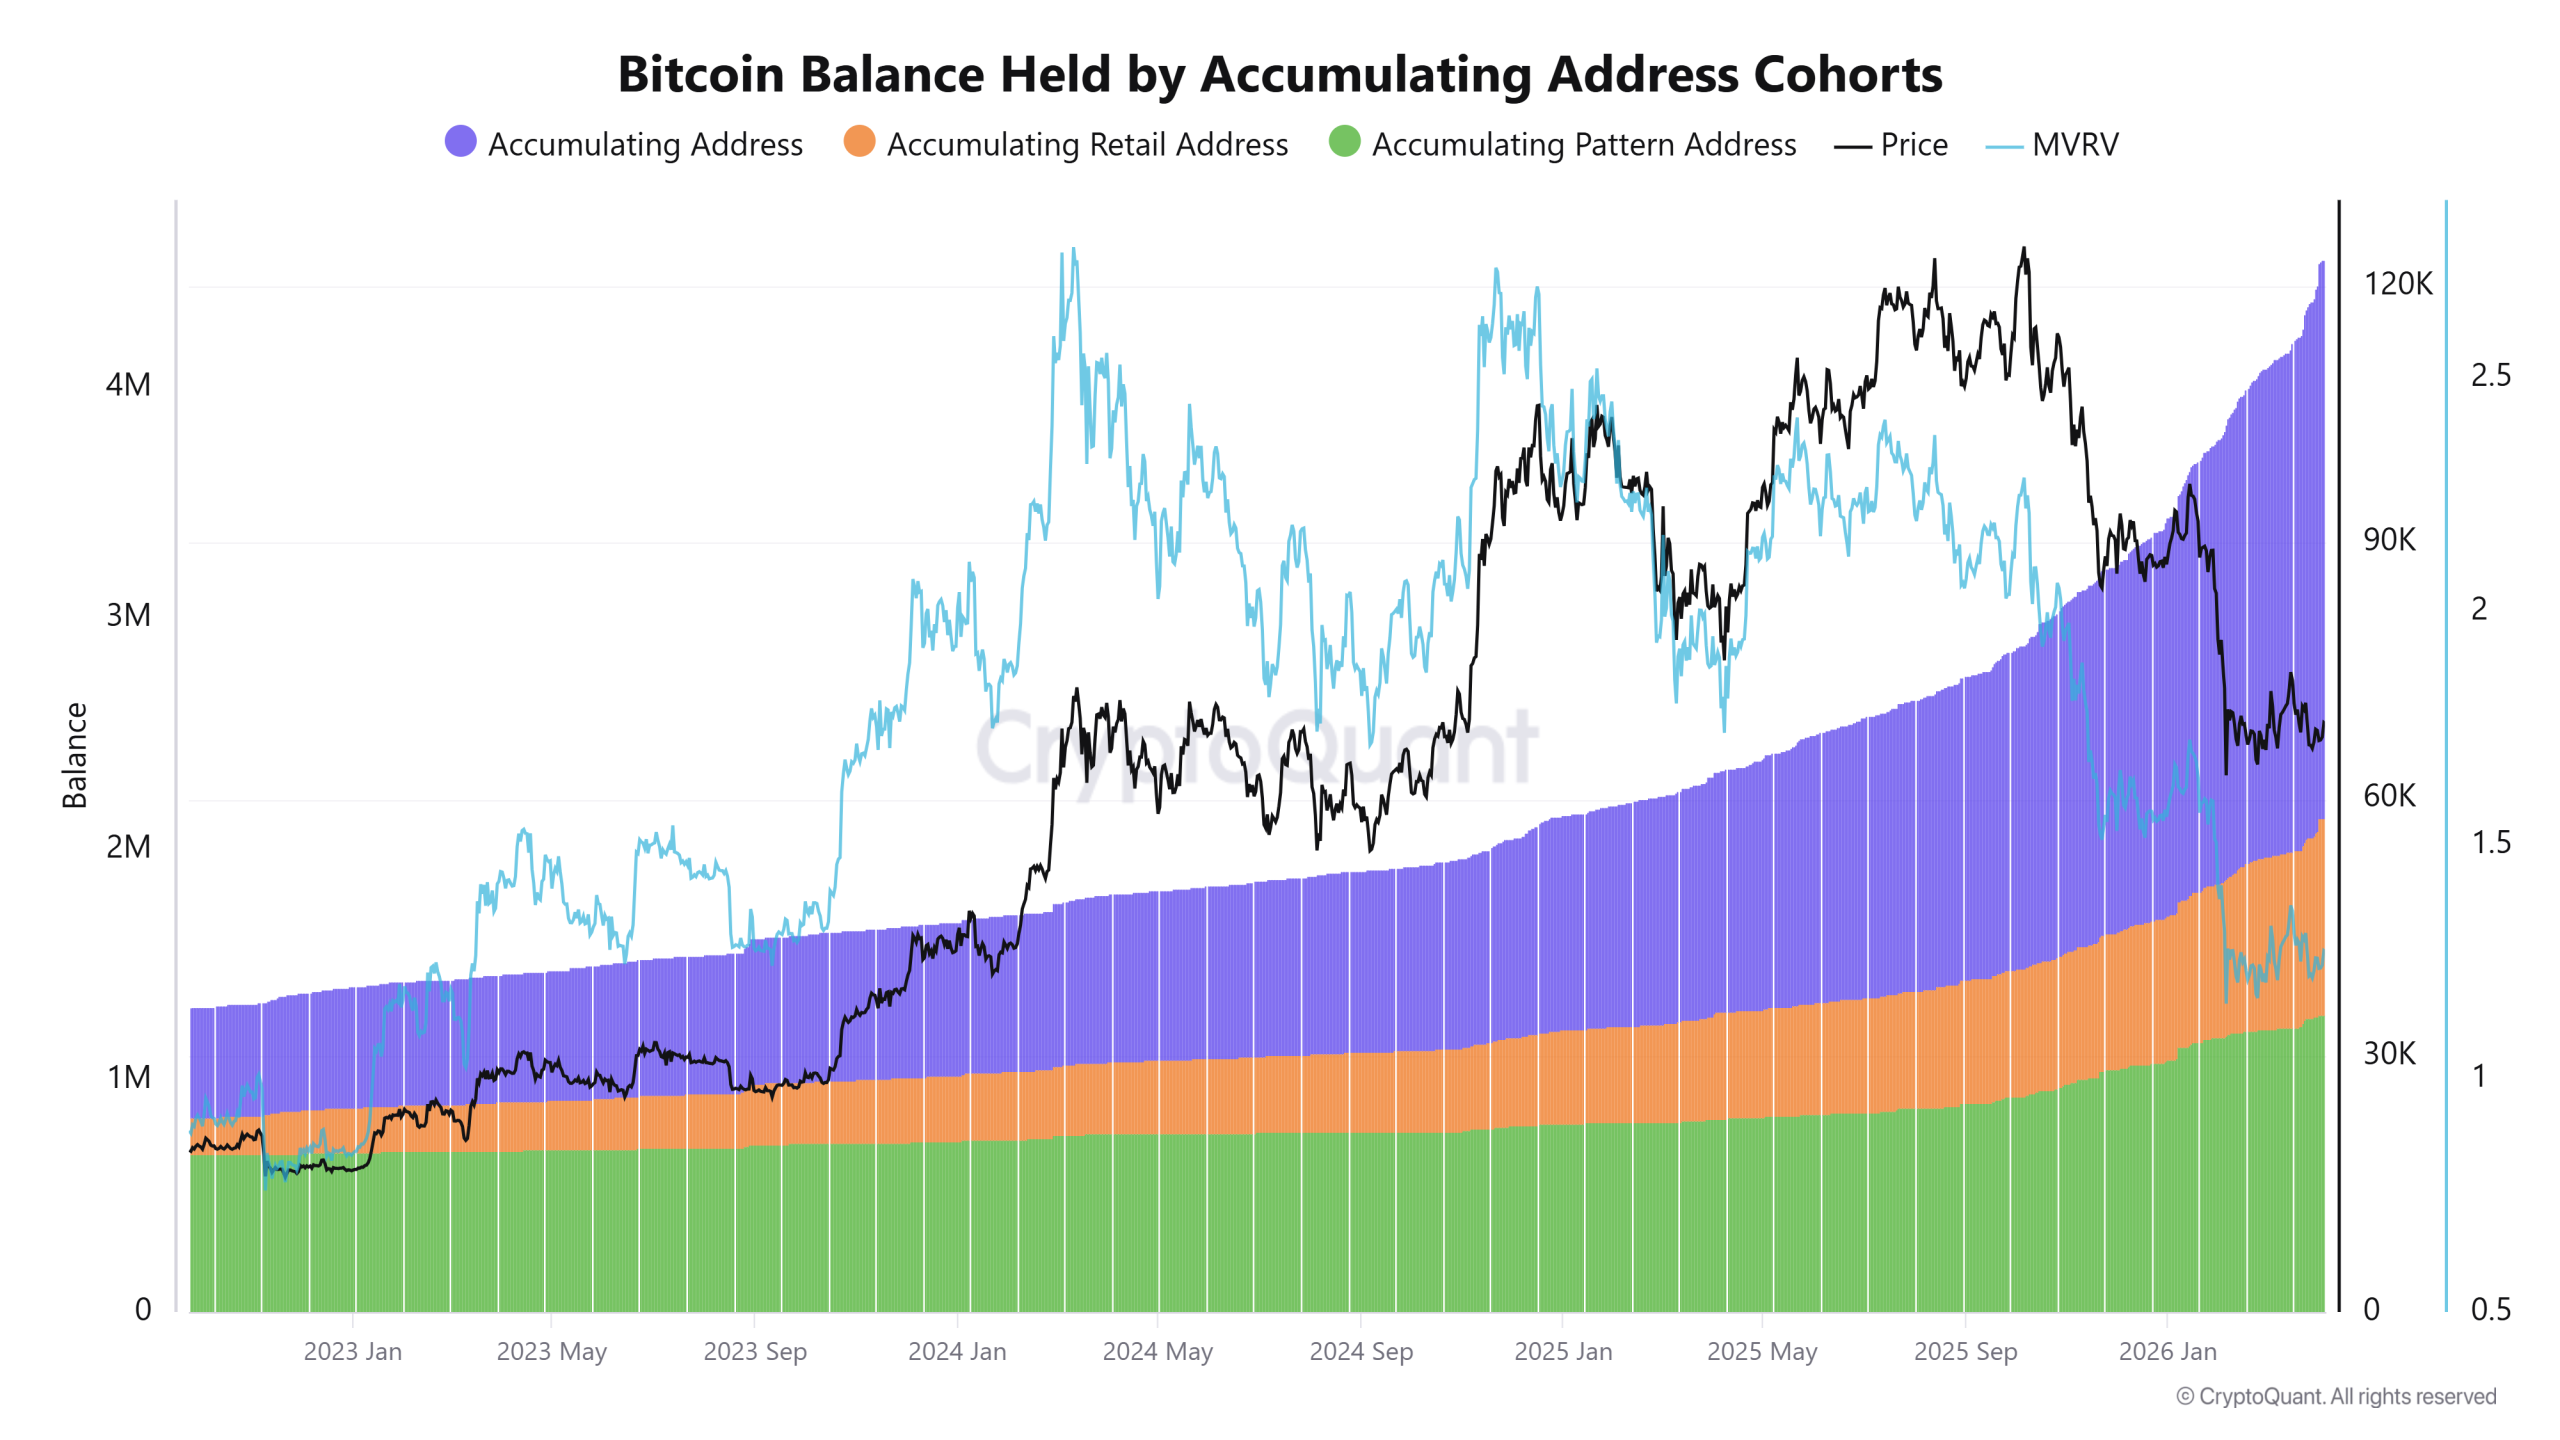
New data suggests that Bitcoin (BTC) could be moving closer to a bull market phase as its supply slowly shifts back into long-term, retail-investor-linked wallets. The figure surpassed 4 million BTC in Q1 2026.
The accumulation trend aligns with a rise in Bitcoin network activity index to levels last seen in April 2025, signaling a return of stronger network activity.
Bitcoin long-term wallets expand holdings
CryptoQuant data shows that balances held by accumulating address cohorts continued to rise into Q1 2026. The total BTC held by these cohorts has crossed 4.37 million BTC as of April 7, up from about 2 million BTC in early 2024, signaling sustained supply absorption.

The retail-investor-linked accumulation addresses added roughly 857,000 BTC, while the accumulating pattern wallets, defined as addresses that steadily add BTC at recurring intervals with minimal outflows, expanded to 1.29 million BTC.
This growth occurred while the price remained capped below $70,000 throughout the first quarter of 2026.
In contrast, the inflows from centralized exchanges and highly active addresses have slowed. During the 2023–2024 expansion phases, the inflows often exceeded 1.2 million to 1.5 million BTC. The recent activity has averaged 300,000 to 350,000 BTC.

The divergence shows a shift in coin distribution. More BTC is moving into long-term wallets, while fewer coins are circulating on the exchanges. This indicates a tightening of the liquid supply and a reduction in short-term trading turnover.
Related: Bitcoin holds $67K support as data exposes price to sentiment divergence
Bitcoin network activity index highlights the trend
The CryptoQuant Bitcoin network activity index has climbed to 3,600 from 3,320 on March 22. The index aggregates broader usage signals, including transaction counts and network throughput.

As observed in the chart, it has moved above its 365-day moving average for the first time since December 2024 and entered the “bull-phase” classification for the first time since April 2025.
In parallel, Bitcoin’s active addresses momentum dropped to -0.25 on April 6, the lowest reading since April 2018. The metric tracks the rate of change in active addresses, with negative values pointing to declining user participation.

The low activity levels have persisted since July 2025, echoing a similar stretch in 2024 that preceded a 35% price decline.
According to crypto analyst Gaah, the drop in activity signals the absence of short-term participants, or “tourists.” The network usage is now dominated by long-term holders focused on accumulation.
Historically, low readings have aligned with profitable accumulation phases. The reduced activity often coincides with lower sell pressure as the coins move into long-term wallets.
Related: Bitcoin’s quantum challenges are ‘more social than technical’: Grayscale
This article is produced in accordance with Cointelegraph’s Editorial Policy and is intended for informational purposes only. It does not constitute investment advice or recommendations. All investments and trades carry risk; readers are encouraged to conduct independent research before making any decisions. Cointelegraph makes no guarantees regarding the accuracy or completeness of the information presented, including forward-looking statements, and will not be liable for any loss or damage arising from reliance on this content.

U.S. spot Bitcoin exchange-traded funds (ETFs) experienced substantial inflows at the beginning of the week, marking the strongest single-day performance in over six weeks. On Monday, Bitcoin ETFs attracted $471.3 million in net inflows. This surge reversed the previous month’s outflows and underscored renewed investor interest.
The strong inflows on Monday were primarily driven by BlackRock and Fidelity. Other prominent funds, including Ark 21Shares, Grayscale, Bitwise, and VanEck, also contributed to the influx. The total inflow for Bitcoin ETFs represents the highest daily intake since late February, signaling a potential shift in market sentiment.
The positive momentum in Bitcoin-related assets has injected optimism into the market. The latest data indicates that spot Ethereum products also saw significant inflows. While uncertainty remains due to broader macroeconomic conditions, the trend could support further upside potential for Bitcoin.
BlackRock and Fidelity Lead the Charge
BlackRock’s Bitcoin ETF, IBIT, led the pack with $181.9 million in inflows on Monday. Fidelity’s FBTC followed with $147.3 million, securing a significant portion of the daily total. Together, these two funds accounted for more than half of the day’s inflows, signaling the strength of institutional support for Bitcoin.
ARK Invest and 21Shares’ ARKB also contributed meaningfully, with $118.7 million in inflows. These funds, which focus on offering innovative financial products, are benefiting from growing interest in cryptocurrency investments. Their substantial contributions reflect the continued expansion of Bitcoin’s presence in the mainstream financial ecosystem.
This surge in investments coincides with the release of positive market data and could further bolster Bitcoin’s price performance. As the leading players in the ETF space continue to drive interest, the momentum for Bitcoin is expected to continue. Analysts predict that this trend could propel Bitcoin past its current trading range if the macroeconomic climate stabilizes.
Spot Ethereum Products See Uptick
Ethereum ETFs also experienced a surge in demand on Monday, with $120.2 million in inflows. This marked the highest single-day net inflow since mid-March. The increase highlights growing investor interest in Ethereum as an alternative to Bitcoin.
Ethereum’s price has faced increased volatility in recent months, but these inflows signal a resurgence of confidence. Investors appear to be looking at Ethereum as a strong performer amid the broader cryptocurrency market’s rally. The combination of rising interest in both Bitcoin and Ethereum products could be a sign of a broader recovery in the digital asset space.
However, macroeconomic challenges, such as ongoing geopolitical tensions and economic uncertainty, continue to loom over the market. If these external pressures ease, it could further fuel positive sentiment for cryptocurrencies like Bitcoin and Ethereum.


The Solana Foundation has launched STRIDE – Solana crypto Trust, Resilience and Infrastructure for DeFi Enterprises – a structured security evaluation program covering all Solana-based DeFi protocols, funded through a partnership with security firm Asymmetric Research.
The program arrives five days after the Drift Protocol exploit on April 1, in which attackers drained $286 million in under 12 minutes – a breach that exposed the absence of any standardized, ongoing security baseline across Solana’s DeFi layer.
STRIDE is not a bug bounty or a one-time audit mandate. It is a continuous monitoring framework, independently administered by Asymmetric Research, with tiered benefits tied directly to protocol TVL and public evaluation results available to users and investors.
Whether that structure is sufficient to rebuild institutional confidence in Solana DeFi is the question the market will answer over the next several months.
- What It Is: STRIDE (Solana Trust, Resilience and Infrastructure for DeFi Enterprises) is a foundation-funded, structured security evaluation program for all Solana DeFi protocols, administered by Asymmetric Research.
- How It Works: Asymmetric Research independently assesses protocols across eight security categories – including operational security, access controls, multisig configurations, and governance vulnerabilities – with results published in a public repository.
- Tiered Benefits: Protocols with over $10M TVL that pass evaluation receive foundation-funded 24/7 threat monitoring; those above $100M TVL unlock formal verification tools using mathematical proofs across all smart contract execution paths.
- Rapid Response Network: The companion Solana Incident Response Network (SIRN) launches with five founding firms – Asymmetric Research, OtterSec, Neodyme, Squads, and Zeroshadow – sharing threat intelligence with response priority determined by TVL and impact.
- Current Status: STRIDE version 0.1 is live; the framework will evolve based on real-world assessment feedback, with the first public evaluation reports expected as protocols apply.
- What to Watch: Track the first published STRIDE evaluation results and any SIRN activations – those two data points will signal whether the program functions as operational infrastructure or credentialing theater.
Discover: The Best Crypto to Get Right Now
What STRIDE Actually Does for Solana Crypto and Why the TVL Threshold Structure Changes the Calculus
The core mechanism: Asymmetric Research evaluates protocols against its own eight-pillar security framework covering operational security, access controls, multisig configurations, and governance vulnerabilities, then publishes those results publicly.
That is not an audit; it is a continuously maintained security rating. The distinction matters because audits are point-in-time assessments that expire when a protocol upgrades; STRIDE’s continuous monitoring model keeps ratings calibrated to evolving threats.
The tiered benefit structure is where the program’s real incentive logic lives. Protocols above $10 million TVL that pass evaluation receive foundation-funded 24/7 threat monitoring at no cost to the protocol – operational security support that most teams currently cannot fund independently.
Protocols above $100 million TVL receive access to formal verification tooling, which uses mathematical proofs to check every possible smart contract execution path rather than sampling representative scenarios. At current Solana DeFi TVL concentrations, that $100M threshold covers the protocols whose failures carry systemic contagion risk.
Running alongside STRIDE is SIRN – the Solana crypto Incident Response Network – a membership-based coalition of security firms that functions as a shared threat intelligence layer and rapid-response coordinating body.
The five founding members are Asymmetric Research, OtterSec, Neodyme, Squads, and Zeroshadow. SIRN is open to all Solana protocols, but response prioritization is explicitly ordered by TVL and estimated impact. The foundation funds the coalition’s operations; protocols don’t pay for access.
Prior Solana security infrastructure – Hypernative for threat detection, Range Security for risk alerts, Riverguard for attack simulation, Sec3 X-Ray for static analysis – addressed individual threat vectors. STRIDE’s version 0.1 attempts to unify those capabilities under a single evaluative baseline. Whether version 0.1 evolves quickly enough to match the attack surface expanding in parallel is the core execution risk.
Explore: The Best Pre-Launch Token Sales With Asymmetric Upside Potential
The post Solana Crypto Foundation Launches STRIDE Program to Strengthen Ecosystem Security appeared first on Cryptonews.

Binance has expanded its institutional loan product with higher leverage, broader access, and fixed-rate options, even as its chief compliance officer (CCO) reportedly weighs an exit.
The update raises the maximum leverage cap from 4x to 5x for all eligible risk units. Know Your Business (KYB)-verified clients at VIP 1 and above now qualify, down from the previous VIP 5 threshold.
What Changed in the Binance Loan Terms
Initial loan-to-value (LTV) ratios increased from 75% to 80%, while transfer-out LTV moved to 83%. Margin call and liquidation thresholds remain at 85% and 90%, respectively.
Binance also introduced fixed-rate term loans with 30-, 60-, and 90-day terms. Upon expiry, unpaid balances are rolled over to the prevailing variable rate.
Co-CEO Richard Teng promoted the changes, saying the exchange continues to raise standards for institutional clients.
The Binance VIP account confirmed existing clients were upgraded automatically.
Compliance Leadership Under Pressure
Meanwhile, Chief Compliance Officer Noah Perlman is reportedly in discussions about leaving the company.
According to a Bloomberg report, Binance stated that Perlman has no confirmed exit date, and no successor has been identified.
Several other senior compliance staff have also departed, including employees handling sanctions, investigations, and financial crime monitoring.
Perlman joined Binance in 2023 following the firm’s $4.3 billion settlement with U.S. authorities.
The company has said it expanded compliance-related staff by more than 30% and reduced illicit exposure by 97% between January 2023 and June 2025.
Whether Binance can sustain those improvements amid ongoing personnel turnover will likely shape how regulators assess the exchange’s compliance trajectory in the months ahead.
The post Binance Boosts Institutional Loans to 5x Leverage as Compliance Chief Eyes Exit appeared first on BeInCrypto.
Binance announced the Spot Price Range Execution Rule (PRER), a new mechanism that expires taker orders when execution prices fall outside a dynamic fair-value band.
The rule takes effect gradually starting April 14, 2026. It directly targets the type of spot-market failures that surfaced during the October 10, 2025 flash crash.
What Triggered the Binance PRER
On October 10, 2025, President Trump’s announcement of 100% tariffs on Chinese imports set off the largest single-day liquidation cascade in crypto history.
Over $19.13 billion in leveraged positions were liquidated in a 24-hour period, affecting more than 1.6 million traders.
On Binance, assets like Cosmos (ATOM) briefly traded near zero as margin collateral was sold off in bulk.
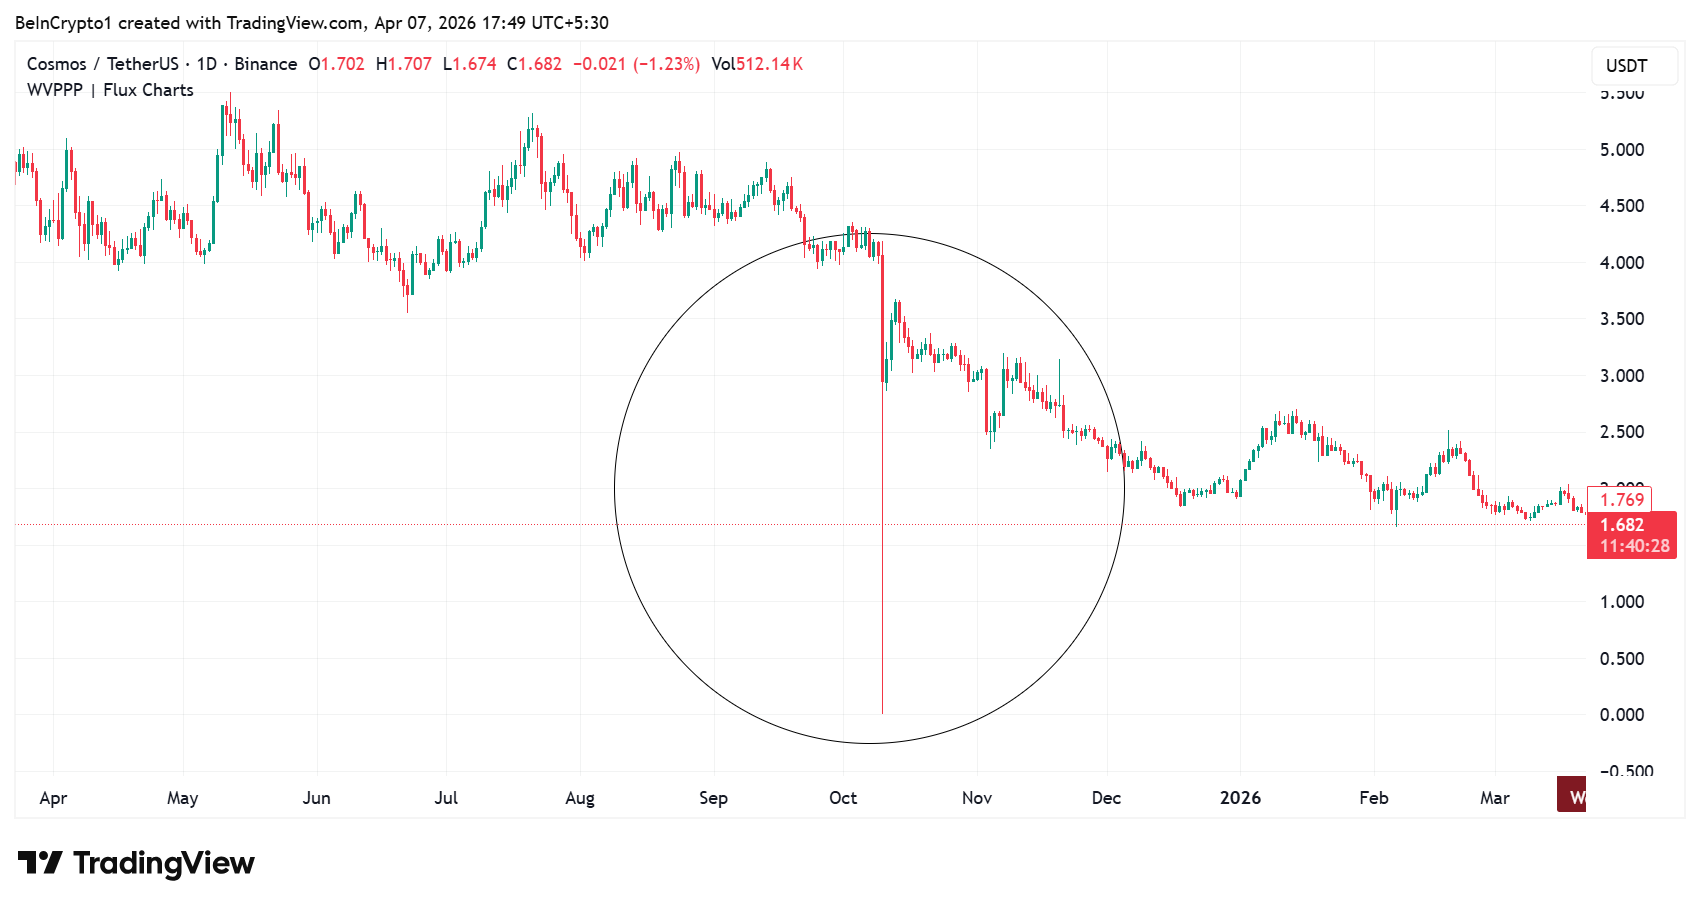
Stale limit orders, some placed years earlier, filled against one-sided liquidity at extreme prices. Binance paid $283 million to compensate users affected by the de-pegging of USDe, BNSOL, and WBETH.
The exchange later launched a separate $400 million “Together Initiative” covering forced liquidation losses, bringing total compensation to $683 million.
How PRER Works
PRER calculates a dynamic reference price per trading pair using a moving average of recent trades. Configurable bands above and below that reference define the acceptable execution range.
When a taker order would fill outside that band, the unfilled portion expires rather than executing at an abnormal price. Maker orders resting on the book remain unaffected, and under normal conditions daily trading sees no impact.
Binance stated this mechanism will roll out pair by pair, with new listings activating once sufficient trading history establishes a reliable reference price.
API users can query reference prices and band parameters through dedicated endpoints in real time.
Traders with open orders should review their strategies before April 14.
Nevertheless, while PRER adds a protective layer against extreme fills, it does not eliminate volatility or the broader risks of leveraged crypto trading.
The post Binance’s New Rule Could Have Prevented the $19 Billion October Crash appeared first on BeInCrypto.

Aave $50 billion crypto TVL now operates without a dedicated risk manager – the direct consequence of Chaos Labs’ exit, which strips the protocol of the firm responsible for pricing every loan on the platform since 2022 and managing liquidation thresholds, collateral factors, and interest rate parameters across all V2 and V3 markets.
The departure follows the earlier exits of BGD Labs and Aave Chan Initiative, leaving Aave with no remaining technical contributors from its V3 build team at precisely the moment V4 demands dual-stack oversight.
The mechanism is a governance dispute over compensation structure and risk philosophy – but the structural exposure is a protocol-risk vacuum landing on a $50 billion balance sheet mid-migration.
- What Happened: Chaos Labs, Aave’s primary risk manager since November 2022, announced its exit citing unprofitability, contributor attrition, and a fundamental disagreement with Aave Labs over risk methodology for the V4 migration.
- Protocol Risk: Chaos managed collateral factors, liquidation thresholds, and interest rate models across all Aave V2 and V3 markets – functions that now lack an assigned owner on a platform holding over $50 billion in TVL and processing nearly $1 trillion in cumulative loans.
- Compensation Dispute: Aave Labs proposed raising Chaos Labs’ budget to $5 million annually – roughly 3.5% of Aave’s $142 million in 2025 revenue – but Chaos deemed it insufficient given three years of operating losses and the expanded V4 workload. Banks typically allocate 6–10% of revenue to risk and compliance functions.
- V4 Complexity: Aave V4, which launched one week before the exit announcement, introduces a hub-and-spoke liquidity architecture requiring entirely new infrastructure, tooling, and simulation models – while V3 simultaneously requires active support until full migration, a process Chaos Labs founder Omer Goldberg said historically takes years, not months.
- Contributor Attrition: Chaos Labs is the third major Aave contributor to exit in 2025, following BGD Labs and Aave Chan Initiative – a sequence that compresses the remaining institutional knowledge base inside the DAO at a critical transition point.
- What to Watch: The DAO’s governance forum vote on interim risk mandate appointments – specifically whether a credentialed replacement is named before Aave’s first V4 parameter adjustment is required. Any V4 liquidation event without a designated risk manager in place would represent a measurable failure of the transition framework.
Discover: Best Crypto Exchanges for Active DeFi Traders in 2025
What Chaos Labs Actually Did at Aave Crypto – and Why Its Exit Creates a Structural Gap
The real story isn’t that a vendor relationship ended. It’s that Aave’s core risk infrastructure, the system that determined which assets could be used as collateral, at what ratios, with what liquidation buffers – was built and maintained by a single external firm now walking out during the most complex protocol upgrade in Aave’s history.
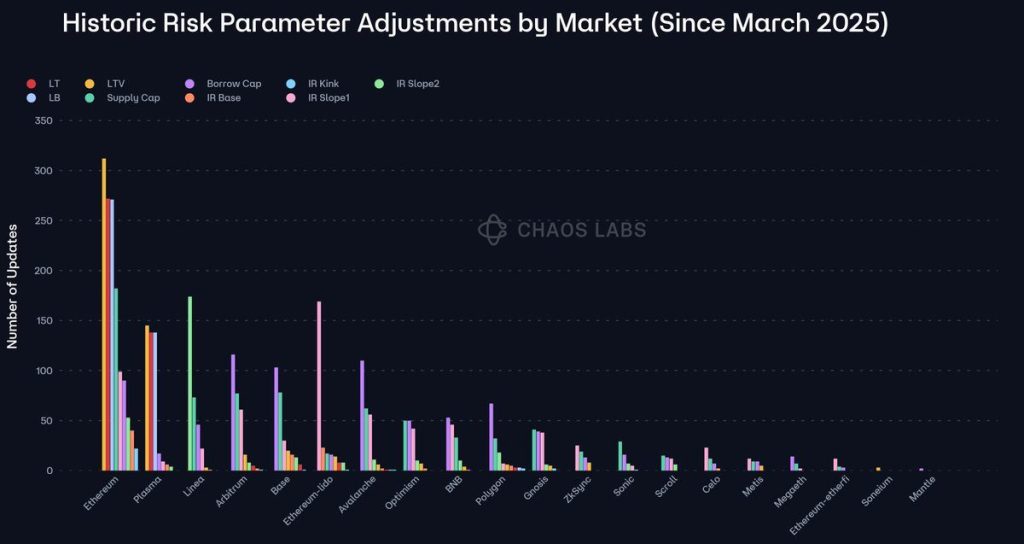
Chaos Labs priced every loan initiated on Aave from November 2022 through the present, managing risk parameters across V2 and V3 deployments spanning more than a dozen networks.
That scope includes liquidation threshold calibration, interest rate curve configuration, and collateral factor adjustments – the parameters that determine whether a $50 billion lending platform absorbs volatility or generates cascading bad debt.
Goldberg stated on X that Chaos achieved zero material bad debt during this tenure, a claim that carries weight given the scale of assets under management.
The governance dispute crystallized around three compounding pressures. First, Aave Labs’ proposed $5 million annual budget – approximately 3.5% of Aave’s $142 million in 2025 protocol revenue – fell short of what Chaos calculated as cost recovery after three years of operational losses.
Risk and compliance functions at traditional financial institutions absorb 6–10% of revenue; Chaos was being asked to operate at roughly half that floor while taking on materially greater complexity.
Second, V4’s hub-and-spoke architecture requires building from scratch: new infrastructure, new liquidation simulations, and new oracle integrations for asset classes Aave has not previously managed. Goldberg described it plainly – “going from zero to one again on a codebase that has not yet been battle-tested.”
Third, and structurally most significant: the legal liability question for DeFi risk managers remains entirely unresolved.
A March 2026 oracle misconfiguration – a Chaos Labs CAPO risk agent feeding an inaccurate price ratio for staked Ether – triggered $26.9 million in erroneous liquidations. No regulatory safe harbor exists for DeFi risk managers operating at this scale.
As DeFi governance disputes increasingly surface legal and ethical liability questions, the undefined exposure attached to managing $50 billion in lending parameters is no longer theoretical – it is priced into the decision to walk away.
Aave Labs CEO Stani Kulechov pushed back on the urgency framing, stating that V4 is additive and V3 migration carries no forced deadline. That may be true at the protocol level. It does not resolve who manages V3 risk parameters while the replacement search runs – or who sets V4’s initial collateral factors when the first major markets go live.
The post Chaos Labs Exits as Aave Crypto Risk Manager Amid Governance Dispute appeared first on Cryptonews.
Bitcoin (BTC) has steadied around the $67,000 level, underscoring a curious balance between durable institutional bids and an enduring wave of bearish sentiment among retail traders. After a period of macro headwinds and geopolitical flashpoints, BTC is trading in a narrow corridor that keeps traders watchful for a decisive breakout or a renewed pullback.
The market narrative remains split. On one hand, price action shows resilience, avoiding a drop below $60,000 and absorbing shock from a volatile macro backdrop, including ongoing tensions in the Middle East and related risk signals. On the other hand, sentiment metrics stay deeply negative, with the Fear and Greed Index stuck in extreme fear territory for more than a month—the longest stretch in its history—raising questions about the durability of any upside from price alone.
Key takeaways
- BTC remains anchored above $60,000, with a near-term challenge at $67,000. A daily close above that level could signal a fresh uptrend path, while continued consolidation keeps risk-reward balanced.
- Institutional demand in March supported BTC’s resilience: spot BTC ETFs absorbed roughly 50,000 BTC, and corporate purchases added about 44,000 BTC. The NYSE’s approval of a spot ETF for Morgan Stanley broadened access to the product via around 16,000 advisors, contributing to a net inflow of about $1.32 billion after a period of net outflows.
- On-chain activity shows rising accumulator demand. CryptoQuant data indicate long-term wallets increased their BTC holdings to 289,971 BTC on April 7, up 83% from two weeks earlier, a sign of sustained demand from long-hold investors.
- ETF flows and leverage dynamics complicate the picture. Late-March ETF outflows totaled about $414 million, while leverage-driven rallies—such as the move toward $70,000 earlier in the week—carry a historically higher retracement risk, a pattern some analysts expect to repeat in 2026.
Divergence between price action and sentiment
Market maker Wintermute highlighted a disconnect between BTC’s price stability and investor sentiment. While price has remained stubbornly resilient, the market’s mood has lingered in extreme fear, with the Fear and Greed Index remaining historically low for an extended period. That tension underscores a cautious stance among participants who remain wary of further macro shocks but are nonetheless being drawn into the market by sustained buying pressure from institutions.
The narrative is complicated by a string of outsized events that could have derailed the rally. BTC absorbed a $403 million liquidation event and faced persistent negative on-chain demand amid ongoing geopolitical tensions. Yet the asset has not only held its ground but also kept annual downside risks in check, suggesting a core bid underpinning from long-term holders and institutions alike.
According to Wintermute, the March period saw a clear tilt toward demand from more traditional buyers, which could foreshadow a more persistent bid if price can carve out a higher base above $67,000. The market’s ability to maintain above $60,000 amid these pressures reinforces a narrative that BTC’s value proposition remains intact for a segment of investors willing to allocate capital in a risk-managed way.
Institutional demand and the ETF signal in March
Institutional participation has become a recurring driver of Bitcoin’s price dynamics. In March, spot BTC ETFs reportedly absorbed around 50,000 BTC, while corporate buyers added roughly 44,000 BTC. The news that Morgan Stanley secured NYSE approval for a Bitcoin spot ETF expanded access to the vehicle through about 16,000 financial advisors, which appears to have helped reverse a prior streak of net outflows and push total net inflows to approximately $1.32 billion for the period.
These flows matter because they reflect a shift in how institutional money is entering the Bitcoin market. While retail sentiment remains fragile, the continued funneling of capital through regulated channels and the expansion of advisory access for spot BTC exposure provide a durable counterweight to downside risks. The data suggest that institutions are increasingly treating BTC as a strategic core holding rather than a high-risk, high-volatility trade.
On-chain dynamics: accumulation as a signal
On-chain analysis adds nuance to the evolving demand picture. CryptoQuant data show long-term accumulator addresses increasing their holdings—reaching 289,971 BTC on April 7, up from 158,336 BTC two weeks earlier. That 83% jump over a short window signals a meaningful shift in the holder base, with more coins effectively locked away from short-term trading and deployed by patient buyers.
Crypto researcher Rei framed this pattern as a potential confirmation signal: if rising accumulation aligns with price durability at higher levels, it strengthens the case for a sustainable uptrend. The 30-day average trend in accumulation is often cited as a practical confirmation metric for traders seeking longer-term validation beyond immediate price swings.
“If that happens alongside price establishing acceptance at higher levels, the signal becomes significantly more convincing.”
Market mechanics: ETF flows, leverage risk, and next steps
Even as March showed a surge in institutional demand, late-month ETF dynamics shifted toward net outflows. About $414 million left the space in the final week, while OTC positioning moved toward neutrality and early buying gave way to selling in some segments. The shift underscores the fragility of momentum in a market that can be driven by both regulatory developments and hedge fund risk management.
Analysts have also flagged the role of leverage in recent price moves. A notable rally toward $70,000 earlier in the week was characterized by leverage-driven buying, according to market observers. If this dynamic repeats, it could produce sharp short-term moves that are followed by pullbacks, a pattern that could reassert caution for traders relying on rapid, momentum-based strategies.
On the technical front, BTC has closed below $67,000 on about 26% of trading days since February 5—the first time the price failed to hold that level since October 2024. While this does not declare a trend, it suggests that the market remains in a state of watchful anticipation, waiting for a clear macro-driven catalyst or a sustained shift in on-chain behavior to unlock a firmer directional move.
Together, these threads point to a market in flux: price stability supported by institutional capital and long-term holders, tempered by persistent negative sentiment and a delicate balance between leveraged momentum and on-chain accumulation. The coming weeks will be telling as investors look for a lasting breakout above resistance, or a capitulatory move that could reset sentiment and positioning.
As BTC approaches a potential inflection point, traders and longer-term observers should monitor the alignment between on-chain accumulation, ETF inflows, and price action. A convincing break above $67,000—if confirmed by sustained closes and expanding demand—could recalibrate expectations for the rest of the quarter. If sentiment remains the stronger brake, traders may need to brace for further sideways trading and selective volatility until new catalysts emerge.

XRP Tokyo is here. XRPL community descends on Japan for what may be the most consequential Ripple event of 2025. The headline figure out of XRP Tokyo is staggering; it reframes the entire stablecoin conversation. Whale accumulation is at a 10-month peak. Something is building.
At XRP Tokyo today, Ripple revealed that on-chain stablecoin volume is projected to exceed $33 trillion in 2026, a figure larger than the combined GDPs of the United States and China. The company’s conference flyer put it bluntly:
“Modern fintechs no longer ask if they should adopt stablecoins. Instead, they ask how quickly they can integrate them to stay ahead.”
Ripple holds more than 75 licenses globally and is positioning itself as the compliance backbone for that shift. SBI Holdings, Japan’s financial heavyweight and a Ripple partner since 2016, launched a 10 billion yen (~$64M) blockchain bond earlier this year using XRP rewards, underscoring that this is not conference theater.
BOOM! — X Finance Bull (@Xfinancebull) April 7, 2026
 $XRP TOKYO IS HAPPENING!
The institutional playbook on display.
Evernorth, SBI Ripple Asia, RippleX, GMO Aozora Net Bank, A16z Crypto, Fireblocks, and more.
Panels on stablecoins, RWA tokenization, and institutional blockchain adoption.
JAPAN IS DOING IT AGAIN! https://t.co/gEGqt97kCf pic.twitter.com/OI5GG3tNWR
The data points to a market coiling ahead of potential catalysts. Whether XRP can convert event momentum into a sustained breakout is the question every trader is sitting with right now.
Discover: The best crypto to diversify your portfolio with
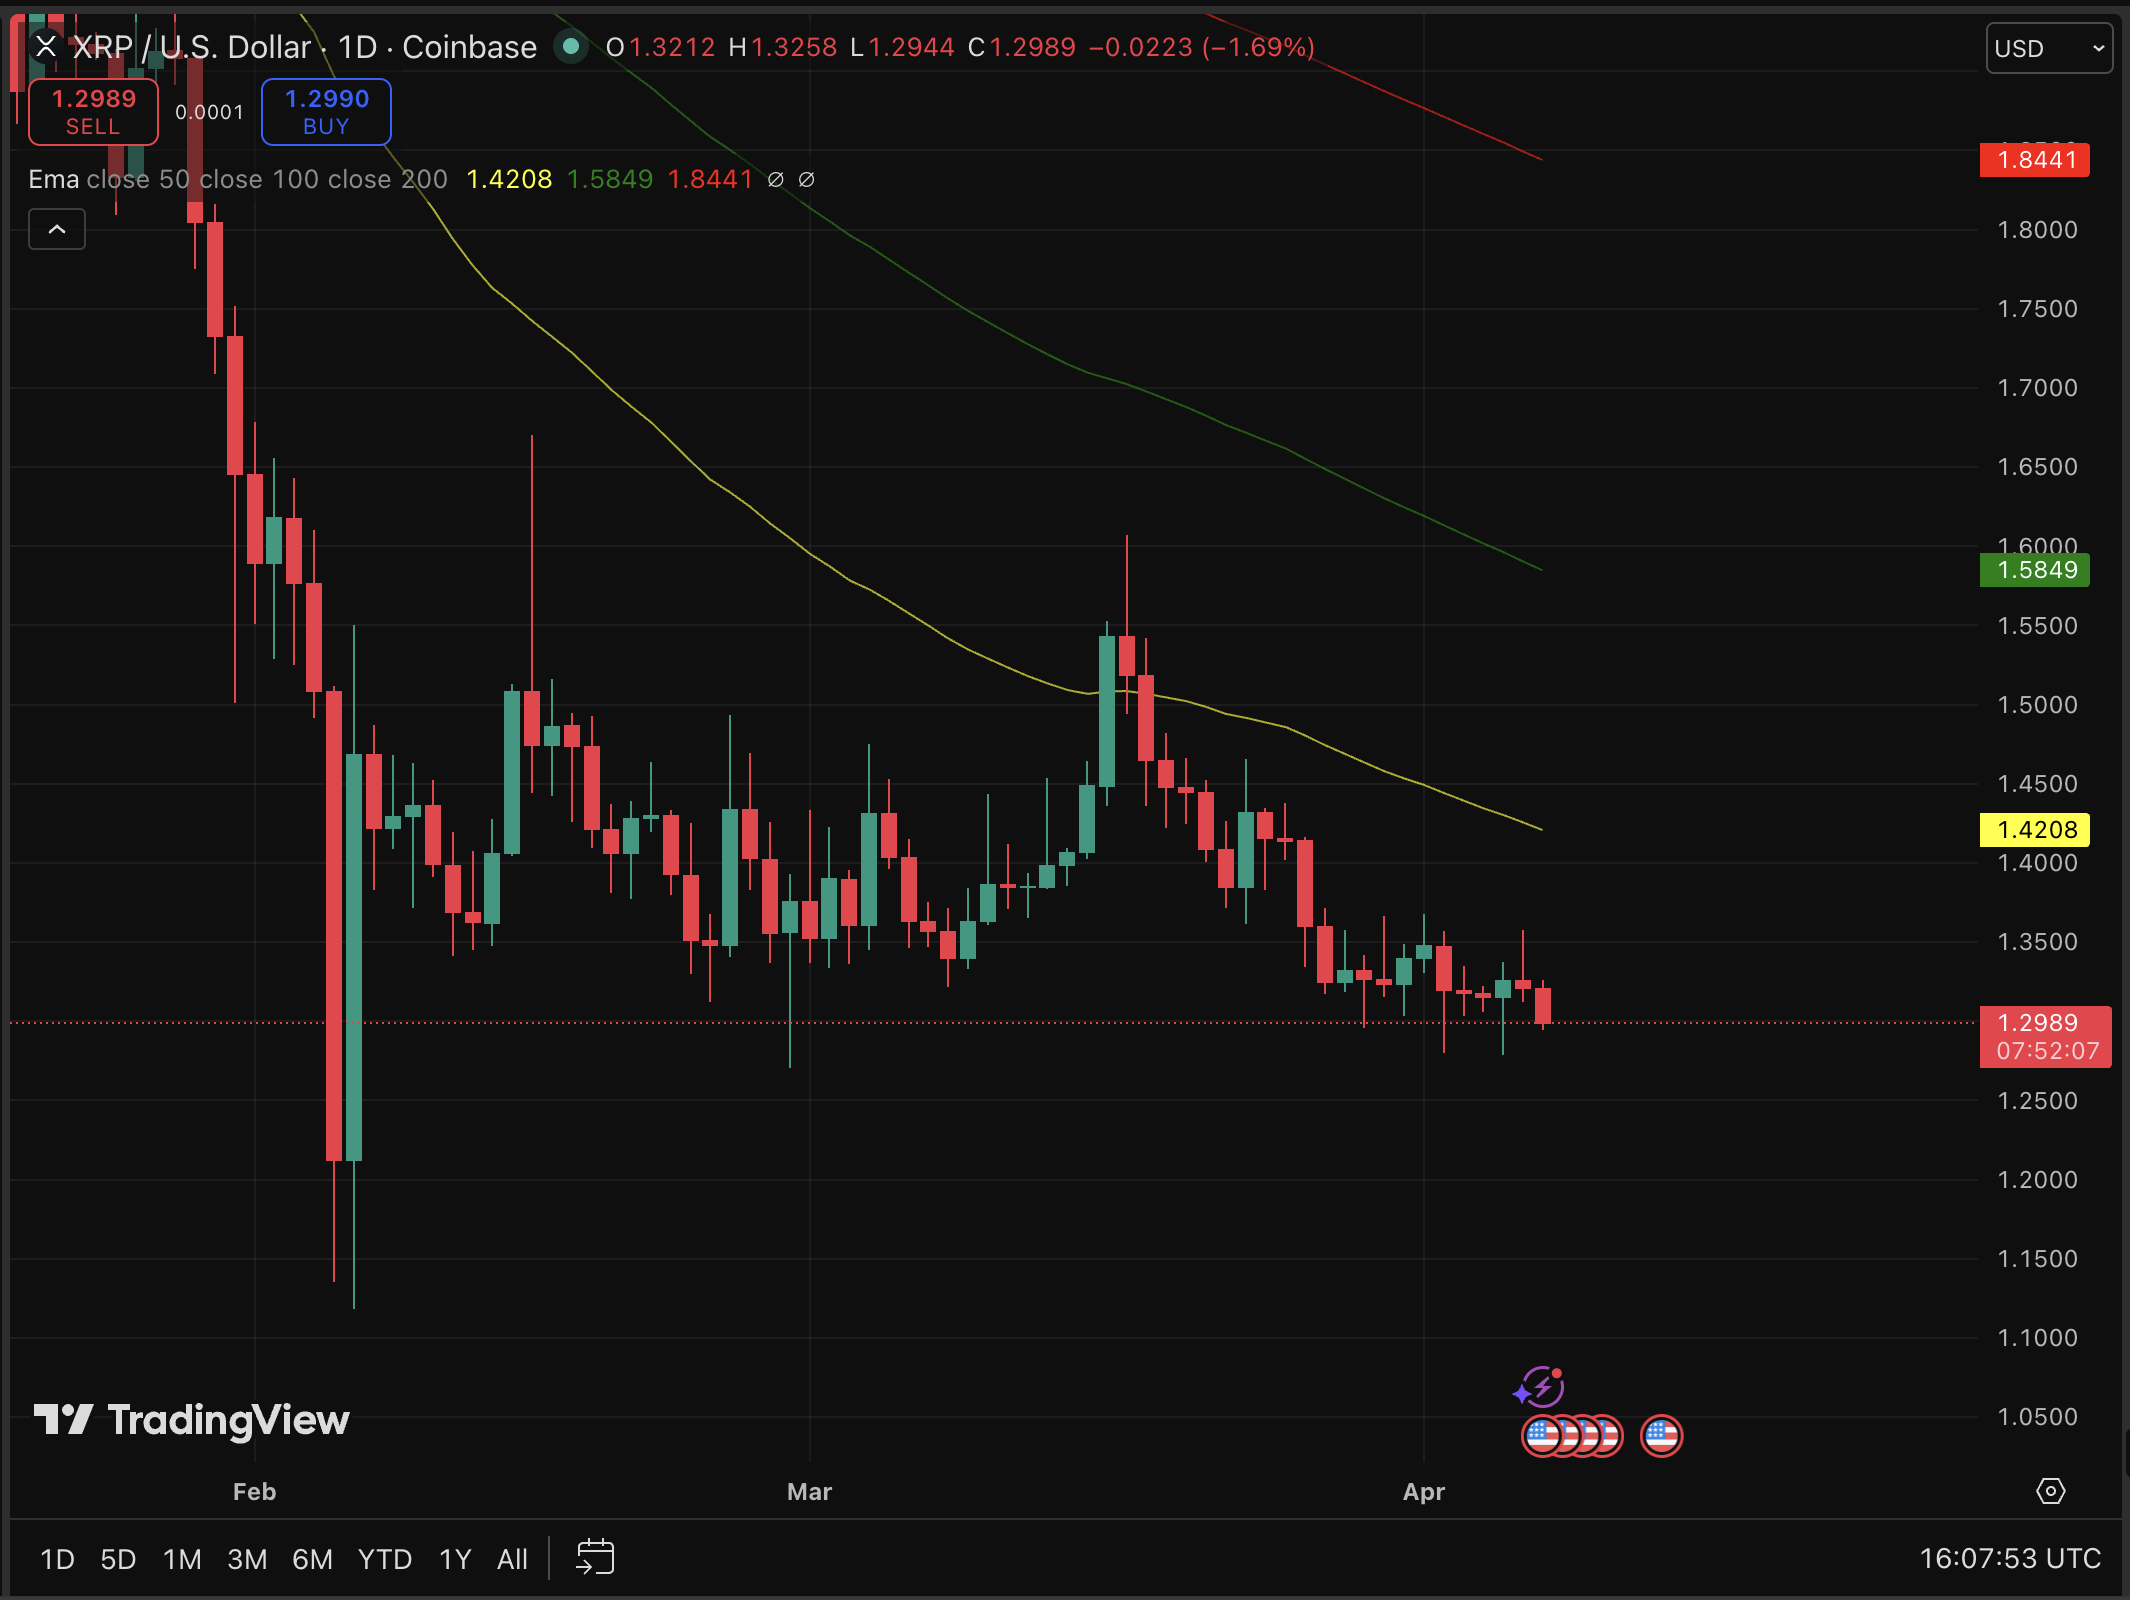
Can XRP Price Break $1.40 Before Tokyo Conference Ends?
XRP is consolidating in a tight $1.28–$1.35 range, with 24-hour low touching $1.30. The ugly truth is that large investors have been pulling coins off exchanges at a pace exceeding 11 million XRP per day, compressing available supply precisely as conference hype peaks.
The key technical level is $1.35. Institutions appear to be hedging around that figure, and a clean daily close above it opens a path toward the $1.40–$1.60 range. Spot XRP ETFs have pulled in $41M in year-to-date inflows; institutional demand is not hypothetical.
SBI CEO Yoshitaka Kitao added fuel last week, stating XRP “will be very expensive” if Ripple secures a favorable legal resolution, a comment that sent community forums into overdrive.
“XRP WILL BE VERY EXPENSIVE.” — Stellar Rippler
No, this is not just David Schwartz’s confession. This was also said by the biggest financial giant of Japan, Yoshitaka Kitao, SBI Holdings CEO.
SBI is Ripple’s largest external shareholder.
And he says clearly: “XRP will be very expensive.”… pic.twitter.com/mixB533ymR
 (@Stellar_Rippler) April 3, 2026
Three scenarios frame the near term. Bull case: a confirmed close above $1.35–$1.36 on strong volume drives a move toward $1.50+, accelerated by any tokenization announcement out of Tokyo. Base case: XRP grinds sideways in the $1.30–$1.40 band while the market waits on regulatory clarity. Invalidation: a break below $1.28 on rising volume would revisit the failed breakout lows and likely flush late longs.
The CLARITY Act’s progress through the Senate remains the wildcard that could accelerate any of these outcomes significantly.
Discover: The best pre-launch token sales
Bitcoin Hyper Targets Early-Mover Upside
XRP at $1.3 is a recovery, but it’s also a return to levels the asset visited months ago. At an $82 billion market cap, the asymmetric upside that defined XRP’s earlier moves requires increasingly large capital inflows to replicate. That’s not bearish, it’s just math.
Traders hunting earlier-stage exposure are looking at Bitcoin Hyper ($HYPER), a Bitcoin Layer 2 presale that has raised more than $32 million at a current price of $0.013. The project’s core is genuinely differentiated: it’s the first Bitcoin Layer 2 integrating the Solana Virtual Machine, targeting sub-Solana latency with smart contract capability while anchoring to Bitcoin’s security.
Hyper is a Decentralized Canonical Bridge handles BTC transfers; high-speed, low-cost execution handles the rest. Staking is live with a high 36% APY bonus during the presale window.
Bitcoin Hyper presale details are here.
The post XRP Tokyo Is Here: What We Learn and What’s Next for XRP Price appeared first on Cryptonews.
TLDR:
- FDIC, OCC, and NCUA jointly propose updated AML/CFT rules aligned with FinCEN’s new framework.
- Banks must adopt risk-based programs, focusing resources on higher-risk customers and activities.
- Only systemic or significant compliance failures will trigger formal AML/CFT enforcement actions.
- A new FinCEN consultation framework will strengthen coordination across federal banking regulators.
Federal banking regulators have jointly proposed a rule to update anti-money laundering and countering the financing of terrorism requirements.
The FDIC, OCC, and NCUA are seeking public comment on amendments to AML/CFT compliance programs. These changes align with updates proposed by the Treasury’s Financial Crimes Enforcement Network.
The rule stems from the Anti-Money Laundering Act of 2020, which directed agencies to modernize the existing regulatory framework.
Risk-Based Approach Takes Center Stage
The proposed rule places greater focus on risk-based AML/CFT programs for supervised institutions. Banks would be required to direct more resources toward higher-risk customers and activities.
Lower-risk customers and activities would receive proportionally less regulatory attention under the new framework.
The FDIC shared this update directly, stating:
“The FDIC Board also approved a proposed rule to update requirements related to anti-money laundering and countering the financing of terrorism.”
This approach encourages institutions to align compliance efforts with their actual risk profiles. Rather than applying uniform scrutiny across all customers, banks must assess and prioritize accordingly. The goal is to produce more effective outcomes for financial institutions and law enforcement alike.
The proposed rule also requires that a bank’s designated AML/CFT compliance officer be located in the United States.
That officer must remain accessible to regulators at all times. This provision adds a layer of accountability to institutional compliance structures.
Clearer Enforcement Standards and FinCEN Coordination
The proposed rule also introduces clearer standards around when enforcement actions may be triggered. Only significant or systemic failures to implement a properly established program would qualify. This change offers banks more regulatory certainty around compliance expectations.
Additionally, the rule establishes a new consultation framework between the agencies and FinCEN. This framework applies to certain supervisory and enforcement actions taken by the FDIC, OCC, and NCUA. It is designed to strengthen coordination and consistency across federal regulators.
Banks would also gain explicit authority to share AML/CFT-related information directly with FinCEN. This provision supports more open communication between institutions and federal financial intelligence units. It further reflects the broader effort to modernize information-sharing under the Bank Secrecy Act.
The public comment period gives financial institutions, credit unions, and other stakeholders the opportunity to weigh in.
The agencies intend for these changes to produce a stronger, more consistent AML/CFT compliance environment nationwide.


The crypto market update bitcoin war hedge Strait of Hormuz news today centers on a striking development: Iran’s IRGC has established a formal toll system at the world’s most critical oil chokepoint, demanding payments in stablecoins or Chinese yuan for naval escort through the strait — yet despite crypto’s growing role in wartime finance, Bitcoin has underperformed gold significantly since the conflict began on February 28.
Summary
- Bloomberg reported April 1 that Iran’s IRGC is charging ships a baseline of $1 per barrel — up to $2 million per very large crude carrier — payable in stablecoins or yuan, with a five-tier “friendliness ranking” system determining access and escort terms
- Chainalysis estimated Iranian-linked on-chain crypto activity reached $7.8 billion in 2025, with stablecoins playing a central role; Iran legalized Bitcoin mining in 2019 and its Ministry of Defense has accepted crypto for military export contracts since January 2026
- Bitcoin has underperformed gold as a wartime hedge since the conflict began, sitting at rank 12 by market cap with dominance at 59%, while gold has held safe-haven capital that Bitcoin has not captured
The crypto market update bitcoin war hedge Strait of Hormuz news has a sharper edge than most market commentary suggests. According to Bloomberg’s report from April 1, Iran’s IRGC has formalized control over the world’s most important oil chokepoint into a structured payment gateway. Ship operators seeking Hormuz transit must submit vessel ownership records, flag registration, cargo manifests, crew lists, and AIS tracking data to an IRGC-linked intermediary. The IRGC then assigns the ship a ranking on a five-tier “friendliness” scale — lowest rankings get most favorable terms. Once payment is received, a single-use passcode is broadcast over VHF radio and an Iranian naval escort guides the ship through.
Critically, Iran is demanding payment in stablecoins — not Bitcoin — specifically because stablecoins eliminate price volatility between invoice and settlement, making them functionally equivalent to dollar wire transfers while remaining outside the US dollar clearing system. Oil tankers start at around $1 per barrel, with very large crude carriers paying up to $2 million per transit. At least 15 to 18 ships have transited under this system in recent weeks.
Iran’s Crypto Infrastructure Is Not New
The Hormuz toll system is the most visible iteration of a much longer-running strategy. Iran legalized Bitcoin mining in 2019, at its peak contributing an estimated 4 to 5% of global Bitcoin hash rate. Chainalysis estimates Iranian-linked crypto activity reached $7.8 billion on-chain in 2025. In January 2026, Iran’s Ministry of Defense Export Center updated its systems to accept stablecoin payments for drone, missile, and other military export contracts.
Iran’s parliamentary National Security Committee approved a formal “Strait of Hormuz Management Plan” on March 31, which includes an official toll structure that references Iranian rials as currency but operates in practice with yuan and stablecoins to bypass OFAC enforcement.
Is Bitcoin a War Hedge? The Data Says Not Here
As crypto.news reported, Bitcoin has dropped roughly 12% since the war began, while gold — despite its own volatility — has retained more safe-haven capital. Bitcoin sits at rank 12 by market cap, well behind gold at the top, and BTC dominance of 59% reflects consolidation rather than flight-to-safety flows. The Coinbase Premium Index has been in negative territory throughout the conflict, signaling US spot demand has not materialized in the way gold demand has.
As crypto.news noted, each confirmed escalation event in this conflict has produced immediate Bitcoin selling rather than buying — the opposite of what a war hedge would deliver. The stablecoin role in Iran’s Hormuz system is operationally rational: it solves a payment problem. Whether Bitcoin becomes a war hedge depends on a different question — whether retail and institutional capital decides to treat it as one.
“Bitcoin still trades more like a high-beta risk asset than a defensive hedge in the current climate,” one Orbit Markets analyst told Bloomberg this month.

BTC Accumulation Hits 4.37M as Network Activity Sends Mixed Signal
‘Upset’ I’m A Celebrity viewers make the same Adam Thomas demand

Khloud debuts protein chips


-

 NewsBeat5 days ago
Steven Gerrard disagrees with Gary Neville over ‘shock’ Chelsea and Arsenal claim | Football
-

 Business5 days ago
No Jackpot Winner and $194 Million Prize Rolls Over
-

 Fashion4 days ago
Weekend Open Thread: Spanx – Corporette.com
-

 Crypto World6 days ago
Gold Price Prediction: Worst Month in 17 Years fo Save Haven Rock
-

 Business2 days ago
Three Gulf funds agree to back Paramount’s $81 billion takeover of Warner, WSJ reports
-

 Business4 days ago
Expert Picks for Every Need
-

 Sports3 days ago
India men’s 4x400m and mixed 4x100m relay teams register big progress | Other Sports News
-

 Business6 days ago
Login and Checkout Issues Spark Merchant Frustration
-
Business3 days ago
No Jackpot Winner, Prize to Climb to $231 Million
-

 Crypto World7 days ago
Bitcoin enters the public bond market as Moody’s gives a first-of-its-kind crypto deal a rating
-
Crypto World7 days ago
Bitcoin stalls below key resistance as technical signals skew bearish
-

 Tech5 days ago
Commonwealth Fusion Systems leans on magnets for near-term revenue
-

 Politics7 days ago
Starmer’s centre has collapsed, and the left was right all along
-

 Crypto World6 days ago
Ripple rolls out enterprise crypto treasury platform for corporates
-

 Fashion1 day ago
Massimo Dutti Offers Inspiration for Your Summer Mood Board
-

 Crypto World6 days ago
Why It’s Partnering, Not Issuing
-

 Business3 days ago
Akebia Therapeutics, Inc. (AKBA) Discusses Pipeline Progress and Strategic Focus on Kidney Disease Treatments at R&D Day – Slideshow
-

 Tech7 days ago
Solo Leveling: Ranking All Sung Jinwoo Shadows by Power
-

 Tech6 days ago
Drawing Tablet Controls Laser In Real-Time
-
Sports6 days ago
Tom Pelissero Drives the Final Nail in the Coffin
You must be logged in to post a comment Login