
Crypto World
Pi Network Unveils 2 Major Updates but PI Token Dumps to a New All-Time Low

The Core Team behind the controversial project continues to improve the user experience, and the latest set of updates is focused on the Pi App Studio.
However, it appears that the native token’s current situation cannot be positively influenced by any of these, as it has plunged once again to a fresh all-time low less than 10 days after the previous one.
What’s New on Pi App Studio
Ever since it released the Pi App Studio last year, the team has doubled down on improving the general experience, especially by introducing AI-related features. In its latest blog post on the matter, they outlined two major updates, one with AI functions and the other focused on backend support.
The latter enables persistent user experiences for newly created applications through the Pi App Studio. Consequently, devs who have created their own apps can “save and retrieve user-specific data across sessions.” According to the team, this would enable “experiences that continue even after users leave and return.”
The second big improvement is indeed centered on incorporating more artificial intelligence functions: an AI-assisted App Planning Phase. It allows devs to crystallize their initial idea into a more complete app concept in a “more interactive and dynamic way.”
Pi App Studio has released two updates to help creators build more engaging and useful app experiences.
1. Backend support enables persistent user experiences for newly created App Studio apps: Apps can save and retrieve user-specific data across sessions, enabling experiences… pic.twitter.com/IOoiSsgKeH
— Pi Network (@PiCoreTeam) July 7, 2026
The Pi App Studio updates now follow previous notable announcements from the team, such as unveiling SoloHost, Pi Sign-in, and PiVerify during Pi2Day on June 28.
PI Sees New ATL
No matter what kind of new updates the team is trying to introduce, the project’s native token just can’t catch a more permanent break. It has marked numerous all-time lows during this bear cycle in the past year, and the latest arrived hours ago.
PI flirted with the $0.11 support for several days, but the broader market’s retreat has pushed it south hard. The token is down by over 7% in the past day, while most of the market has slipped by 1-2%, and charted a new low of $0.1033 (according to CoinGecko). It has lost 10% weekly, but the macro scale is a lot more painful, showing a 96.5% drop from the all-time high in February 2025.

The post Pi Network Unveils 2 Major Updates but PI Token Dumps to a New All-Time Low appeared first on CryptoPotato.

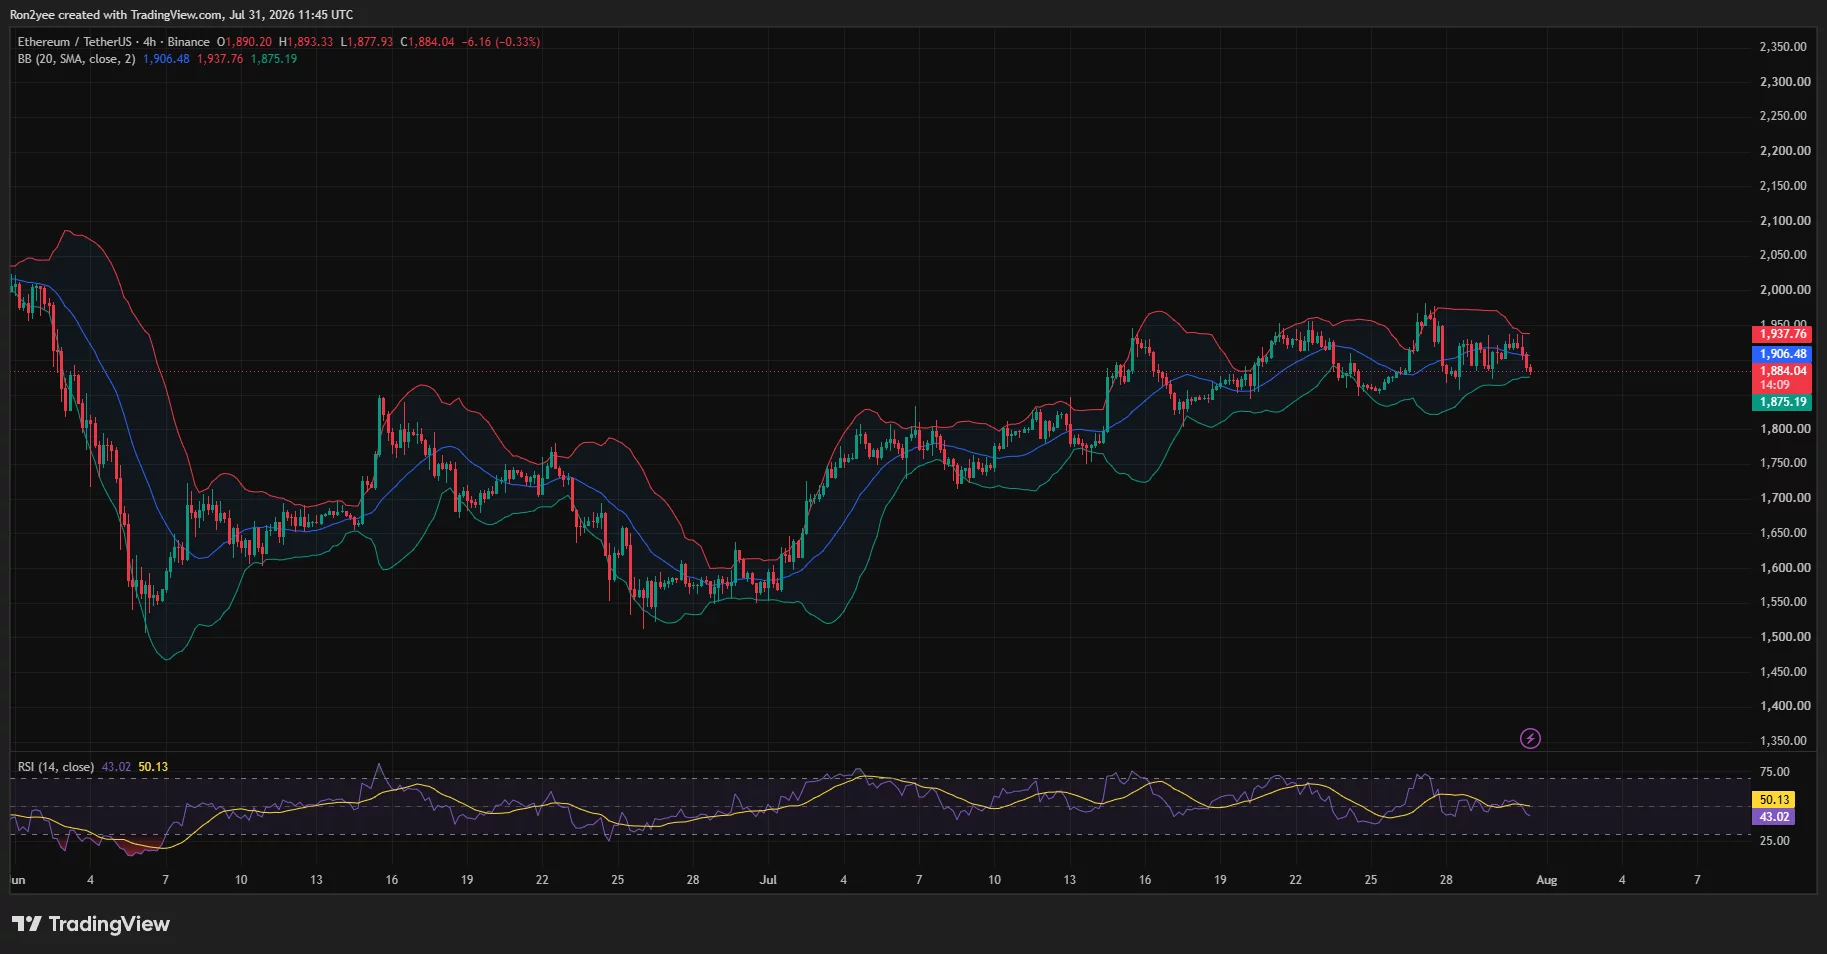
Ethereum price fell nearly 2% to about $1,883 on July 31 after another rejection below $2,000 weakened momentum and pushed the token toward a key technical support zone.
Summary
- Ethereum price traded near $1,883, down 1.8% on the daily chart.
- The 4-hour RSI dropped to 43.02, showing weakening short-term momentum.
- Support sits near $1,873–$1,875, with deeper liquidity around $1,850.
- Liquidation clusters near $1,935–$1,940 could attract price during a recovery.
Ethereum price action today
According to data from crypto.news, Ethereum (ETH) price extended its retreat on Thursday after buyers failed to sustain a move toward the $2,000 psychological level.
The token traded at approximately $1,883 at the time of the charts, down 1.82% on the day. ETH reached an intraday high of $1,936 before falling to a low near $1,878, showing that sellers remained active above $1,900.
Price action on the 4-hour chart shows Ethereum breaking below the middle Bollinger Band at $1,906. The move placed ETH close to the lower band at $1,875, where buyers may attempt to stabilize the decline.
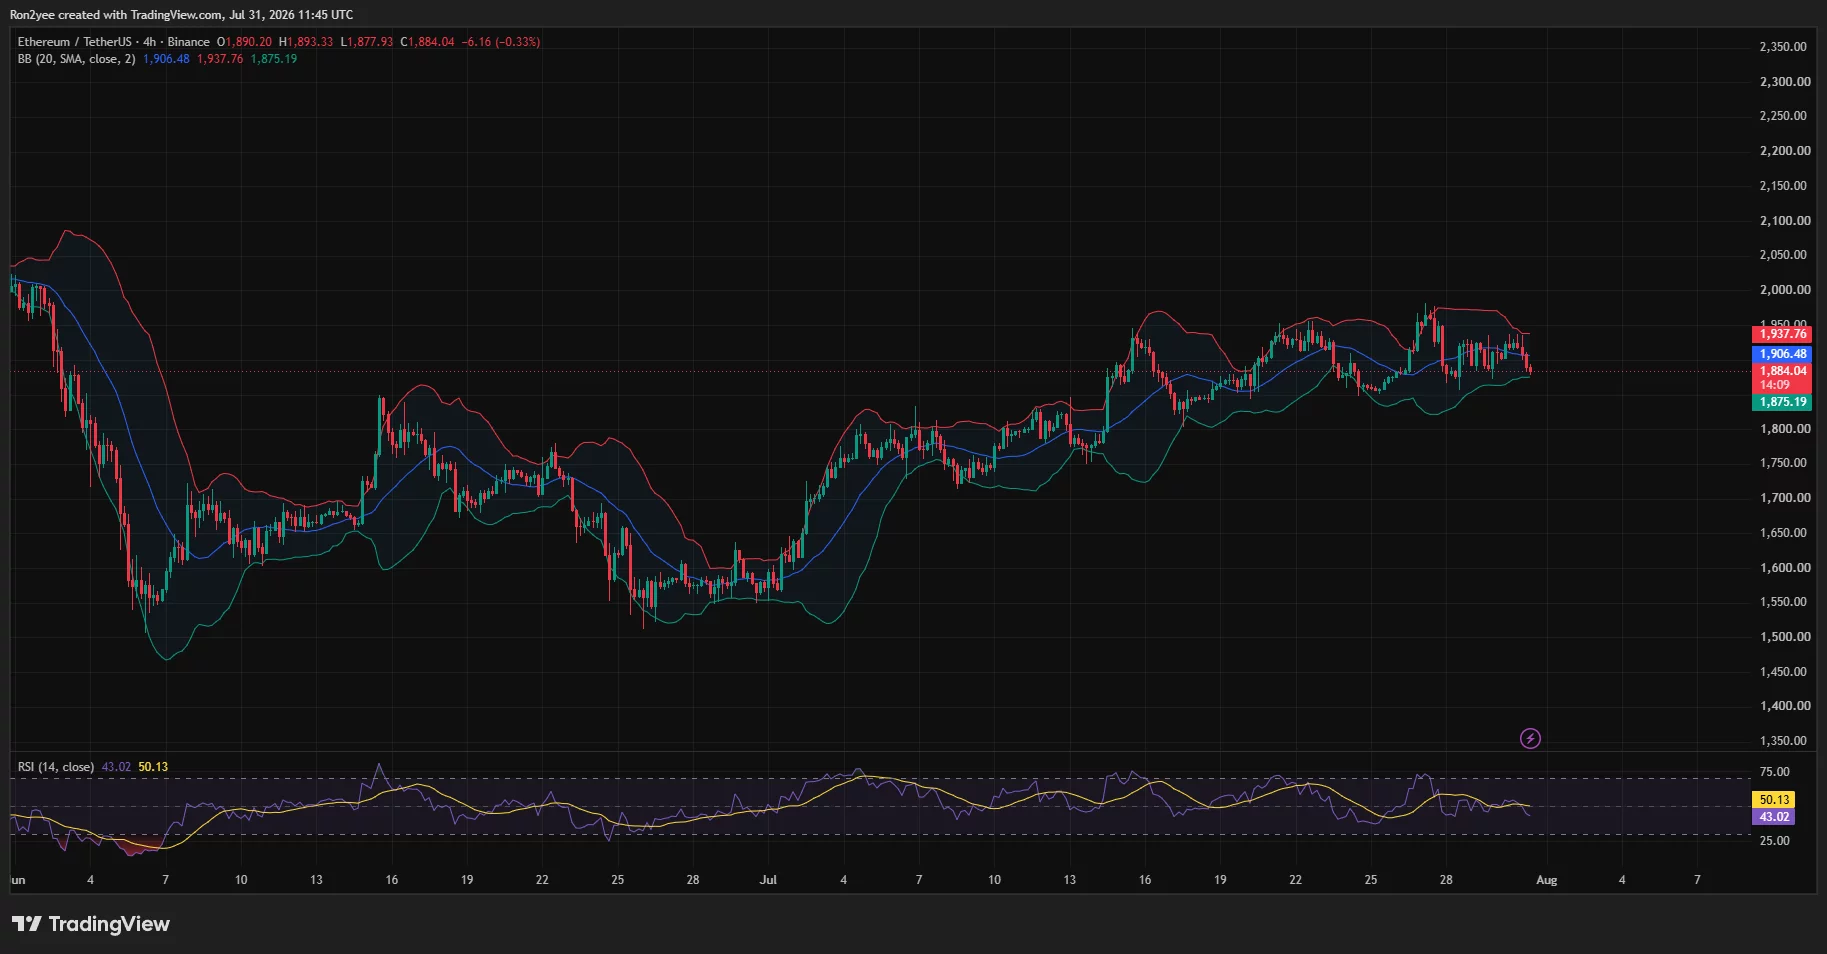
Short-term momentum has also deteriorated. The 4-hour Relative Strength Index fell to 43.02, below its moving average of 50.13. An RSI below 50 generally indicates that sellers have gained control, although the reading remains above the oversold threshold of 30.
Ethereum’s retreat follows several failed attempts to establish support above $1,930. Each rebound produced renewed selling, leaving the token inside a broader consolidation range instead of confirming a breakout.
What is driving the ETH decline?
Profit-taking near $1,950 and the continued defense of $2,000 appear to be the immediate technical drivers behind the decline.
The $2,000 level also sits close to the 50% Fibonacci retracement at $1,986.33 on the daily chart. That overlap has created a wider resistance zone where short-term traders may be closing positions rather than adding exposure.
Derivatives positioning likely amplified the pullback. The 3-day CoinGlass liquidation heatmap shows that ETH dropped sharply after trading around $1,920, passing through liquidity near $1,900 before reaching the upper $1,880s.
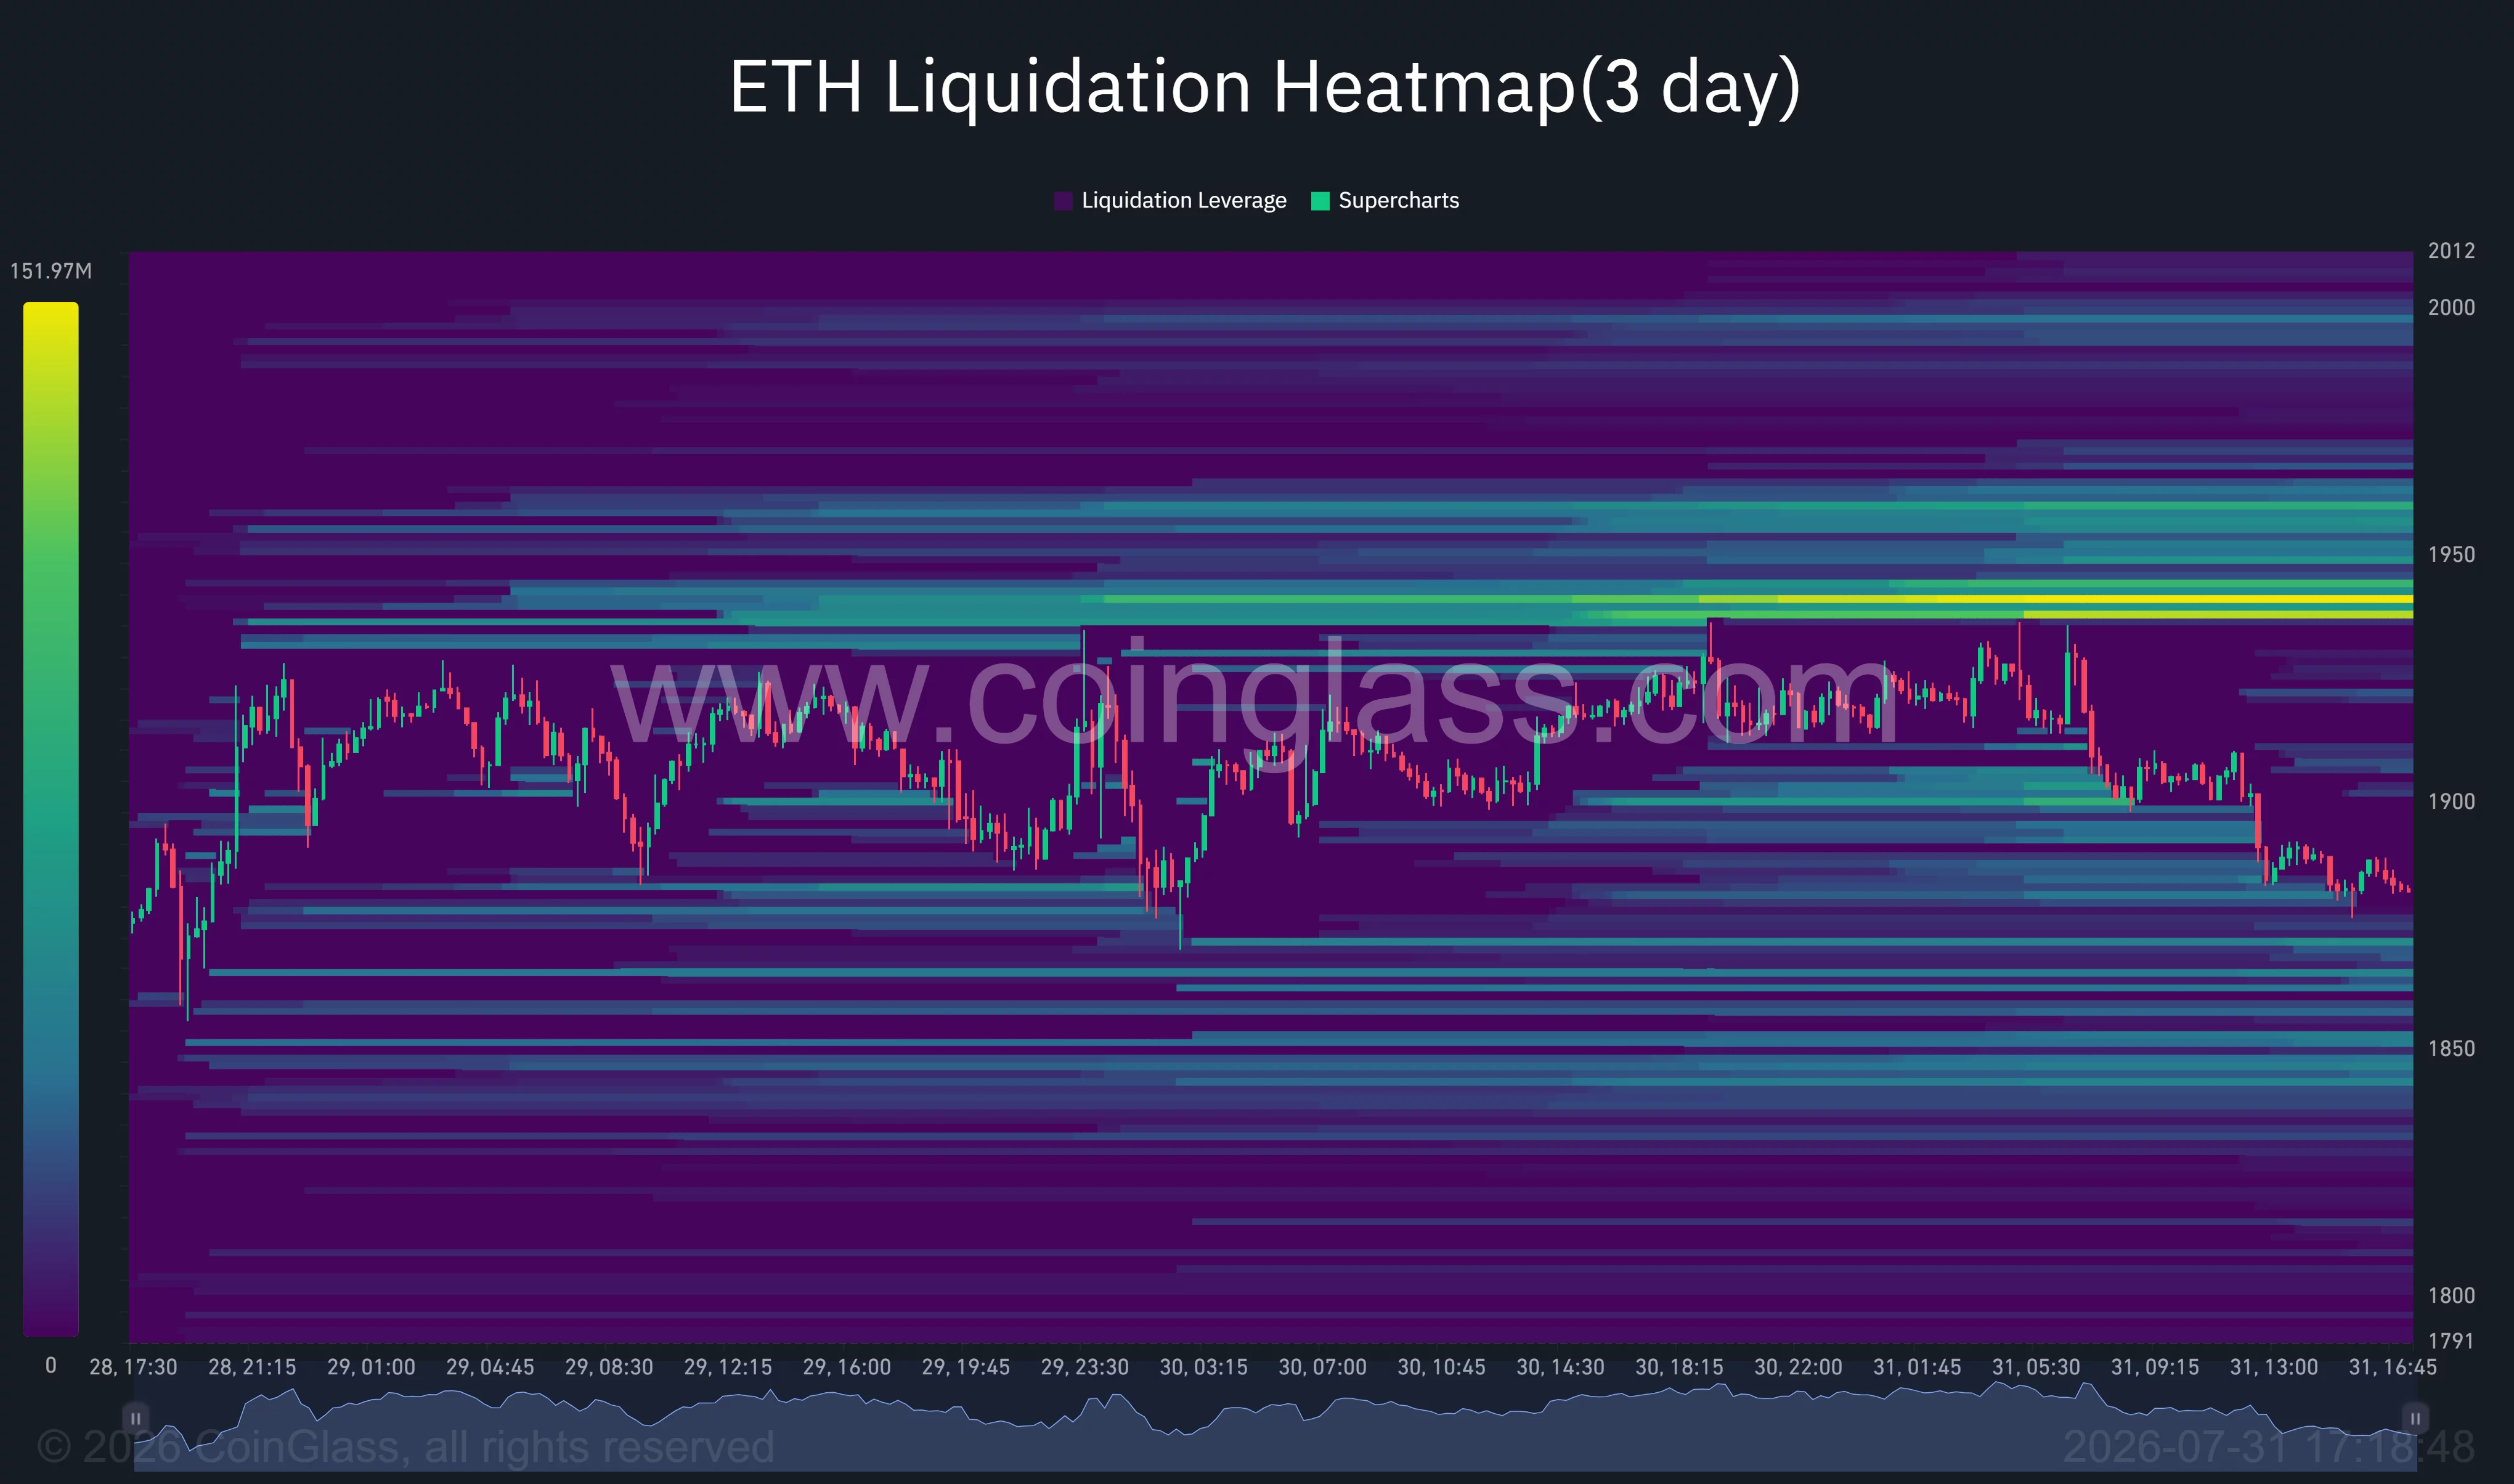
Leveraged traders who positioned for an immediate breakout above $2,000 faced pressure as the price moved in the opposite direction. Forced long closures can accelerate a decline because exchanges sell the underlying position when margin requirements are no longer met.
Broader conditions remain challenging for risk assets. The Federal Reserve’s decision to maintain elevated interest rates has kept financing conditions restrictive for US investors, while geopolitical uncertainty in the Middle East has supported a more defensive market posture.
Ethereum has also lacked the sustained spot demand needed to separate from those macro pressures. Weak on-chain activity and redemptions from spot Ethereum exchange-traded products have reduced two potential sources of buying support.
Ethereum support at $1,873 faces a test
Ethereum is now testing an important technical area between $1,873 and $1,875.
The daily chart places the 0.618 Fibonacci retracement at $1,873.50, while the 4-hour lower Bollinger Band stands at $1,875.19. The convergence makes this range the first level bulls need to defend.
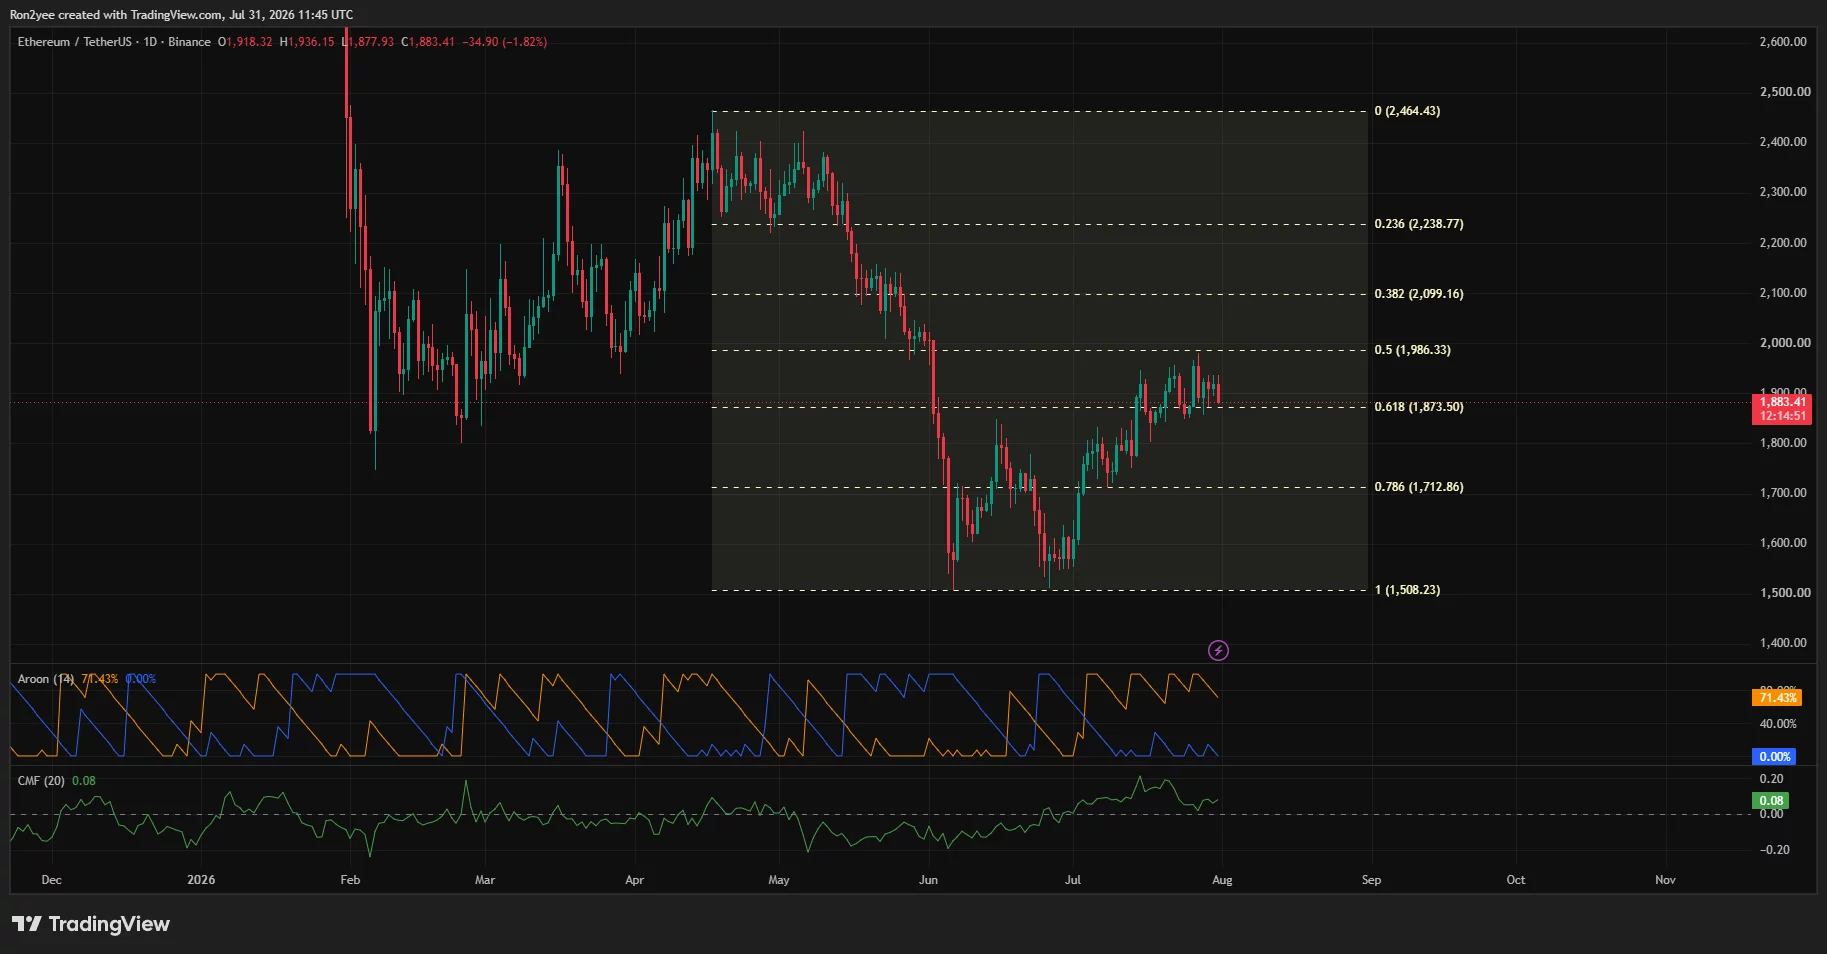
A daily close below $1,873 would weaken the recovery structure that developed from the late-June low. The liquidation heatmap points to additional liquidity between approximately $1,850 and $1,870, making that area the next potential downside target.
Below $1,850, attention would shift toward $1,800. Losing that psychological support could expose the 0.786 Fibonacci retracement at $1,712.86, although ETH would need a much deeper correction to test that level.
Some longer-term indicators remain constructive. Chaikin Money Flow stood at 0.08 on the daily chart, suggesting capital flows were still marginally positive despite the price decline. The Aroon readings also showed Aroon Up at 71.43 and Aroon Down at zero, indicating that the broader July recovery had not been fully invalidated.
Those signals contrast with the weaker 4-hour RSI, showing a market in which the medium-term recovery remains intact but near-term momentum favors sellers.
Liquidation heatmap points to $1,940 resistance
The largest nearby concentration of liquidation leverage sits around $1,935–$1,940, according to the 3-day heatmap.
That cluster could act as a price magnet if Ethereum rebounds from current support. A recovery above $1,906, the middle Bollinger Band, would be the first indication that short-term momentum is improving.
ETH would then face resistance at $1,938, which marks the upper Bollinger Band and overlaps with the main liquidation pocket. Clearing that area could open another test of $1,986 and $2,000.
Additional liquidity appears near $1,950–$1,965 and immediately below $2,000. These clusters could fuel a short squeeze if buyers reclaim $1,940, but they may also attract fresh selling as traders defend the wider resistance zone.
Failure to recover $1,900 would keep the downside scenario active. In that case, leveraged positions accumulated around $1,875 and $1,850 could become vulnerable.
What analysts are saying about Ethereum
Crypto analyst Michaël van de Poppe described the current decline as a lower-timeframe correction while maintaining a positive longer-term view.
“ETH is holding above $1,800 and as long as that’s the case, there’s not much to worry,” van de Poppe said. He added that he still expects Ethereum to reach $2,500 in the coming months.
Analyst Ted Pillows identified a narrower support range. He said momentum was weakening after ETH fell below $1,900 but noted that the token remained above its $1,850 support zone.
“As long as it holds, I think ETH is more likely to rally towards $2,000.”
The charts therefore place Ethereum at a decision point. Holding $1,873–$1,850 would preserve the possibility of another move toward $1,940 and $2,000. A sustained breakdown below that range would instead reinforce the rejection and raise the risk of a deeper pullback toward $1,800.
Disclosure: This article does not represent investment advice. The content and materials featured on this page are for educational purposes only.


The state is seeking at least $36 billion in damages from the prediction market platform it calls an unlicensed gambling operation, and has filed for a temporary restraining order to halt its contracts immediately.
Summary
- New York Attorney General Letitia James and Governor Kathy Hochul sued KalshiEX on July 31, 2026, in New York Supreme Court, Manhattan, seeking at least $36 billion in compensatory damages, triple-gains penalties, and $100,000 per unauthorized sports wagering offer.
- The state simultaneously filed a motion for a temporary restraining order to halt Kalshi’s event contracts in New York immediately, citing ongoing harm to consumers including users under the legal gambling age of 21.
- Kalshi users bet over $1 billion monthly on the platform in 2025, with 90% of that volume on sports, according to figures cited in the AG’s own release, a concentration that makes the bipartisan Senate proposal to ban sports event contracts existential for the business.
- Kalshi, valued at roughly $22 billion with annualized volume of approximately $178 billion, calls the suit “political theater” and argues its CFTC registration as a designated contract market means exclusive federal oversight.
- A bipartisan coalition of 38 state attorneys general has already filed an amicus brief supporting Massachusetts in a parallel case, signaling that the enforcement wave extends far beyond the 13 states with active litigation.
The lawsuit that prediction markets knew was coming
Two days after the Second Circuit denied Kalshi emergency relief on July 29, New York filed the most aggressive state action yet against the prediction market industry. The suit arrived with a coordinated announcement from AG James and Governor Hochul, counts spanning multiple bodies of state law, a $36 billion damages demand, and a motion for an immediate restraining order.
The $36 billion figure, reported by The Block based on the court filings, is roughly 1.6 times Kalshi’s reported valuation. It is the number every major outlet is leading with, and it signals that New York is treating this as a revenue-extraction case, not merely a cease-and-desist.
This piece examines the filing, the legal arguments on both sides, the federal regulator caught between them, and what the case means for an industry now fighting a war on two fronts: in courtrooms and in Congress.
What the complaint actually alleges
The core claim is straightforward: Kalshi is running an unlicensed gambling business in New York.
The AG’s office says the platform lets users place wagers on uncertain future events, from Super Bowl outcomes to reality TV winners to election results, without a Gaming Commission license and without paying state gaming taxes. New York treats these as bets, not derivatives, regardless of Kalshi’s CFTC registration.
The complaint goes further. It alleges Kalshi allows users aged 18 to 20 to place bets, violating New York’s 21-and-older minimum for mobile sports betting. It alleges the platform offered wagers on games involving New York college teams, a separate violation under state law.
The AG’s investigators placed test wagers from New York accounts as evidence: four “Yes” contracts on a UConn-Michigan basketball game at $1.14 in April 2026, and ten contracts on the winner of “Big Brother” in July 2026. Both transactions completed without obstruction.
The filing also introduces a count under the federal Interstate Wire Act, alleging Kalshi used wire communications to transmit bets across state lines. This is significant because it widens the legal exposure beyond state gambling statutes into federal criminal law, giving the state an argument that operates independently of the preemption question. Even if Kalshi’s CFTC registration were found to preempt state gambling law, the Wire Act is a federal statute, and the state is arguing that Kalshi violates it.
The complaint details the investigative methods in unusual specificity. Rather than relying on industry reports or third-party data, the OAG built its case from the inside. Investigators created accounts, placed real wagers, and documented each step. This matters for the TRO motion: the state can present firsthand evidence that illegal gambling is actively occurring in New York, not merely that it could occur.
“Prediction markets like Kalshi are gambling platforms, plain and simple,” James said in a statement accompanying the filing.
Governor Hochul framed the action around consumer protection, saying Kalshi “has chosen to ignore New York’s gaming laws, which exist to protect consumers, prevent problematic gambling, deliver funding for critical public services, and ensure that every company plays by the same rules.” The coordinated announcement from both the AG and the Governor signals that this is not a routine regulatory action. It is a political priority.
The $36 billion in damages and the TRO
New York is not seeking a slap on the wrist. The headline number is at least $36 billion in compensatory damages, pending a full accounting of Kalshi’s operations. The remedies demand:
- A permanent injunction barring Kalshi from operating unlicensed gambling in the state
- A temporary restraining order halting Kalshi’s event contracts in New York immediately
- A full accounting of every customer bet and loss processed through the platform
- Forfeiture and disgorgement of all gains the state deems illegal
- Restitution to affected consumers
- Penalties of three times Kalshi’s gains under Penal Law Section 80.10
- A fine of $100,000 per unauthorized sports wagering offer under the Racing Law
The TRO is the near-term threat. If granted, Kalshi would need to suspend operations in New York while the case proceeds, potentially for years. The triple-damages provision is the long-term one. At $36 billion, New York is claiming a figure that exceeds the platform’s reported valuation of $22 billion by more than 60%.
The per-offer fine structure adds another layer. The AG’s release notes that Kalshi users bet over $1 billion monthly in 2025, with 90% of that volume on sports. Each unauthorized sports offering carries a $100,000 fine under the Racing Law. At that volume, the per-offer penalties alone could produce a figure in the hundreds of millions.
The damages calculation itself reveals the state’s theory of the case. New York is not treating Kalshi as a minor regulatory violator that failed to file paperwork. It is treating Kalshi as a gambling operation that processed billions in unlicensed wagers over multiple years, and it wants the full economic benefit of that activity returned. The $36 billion figure presumably reflects the total volume of wagers placed by New York users, or a substantial fraction of it, multiplied by the treble-damages provision. The final number will depend on the full accounting the state is requesting, but the opening demand is meant to establish the scale of the alleged violation.
The TRO motion deserves separate attention because it operates on a different timeline from the main case. A TRO hearing can happen within days or weeks, while the underlying lawsuit could take years. If New York secures the restraining order, Kalshi faces an immediate operational decision: comply and lose the New York market, or challenge the order and risk contempt proceedings. Either outcome sets a precedent that other states can follow. Michigan and Nevada secured their own TROs through similar procedural mechanisms, and each one reduced Kalshi’s geographic footprint.
The $1 billion monthly number and why it matters
The AG’s release includes a figure that has received less attention than the $36 billion headline: Kalshi users bet over $1 billion every month on the platform in 2025, and 90% of that money went to sports betting.
This is the number that makes the bipartisan Senate proposal to ban CFTC-licensed platforms from offering sports event contracts existential. Sports are not a side product for Kalshi. They are the product. If sports contracts are removed, whether by state enforcement or federal legislation, the platform loses nine-tenths of its recorded consumer activity.
The figure also undercuts Kalshi’s framing of its offerings as sophisticated financial derivatives. A billion dollars a month on the Super Bowl, the NBA, and college basketball looks like a sportsbook by any name. New York is making exactly that argument, and the AG’s investigators have the receipts.
The concentration matters for investors and market participants as well. Kalshi’s $22 billion valuation implies a diversified event-contract platform serving a range of use cases: elections, weather, economics, entertainment. The AG’s data shows something closer to a sports gambling platform with a derivatives label. If the valuation was underwritten on the assumption of product diversity, the 90% sports concentration represents a disclosure risk independent of the legal outcome.
Kalshi’s federal preemption defense
Kalshi’s position rests on a single legal premise: that its 2020 registration with the CFTC as a designated contract market means its event contracts are regulated derivatives under the Commodity Exchange Act, subject to exclusive federal oversight.
The company calls the suit “political theater” and argues states cannot simply shut down a federally licensed exchange. The framing is deliberate. Kalshi wants this treated as a jurisdictional question, not a gambling question.
It is the strongest version of their argument, and it carries legal weight. The CFTC itself has backed the position, filing lawsuits against multiple states and claiming exclusive regulatory authority over prediction markets. On the same day New York filed its suit, the CFTC filed an emergency counter-motion in Manhattan federal court less than one hour before the state complaint dropped, attempting to reassert federal jurisdiction preemptively.
The federal regulator has now challenged state enforcement in at least nine states, including filing suit against Arizona, Connecticut, and Illinois in April 2026. The CFTC is not a passive bystander in this dispute. It is an active combatant on Kalshi’s side.
Why the federal shield is cracking
On July 7, U.S. District Judge Analisa Torres denied Kalshi’s preliminary injunction against New York’s Gaming Commission enforcement. Her reasoning cut directly at the preemption argument.
Torres cited Section 2 of the Commodity Exchange Act, which states the law “shall not supersede or limit the jurisdiction conferred on other regulatory authorities under the laws of the United States or of any state.” She wrote that “Congress did not intend to regulate so broadly as to exclude all state gambling laws from regulating transactions involving swaps.”
Her conclusion was blunt: “There is nothing preventing Kalshi from obtaining a license pursuant to New York law.”
The Second Circuit denied Kalshi emergency relief on July 29. With the appellate safety net gone, the state had a clear path to file.
The Torres ruling matters beyond New York because it provides a template. Other states facing Kalshi’s preemption argument can cite it directly. The decision rejects the premise that CFTC registration creates a blanket exemption from state gambling law, and it does so by citing the Commodity Exchange Act’s own text. Before Torres, Kalshi could argue that no court had squarely addressed the question. That argument is gone.
The legal logic is worth following in detail. Kalshi’s preemption claim rests on the idea that CFTC registration means its products are regulated derivatives, full stop. Torres responded that the Commodity Exchange Act explicitly preserves state jurisdiction, that the products in question resemble gambling under New York law, and that nothing in federal statute prevents Kalshi from obtaining a state gaming license if it wants to operate in New York. The decision does not say Kalshi cannot exist. It says Kalshi cannot avoid state gambling law by pointing to a federal license that, by its own statute’s terms, was never meant to override it.
The Second Circuit’s refusal to grant emergency relief on July 29 reinforced this reasoning. It did not issue a full opinion, but the denial means Kalshi failed to show a likelihood of success on the merits, which is the standard for emergency relief. Two levels of federal courts have now declined to protect the company from state enforcement.
The result is a genuine constitutional question about the boundary between federal commodity regulation and state gambling law. Kalshi needs either a circuit court reversal or Congressional action to restore the shield it thought it had.
The 38-state coalition
The count that matters is not 13 states with active litigation. It is 38.
In April 2026, James joined a bipartisan coalition of 38 state attorneys general filing an amicus brief supporting Massachusetts in its parallel case against Kalshi. The coalition spans from Alabama to Wisconsin, including red states, blue states, and the District of Columbia. The full list: Alabama, Alaska, Arizona, Arkansas, California, Colorado, Connecticut, Delaware, Hawaii, Idaho, Illinois, Iowa, Kansas, Louisiana, Maine, Maryland, Michigan, Minnesota, Mississippi, Nebraska, Nevada, New Jersey, New Mexico, New York, North Carolina, Ohio, Oklahoma, Oregon, Pennsylvania, Rhode Island, South Carolina, South Dakota, Tennessee, Utah, Vermont, Virginia, Wisconsin, and DC.
On the same day the AGs filed, the CFTC filed its own amicus brief at the Massachusetts Supreme Judicial Court asserting exclusive federal jurisdiction, creating a direct confrontation between the federal regulator and a supermajority of state enforcement agencies.
New York is not operating in isolation. The suit fits into a pattern of escalating state enforcement that has accelerated through 2026:
Massachusetts has a court order restricting Kalshi. Polymarket has countersued the state, opening a second front.
Michigan secured a temporary restraining order against the platform under AG Dana Nessel, making it the third state to obtain a court order.
Nevada issued a TRO covering sports, election, and entertainment contracts. Kalshi responded by removing those categories for Nevada users, effectively conceding the state’s authority in practice while contesting it in court.
Washington holds its own court order restricting the platform. The state’s Gambling Commission issued a cease-and-desist, and Kalshi did not challenge it in court.
Wisconsin handed down an adverse ruling the week of July 28, adding another state to the enforcement column in a decision that received less coverage than the New York and Massachusetts actions but follows the same legal reasoning.
New York itself previously sued Coinbase and Gemini in April 2026 on similar prediction-market allegations. That suit broadened the target set beyond pure-play prediction platforms, signaling that New York views any company offering prediction-style products to state residents as subject to gaming law, regardless of whether the company’s primary business is elsewhere.
In Congress, a bipartisan Senate proposal has emerged that would ban CFTC-licensed prediction market platforms from offering sports event contracts, which would remove the category that accounts for 90% of Kalshi’s recorded volume.
The arithmetic that matters
Kalshi’s reported valuation of $22 billion rests on the assumption that its CFTC registration provides a durable regulatory moat. The annualized transaction volume of $178 billion flows through that assumption. If the federal preemption argument fails at the circuit level, the business model does not downgrade gracefully.
The platform cannot operate as a state-licensed gambling business without fundamental changes to its product, its economics, and its user base. State gaming licenses come with specific requirements: age floors (21 in New York for mobile betting), tax obligations, product restrictions, and compliance infrastructure that a CFTC-registered exchange was never built to support.
Nevada’s example is instructive. When the state issued its TRO, Kalshi did not fight to keep sports, election, and entertainment contracts available to Nevada users. It removed them. If that pattern repeats across additional states, the platform’s addressable market contracts with each new enforcement action.
The numbers tell the story in three layers. First, $36 billion in damages sought in New York alone, exceeding the company’s valuation by 60%. Second, 38 state attorneys general aligned against the federal preemption argument, representing a supermajority of American enforcement capacity. Third, 90% of Kalshi’s monthly volume concentrated in sports, the single category most vulnerable to both state enforcement and the pending Senate ban.
The counter-argument deserves its strongest form. Kalshi’s $178 billion in annualized volume proves genuine consumer demand for event contracts. The CFTC registration is not a legal fiction, and federal regulators are actively fighting to preserve federal jurisdiction. The Commodity Exchange Act does grant the CFTC authority over designated contract markets, and a reasonable reading of federal preemption could conclude that state gambling law should not apply to products traded on a federally licensed exchange. If the CFTC prevails at the appellate level, or if Congress acts to clarify federal preemption, the state cases collapse. Kalshi’s appeal of the Torres ruling remains live, and the Second Circuit has not yet ruled on the merits.
There is also a policy argument that Kalshi rarely makes explicitly but that supports its position. Prediction markets have informational value. Research from academic institutions and the CFTC’s own prior statements have recognized that event contracts can produce useful price signals about future events. A state-by-state licensing regime could effectively kill a market structure that regulators, academics, and the public have found valuable for forecasting elections, economic indicators, and policy outcomes.
But the burden has shifted. Two federal courts have declined to protect Kalshi from state enforcement. Thirty-eight attorneys general have aligned against the federal preemption argument. And 90% of Kalshi’s volume is concentrated in sports, the single category most politically vulnerable. The question is no longer whether states can regulate prediction markets. The question is whether Kalshi can find a court that says they cannot.
What to watch
- The TRO hearing in New York Supreme Court. If granted, Kalshi must suspend operations in the state while the case proceeds. The timeline and conditions of this hearing will set the pace for the entire case.
- The Second Circuit appeal of Judge Torres’s July 7 ruling. If the court reverses on federal preemption, the state enforcement wave stalls. If it affirms, expect additional state filings within weeks.
- The CFTC’s emergency motion filed hours before New York’s suit. The federal court’s handling of this motion will signal whether the judiciary treats CFTC registration as a meaningful shield or a regulatory label.
- Congressional action on the bipartisan Senate proposal to ban sports event contracts. At 90% of Kalshi’s volume, this would be a structural blow regardless of court outcomes.
- Kalshi’s operational response in states with active enforcement. Nevada’s pattern, removal of categories rather than legal confrontation, is the leading indicator of how the business adapts under pressure.
Frequently asked questions
What did New York sue Kalshi for?
New York filed a lawsuit alleging Kalshi operates an unlicensed gambling business by offering wagers on sports, entertainment, and election outcomes without a Gaming Commission license and without paying state gaming taxes. The suit includes counts under the state constitution, Penal Law gambling provisions, the Racing Law, and the federal Interstate Wire Act.
How much is New York seeking in damages?
The state is seeking at least $36 billion in compensatory damages, pending a full accounting of Kalshi’s operations. Additional penalties include three times the company’s gains under Penal Law and $100,000 per unauthorized sports wagering offer under the Racing Law.
What is the temporary restraining order?
Alongside the lawsuit, New York filed a motion for a TRO to halt Kalshi’s event contracts in the state immediately while the case proceeds. If granted, Kalshi would need to suspend operations in New York, potentially for years.
What is Kalshi’s defense?
Kalshi argues that its registration with the CFTC as a designated contract market since 2020 means its event contracts fall under exclusive federal oversight and that states cannot regulate them as gambling. The company calls the suit “political theater.”
How did the court rule on federal preemption?
U.S. District Judge Analisa Torres denied Kalshi’s preliminary injunction on July 7, ruling that the Commodity Exchange Act does not prevent states from applying their gambling laws to event contracts. The Second Circuit denied emergency relief on July 29.
How many states are aligned against Kalshi?
A bipartisan coalition of 38 state attorneys general filed an amicus brief supporting Massachusetts in a parallel case. At least five states, Massachusetts, Michigan, Nevada, Washington, and Wisconsin, have active court orders or adverse rulings restricting Kalshi’s operations.
What role is the CFTC playing?
The CFTC has positioned itself as the exclusive federal regulator of prediction markets, filing lawsuits against multiple states and an emergency motion less than one hour before New York’s suit. The agency has challenged state enforcement in at least nine states and filed an amicus brief directly opposing the 38-state attorney general coalition.
Could this lawsuit shut down prediction markets entirely?
The New York case alone would not end the industry, but it tests whether CFTC registration shields platforms from state gambling laws. With 38 attorneys general aligned against the federal preemption argument and 90% of Kalshi’s volume concentrated in sports betting, the combination of state enforcement and the pending Senate ban on sports event contracts could force a fundamental restructuring of the business model. This is educational analysis, not investment advice.
Disclaimer: This article is for informational purposes only and does not constitute legal, financial, or investment advice. The information presented reflects the state of events as of July 31, 2026, and may change as legal proceedings develop. Readers should consult qualified professionals before making decisions based on this material.


Banca d’Italia has released a July 2026 study finding that stablecoin remittances do not consistently beat traditional transfer services on cost or speed.
Summary
- Ten USDC corridors produced total remittance costs ranging from 0.30% to nearly 9%, researchers found.
- Under 20 minutes was achievable where instant payment systems supported both fiat conversion endpoints efficiently.
- Three corridors beat Wise, while four cost more, showing stablecoin savings remained highly corridor-specific overall.
Researchers executed real transfers of 200 USDC across ten corridors linking Italy with Argentina, Brazil, South Africa, the United Arab Emirates and Japan.
The mystery-shopping study recorded total costs from 0.30% to almost 9%. The blockchain leg averaged only 0.4%, while exchange purchases, funding methods, withdrawals and foreign-exchange conversion produced most of the expense. The authors said stablecoins showed “no systematic cost advantage” over traditional channels.
Stablecoin remittance costs varied sharply by corridor
The Italy-to-Argentina transfer was the cheapest at 0.30%, while Argentina-to-Italy cost 8.96%. The study warned that the low outbound Argentina result partly reflected differences between the country’s official and market exchange rates, rather than blockchain efficiency alone.
Brazil-to-Italy cost 2.21%, compared with 2.70% in the opposite direction. South Africa-to-Italy cost 5.44%, while Italy-to-South Africa reached 4.58%. The two UAE routes were among the most expensive at 7.20% and 8.95%, partly because card funding and withdrawal charges increased the total.
USDC beat Wise in only three comparable routes
Banca d’Italia compared its transactions with Wise simulations for the same $200 amount. USDC was cheaper in three routes: Italy to Argentina, Italy to South Africa and Brazil to Italy. It was more expensive in four, including both UAE routes and Italy to Brazil.
The researchers cautioned that the transfers and Wise simulations occurred on different dates. They also described the World Bank comparison as an indicative benchmark rather than a like-for-like test. The paper covers one stablecoin and a limited number of transactions, so its findings “cannot be readily generalized” to every provider or corridor.
Fast domestic payments determined transfer speed
The onchain portion took less than 15 minutes in seven of eight directly comparable corridors. However, complete settlement depended on the banking systems used to fund exchanges and withdraw local currency.
Transfers involving Italy’s TIPS, Brazil’s Pix and Argentina’s Transferencias 3.0 finished in under 20 minutes. South African routes took one or two business days because standard bank transfers slowed the fiat endpoints. The study therefore found that stablecoin rails and domestic instant-payment systems worked as complements, not substitutes.
Japan presented a separate problem. The Japan-to-Italy transfer cost 1.6%, but regulatory limits required an unhosted wallet and fragmented transactions, making the process unsuitable for a direct timing comparison. The reverse route cost 1.3% without completing the final off-ramp.
Better on-ramps may matter more than cheaper blockchains
The findings support Banca d’Italia Governor Fabio Panetta’s May assessment that stablecoins may work in selected corridors but do not provide a universal answer to expensive remittances. He argued that regulators should improve domestic payment infrastructure and connect fast-payment systems across borders.
A March 2026 BIS paper reached a related conclusion, identifying weak interoperability, fragmented standards and institutional differences as the main barriers to cheaper cross-border payments. That suggests blockchain settlement alone cannot remove compliance, banking and local-currency bottlenecks.
Industry deployments continue to test the other side of the argument. As crypto.news reported, Borderless.xyz found competitive stablecoin pricing across 260 business-payment corridors during the second quarter. In related coverage, a Hyundai trial moved $20,000 between the U.S. and Mexico in about seven minutes, while SBI Remit partnered with Fasset to develop stablecoin remittance infrastructure.
Those cases do not directly contradict the central-bank experiment. They involve different transfer sizes, business models and endpoints. The next step is broader testing across more tokens, providers, dates and transaction amounts, with full disclosure of exchange spreads, withdrawal costs and local payout times.


The largest corporate bitcoin holder now sits $9 billion underwater on 843,775 coins, has sold bitcoin for the first time in four years, and is funding preferred dividends from the asset it promised never to sell.
Summary
- Strategy reported an $8.22 billion net loss for Q2 2026, driven almost entirely by an $8.32 billion unrealized markdown on its bitcoin holdings under fair-value accounting, swinging from a $10.02 billion profit in Q2 2025.
- The company holds 843,775 bitcoin purchased at an average of $75,476 per coin, now worth roughly $54.8 billion against a $63.7 billion acquisition cost, a gap of approximately $9 billion.
- Strategy sold bitcoin for the first time in four years, disposing of 3,588 coins for $218.4 million to fund preferred stock dividends, and has authorized a program allowing up to $1.25 billion in future sales.
- The capital structure has shifted toward preferred equity, with $14.4 billion in preferred stock outstanding, annual dividend obligations approaching $1.2 billion, and cash reserves of $3.75 billion covering roughly 2.1 years of payments.
- MSTR shares declined 0.67% in after-hours trading, a muted reaction that reflects how thoroughly the market has internalized Strategy as a leveraged bitcoin proxy rather than a software company.
The Q2 numbers in context
Strategy’s Q2 2026 earnings report arrived on July 30 with an $8.22 billion net loss, a $24.45 loss per diluted share, and the kind of headline that writes itself. The number missed analyst estimates of negative $7.52 per share by a margin wide enough to qualify as a different conversation.
Set it against Q2 2025 and the swing is $18.24 billion in a single year: from $10.02 billion in net income to $8.22 billion in net loss. The underlying software business generated $122.39 million in revenue, roughly in line with the $122.91 million estimate and up 6.9% year over year. Subscription revenue grew 54%. Gross margin held at 66.6%.
None of that mattered. The software business is not why anyone owns this stock, and it has not been for years. The $8.32 billion unrealized markdown on bitcoin holdings is what produced the operating loss, and the operating loss is what produced the headline. Everything else is a rounding error on a balance sheet dominated by 843,775 coins.
The accounting rule that swings billions
The loss is real in an accounting sense and meaningless in an operational one, and understanding why requires understanding a single rule change.
In 2025, Strategy adopted ASU 2023-08, the Financial Accounting Standards Board’s fair-value standard for digital assets. Under the previous impairment model, companies marked bitcoin down when prices fell but could not mark it back up when prices recovered. The new standard requires marking to market at the end of every quarter and running the change, up or down, straight through net income.
When bitcoin rises, Strategy books a gain. When bitcoin falls, Strategy books a loss. No coins need to change hands. The $8.32 billion markdown in Q2 2026 reflects the decline in bitcoin’s price during the quarter, from roughly $86,000 at the end of Q1 to $64,915 at the end of Q2. The $10.02 billion profit in Q2 2025 reflected a price increase over that quarter.
The accounting treatment turns Strategy’s income statement into a bitcoin price chart with a six-digit multiplier. This is not a criticism of the standard; fair-value accounting is what the industry asked for, and it replaced a rule that was genuinely worse. Under the old impairment model, Strategy once carried its bitcoin at below $16,000 per coin on its balance sheet while the market price sat above $94,000. The new rule fixes that distortion. But it introduces a different one: every quarterly earnings report is now dominated by a number that tracks bitcoin’s spot price, and every headline leads with a figure that tells you nothing about whether the company can meet its obligations.
The swing between quarters illustrates how extreme this effect can be. In Q2 2025, bitcoin rose and Strategy booked $10.02 billion in net income, the largest quarterly profit in the company’s history. One year later, bitcoin fell and Strategy booked an $8.22 billion loss, the largest quarterly loss. The software business, the thing the company actually operates, generated roughly the same revenue in both quarters. The P&L swung $18 billion on the movement of an asset that was neither bought nor sold during the period.
For investors who understand the accounting, the earnings figure is noise. For headline readers, it is the story. And for analysts who must issue estimates, it requires predicting bitcoin’s end-of-quarter price, which is another way of saying it requires predicting the unpredictable. The $7.52 consensus estimate for the loss per share was off by more than three times, not because the analysts were wrong about Strategy’s business, but because they were wrong about where bitcoin would close on June 30.
843,775 coins and a $9 billion gap
The holdings are the thesis and the risk in a single number. Strategy holds 843,775 bitcoin purchased at an average price of $75,476 per coin, for a total acquisition cost of approximately $63.69 billion. At the reporting date price near $64,915, the portfolio was worth roughly $54.8 billion.
The gap is approximately $9 billion. Strategy is underwater on its aggregate position.
Year to date, the company acquired 29,997 additional bitcoin, growing holdings by 25% in 2026 and 11% quarter over quarter. The BTC Yield metric, which measures the growth in bitcoin per assumed diluted share, stood at 4.5% for the first half. Management frames this as the core performance indicator: not the price of bitcoin, but the rate at which the company accumulates more of it per share outstanding.
The framing is self-serving, but it is not without logic. If bitcoin’s price eventually exceeds the cost basis, the accumulation during the drawdown period represents buying at a discount. If it does not, the accumulation represents compounding a loss. The metric assumes an outcome and measures progress toward it. No traditional financial metric works this way, which is either the point or the problem, depending on your priors about bitcoin’s long-term trajectory.
The doctrine that broke
For four years, one rule anchored the most influential trade in crypto: Strategy buys bitcoin and never sells it. Michael Saylor said it in earnings calls, in interviews, in tweets that became doctrine. The promise was the spine of the thesis, the thing that made MSTR a leveraged bitcoin proxy rather than a fund that might trade around its position.
In late May, Strategy sold 32 bitcoin for $2.5 million. In late June and early July, it sold 3,588 bitcoin for $218.4 million. The proceeds funded preferred stock dividend payments. On June 29, the board formalized the shift with the Digital Credit Capital Framework, authorizing up to $1.25 billion in bitcoin sales to fund dividends, reserve maintenance, and debt service.
The never-sell era is over. Saylor has reframed his advice, saying “never sell your bitcoin” was directed at individual holders, not a corporate treasury commitment. Whether the distinction holds depends on whether you think the people who bought MSTR at $400 understood it that way.
The sales are small relative to the position. The 3,588 coins sold represent roughly 0.4% of holdings. But the doctrine was not about the size of the sales. It was about the certainty that there would be none. Once that certainty breaks, every future quarterly report invites the question: how much did they sell this time?
The Digital Credit Capital Framework formalized on June 29 makes the conditions explicit. The framework authorizes bitcoin sales for three purposes: funding preferred stock dividends, maintaining the USD reserve at target levels, and servicing debt obligations. It also established a $1 billion buyback program for common stock and a $1 billion buyback program for STRC preferred shares. The architecture is designed to give management flexibility in both directions, buying bitcoin when conditions are favorable and selling when obligations require it.
Saylor framed the shift on the Q1 earnings call, saying Strategy would “probably sell some bitcoin to pay a dividend just to inoculate the market and send the message that we did it.” The word “inoculate” is revealing. It treats the sale as a vaccine against future panic, a controlled exposure to the idea that Strategy can sell, so that when it sells again, the reaction is smaller. Whether the inoculation worked is testable: the stock declined less than 1% on earnings day, suggesting the market has absorbed the new regime.
The question that remains unanswered is scale. Selling 3,588 coins to cover a quarterly dividend is manageable. Selling bitcoin to cover a $1.5 billion annual dividend load, if issuance continues at the current pace, is a different proposition. The framework permits it. The thesis requires it not to happen.
The capital structure underneath
Strategy has built the most complex capital structure in crypto, and possibly the most unusual one on any major exchange.
On the debt side, $6.71 billion in convertible notes remain outstanding, down 18% after the company repurchased $1.5 billion at an 8% discount. On the equity side, $14.4 billion in preferred stock is outstanding, spread across multiple series. The company raised $8.41 billion in Q2 alone through at-the-market stock offerings: $2.95 billion from common shares and $5.47 billion from STRC preferred stock. Year-to-date capital raised: $17.06 billion.
The preferred stock is where the pressure lives. STRC, listed on Binance as the company expanded its funding channels, trades near par and pays an 11.5% annual dividend. Strategy calls it “Digital Credit” and frames it as a new asset class. In practice, it is a preferred share that funds bitcoin purchases and requires cash dividends that bitcoin appreciation alone cannot pay.
Preferred dividends paid to date total $1.06 billion. The annual obligation is projected to rise from $217 million in 2025 to $904 million in 2026. As the company issues more STRC to buy more bitcoin, the dividend load grows. This is the flywheel running in reverse: the mechanism that accelerated accumulation during the bull market now accelerates cash outflows during the bear market.
Cash reserves stand at $3.75 billion, which CFO Andrew Kang says covers existing dividend and interest obligations for “more than 2.1 years.” The target range is two to three years of coverage, a window the company has publicly committed to maintaining. That is adequate today. Whether it remains adequate depends on how much more STRC the company issues and what bitcoin does over those two years.
The company also authorized a $1 billion share repurchase program for common stock. No buybacks have been executed to date. The authorization exists as optionality, not as a signal of intent: buying back stock while simultaneously issuing new stock would be contradictory, and Strategy is still firmly in issuance mode.
The convertible debt reduction deserves separate attention. By repurchasing $1.5 billion of convertible notes at an 8% discount, Strategy reduced its fixed-income obligations while taking advantage of the notes trading below par. This shifts the capital structure from debt (with maturity dates and conversion triggers) toward preferred equity (with no maturity but perpetual dividend obligations). The trade-off is clear: less risk of a forced conversion event, more risk of a perpetual cash drain. Whether that exchange favors shareholders depends entirely on how long bitcoin stays below cost basis.
Why the stock did not move
MSTR shares declined 0.67% to $97.09 in after-hours trading. For a company reporting an $8.22 billion loss against a $2.15 billion estimate, a sub-1% decline is remarkably composed.
The reason is straightforward: MSTR does not trade on earnings. It trades on bitcoin, and bitcoin’s price was already known. The quarterly loss was baked into the share price the moment bitcoin fell below Strategy’s cost basis. The earnings report confirmed what the market had been pricing for months.
This is what the stock price prediction analysis identified as the core dynamic: MSTR is a bitcoin derivative with a management fee attached. The management fee is the dilution from continuous stock issuance and the dividend obligations on preferred shares. As long as bitcoin’s expected return exceeds that fee, the stock has a thesis. When it does not, the stock trades below the net asset value of the bitcoin it holds.
At recent prices, Strategy’s market capitalization has traded at or below the value of its bitcoin holdings for the first time. The premium that powered the accumulation flywheel, allowing the company to issue stock worth more than the bitcoin it could buy with the proceeds, has compressed to zero or turned negative. Without a premium, the flywheel does not work.
Software subscription revenue growing 54% year over year is a footnote in this context, but it matters for one reason: it provides roughly $500 million in annualized revenue that partially offsets the cash costs of the capital structure. Strategy is not purely a holding company. It has a business that generates cash, even if that business is now roughly 2% of the enterprise value conversation.
The VanEck analysis published before earnings noted that credit risk has fallen as preferred equity value now surpasses convertible debt, removing the forced-sale scenario that would occur if convertible notes matured without refinancing. That structural improvement is real, even if the headline number obscured it. The market, which lives in the details rather than the headlines, appears to have noticed.
The arithmetic that matters
The sustainability question reduces to a comparison between cash coming in and cash going out.
Cash in: $3.75 billion in reserves, plus software revenue of roughly $500 million annualized, plus the ability to raise more capital through stock issuance (though the premium compression limits how accretive this can be).
Cash out: preferred dividends projected at $904 million in 2026, plus convertible note interest, plus operating expenses. The bitcoin monetization program provides a release valve, but exercising it means selling the asset the company exists to accumulate.
Kang’s 2.1-year coverage ratio assumes no additional preferred issuance. But Strategy has been issuing STRC aggressively to fund bitcoin purchases: $5.47 billion in Q2 alone. Each new issuance adds to the dividend obligation. If the company raises another $5 billion in STRC in the second half, the annual dividend load could approach $1.5 billion, compressing the coverage ratio to roughly 18 months even before any new bitcoin is purchased.
The counter-argument deserves its strongest form. Bitcoin at $64,915 is below Strategy’s cost basis of $75,476, but it remains above the levels that would threaten the capital structure. Kang noted that cash reserves cover obligations for more than two years, and the company has multiple levers: it can slow accumulation, reduce preferred issuance, use the monetization program selectively, or wait for bitcoin to recover. Saylor’s pre-earnings statement that “governments can delay bitcoin adoption; they cannot stop bitcoin” reflects a conviction that the cost basis will eventually be exceeded.
If bitcoin returns to $100,000, Strategy’s unrealized loss becomes an unrealized gain of roughly $20 billion, the market implications reverse entirely, and the entire narrative flips. The 843,775 coins accumulated during the drawdown become the trade of the decade. The model depends on that outcome. The question is whether the capital structure can survive long enough to see it.
The 91% probability estimate that MSTR enters the S&P 500 adds a structural catalyst. Index inclusion would force passive buying from every S&P 500 tracker fund, providing a floor of demand independent of bitcoin’s price. Whether that probability holds after the earnings miss and the premium compression is a question the index committee will answer in coming months.
What to watch
- Bitcoin’s price relative to the $75,476 cost basis. Every dollar above that line turns the unrealized loss into an unrealized gain. Every dollar below it widens the gap and increases pressure on the capital structure.
- The STRC dividend coverage ratio. If Strategy continues issuing preferred stock while bitcoin stays below cost basis, the cash coverage window shrinks. Watch for Kang’s quarterly guidance on reserve duration.
- The bitcoin monetization program. The $1.25 billion authorization gives Strategy room to sell, but each sale erodes the accumulation thesis. The pace and size of future sales will signal how much pressure the dividend obligations are creating.
- S&P 500 index committee decisions. Inclusion would be the most significant structural catalyst for the stock since the bitcoin strategy began. Exclusion or delay would remove a source of expected demand.
- The premium or discount to net asset value. When MSTR trades above the value of its bitcoin, the flywheel works. When it trades below, the company cannot issue stock accretively. The mNAV ratio is the single best indicator of whether the model is functioning.
Frequently asked questions
How much did Strategy lose in Q2 2026?
Strategy reported an $8.22 billion net loss for Q2 2026, driven by an $8.32 billion unrealized markdown on its bitcoin holdings under fair-value accounting. The loss per diluted share was $24.45, against analyst estimates of negative $7.52. The underlying software business generated $122.39 million in revenue, roughly in line with estimates.
Why did Strategy report such a large loss?
The loss is almost entirely a result of ASU 2023-08, the fair-value accounting standard Strategy adopted in 2025. The rule requires marking bitcoin to market price at the end of each quarter. Bitcoin fell from roughly $86,000 to $64,915 during Q2, producing the $8.32 billion unrealized markdown. No significant amount of bitcoin was sold to produce the loss.
How much bitcoin does Strategy hold?
Strategy holds 843,775 bitcoin purchased at an average price of $75,476 per coin, for a total acquisition cost of approximately $63.69 billion. At the Q2 reporting date price near $64,915, the holdings were worth roughly $54.8 billion, approximately $9 billion below cost.
Did Strategy sell bitcoin?
Yes. Strategy sold 3,588 bitcoin for $218.4 million in late June and early July 2026 to fund preferred stock dividend payments. This was the company’s first significant bitcoin sale in four years. The board has also authorized a program allowing up to $1.25 billion in future bitcoin sales.
What is STRC?
STRC is Strategy’s perpetual preferred stock, branded as “Digital Credit.” It trades near its $100 par value and pays an 11.5% annual dividend. Strategy has issued $14.4 billion in preferred equity, with STRC as the primary vehicle. The dividend obligations on preferred stock are the main reason the company has begun selling bitcoin.
Why did the stock barely move after the loss?
MSTR shares declined only 0.67% after hours because the market already knew bitcoin’s price. The quarterly loss was a function of bitcoin falling below Strategy’s cost basis, which had been reflected in the stock price for months. MSTR trades as a leveraged bitcoin proxy, and the earnings report contained no new information about bitcoin’s trajectory.
What is BTC Yield?
BTC Yield is Strategy’s proprietary metric measuring the growth in bitcoin holdings per assumed diluted share. It stood at 4.5% for the first half of 2026, reflecting the addition of 29,997 bitcoin year to date. Management frames this as the core performance indicator, though critics note it assumes bitcoin’s price will eventually exceed the cost basis.
Is Strategy’s model sustainable?
The model depends on bitcoin eventually exceeding Strategy’s $75,476 average cost. Cash reserves of $3.75 billion cover dividend and interest obligations for approximately 2.1 years. If bitcoin recovers, the accumulated position becomes enormously profitable. If it does not, and if the company continues issuing preferred stock, the dividend obligations could exhaust cash reserves and force larger bitcoin sales. The company has levers to manage this, including slowing accumulation and using the monetization program, but the capital structure is more leveraged to bitcoin’s price than at any point in the company’s history.
Disclaimer: This article is for informational purposes only and does not constitute financial, investment, or trading advice. Strategy’s stock and bitcoin are volatile assets with significant risk of loss. The information presented reflects the state of events as of July 31, 2026, and may change as market conditions develop. Readers should consult qualified professionals before making investment decisions.
BNB price rallied more than 5% before sellers halted the advance near $600, leaving the token at about $590 on July 31 as traders assessed whether its breakout can hold.
Summary
- BNB price climbed above $590 after breaking a descending trendline that had capped price for about 45 days.
- The daily price moved above the Bollinger Band’s $587.85 upper boundary, signaling strong but stretched momentum.
- A 3-day liquidation heatmap shows major liquidity clusters near $580 and $605–$610.
- 4-hour RSI remains bullish at 65.14, while the MACD continues to favor buyers.
BNB price action today
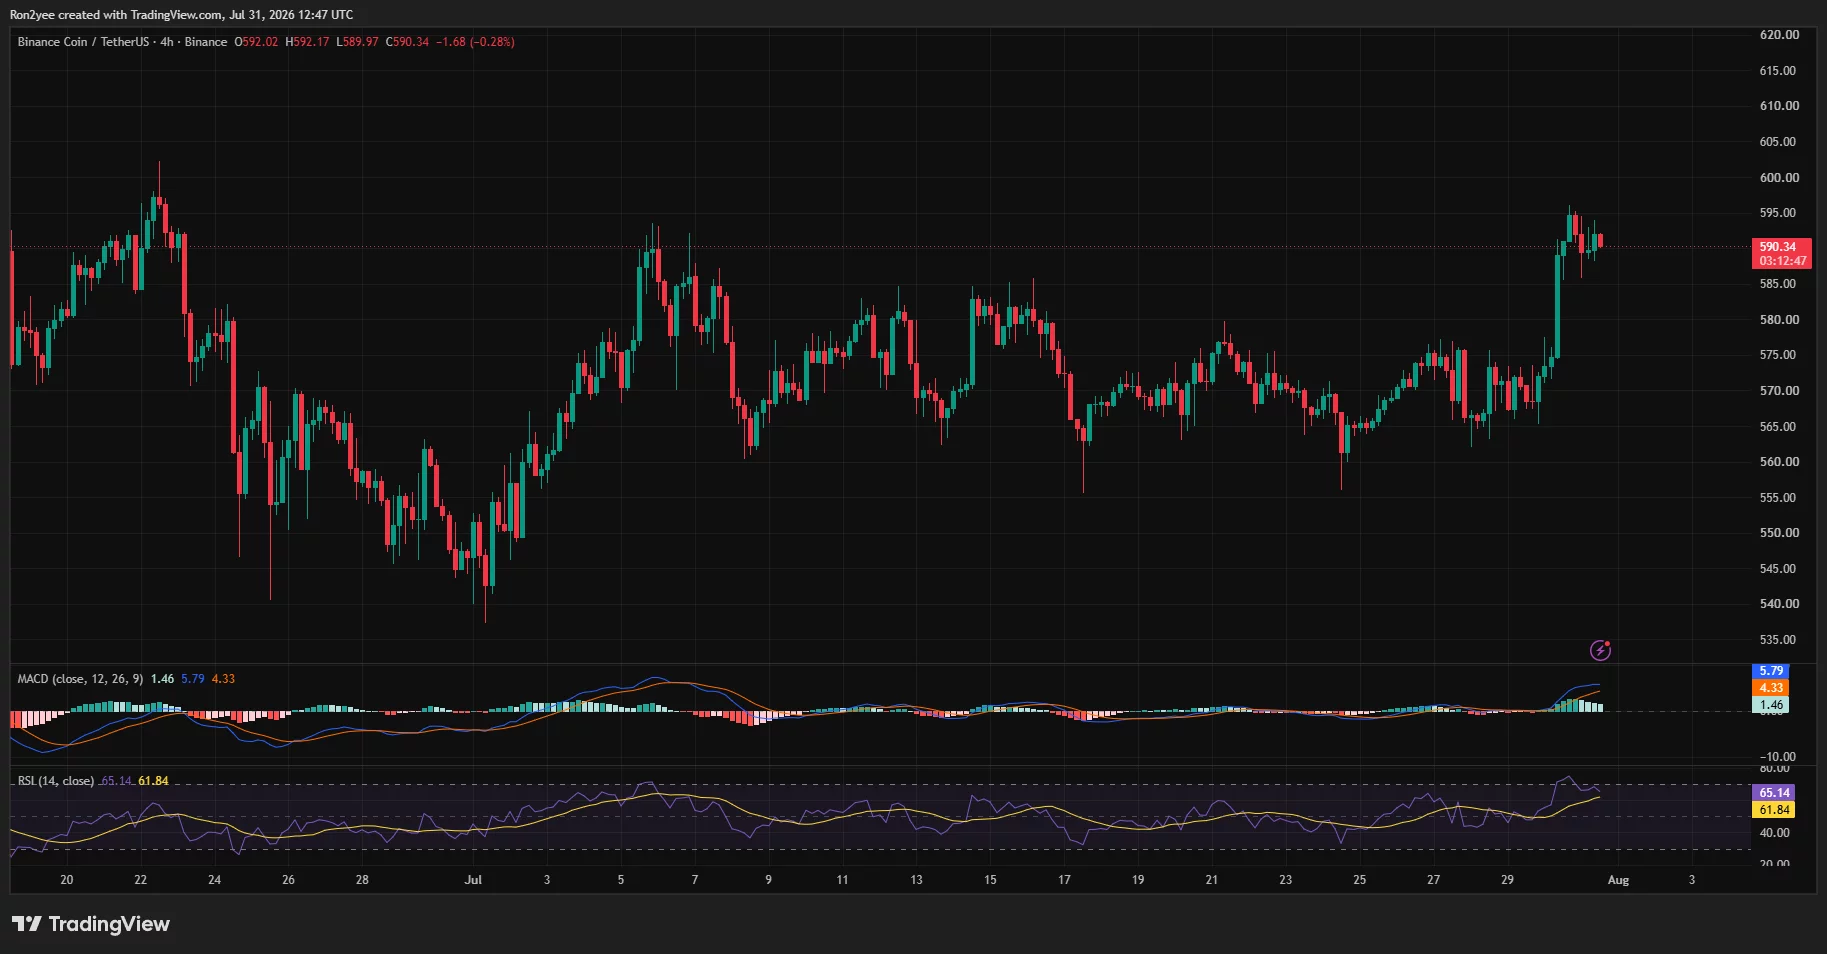
According to data from crypto.news, BNB (BNB) price surged from the $570 area and reached an intraday high near $595 before easing to approximately $590 at the time shown on the charts. The move carried the token out of the narrow range that had controlled trading during the second half of July.
The 4-hour chart shows a sharp breakout candle above $575, followed by an extension toward $595. Buyers have since defended the $586–$590 region, although several upper wicks near $595 show that sellers remain active below the psychological $600 level.
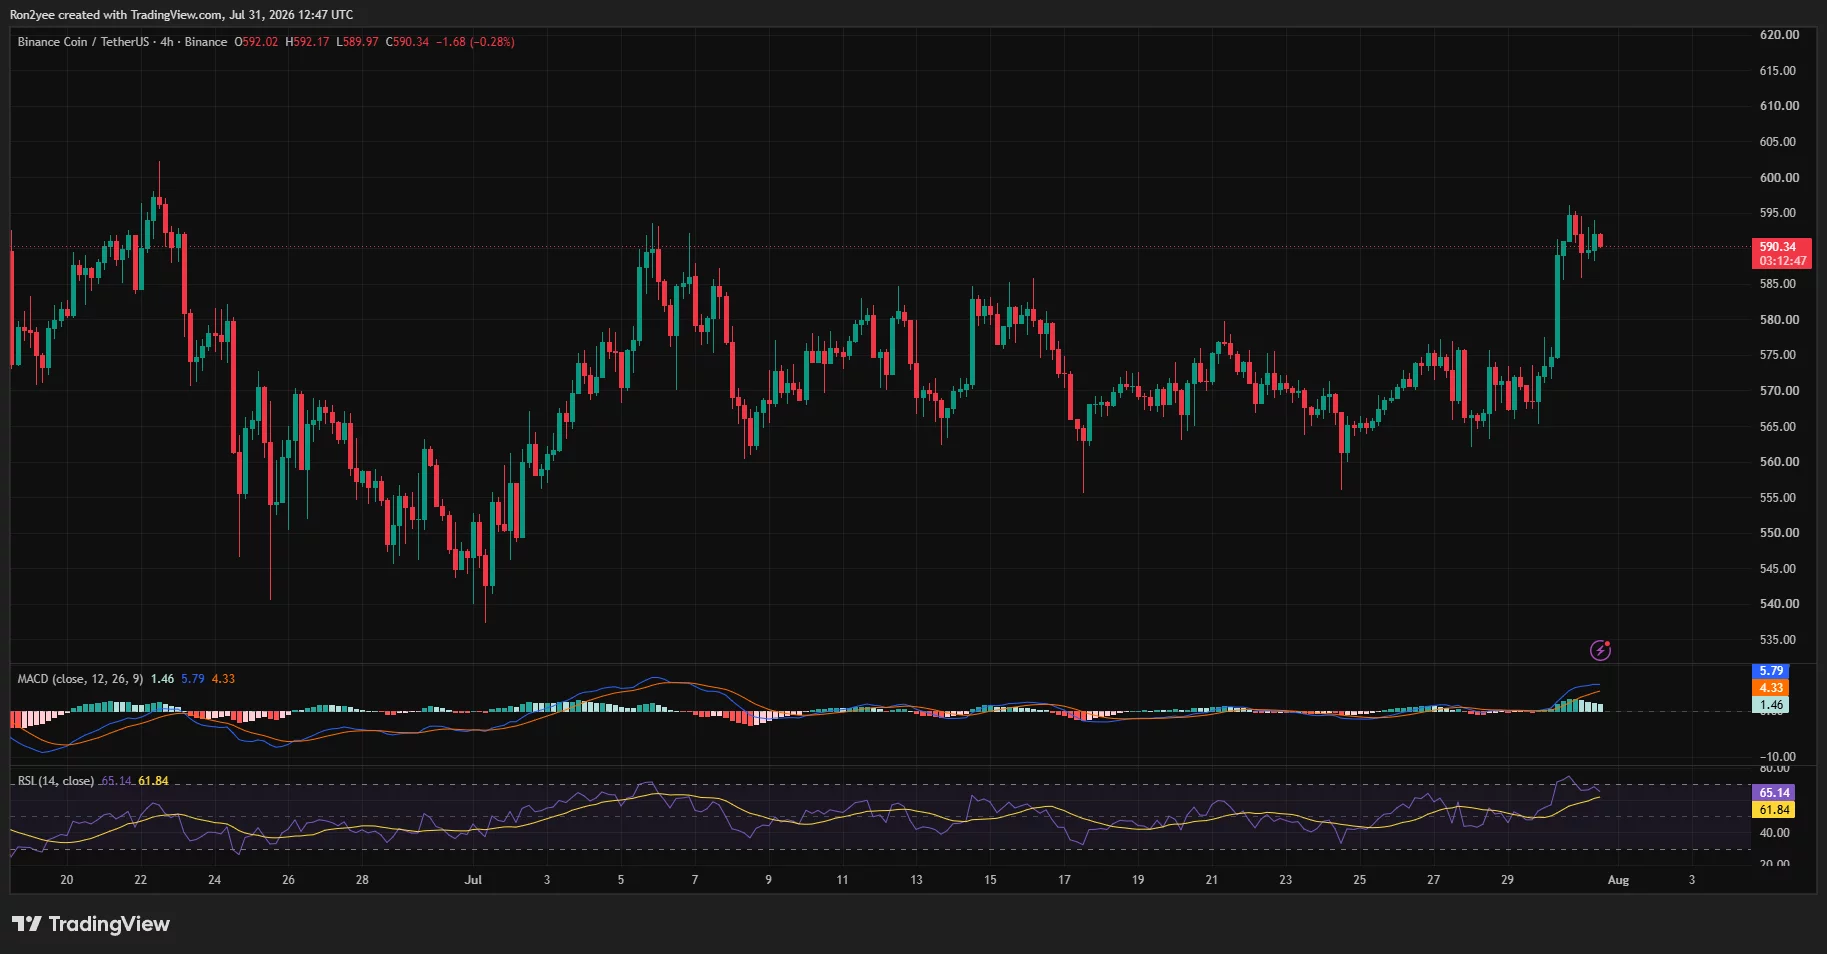
BNB has tested this broader resistance area several times since June. Price reached nearly $598 on June 22 and approached $594 in early July, but neither attempt produced a sustained move above $600.
The latest breakout is stronger than the previous tests because it followed a period of higher lows around $560–$570. However, BNB must still close above $600 to confirm that the wider consolidation has ended.
What is driving the BNB move?
Technical positioning appears to be the immediate driver. BNB broke above a descending resistance line that had connected lower highs since the token traded near $632 in mid-June.
Analyst Hanah described the move as a possible change in short-term momentum after 45 days of downward pressure.
“If BNB can hold above the breakout level, it could pave the way for a stronger bullish continuation.”
Network activity has also provided a fundamental backdrop for the recovery. BNB Chain reportedly processed about $19 billion in weekly decentralized exchange volume, placing it ahead of Ethereum and Solana during the measured period. Network utilization also rose from roughly 17% to nearly 30%.
SilentSwap’s integration added another use case by bringing private cross-chain swaps to the ecosystem. Rising transactions and gas usage may support demand for BNB, which users need to pay fees across BNB Chain.
Still, those developments do not guarantee that price will clear $600. The immediate rally remains heavily influenced by technical positioning and liquidity concentrated around nearby resistance.
BNB indicators favor buyers but show stretched conditions
BNB closed near $590.15 on the daily chart, above the Bollinger Band’s upper boundary at $587.85. The middle band sits at $573.53, while the lower band is near $559.21.
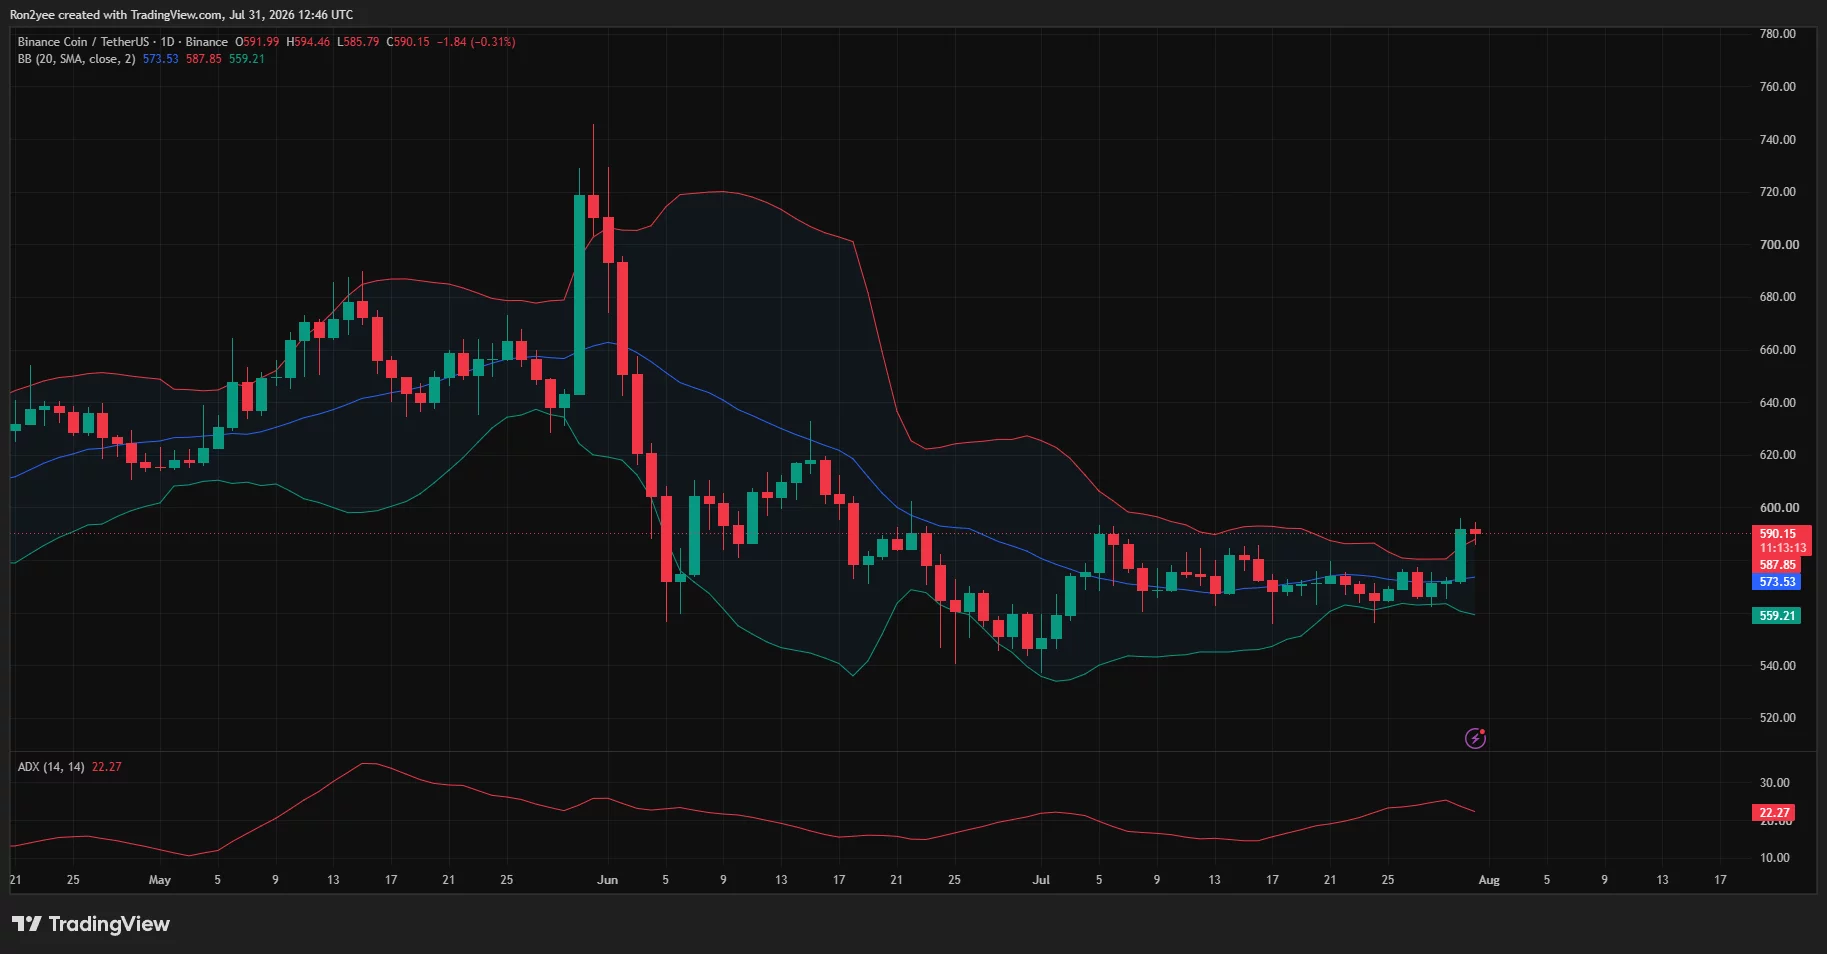
A move above the upper band reflects strong buying pressure, but it can also precede a short-term pullback when price rises too quickly. A daily close back inside the band would put $573.53 in focus as the first mean-reversion target.
The Average Directional Index stands at 22.27. That reading suggests the developing trend has moderate strength but has not yet reached the levels normally associated with a powerful directional move.
Momentum is clearer on the 4-hour timeframe. The relative strength index is at 65.14, above its moving average of 61.84 but below the overbought threshold of 70. This leaves room for another advance while warning that buyers are approaching stretched territory.
The 4-hour MACD line stands at 5.79, above the 4.33 signal line, with a positive histogram reading of 1.46. The configuration remains bullish, although the shrinking histogram bars suggest that the initial burst of momentum is beginning to cool.
Key BNB levels to watch
The 3-day liquidation heatmap identifies a dense pool of leveraged positions around $605–$610. That cluster could attract price if BNB clears $600, but it may also increase volatility as short liquidations and profit-taking occur in the same region.
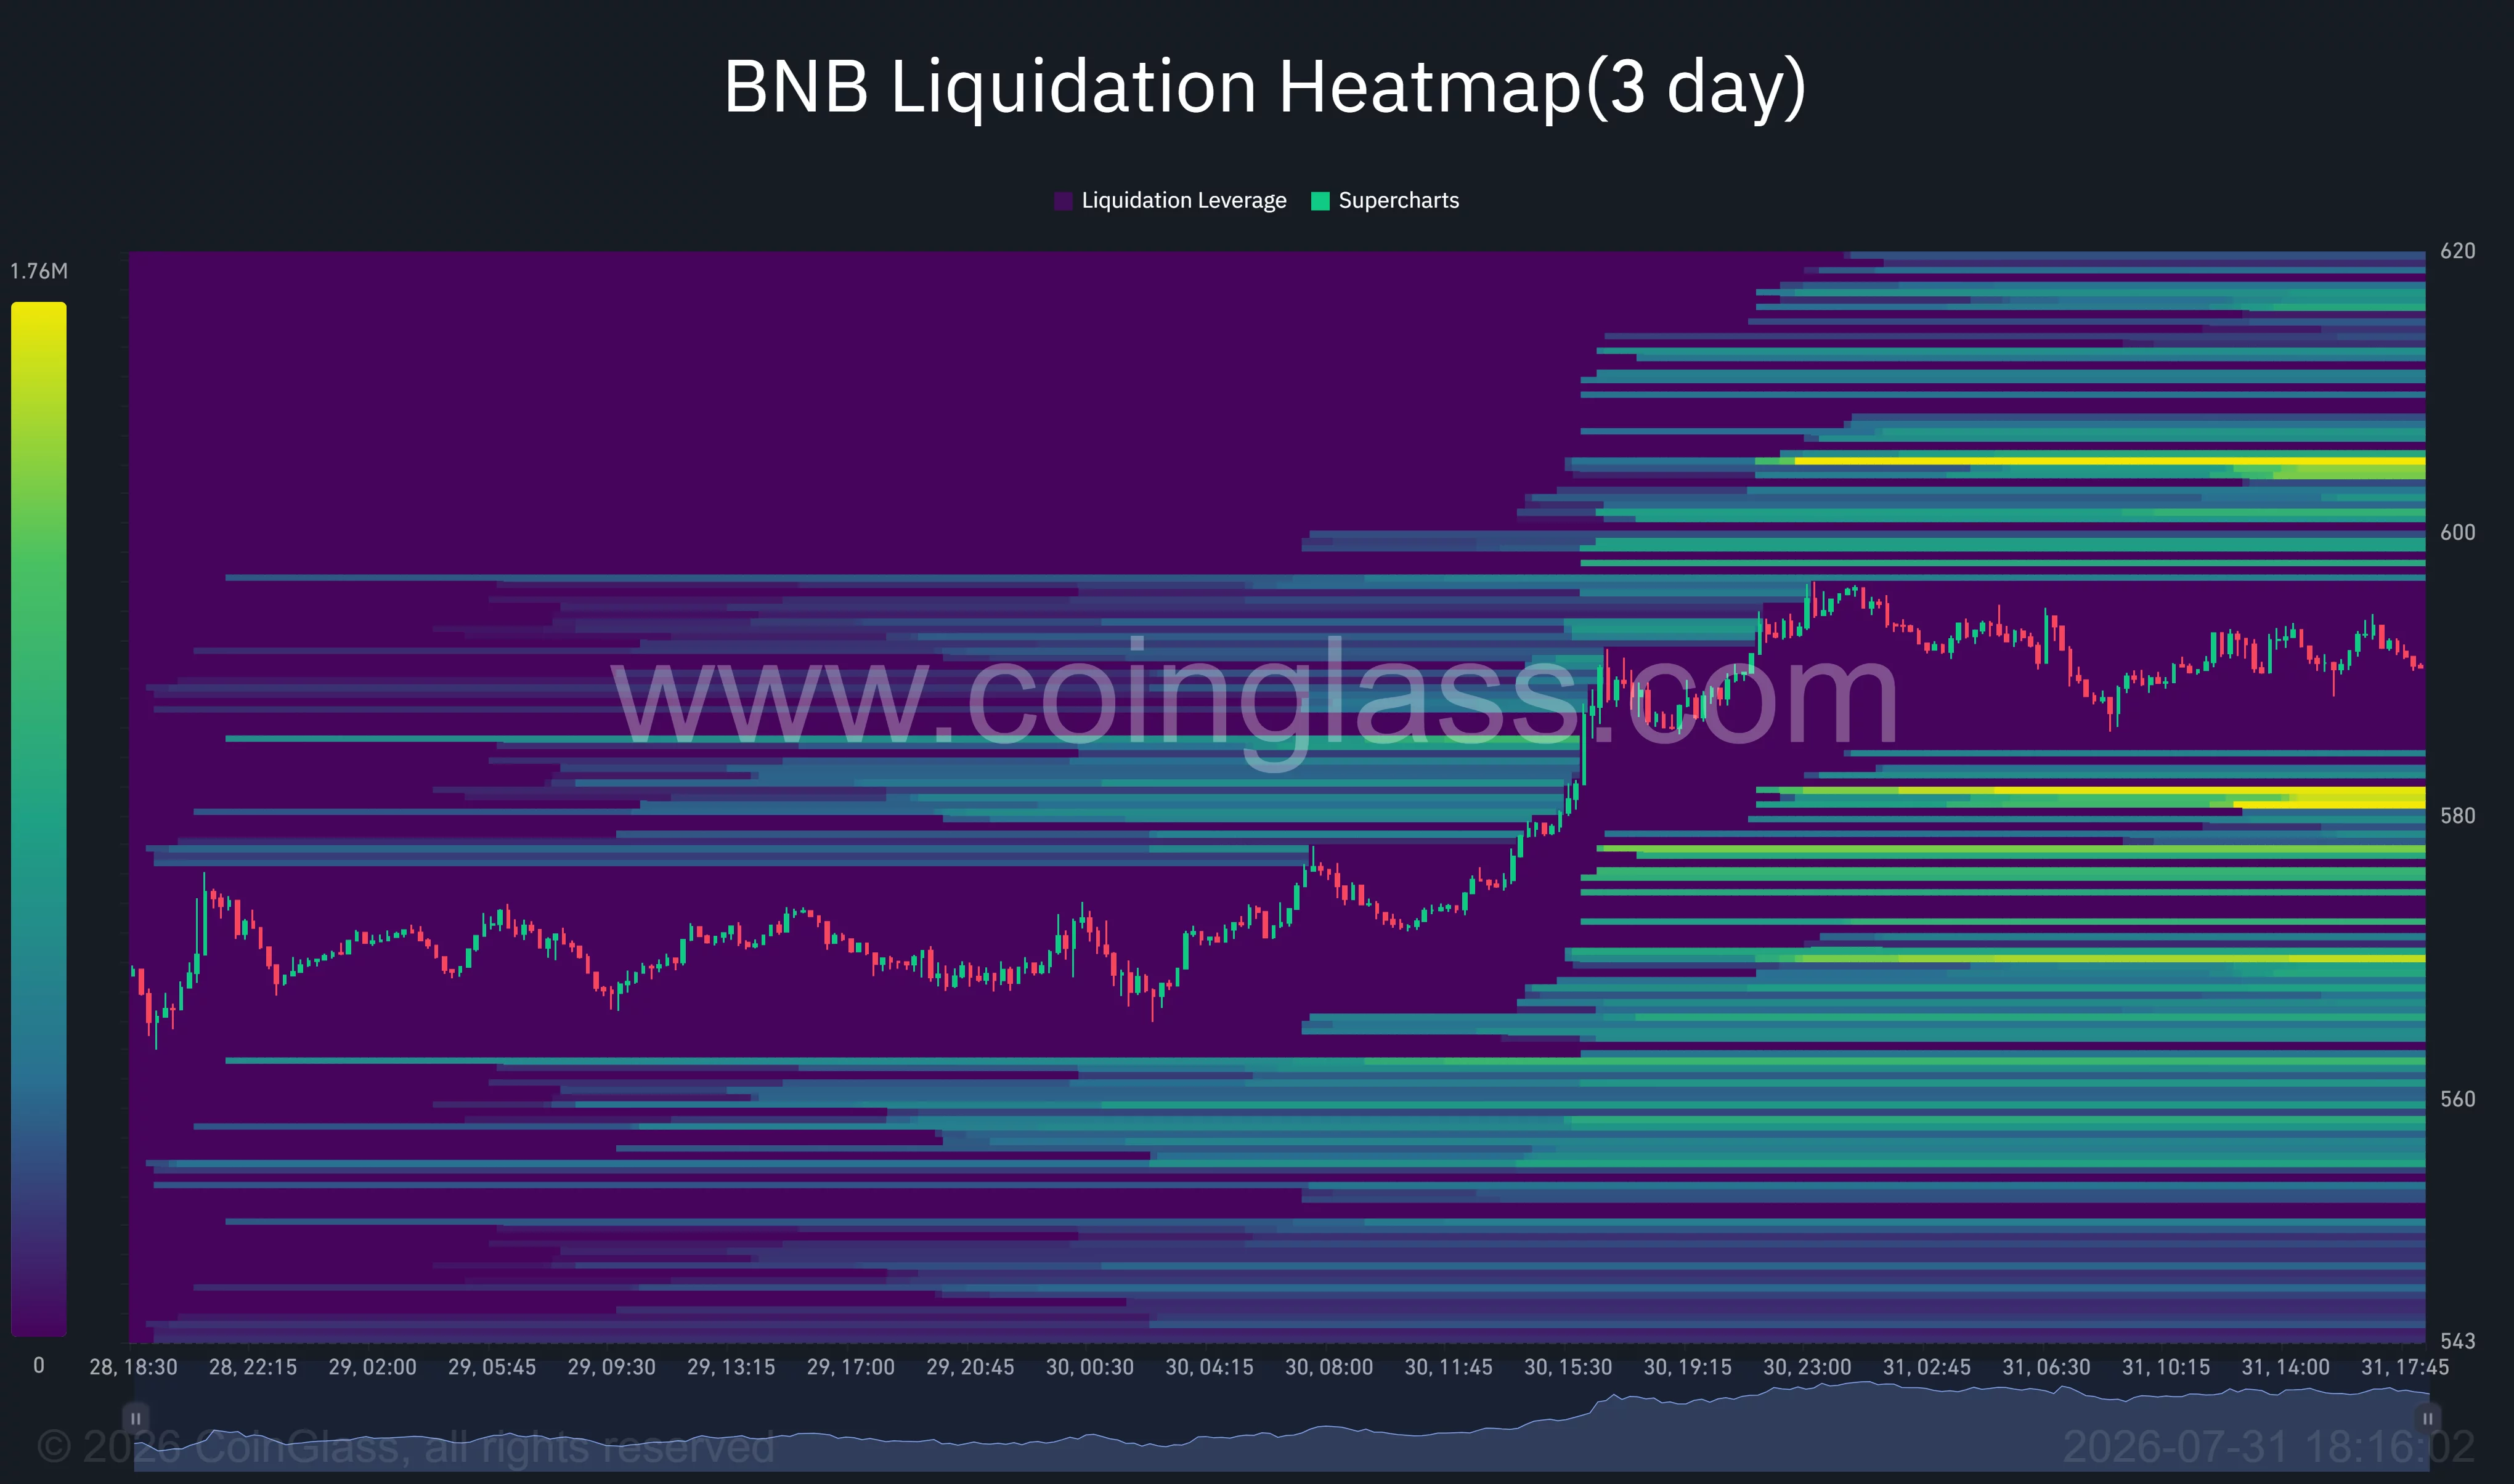
A decisive close above $610 would strengthen the breakout and open a route toward the former $620–$632 supply zone. The latter marks the high from which the descending trendline began.
Immediate support sits between $587 and $580. The heatmap shows the brightest nearby liquidity concentration around $580–$582, making that area a possible downside target if the rally loses momentum.
Below $580, the Bollinger midline near $573.53 becomes the next technical support. Losing that level would weaken the breakout and expose $559–$560, where the daily lower band aligns with July’s established demand zone.
US market context could limit the breakout
US investors are also watching broader risk appetite as geopolitical tensions and elevated energy prices keep inflation concerns in focus. Higher oil prices can complicate the Federal Reserve’s policy outlook by raising the risk that inflation remains above target.
A more restrictive interest-rate environment generally reduces liquidity available for speculative assets, including altcoins. BNB may therefore struggle to sustain an independent rally if Bitcoin and US technology stocks weaken as investors reduce risk.
The near-term setup remains constructive while BNB holds above $580. A confirmed break through $600–$610 would favor continuation, while a retreat below $573 would suggest the latest move was another failed breakout within the wider range.
Disclosure: This article does not represent investment advice. The content and materials featured on this page are for educational purposes only.
Crypto World
Strategy Posts $8.33 Billion Operating Loss As Downturn Pushes Bitcoin Below Acquisition Cost

Bitcoin treasury company Strategy has reported a second-quarter operating loss of $8.33 billion, largely due to an unrealized loss of $8.32 billion on its Bitcoin (BTC) holdings. The company currently holds 843,775 BTC, worth $54.77 billion, significantly lower than the $63.69 billion acquisition cost.
Strategy has created a $3.75 billion cash reserve as part of its BTC monetization program to support interest and dividend obligations.
Strategy Losses Deepen
Strategy has reported an operating loss of $8.33 billion in Q2 as unrealized losses on its Bitcoin holdings climbed to $8.32 billion after Bitcoin prices declined substantially. The flagship cryptocurrency traded around $88,400 at the end of 2025 and was near $64,700 when Strategy announced its quarterly earnings. The decline pushed the value of Strategy’s Bitcoin holdings below their aggregate purchase cost of $63.69 billion.
The company recorded an operating loss of $8.33 billion, and a net loss of $8.22 billion, working out to $24.45 per diluted common share. In comparison, Strategy’s net income stood at $10.00 billion during Q2 2025. The quarterly earnings report did not have much impact on Strategy (MSTR) shares. MSTR rose 4.7% during regular trading hours before registering a marginal decline following the report.
Meanwhile, Strategy’s core software business reported quarterly revenue of $122.4 million, a 6.9% increase from a year earlier, and gross profit stood at $81.6 million.
Bitcoin Bet Weighs Heavy
Strategy’s Bitcoin holdings stood at 843,775 BTC as of July 26, with an acquisition cost of $63.69 billion. The company’s Bitcoin holdings are currently valued at $54.77 billion, putting them $8.92 billion underwater. However, this loss is unrealized and reflects the change in BTC’s market value rather than an actual loss from selling the position. Strategy has also sold a small portion of its Bitcoin holdings to fund its dividend obligations, as the company continues to monetize its portfolio when necessary.
Strategy Building Dollar Reserve
Strategy’s capital markets programs have helped raise $17.06 billion this year while reporting a Bitcoin yield of 4.5%. The company also repurchased $1.5 billion of its senior convertible notes at an 8% discount, cutting its convertible debt to $6.71 billion. The move reduces Strategy’s debt burden after declining Bitcoin prices put substantial pressure on its balance sheet. Strategy also expanded its US Dollar Reserve by $525 million to $3.75 billion. The company stated that the reserve can cover dividend obligations for 2.1 years under its current policy. However, it conceded that it cannot guarantee payments under changing or adverse market conditions.
Strategy has also initiated repurchase programs for its common shares and digital credit securities, giving the company the option to buy back securities without using the entire authorized amount.
Strategy Must Maintain Liquidity Phong Le
Strategy CEO Phong Le stressed the importance of maintaining liquid US Dollars to fund dividend obligations during the company’s earnings call. Le stated:
“We thought that liquid Bitcoin would be important, but what Mike [Michael Saylor] mentioned earlier is that the people who are holding these preferreds don’t look at Bitcoin the way they look at U.S. dollars.”
Le stressed that ensuring a Dollar reserve to cover two to three years of dividend obligations is a prudent strategy.
Market Impact
Strategy is the largest publicly traded holder of Bitcoin, giving US investors indirect exposure to the flagship cryptocurrency. The company’s shares reflect fluctuations in Bitcoin’s price and also respond to equity issuance, debt costs, preferred dividends, and any change to its capital structure.
Strategy’s cash reserve and lower convertible debt give the company some financial flexibility. However, the value of its Bitcoin holdings must recover above the acquisition cost. A further decline in Bitcoin prices could deepen unrealized losses and increase pressure on the company.
Disclaimer: This article is provided for informational purposes only. It is not offered or intended to be used as legal, tax, investment, financial, or other advice.

New York has filed a lawsuit against prediction market platform Kalshi, accusing the company of running an illegal, unlicensed gambling operation in the state. The case centers on Kalshi’s event contracts tied to outcomes such as sports results and elections.
In its filing, New York seeks an order stopping Kalshi’s alleged gambling activity, along with forfeiture of “illegal gains,” restitution to users, and civil penalties reportedly set at three times the amount of those gains. Attorney General Letitia James said prediction markets like Kalshi are gambling “plain and simple,” adding that the state is acting to enforce its laws and protect residents.
Key takeaways
- New York is pursuing injunctive relief and financial remedies against Kalshi, framing event contracts as unlicensed gambling.
- The lawsuit follows a cease-and-desist order from the New York State Gaming Commission issued in October 2025.
- Kalshi has challenged the regulator in federal court, but a judge denied its bid for a preliminary injunction in July 2026.
- The dispute escalates a wider fight over whether federally regulated prediction markets can be blocked under state gambling laws.
- Regulators have been increasingly scrutinizing the prediction market sector as it expands—both in mainstream visibility and blockchain-based infrastructure.
New York challenges Kalshi’s business model
The lawsuit targets Kalshi’s offering of contracts whose settlement depends on real-world outcomes, including sports and election-related events. New York’s position is that these products function as gambling and therefore require appropriate state licensing and compliance.
While Kalshi operates as a prediction market platform, New York’s complaint does not treat the platform as merely financial speculation. Instead, it argues that calling the contracts “prediction” does not change their practical nature as wagers on future results.
This action arrives after the New York State Gaming Commission issued a cease-and-desist order in October 2025. Kalshi responded by suing the regulator in federal court, and the immediate conflict has moved through multiple procedural steps.
Earlier this year, a judge denied Kalshi’s request for a preliminary injunction in July. An appeals court later rejected Kalshi’s attempt to halt enforcement while the appeal continues, meaning New York’s efforts can proceed even as the legal battle plays out.
Kalshi’s legal fight intersects with CFTC’s federal oversight
The New York case is part of a broader jurisdictional tug-of-war over prediction markets—specifically whether state gambling laws can restrict products that a federal regulator treats as within its own regulatory scope.
Just before New York filed, the U.S. Commodity Futures Trading Commission (CFTC) submitted an emergency motion in court seeking to block New York’s enforcement efforts. The CFTC argued that the state’s action interferes with the agency’s “exclusive authority” under the Commodity Exchange Act to regulate designated contract markets such as Kalshi.
The CFTC’s approach has been consistent in similar disputes involving other states. In those arguments, the commission has warned that if states can independently ban event contracts listed by federally regulated exchanges, it would create conflicting rules—undermining a uniform federal commodities framework.
That position has been cited in enforcement disputes the CFTC has taken against at least nine states, according to reporting that highlights how the agency frames state restrictions as a threat to federal oversight of commodities markets.
Prediction markets keep attracting mainstream attention
Prediction markets are built on a simple premise: users trade contracts tied to the outcome of future events, and the price of those contracts is intended to reflect market-implied probabilities. In theory, that mechanism helps participants aggregate information about what is likely to happen.
But as the sector grows, regulators across jurisdictions have increasingly treated certain prediction market products as gambling—especially when settlement depends on outcomes and participation mirrors typical wager-based behavior. The resulting legal uncertainty has encouraged closer scrutiny of how platforms structure their offerings and what regulatory category they fall under.
Kalshi is not the only high-profile operator to face regulatory pressure. Its competitor, Polymarket, has also encountered scrutiny from regulators abroad, with some authorities restricting or investigating operations over licensing and gambling-related concerns.
Beyond the regulatory front, prediction markets have also expanded technologically. Kalshi began broadening into blockchain-based infrastructure in December 2025, launching tokenized prediction markets on Solana and later adding support for multiple blockchain networks. That shift mirrors a wider trend in crypto markets, where trading venues seek faster settlement, greater programmability, and broader distribution.
Crypto analytics point to rapid growth in on-chain prediction activity
While the legal battles unfold, on-chain prediction markets have shown signs of growing participation. According to analytics firm Chainalysis, blockchain-based prediction markets processed about $20 billion in trading volume tied to the 2026 FIFA World Cup, with more than 400,000 wallets participating.
The implication for investors and builders is that even as regulators debate classification—commodities regulation versus gambling law—the user demand for outcome-trading continues to show up in measurable on-chain activity. That activity can raise the stakes for platforms that want to operate at scale without running afoul of differing legal interpretations.
For market participants, the tension is straightforward: platforms may market prediction markets as probability markets or informational tools, but regulators may focus on the wager-like economic structure and licensing requirements. The New York lawsuit against Kalshi is a direct test of how far state enforcement can go when a federal agency argues for exclusive jurisdiction under the Commodity Exchange Act.
What to watch next is whether the CFTC’s federal arguments continue to constrain or defeat New York’s enforcement, and whether Kalshi’s appeal of the preliminary-injunction denial changes the immediate timeline. The outcome could shape how other states pursue enforcement against prediction markets—and how platforms design their products to manage regulatory risk.
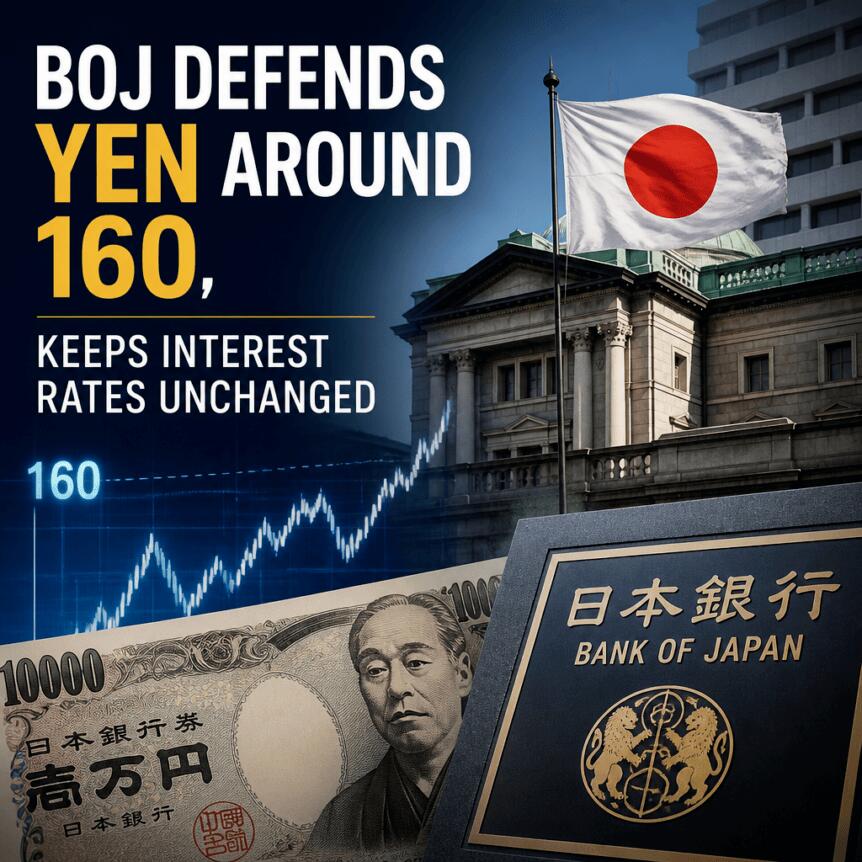
Japan’s central bank kept interest rates unchanged at 1.0% on Friday, according to a Bank of Japan (BoJ) statement issued after its policy decision. The meeting outcome landed in line with market expectations, even as the yen had just swung sharply following reports of intervention.
The BoJ’s decision came shortly after the Japanese currency strengthened quickly against the US dollar—moving up as much as 3.5% overnight, based on TradingView data—an advance many traders linked to coordinated or related foreign-exchange actions involving the yen. With Japan also flagging inflation pressures later in the year, investors are now watching how currency policy, yields, and global risk appetite intersect for crypto markets.
Key takeaways
- The BoJ held the uncollateralized overnight call rate at around 1.0% after an outcome supported by eight of nine Policy Board members.
- Recent yen volatility reportedly coincided with currency intervention activity involving Japan and South Korea, as the JPY briefly jumped versus the USD.
- The BoJ warned that CPI inflation may accelerate to clearly above 2% from the second half of fiscal 2026.
- Since the yen carry trade unwind in 2024, JPY moves have continued to influence Bitcoin and altcoin risk sentiment.
BoJ holds rates steady after yen turbulence
In its latest statement, the BoJ said it would “encourage the uncollateralized overnight call rate to remain at around 1.0 percent,” confirming a broadly shared view among officials for keeping policy unchanged. The decision was passed by eight of nine members of the Policy Board, with Hajime Takata the only dissenting vote, proposing a 0.25% rate hike.
Markets had largely expected this result ahead of the meeting, according to earlier coverage referenced by Cointelegraph. The policy decision also arrived just hours after the yen’s brief surge—an FX move that coincided with speculation about official action. While the BoJ did not comment directly on the reported intervention, the timing is likely to keep FX traders attentive to any future shifts in the currency’s direction.
Reported Japan–Korea involvement raises the stakes
Several reports tied the yen’s sharp move to intervention efforts. The BoJ did not confirm the details, but commentary in regional media pointed to alignment between Japan and South Korea’s policy priorities. At the time, the South Korean won was reportedly rising as well, suggesting traders were reacting to developments across both currencies.
Analyst Lee Min-hyuk of KB Kookmin Bank, as quoted by Straits Times, argued that cooperation could amplify the impact because the won and yen are closely linked. Separate reporting also noted that the US had conducted “rate checks”—a softer form of intervention that can precede stronger operations—during Thursday’s session, fueling speculation about a wider, multi-country FX response.
Traders typically treat intervention expectations as a constraint on how far a currency can move in either direction. If intervention remains a credible backstop, it can affect not only FX markets but also broader capital flows—an important link for assets like Bitcoin that have repeatedly shown sensitivity to liquidity conditions and global risk changes.
BoJ turns to inflation headwinds for fiscal 2026
Beyond the rate decision, the BoJ’s outlook for prices may carry longer-term significance. In its quarterly Outlook for Economic Activity and Prices, the central bank said the year-on-year rate of increase in the consumer price index (CPI) “is likely to accelerate to a level clearly above 2 percent from the second half of fiscal 2026.”
In the same report, the BoJ pointed to additional drivers of inflation such as durable goods prices. It also referenced the “waning of the effects of high crude oil prices,” tying this shift to factors including the ongoing US–Iran war and the closure of the Strait of Hormuz oil-transit route—elements that can influence energy costs and therefore the inflation trajectory.
For investors, this matters because inflation expectations can eventually pressure policymakers toward tighter conditions, or at minimum change the path of interest-rate expectations. Even though Friday’s decision was unchanged, the direction of the BoJ’s CPI outlook can affect longer-dated yields and, by extension, currency dynamics and carry-trade behavior.
Why yen moves still matter for crypto
FX volatility has remained a meaningful input for crypto traders since the “unwinding” of the yen carry trade in August 2024, when yen funding pressures and related liquidity shifts coincided with significant downside across Bitcoin and other major tokens. Since then, Japan-related rates and the yen’s direction have continued to serve as a proxy for risk conditions—especially when changes in JPY funding costs trigger broader adjustments in global portfolios.
Earlier this year, Arthur Hayes, former CEO of crypto exchange BitMEX, suggested that a weak yen combined with rising Japanese bond yields could encourage some investors to rotate away from low-yielding US bond exposures. In his framing, central bank liquidity interventions and related yield dynamics can flow through to crypto demand by shifting broader risk and liquidity availability.
Hayes also previously argued that USD/JPY could rise significantly—he predicted in December 2025 that the pair might reach as high as 200. While Friday’s BoJ decision does not validate that forecast on its own, the ongoing interplay between FX moves, yields, and policy signals remains central to how traders map macro conditions onto digital-asset positioning.
With the BoJ holding rates steady, the immediate question for markets is whether recent yen strength proves durable or fades—particularly given reports of intervention-linked volatility and the central bank’s warning that inflation pressures could strengthen later in fiscal 2026. Crypto traders will likely watch for follow-through in JPY/USD and Japanese yield expectations, because those variables continue to shape liquidity assumptions that underpin risk appetite.
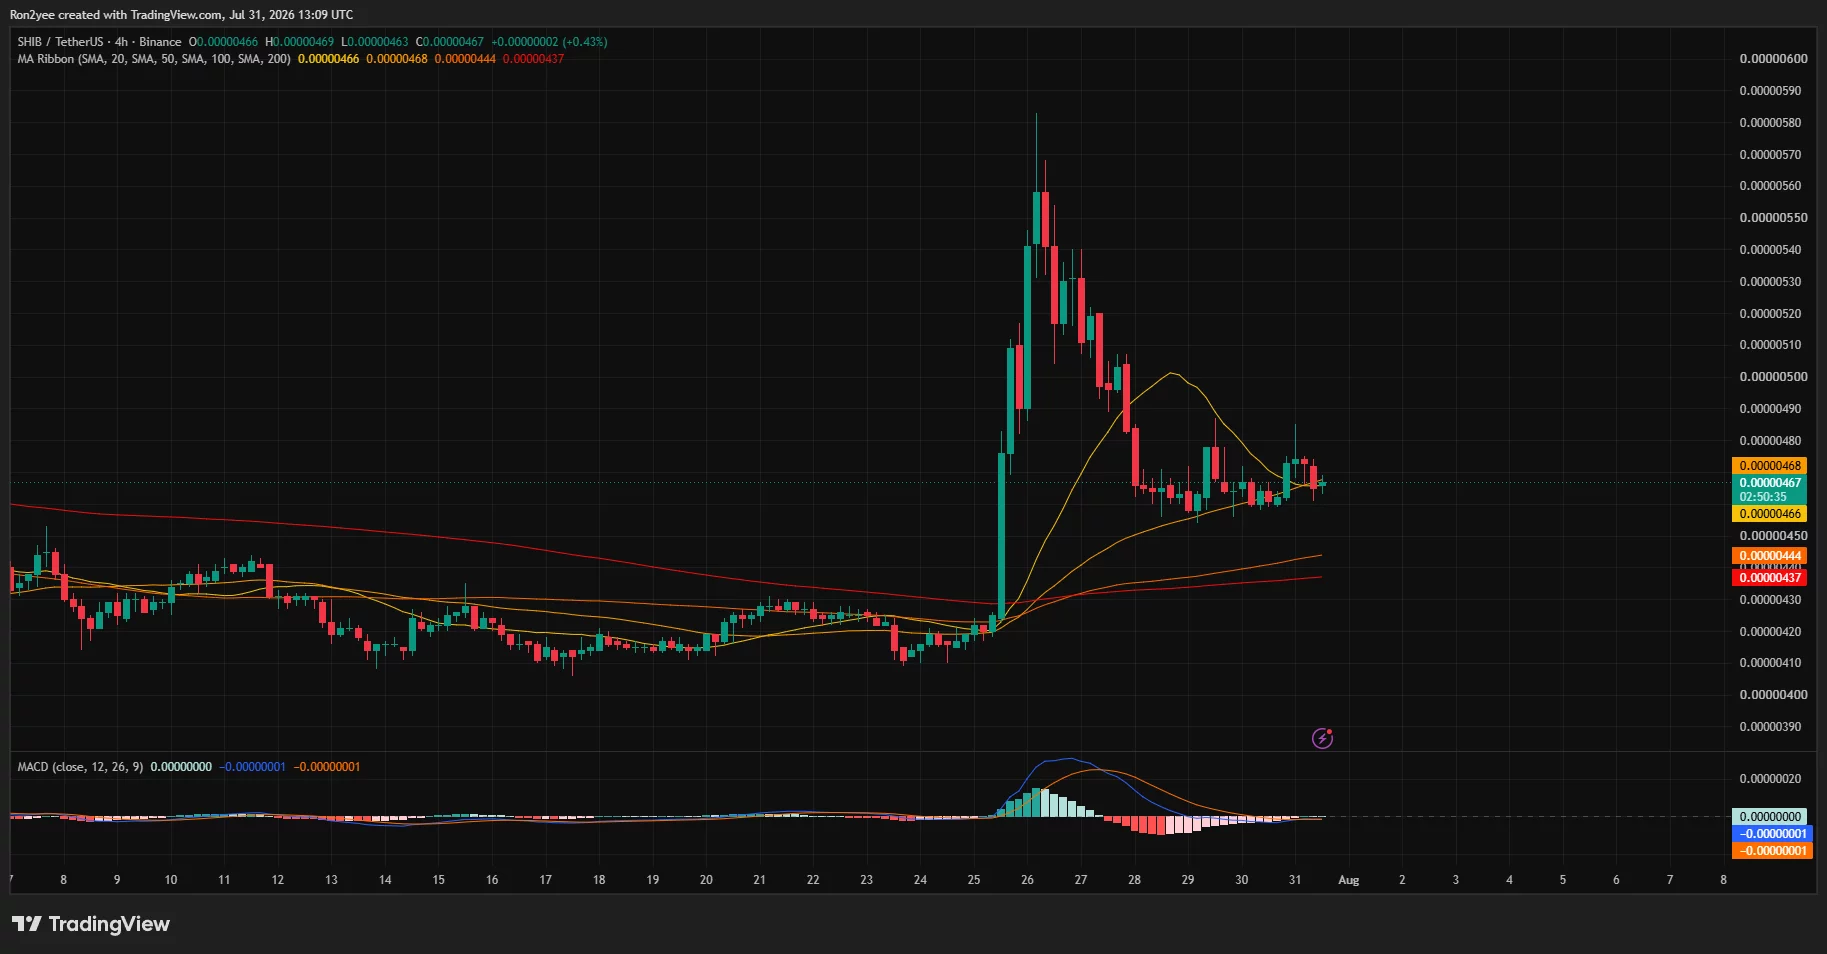
Shiba Inu price surrendered much of its 40% breakout after sellers rejected the meme coin near $0.0000058, leaving bulls to defend a newly established support zone around $0.0000045.
Summary
- SHIB price surged nearly 40% before retreating to approximately $0.0000047.
- Daily ADX climbed to 31.03, confirming that volatility has developed into a stronger directional trend.
- The 4-hour chart places immediate support between $0.00000444 and $0.00000466.
- Liquidation data shows dense leverage near $0.0000045, raising the risk of another volatility spike.
SHIB price rally loses momentum
According to data from crypto.news, SHIB price traded near $0.00000468 on July 31 after its vertical rally encountered heavy selling above $0.0000054. The token briefly reached approximately $0.0000058 during the breakout, marking a gain of nearly 40% from its pre-rally base around $0.0000041.
However, the long upper wick on the 4-hour chart showed that sellers quickly absorbed demand near the peak. SHIB subsequently formed a series of lower highs before stabilizing between $0.0000046 and $0.0000048.
The pullback leaves SHIB roughly 20% below its intraday peak, although the token remains above the range that contained its price through most of July. That distinction matters because the move has not yet completed a full round trip to its breakout point.
South Korean retail activity, a sharp increase in token burns and renewed whale participation reportedly accompanied the rally. However, the rapid reversal suggests that some traders used the sudden liquidity expansion to take profits rather than build longer-term positions.
Four-hour chart shows bulls defending support
SHIB’s 4-hour structure has shifted from a vertical advance into tight consolidation.
The token is trading around its 20-period and 50-period simple moving averages, located near $0.00000466 and $0.00000468, respectively. Holding this area would allow buyers to establish a higher base after the breakout.
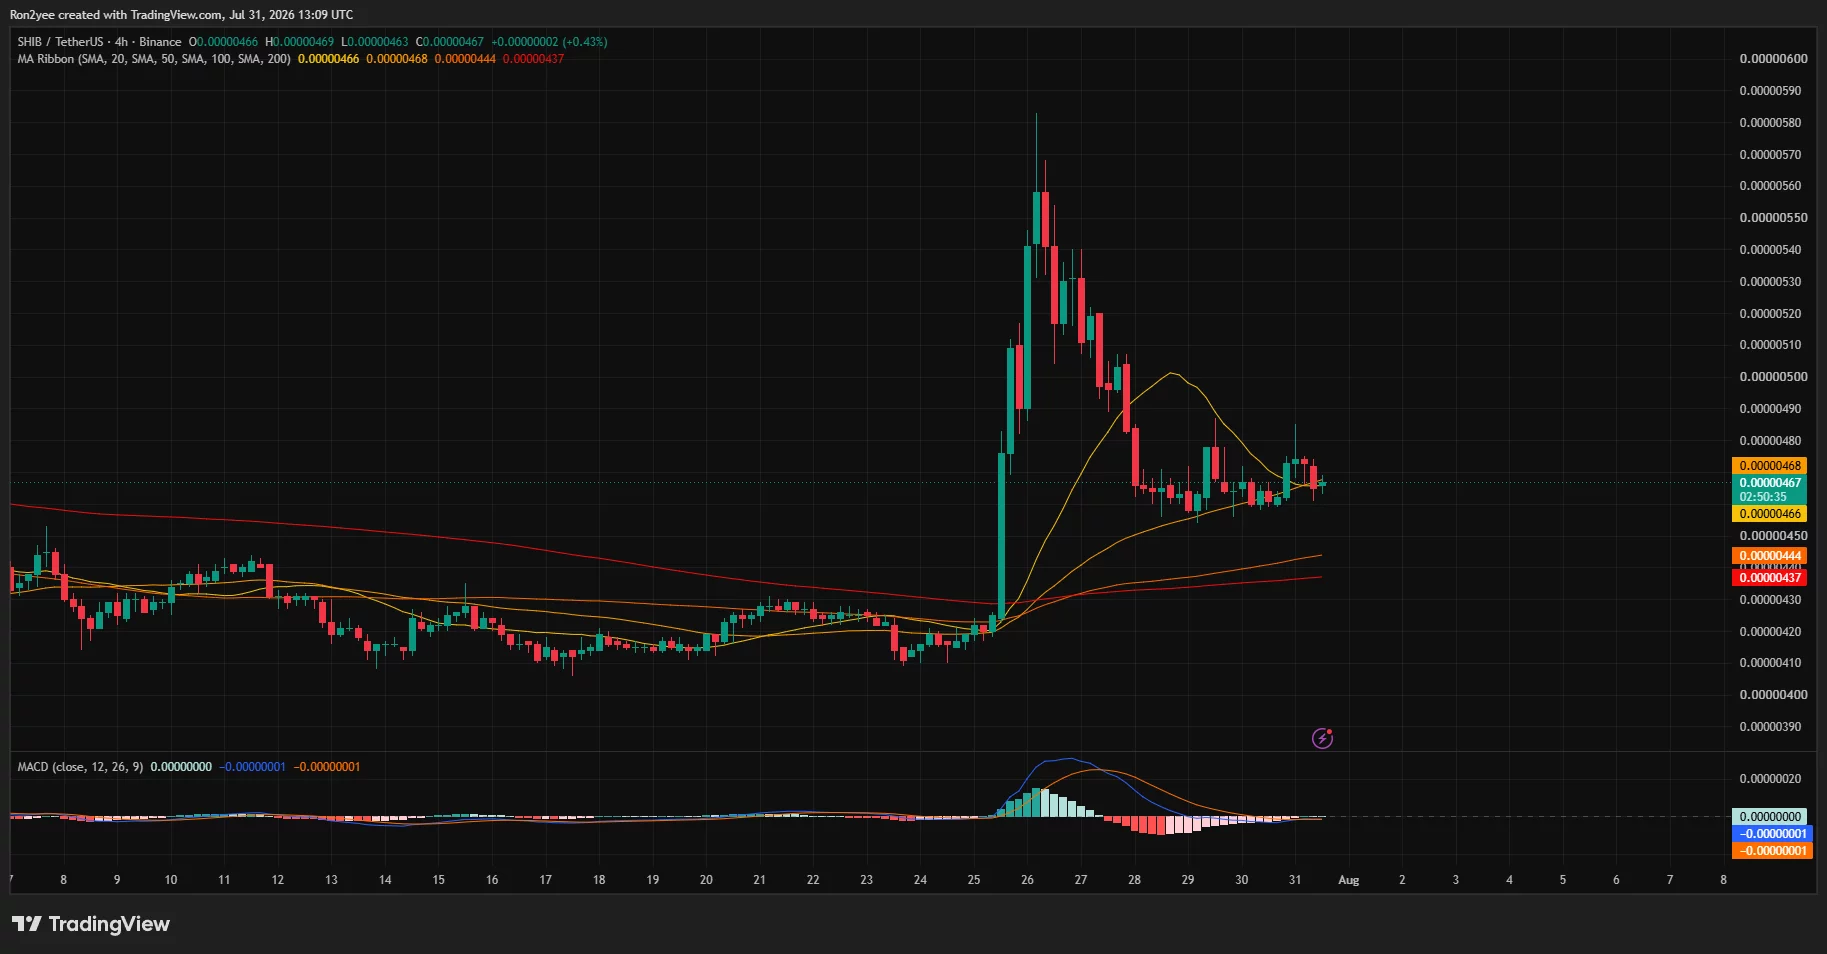
Stronger support sits at the 100-period SMA near $0.00000444 and the 200-period SMA around $0.00000437. Both averages are rising, and SHIB continues to trade above them, preserving the short-term recovery structure.
The moving average convergence divergence indicator is less decisive. Its MACD and signal lines have converged near zero after the earlier bullish impulse faded. This shows that selling momentum has slowed, but buyers have not yet regained enough strength to start another sustained advance.
A 4-hour close above $0.0000048 would be an early bullish signal. SHIB would then face resistance at $0.0000050, followed by the post-breakout supply zone between $0.0000052 and $0.0000054.
SHIB liquidation map warns of a sweep toward $0.0000045
The 3-day liquidation heatmap shows that SHIB is trading between two notable leverage clusters.
The largest nearby concentration sits below the market around $0.00000450 to $0.00000452. This bright liquidity band could attract price if SHIB loses the $0.0000046 floor, potentially triggering leveraged long liquidations.
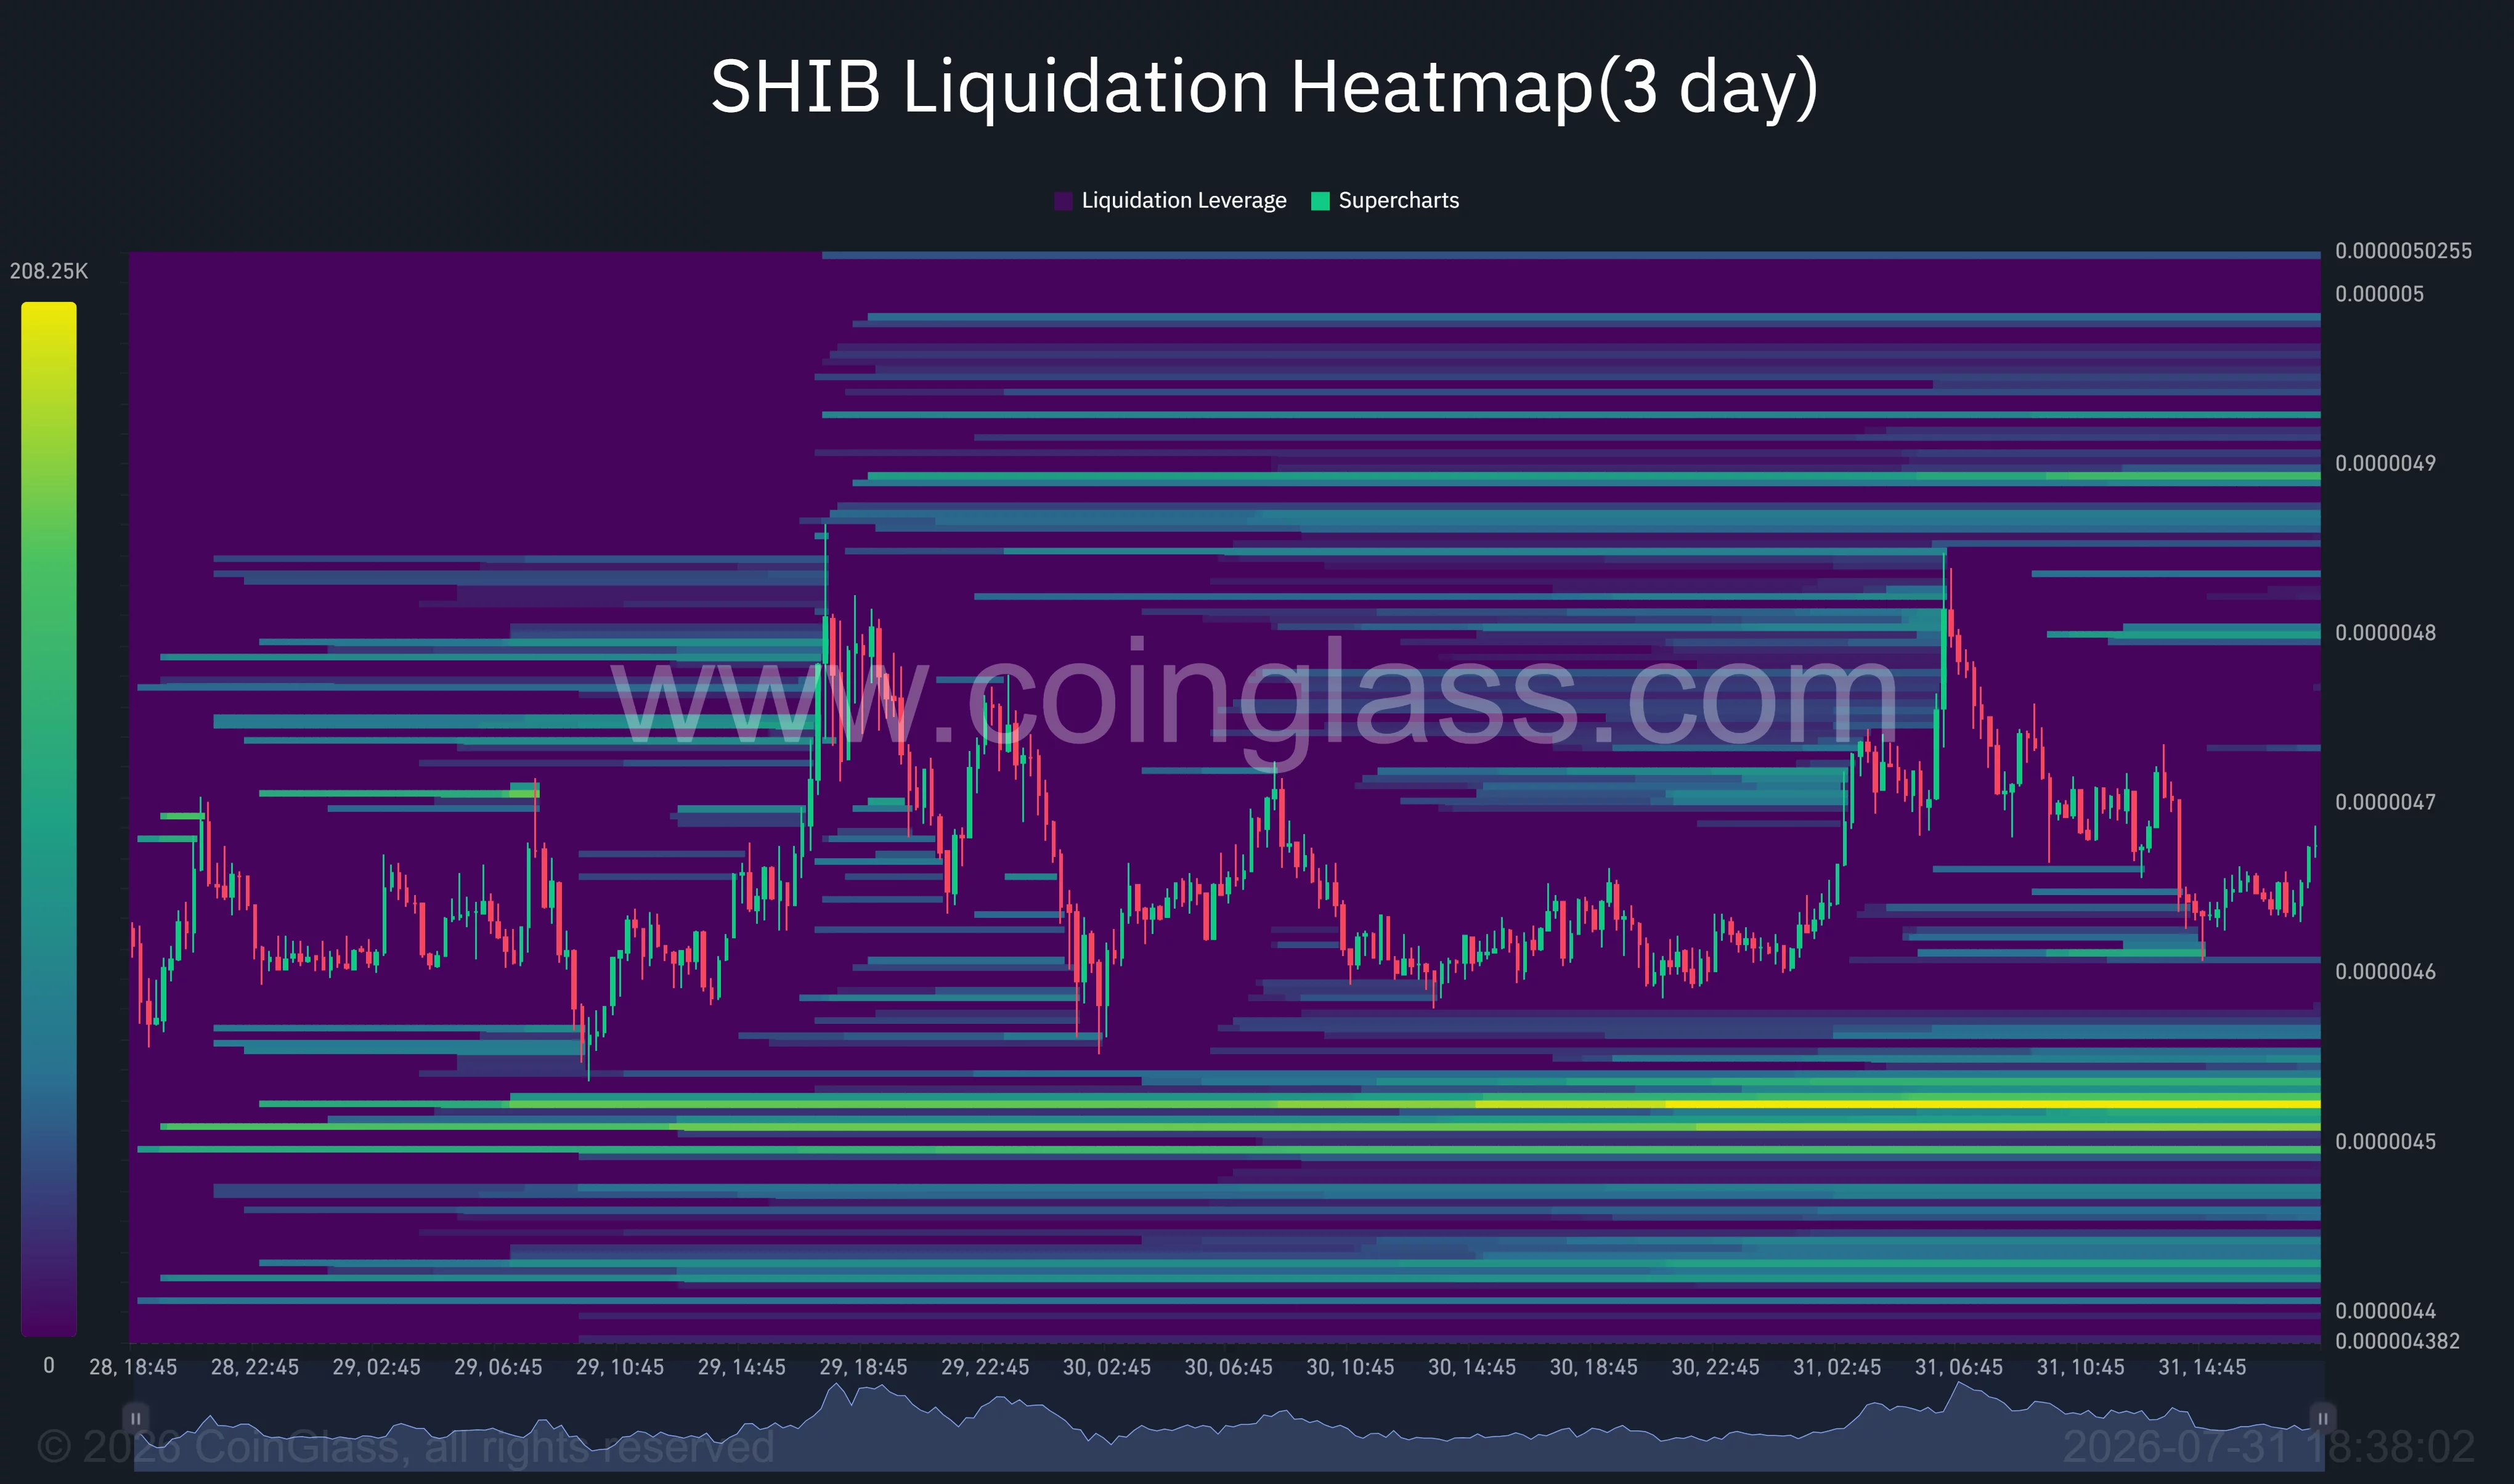
Below that area, additional liquidity appears around $0.0000044. A drop through both zones would erase most of the breakout and expose the July base near $0.0000041.
Upside liquidity is comparatively scattered. The first meaningful bands appear near $0.0000048 and $0.0000049, with another cluster around $0.0000050. Clearing these positions could produce a short squeeze, but SHIB must first overcome the moving-average congestion on its 4-hour chart.
The liquidation structure therefore favors continued volatility. A sweep toward $0.0000045 could occur before either side establishes control.
Daily indicators preserve SHIB’s recovery attempt
Despite the rejection, SHIB’s daily chart contains one constructive development that is price remains above the Supertrend support at approximately $0.00000444.
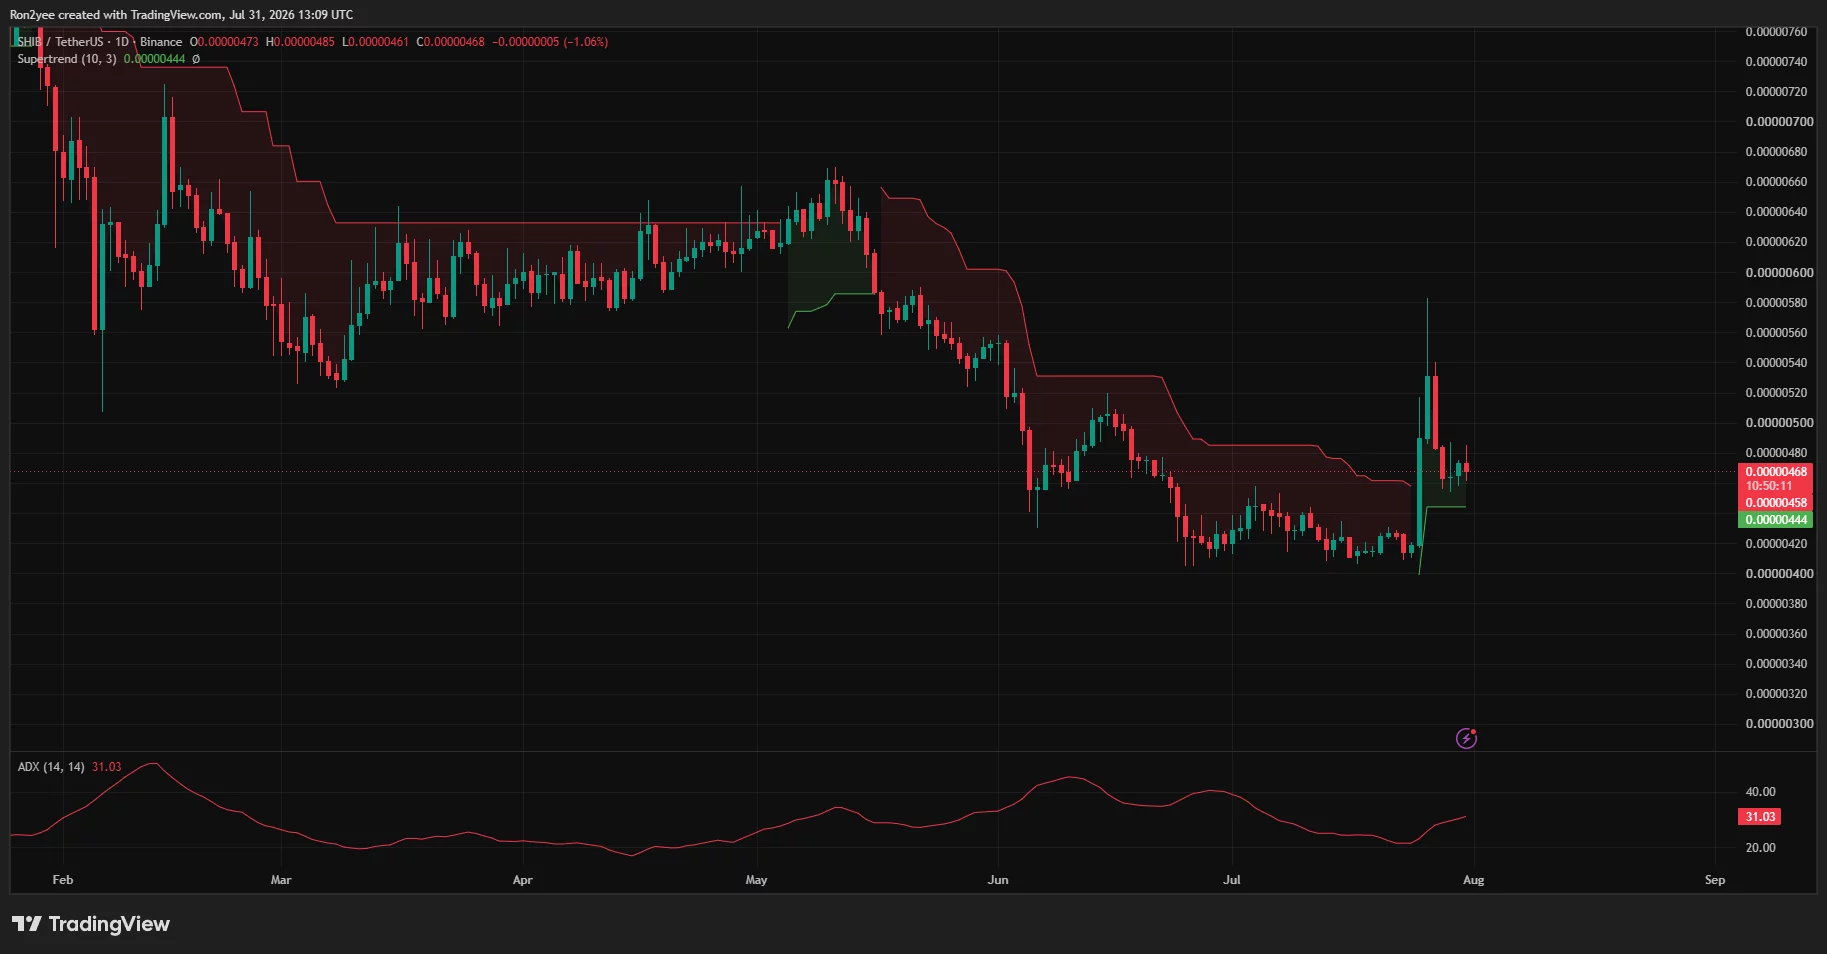
The indicator recently flipped from bearish to bullish following the breakout. Losing that level on a daily closing basis would reverse the improvement and increase the chance of a decline toward $0.0000042.
Average Directional Index, or ADX, has risen to 31.03 from below 20. An ADX reading above 25 generally points to a strengthening trend, although the indicator does not determine whether that trend will remain bullish or turn bearish.
For bulls, the next confirmation would require a move above $0.0000049, followed by a successful recovery of $0.0000052. Breaking the rally peak near $0.0000058 would reopen the path toward $0.0000060 and the May resistance zone around $0.0000064.
Commenting on SHIB’s broader structure, pseudonymous analyst SHIBMortal said:
“The floor seems to be holding (so far). We are not out of the woods yet.”
The analyst described the bounce as promising but said SHIB was still testing resistance through weekly price action and relative strength.
What the setup means for US traders
SHIB’s next move may also depend on wider risk appetite during US trading hours. Meme coins generally carry higher volatility than Bitcoin and large-cap altcoins, making them more sensitive to changes in interest-rate expectations and geopolitical risk.
The immediate setup remains neutral above $0.00000444 and turns more constructive if SHIB reclaims $0.0000049. A daily close below $0.00000444 would invalidate the short-term bullish structure and place the July lows back in focus.
Bulls have preserved part of the breakout, but the failed move above $0.0000054 shows that another rally will require stronger and more persistent demand.
Disclosure: This article does not represent investment advice. The content and materials featured on this page are for educational purposes only.


Circle has secured a New York trust charter to expand its state regulatory footprint.
Summary
- Circle has received a New York trust charter from the NYDFS for Circle New York Trust.
- The approval follows Circle’s recent federal trust bank authorization from the U.S. OCC under a separate regulatory framework.
- Circle said the charter strengthens oversight for its USDC business and extends its decade long relationship with the NYDFS.
According to an announcement from Circle on Friday, the stablecoin issuer has received a limited-purpose trust charter from the New York Department of Financial Services for Circle Internet Trust Company LLC, doing business as Circle New York Trust.
The approval gives Circle another regulatory authorization in New York, where the company says its global headquarters is located. Circle said the charter reinforces its compliance framework and builds on a relationship with the state regulator that began in 2015, when it became the first company to receive a BitLicense from the NYDFS.
The new authorization comes less than a month after Circle secured final approval from the U.S. Office of the Comptroller of the Currency to establish a federally supervised trust bank. While both approvals involve trust entities, they serve different regulatory roles within the U.S. financial system.
New York approval complements Circle’s federal trust bank
Earlier this month, the OCC approved the formation of First National Digital Currency Bank, N.A., which will operate as Circle National Trust under federal supervision for fiduciary digital asset custody. At the time, Circle said management of USDC reserves would remain outside the bank during its initial phase, with reserve activities expected to move later as the institution develops.
The New York charter follows a separate path. Circle had previously indicated that issuance of USDC would continue through a New York limited-purpose trust company rather than its federally chartered bank, making the latest approval an important part of its existing stablecoin structure.
In the official announcement, Circle co-founder, chairman and chief executive Jeremy Allaire said obtaining a New York trust charter had been a long-term objective because of the regulatory clarity associated with the state’s framework.
Allaire also described the NYDFS as an international standard setter for digital asset regulation and said the approval places USDC within what he called a strong and respected regulatory framework as digital dollars become more important in global finance.
Circle deepens decade-long relationship with NYDFS
Circle’s latest approval extends a regulatory relationship with the NYDFS that spans more than a decade.
The company noted that it became the first recipient of a BitLicense in 2015, making New York one of the earliest jurisdictions to supervise its digital asset business. The newly granted trust charter adds another license under the same regulator as Circle continues operating regulated stablecoin services.
Unlike the federal OCC approval, which established a national trust bank, the New York authorization is issued at the state level and governs Circle New York Trust under NYDFS oversight.
The two approvals together expand Circle’s regulatory footprint without replacing one another, as each operates under a different legal framework.
Circle continues expanding infrastructure around USDC
The trust charter arrives during a period of continued expansion across Circle’s payments and blockchain infrastructure.
As crypto.news previously reported, Circle announced on July 27 that it had acquired more than 680 IBM patent families covering nearly 1,000 issued patents worldwide. According to the company, the portfolio spans blockchain infrastructure, banking, payments, enterprise systems, insurance, supply-chain verification and secure cloud operations, with intended support for products including USDC, Circle Payments Network and Arc.
Circle did not disclose financial terms for the patent acquisition or identify which patents directly relate to stablecoin issuance or payment infrastructure.
Earlier in July, Circle also signed separate memorandums of understanding with South Korea’s Kakao Group and fintech operator Toss to explore blockchain payments, cross-border settlement and stablecoin infrastructure. According to the companies, the discussions include possible connections between future KRW-denominated digital assets, USDC and existing financial networks, although no commercial launch has been announced.
Circle has also said it does not plan to issue its own won-denominated stablecoin, instead positioning USDC as infrastructure that could connect local digital currencies with international payment networks.
The latest New York approval adds another regulatory milestone as Circle continues building its stablecoin and payments business across both U.S. regulatory frameworks and overseas partnerships.

Coronation Street spoiler videos confirm huge exit and shock attack | Soaps

(VIDEO) Michael B. Jordan Reimagines “The Thomas Crown Affair” in First Trailer Ahead of 2027 Theatrical Debut

Ethereum price tumbles below $1,900, will $1,850 hold?

Renter of Home in Anne Heche Crash Denies Settlement With Son

No Jackpot Winner as $257 Million Prize Rolls Over to $269 Million Monday Draw

Weekend Open Thread: Staud – Corporette.com

While America Argues, Japan Just Moved On XRP. Here’s What It’s COSTING Us

Buddy, do you think this makes you look cool? calebhammercomposer #money #finance #financialaudit

Crypto Trading LIVE: BTC Live Trading Bitcoin Analysis | 28 JULY #crypto #bitcoin #btc
-
 Sports5 days ago
Commonwealth Games boxing: Jadumani Singh seals dominant 5-0 win over Pakistan’s Sumama Rehman to enter quarter-finals | Commonwealth Games News
-

 Business2 days ago
Why Trees Belong on the Risk Register
-

 Tech5 days ago
Intel is reversing course and bringing hyper-threading back to its server chips
-

 Fashion8 hours ago
Weekend Open Thread: Wit & Wisdom
-

 Politics4 hours ago
Meta enters AI-training agreement with far-right ‘propaganda rag’ Newsmax
-

 Crypto World6 days ago
Ripple bought a bank in pieces. The $4 billion audit
-

 Politics5 days ago
Luke Littler dismantles Gerwyn Price to retain title in Blackpool
-

 Politics4 days ago
The Part of the Electric Transition Nobody Wants to Discuss
-

 News Videos5 days ago
BITCOIN JUST ENTERED THIS CRITICAL ZONE…
-
 Entertainment3 days ago
‘Stargate’ Creator’s New Sci-Fi Series Returns for Season 3 Tomorrow
-

 Crypto World6 days ago
XRP Ledger adds $2.6B as RWA inflows rank second
-

 Business3 days ago
Major shareholder moves on Canyon
-

 Politics6 days ago
Spain sweeps the board at 2026 World Cup with individual awards
-

 News Videos2 days ago
Bitcoin Enters the 3rd Stage of the Bear Market
-

 Entertainment6 days ago
Sara Gilson Killed By Husband After Viral “Pedophile” TikTok Video
-

 Crypto World3 days ago
Kraken Enables Retail Access to Jersey Mike’s IPO via Tokenized Shares
-

 Tech7 days ago
Anthropic launches Claude Opus 5, a cheaper AI model for coding, agents and enterprise workflows
-

 Tech4 days ago
New macOS Sequoia & Sonoma security updates for older Macs
-

 News Videos3 days ago
Claude: Build Financial Dashboards in Minutes (2026)
-

 Politics1 day ago
Luke Littler’s dominance sparks GOAT debate
You must be logged in to post a comment Login