
Crypto World
Relative Strength Index (RSI): Trading Strategies, Settings, and Market Applications
RSI is a popular momentum indicator in technical trading across forex, stock, and cryptocurrency* markets. The Relative Strength Index (RSI) is a momentum oscillator developed by J. Welles Wilder that measures the speed of price movements on a 0–100 scale. Traders use it to detect overbought/oversold conditions, trend strength, pullbacks, and exhaustion.
Although often viewed as a basic oscillator, the RSI plays a more nuanced role in professional trading strategies, particularly when combined with trend and volatility indicators. Understanding how the RSI behaves in different market environments may help traders refine entries, implement risk management strategies, and confirm trade setups.
In this article, we will consider how the RSI indicator works, how it is calculated, and how it can be applied in practical trading strategies across multiple asset classes.
Takeaways
- The Relative Strength Index (RSI) is a momentum indicator that measures the speed and magnitude of recent price movements to evaluate whether an asset is overbought or oversold.
- Developed by J. Welles Wilder, the RSI is plotted on a scale from 0 to 100 and is most commonly calculated over a 14-period timeframe.
- At its core, the RSI compares the average size of recent gains with the average size of recent losses over a defined period.
- Traditionally, RSI trading rules suggest that readings above 70 indicate overbought conditions, while readings below 30 signal oversold levels.
- Besides overbought and oversold signals, the indicator can provide divergence, trend strength, and failure swings signals.
What Is the Relative Strength Index?
The Relative Strength Index (RSI) is a momentum oscillator in modern technical analysis. Developed by J. Welles Wilder Jr. and introduced in 1978 in New Concepts in Technical Trading Systems, the indicator measures the speed and magnitude of recent price movements in order to evaluate underlying market momentum.
The RSI is plotted on a scale from 0 to 100 and is classified as an oscillator because it fluctuates within a fixed range rather than following price directly. This structure allows traders to evaluate whether buying or selling pressure is strengthening or weakening relative to recent market activity.
In practice the RSI functions less as a reversal indicator and more as a momentum persistence gauge. In directional markets the oscillator spends extended time in one half of its range, reflecting order-flow imbalance rather than exhaustion. Professional traders therefore interpret extreme readings as trend participation signals unless market structure begins to break.

Although the RSI is often introduced as a simple overbought-oversold tool, its practical application in professional trading is considerably broader. In leveraged markets such as forex and CFDs, traders use the indicator to identify pullbacks within trends, detect momentum divergence, and refine entry timing across multiple timeframes. The RSI therefore functions less as a standalone signal generator and more as a contextual momentum filter within broader trading systems.
The RSI belongs to the family of bounded momentum oscillators introduced by J. Welles Wilder in New Concepts in Technical Trading Systems (1978), alongside the average true range (ATR), the average directional movement index (ADX), and the parabolic stop and reverse (Parabolic SAR).
RSI Formula and Calculation
How is RSI calculated? It’s quite difficult to calculate the RSI. Fortunately, you don’t need to do it manually, as it’s one of the standard indicators implemented in most trading platforms. For instance, you can use TickTrader to examine the RSI without making complicated calculations.
However, it’s worth understanding how the indicator is measured to know which metrics can affect its performance.
The RSI Formula Explained
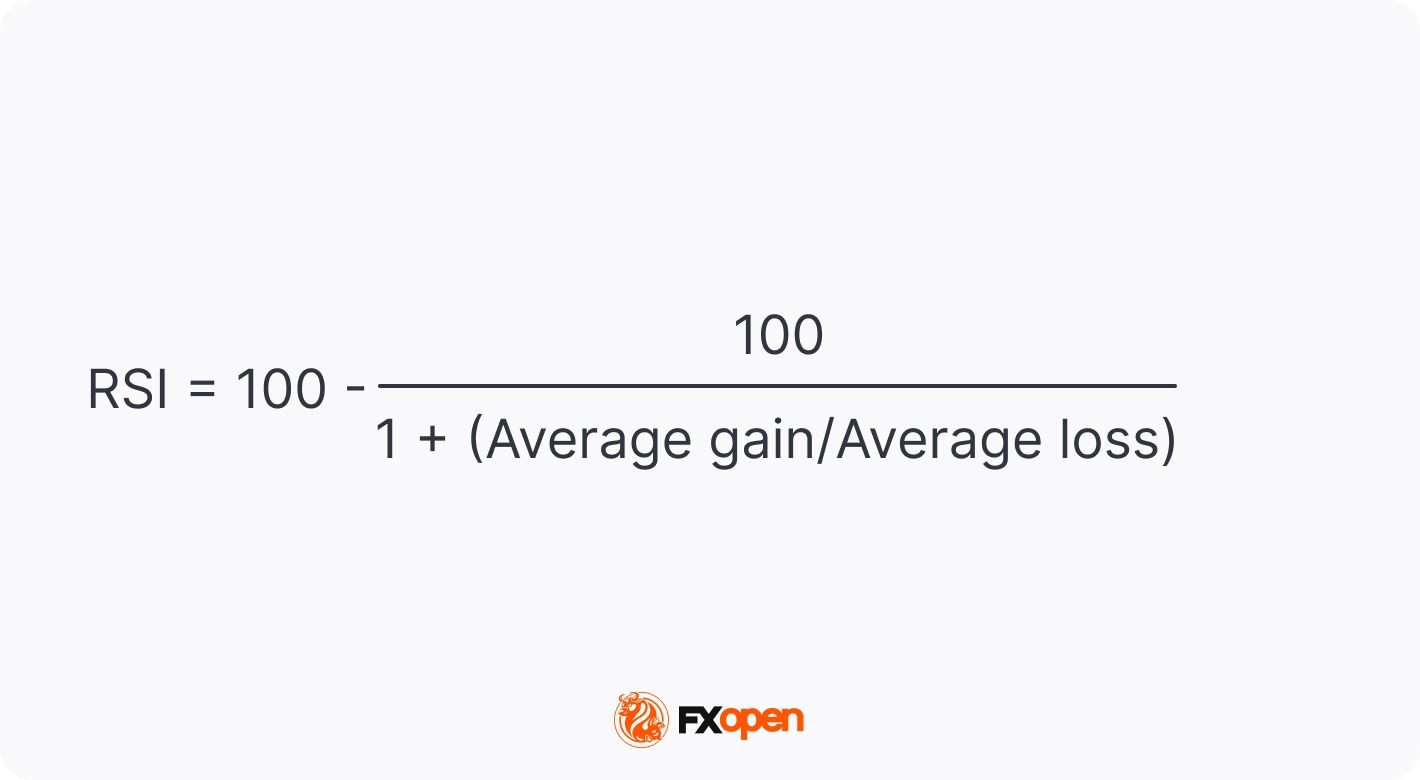
RSI formula
The calculation involves three main steps. First, the average gain and average loss over the selected period are determined. Second, these values are used to calculate relative strength, defined as the ratio of average gains to average losses. Finally, this ratio is transformed into an index value between 0 and 100 using the RSI formula.
The most popular RSI period is 14, meaning its values are based on closing prices for the latest 14 periods, regardless of the timeframe. We will use this period as an example of RSI calculations.
The standard RSI formula description:
Step 1: Average Gain and Average Loss
To calculate average gains and losses, you need to calculate the price change from the previous period.
Note: If the current price is higher than the previous one, add the gain to a total gain variable. If the price declined from the previous period, add the figure to a total loss variable.
After you calculate the change for all 14 periods, you need to add up the gains and divide them by 14 and sum up the losses and divide the total by 14.
Step 2: Calculate the Relative Strength (RS)
RS = Average Gain / Average Loss
To calculate the relative strength, divide the average gain by the average loss.
Step 3: Calculate the RSI
Now that you calculated the RS, you can proceed with the RSI value. For this, you need to add 1 to RS, divide 100 by the sum, and subtract the result from 100.
Relative Strength Index = 100 – 100 / (1 + RS)
Because the calculation uses smoothed averages of gains and losses, the RSI reacts to volatility contraction faster than to volatility expansion. This asymmetry explains why the indicator often gives early signals near market tops but delayed signals near lows.
What RSI Setting Do Traders Use?
The standard period is 14. Shorter lookback periods produce a more sensitive indicator that reacts quickly to price changes but generates more noise. Longer periods smooth out fluctuations but may lag behind rapid market shifts. This trade-off explains why RSI settings are often adjusted according to strategy type, whether scalping, day trading, or swing trading.
The following adjustments are common depending on strategy and timeframe:
Scalping strategies often use shorter RSI periods to capture rapid momentum shifts on lower timeframes. While this increases signal frequency, it also requires stricter risk management due to higher noise levels.
Want to learn how to read the RSI indicator signals?
How Is the RSI Indicator Used in Trading?
How to interpret the RSI indicator? There are four common ways to use the RSI indicator when trading: spot overbought and oversold conditions, find price divergences, implement failure swings for reversal signals, and determine market trends.
Relative Strength Index: Overbought/Oversold Indicator
The traditional interpretation of RSI levels focuses on the 70 and 30 thresholds. Readings above 70 are commonly described as overbought, while readings below 30 are considered oversold. However, in professional trading environments these thresholds are treated as reference zones rather than absolute signals.
The 70/30 framework works primarily in rotational markets. During macro-driven trends, price commonly continues moving after entering overbought or oversold territory because positioning flows dominate short-term mean reversion. In these conditions the RSI defines pullback zones rather than reversal zones.
During sustained uptrends, the RSI typically fluctuates between 40 and 80 (sometimes reaching 90 in very strong trends). Pullbacks often hold above 40, showing that bullish momentum remains intact. In sustained downtrends, the RSI usually ranges between 20 and 60, with rallies failing near 60, reflecting persistent selling pressure. These shifting RSI ranges may help traders assess trend strength rather than relying solely on the traditional 70/30 overbought–oversold levels.
Sustained RSI range shifts usually reflect systematic positioning rather than retail momentum. When the oscillator establishes a higher equilibrium range, dips towards the mid-zone often coincide with passive liquidity absorption rather than trend rejection.
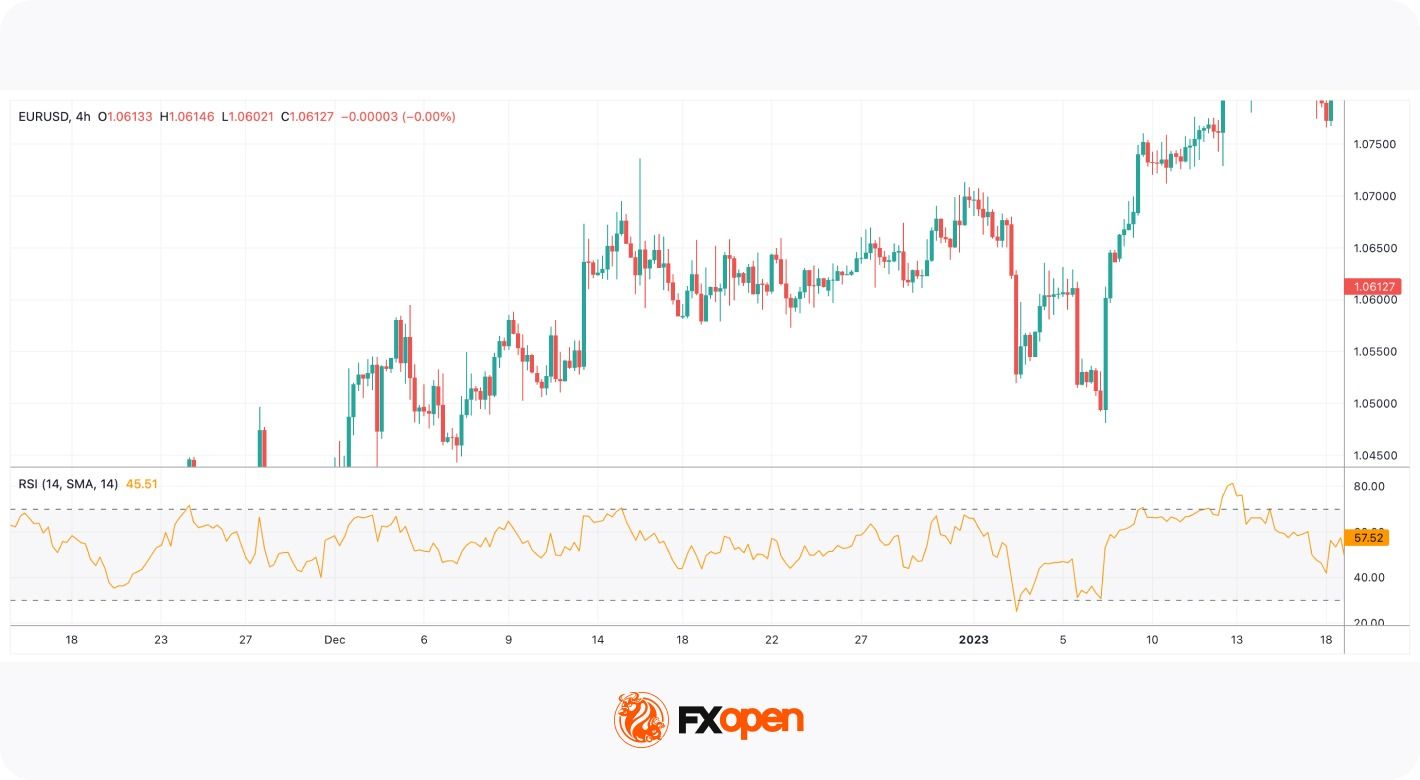
On the daily chart of the GBP/USD pair, the RSI entered the oversold area on 22nd April, left it for a while on 4th May, but returned to it and continued moving upwards only on 15th May.
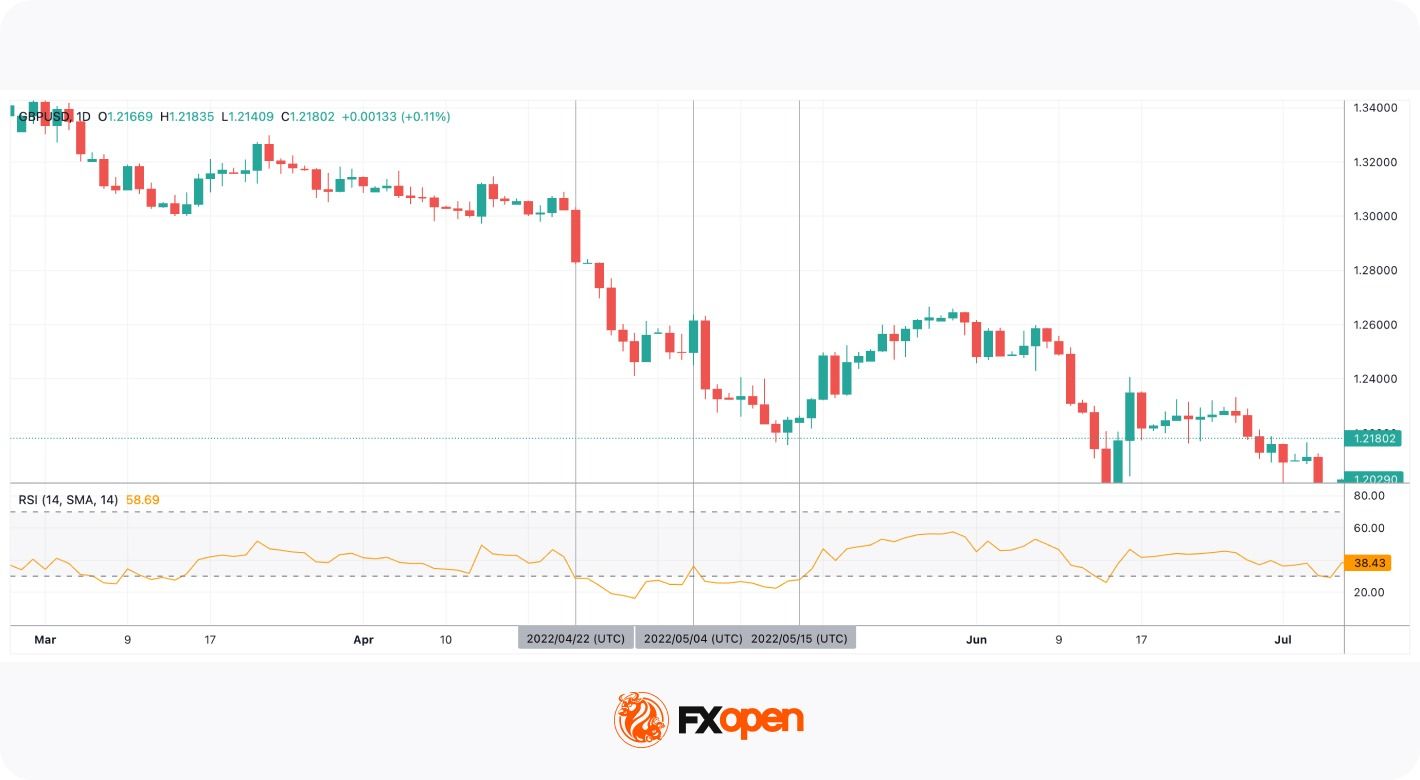
An example of the oversold RSI
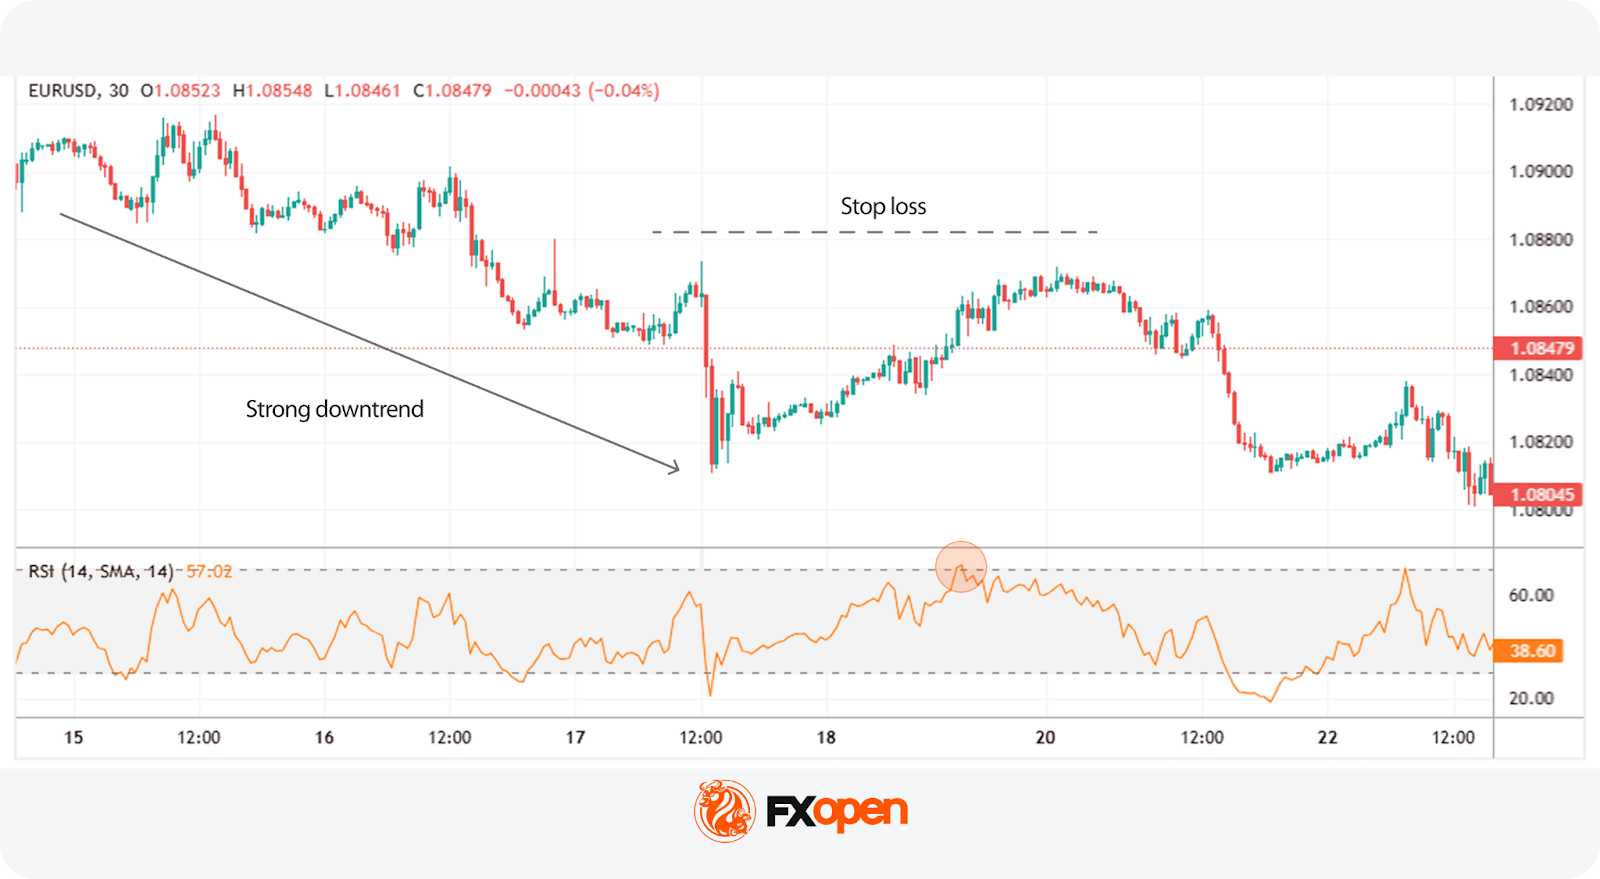
Additionally, when using overbought/oversold signals, traders keep in mind that they can reflect an upcoming correction, not a trend reversal. The GBP/USD pair was trading in a strong downtrend, and the RSI provided a signal of a short-term correction only.
To distinguish between corrections and reversals, traders combine the RSI with other tools. A cross of a moving average can confirm a change in the trend.
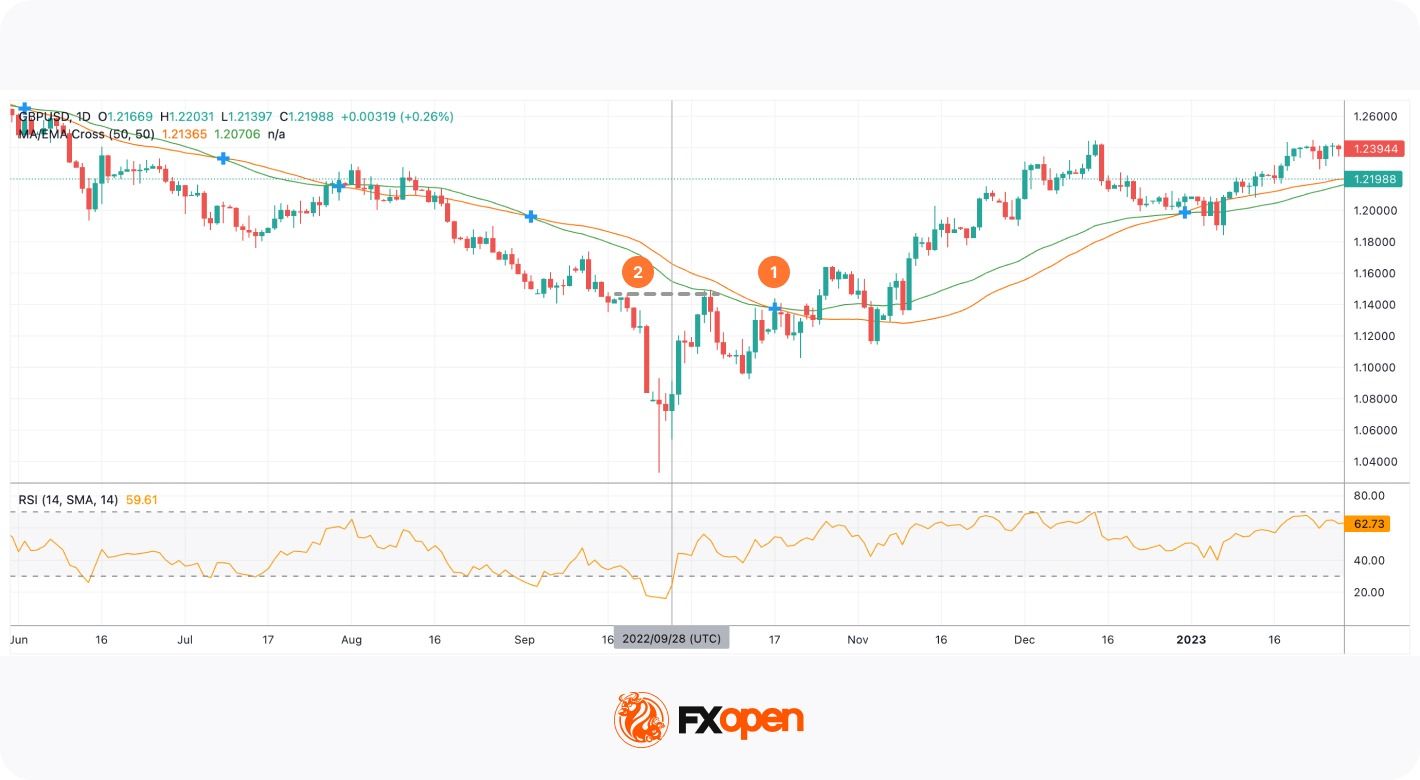
Oversold RSI strategy
On the chart above, the RSI broke above the 30 level on 28th September. A trader could go long, using a trailing take profit. After the MA/EMA cross occurred (1), a trader could trail the take-profit target. Another option would be to place the take-profit order at the closest resistance level (2) and wait for the cross to confirm the reversal signal. After the confirmation, a trader could open another buy position and drive the uptrend.
RSI Divergence Strategy
RSI is a divergence indicator. Another option for using the RSI is to look for divergences between the indicator and the price chart. Divergence occurs when price action and indicator momentum move in opposite directions, signalling a potential shift in underlying market dynamics.
A convention widely used in exchange educational materials is:
- An RSI bullish divergence forms when price records a lower low while the RSI prints a higher low. This pattern indicates that selling pressure is weakening even as price continues to decline.
- An RSI bearish divergence, by contrast, appears when price reaches a higher high but the RSI forms a lower high, suggesting diminishing upward momentum.
Divergence is more popular when it occurs near key support or resistance levels. However, because divergence can persist for extended periods before price reverses, it is rarely traded in isolation. Many traders confirm RSI divergence using tools such as the MACD or structural breaks in market structure.
Hidden divergence is another variation that signals trend continuation rather than reversal. In trending markets, this form of divergence may help traders identify pullbacks that are likely to resolve in the direction of the prevailing trend.
- A bullish divergence forms when the price rises with higher lows, but the relative strength index declines with lower lows, traders expect the price to move upwards.
- A bearish divergence forms when the price falls with lower highs, but the relative strength index moves upwards with higher highs, traders believe the price will decline.
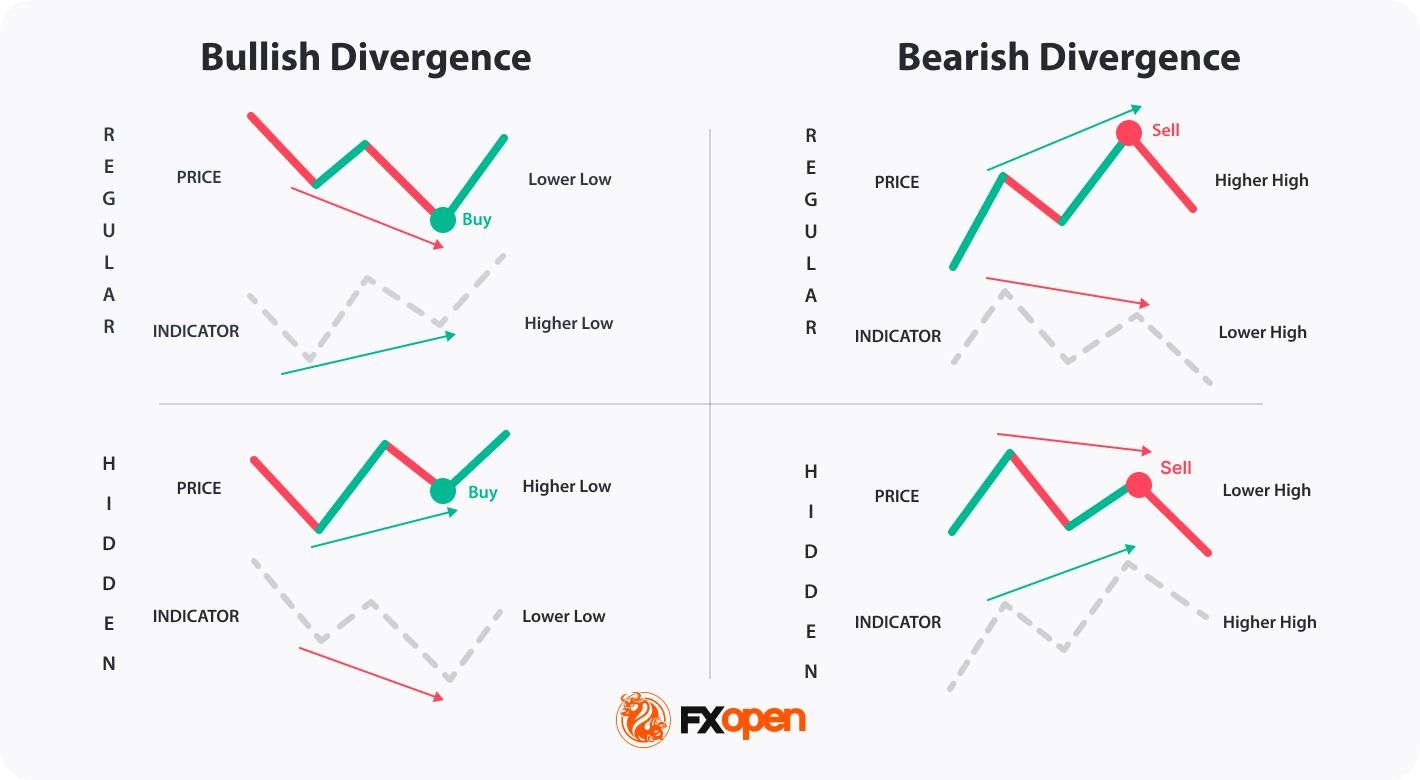
Regular and hidden RSI divergence
Divergence frequently precedes momentum slowdown instead of immediate reversal. Markets often transition into consolidation before changing direction, which is why many traders wait for structure breaks rather than trading the first divergence signal. For example, in liquid index markets the first divergence often leads to range formation before trend change.
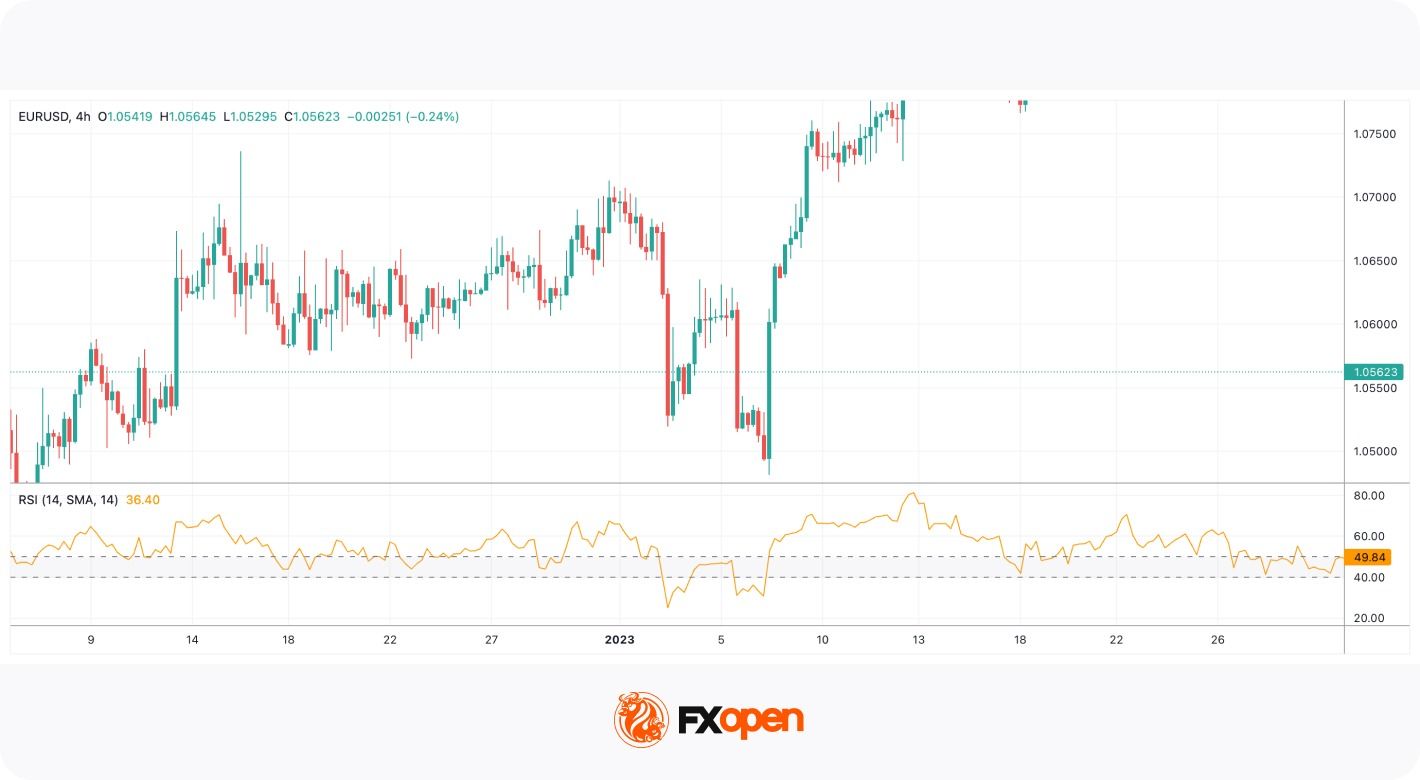
In the RSI example chart below, the indicator and the price formed a regular bearish divergence. As a result, the price fell (1). There was another divergence before the fall, but the price decline was short-lived (2). This highlights risks associated with the incorrect signals the RSI divergence may provide.
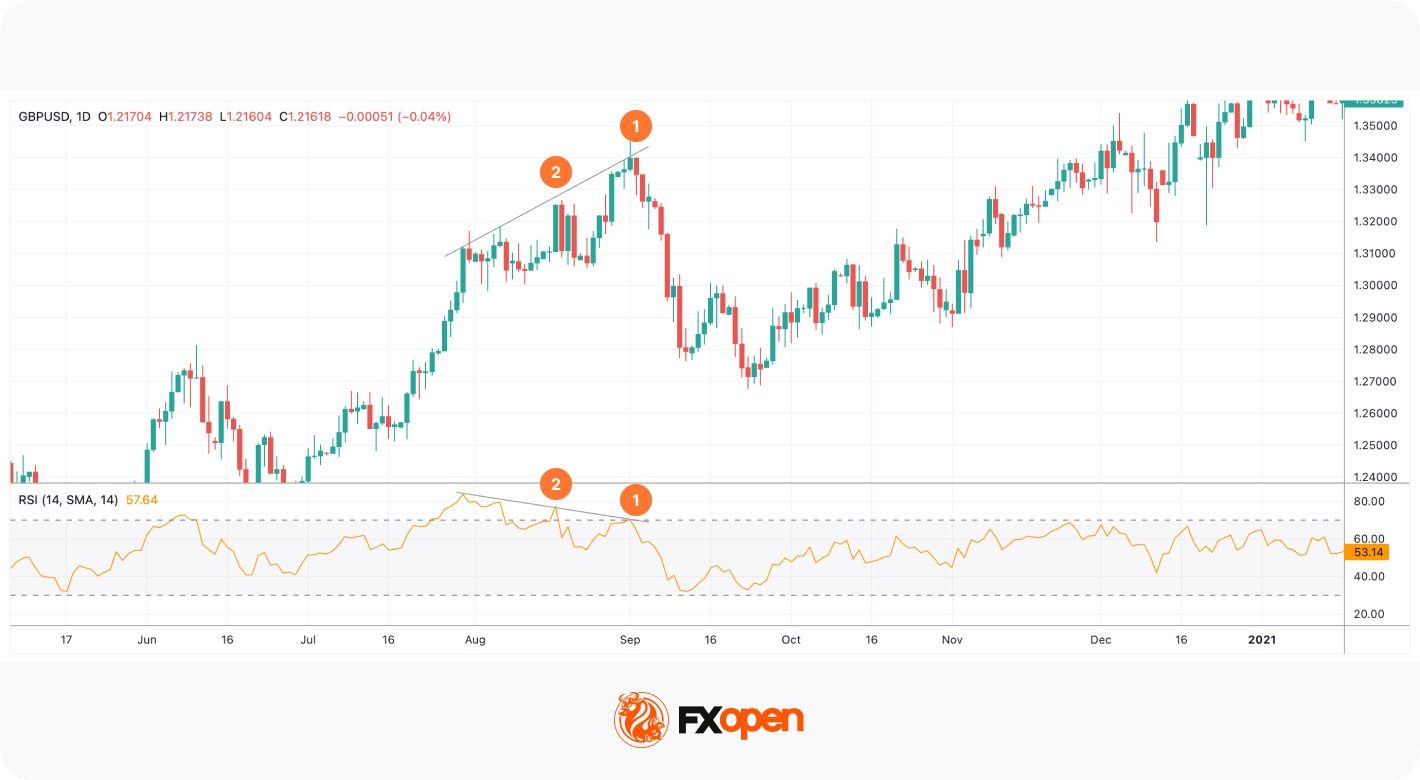
An example of the RSI divergence
RSI Failure Swings: A Reversal Signal
Another signal that traders can consider is failure swings of the RSI which occur before a strong trend reversal. Although it is less common than the others, traders can add it to their list of tools.
The theory suggests traders don’t consider price actions but look at the indicator alone.
- Bullish reversal. A trend may turn bullish when the RSI breaks below 30, leaves the oversold area, falls to 30 but doesn’t cross it and rebounds, continuing to rise.
- Bearish reversal. A trend may reverse down when the RSI enters the overbought area, crosses below 70, and returns to 70 but bounces and continues falling.
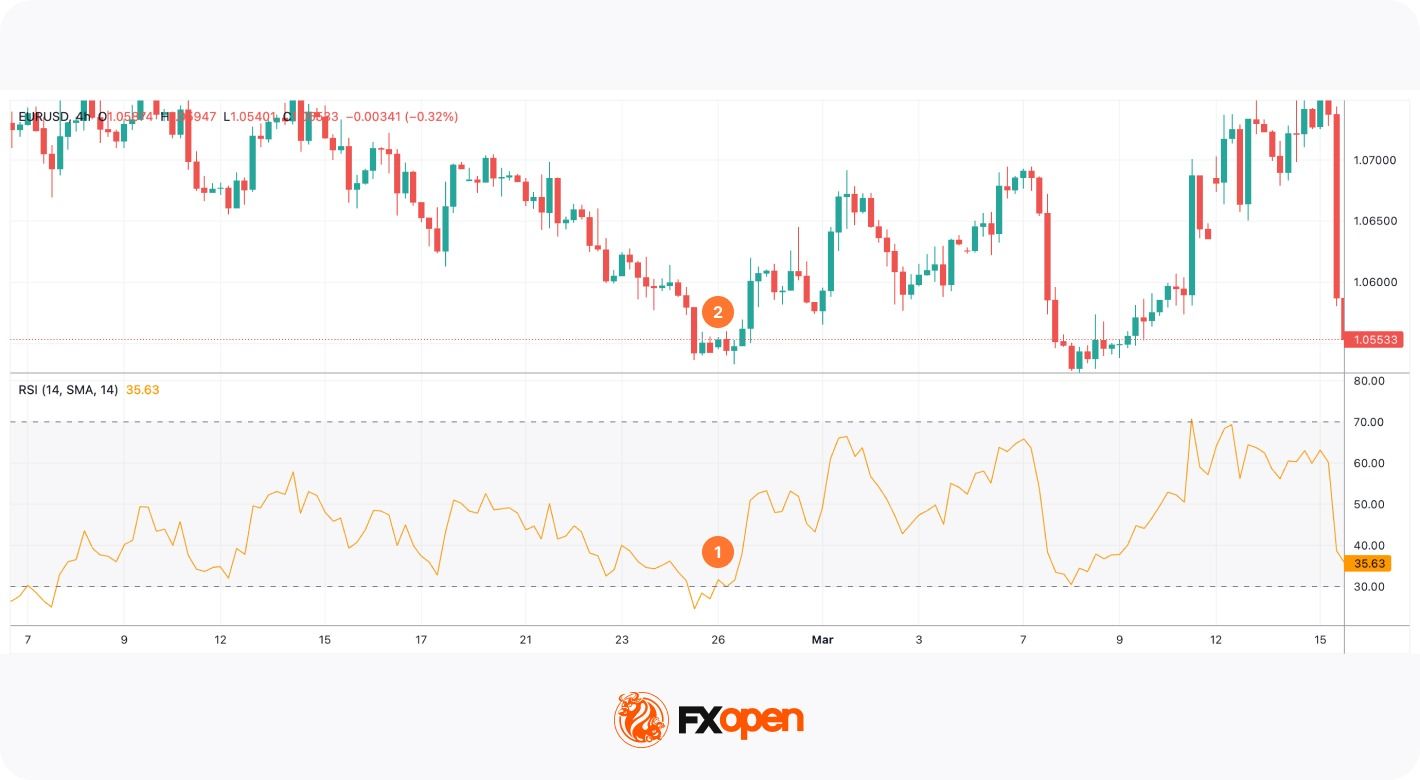
An example of RSI failure swings
Failure swings lose significance during volatility expansion events such as economic releases, when directional movement is driven by repricing rather than momentum decay.
In the chart above, the RSI trading indicator broke below 30, left the oversold area, and retested the 30 level (1). At the same time, the price formed the bottom, and the downtrend reversed upwards (2).
Failure swings are more common on short-term timeframes and do not always reflect a trend reversal. Therefore, traders combine the RSI with trend and volume indicators.
How Traders Identify Market Trends with RSI
The RSI can be used to identify a trend direction. Constance Brown, the author of multiple books about trading, noticed in her book Technical Analysis for the Trading Professional that the RSI indicator doesn’t fluctuate between 0 and 100. In a bullish trend, it moves in the 40-90 range. In a bearish trend, it fluctuates between 10 and 60.
To identify the trend, traders consider support and resistance levels. In an uptrend, the 40-50 zone serves as support. In a downtrend, the 50-60 range acts as resistance.
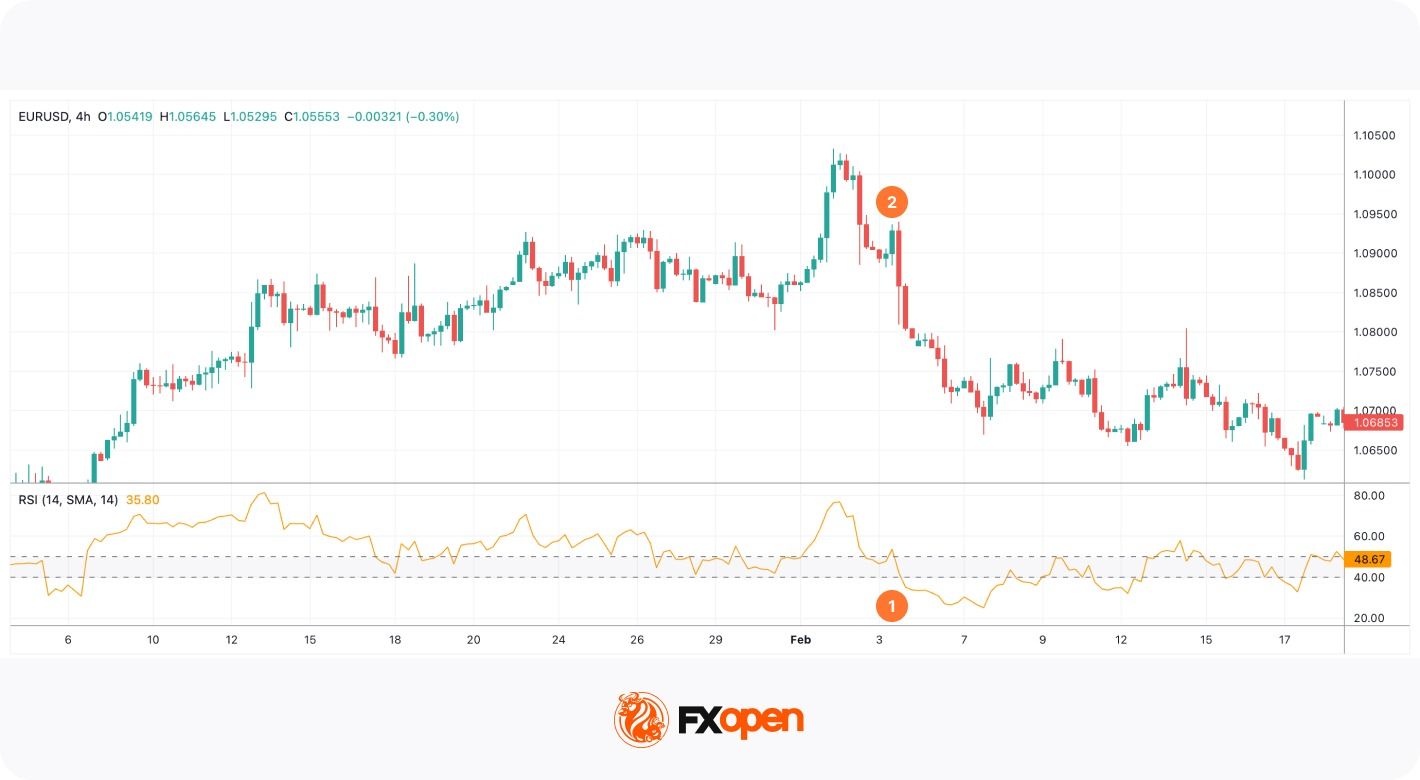
An example of trend determination using the RSI
In the chart above, the RSI stayed above 40 as the price was moving in a solid uptrend. Once it broke below the 40-50 support level (1), the trend changed (2).
However, there may be incorrect signals. In the chart below, the RSI broke below the support level twice, but the trend didn’t change.
An example of unsuccessful trend detection using RSI
Ranges may vary depending on the trend strength, price volatility, and the period of the RSI.
RSI and Simple Moving Average
Usually, the RSI indicator consists of a single line. However, there are variations of the indicator. It can be combined with the simple moving average. The moving average usually has the same period as the RSI.
The rule is that when the RSI breaks below the SMA, the price is supposed to fall (1). When the RSI rises above the SMA, the price is expected to increase (2).
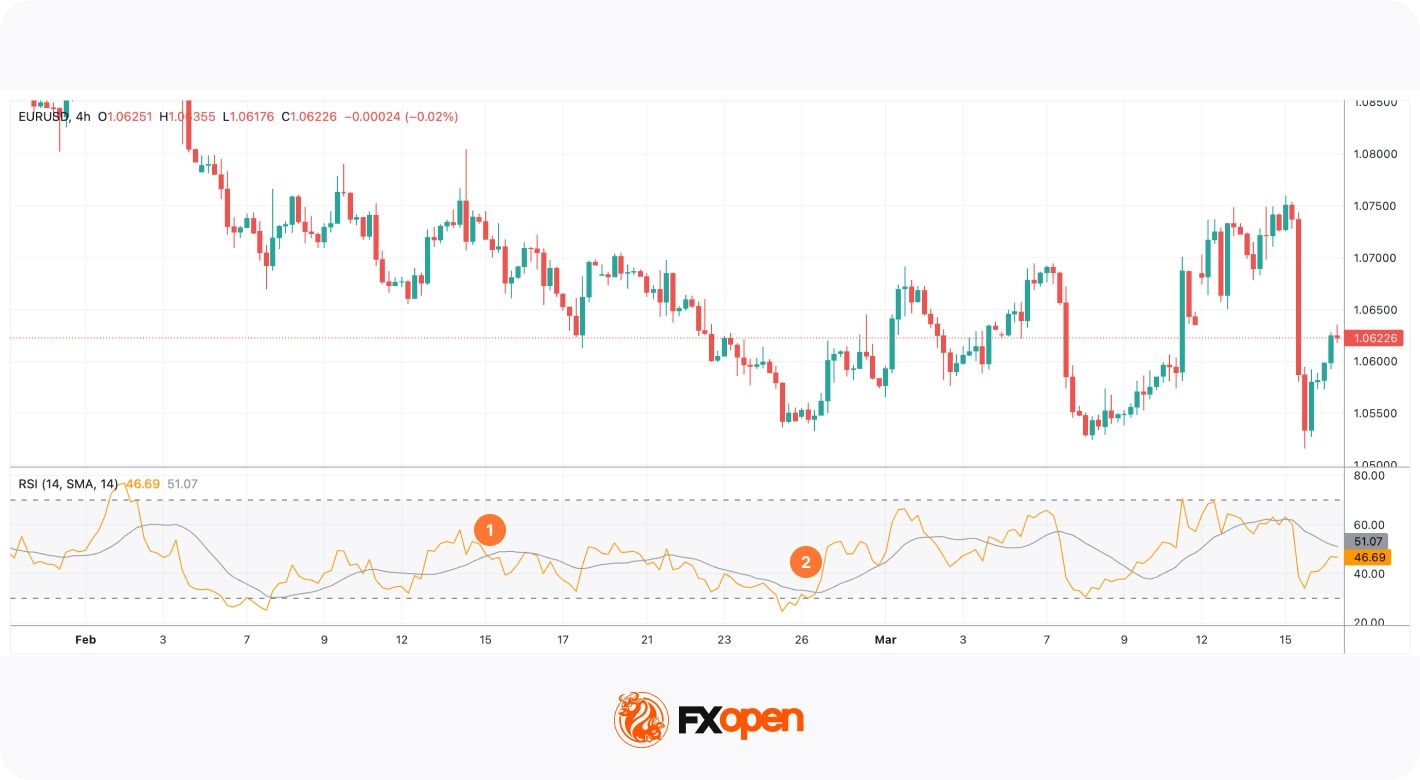
RSI and Simple Moving Average
However, there are some aspects to consider. Firstly, traders avoid using RSI/SMA cross signals in the ranging market as the lines move close to each other and cross all the time, providing many fake signals. Secondly, a cross doesn’t determine the period of a rise or a fall. Traders use additional tools to identify where the price may turn around.
Note: The RSI is sensitive to volatility clustering. During news-driven sessions the indicator’s thresholds lose value because price movement is distribution-driven rather than momentum-driven.
RSI Trading Strategies Used by Professional Traders
Professional use of the RSI typically involves integrating the indicator into structured trading frameworks rather than relying on single signals. Several widely used approaches illustrate how momentum analysis can support decision-making.
What Is the 70-30 RSI Trading Strategy?
70-30 RSI Trading Strategy
The 70-30 RSI strategy simply uses the overbought and oversold RSI readings to identify potential turning points. However, instead of simply going short above 70 (overbought RSI) and long below 30 (oversold RSI), traders typically apply a few levels of refinement.
Entry:
- Traders determine if the trend is bullish or bearish.
- They apply a trend filter. The RSI can produce false signals in a strong trend, showing overbought for a long time in a bullish trend and vice versa. They often use the 70-30 strategy to look for shorts when the price rallies in a downtrend and longs when the price dips in an uptrend.
- They enter the market when the RSI crosses back into the normal range. For instance, they’ll open a short trade when the RSI falls back below 70, indicating that a potential bearish reversal may be underway.
Stop Loss:
- Stop losses are often set beyond a nearby swing point.
Take Profit:
- Profits might be taken at an area of support or resistance when the RSI hits the opposite extreme (e.g. 70 when long), or when other indicators signal a price reversal.
Mean-reversion RSI strategies statistically depend on market volatility compression. As volatility expands, breakout continuation tends to dominate over oscillator reversal signals.
50-60 and 40-50 Trading Strategies
50-60 RSI Trading Strategy
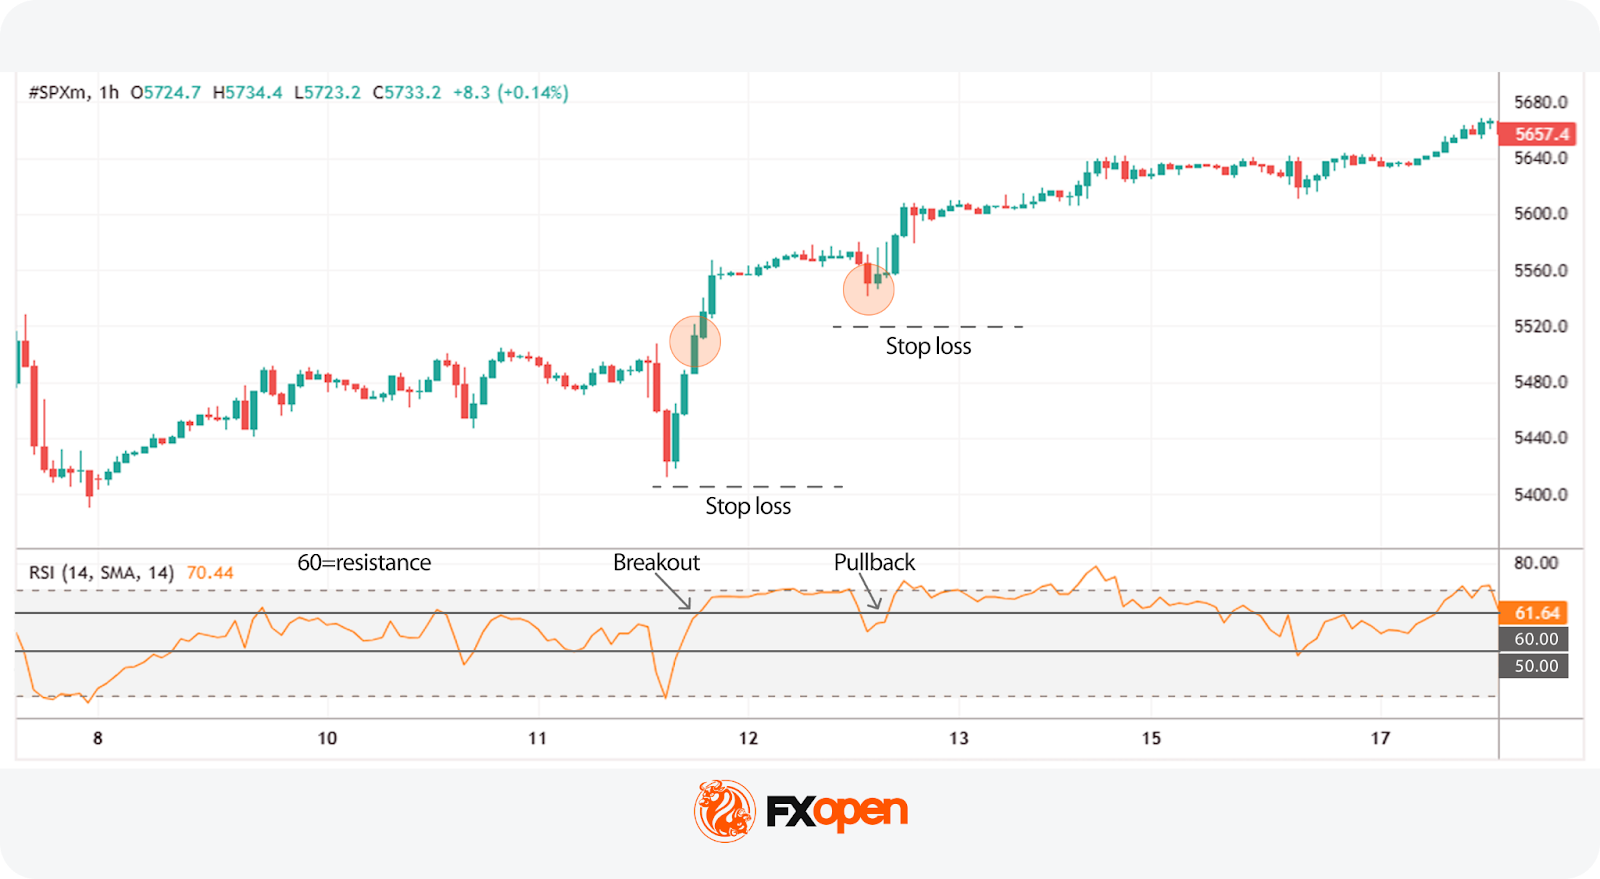
What is the 50-60 RSI trading strategy? The 50-60 RSI strategy works on the idea that the market shows bullish momentum above 50, with 60 acting as a resistance level. When the price breaks through 60, it can signal that bullishness is strong, offering a potential entry point.
Note:
- Despite the name, the same logic can be applied in a bearish trend, where 40 acts as a support level.
- This strategy is popular in markets with a strong trend. Indices, such as the S&P 500 and Nasdaq 100, or commodities like gold, that exhibit strong trends are often chosen by traders.
Entry:
- Traders may enter the market when the price crosses above 60 for the first time.
- Alternatively, they might wait for a pullback to 60 before going long.
Stop Loss:
- A stop loss may be set beyond the nearest major swing point or just beyond the entry candle on a pullback.
- Alternatively, some traders manually stop out if the price crosses below 50.
Take Profit:
- Profits might be taken when the price crosses below 50, giving room for the trade to run in a strong trend. However, this may limit potential returns when trading on short-term timeframes. Therefore, some traders prefer the closest resistance levels.
Typical RSI Strategy Comparison
RSI Meaning in Trading: Forex, Stocks, and Crypto* Markets
The RSI is applied across asset classes, but it behaves differently because persistence characteristics vary. Equity indices exhibit autocorrelation, currencies exhibit mean reversion around macro levels, and digital assets display momentum clustering. RSI interpretation should therefore be adjusted to the instrument’s structural behaviour rather than fixed thresholds.
In forex trading, where macroeconomic factors often drive sustained directional moves, the RSI is commonly used to identify pullbacks within trends rather than outright reversals. Currency pairs can remain overbought or oversold for extended periods when central bank policy or macro data supports a strong directional bias.
What is the RSI indicator in the stock market? In the stock markets, the indicator is frequently applied to mean-reversion strategies around key support and resistance levels. Stocks tend to exhibit more frequent range-bound behaviour than major currency pairs, making traditional overbought-oversold interpretations somewhat more applicable.
Cryptocurrency* markets, characterised by high volatility and rapid sentiment shifts, often produce extreme RSI readings. In this environment, divergence analysis becomes particularly valuable, as momentum frequently weakens before price reverses.
How to Use the Relative Strength Index with Other Indicators
In professional trading systems, the RSI is rarely used in isolation. Combining momentum analysis with trend, volatility, and volume tools may help traders filter signals and false entries.
RSI with MACD
RSI and MACD (moving average convergence divergence) are oscillators. However, they measure momentum differently, which allows one to confirm the signals of another. Usually, traders look for RSI overbought/oversold signals and MACD divergence. For instance, when the RSI is in the oversold zone but the MACD has a bullish divergence with the price chart, traders consider this a confirmation of a coming price rise. Read our article RSI vs. MACD.
RSI with Moving Averages
Early signals are one of the limitations of the RSI indicator. Therefore, traders often combine them with lagging technical analysis tools. An exponential moving average (EMA) is one of the options. Traders add two EMAs with different periods to the chart and wait for a cross to confirm the trend reversal signal the RSI provided.
RSI with Bollinger Bands
Bollinger bands are used similarly to the RSI, showing when the market is possibly overbought or oversold. Used together, these two indicators can provide confluence; for example, if the RSI indicates overbought and the price has closed through the upper band, then there may be an increased likelihood of a bearish reversal, and vice versa.
RSI with On-Balance Volume (OBV)
The on-balance volume (OBV) is a tool that tracks volume to confirm trends. Paired with the RSI, it has two uses. The first is that it can indicate trend strength. If the RSI is falling alongside the OBV, the bearish trend is likely genuine and vice versa. The second is confirming divergences. The OBV can diverge from the price like the RSI, so if both diverge, a reversal may be inbound.
Using RSI on Trading Platforms
Most trading platforms include the RSI as a standard built-in indicator. Platforms such as MetaTrader 4 and MetaTrader 5 allow traders to adjust periods, apply smoothing, and set custom alert levels. Also, you can implement the RSI indicator into your trading strategy on TradingView and TickTrader platforms, which also allow you to set up the indicator for your unique trading style.
Professional traders often integrate RSI signals into multi-timeframe analysis. For instance, a higher-timeframe RSI reading may define directional bias, while a lower-timeframe signal provides entry timing. This approach reduces the likelihood of trading against broader market momentum.
Pros and Cons of the RSI Indicator
Although the relative strength index is one of the most popular indicators, it has limitations. Let’s explore the two sides of the coin.
Benefits of the RSI in Trading
The relative strength index is a useful tool because of:
- Numerous signals. The RSI provides different signals so traders with different trading approaches can add it to their tool list.
- Numerous assets and timeframes. One of its advantages is that you can use the RSI on any timeframe of any asset. What does the RSI stand for in stocks? The same thing that it stands for in forex, commodity, and cryptocurrency* markets.
- Simplicity. Despite the wide range of signals, it’s easy to remember them. If you are familiar with other oscillators such as the stochastic oscillator, you will quickly learn how to use the RSI indicator.
- Standard settings. Although you can change the period of the RSI, its standard period of 14 is used in many trading strategies.
- Working signals. The RSI is one of the most popular trading tools. However, the reliability of its signals depends on trader skills and market conditions.
Limitations and False Signals of RSI
Although the RSI is a functional tool, there are some pitfalls traders should consider.
- Weak at trend reversals. The indicator may provide early signals when spotting trend reversal.
- False signals. The relative strength index isn’t a very popular tool in ranging markets.
- Lagging indicator. The RSI is based on past price data, meaning it may be relatively slow to react to sudden movements.
- Overbought/oversold conditions can persist. In strong trends, prices may remain above 70 or below 30 for long periods, leading to premature entries and exits.
Note: The RSI does not determine price direction; it measures the condition of the current move. Its primary value lies in distinguishing continuation conditions from exhaustion conditions.
Final Thoughts
The Relative Strength Index continues to play a central role in technical trading across forex, equities, and cryptocurrency* markets. Its value lies not in reflecting reversals in isolation but in providing insight into the strength and sustainability of price movements. When used alongside trend analysis, volatility measures, and volume indicators, the RSI becomes a powerful component of structured trading strategies.
For traders operating in leveraged CFD and forex markets, proper application involves combining the indicator with broader analytical tools, adapting settings to the trading timeframe, and maintaining disciplined risk management.
You can consider opening an FXOpen account today to build your own trading strategy in over 700 instruments with tight spreads from 0.0 pips and low commissions from $1.50 (additional fees may apply).
FAQ
What Does the RSI Stand For?
RSI stands for relative strength index. It’s a momentum-based indicator that measures the speed and magnitude of price movements.
What Is the RSI Setting?
The only setting of the Relative Strength Index is the period, which reflects the number of past candles used to calculate average gains and losses, affecting how sensitive the RSI is to price changes. The default period is 14, though shorter or longer settings may be applied depending on trading style and timeframe.
How Traders Use the RSI Indicator
The RSI moves between 0 and 100, with >70 meaning the asset is overbought and <30 meaning oversold. It can be used to spot potential market reversals and confirm trend strength.
Is RSI Used in Forex Trading?
Yes. The RSI is widely used in forex to identify pullbacks, confirm trends, and detect divergence signals.
How Do Traders Use RSI Divergence?
Divergence between price and RSI is often used to identify weakening momentum and potential reversals, particularly when confirmed by other indicators or price-structure analysis.
What Is the RSI in Stocks?
The RSI meaning in stocks refers to the same RSI indicator used in other asset classes. It’s used to gauge buying and selling pressure.
Is High RSI Bullish or Bearish?
A high RSI (above 70) signals bullish momentum, suggesting an overbought market and a potential soon downward reversal.
*Important: At FXOpen UK, Cryptocurrency trading via CFDs is only available to our Professional clients. They are not available for trading by Retail clients. To find out more information about how this may affect you, please get in touch with our team.
This article represents the opinion of the Companies operating under the FXOpen brand only. It is not to be construed as an offer, solicitation, or recommendation with respect to products and services provided by the Companies operating under the FXOpen brand, nor is it to be considered financial advice.

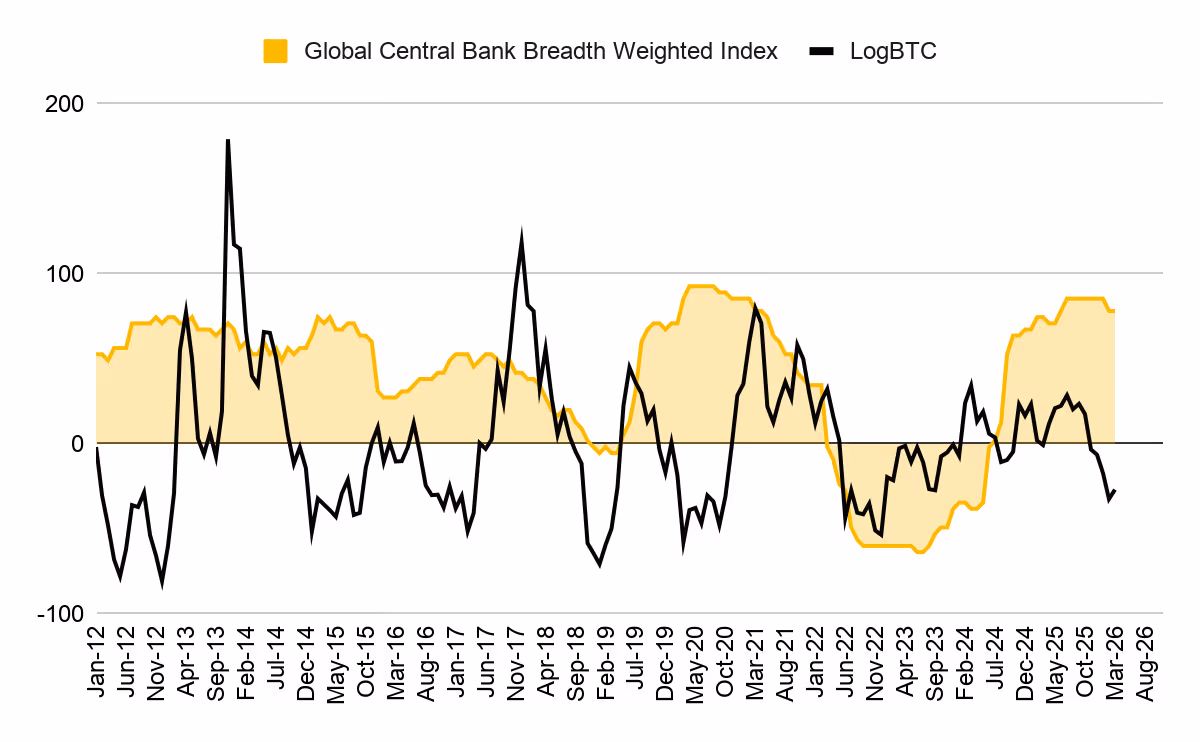
Bitcoin may no longer move in step with Federal Reserve policy, according to a new report from Binance Research, which points to a structural shift driven by spot exchange-traded funds.
For years, crypto markets reacted sharply to interest rate signals, with bitcoin falling when central banks tightened monetary policy.
That pattern now appears to be breaking as Binance data shows bitcoin’s correlation with its Global Easing Breadth Index, which tracks 41 central banks, has turned strongly negative since 2024. Spot bitcoin ETFs were approved by the U.S. Securities and Exchange Commission (SEC) in January 2024.

Before ETFs, the relationship was mildly positive, with BTC tending to follow global easing cycles by several months. Now, the report finds the opposite effect is nearly three times stronger, suggesting the old link has reversed.
The change reflects a shift in who drives prices. Retail investors once dominated crypto trading and reacted to macro news. ETFs allowed institutions to play a bigger role, and these firms often positioned months ahead of policy changes, treating BTC as a forward-looking asset.
“As a result, BTC may have evolved from a macro ‘lagging receiver’ to a ‘leading pricer,” Binance Research wrote. “A peak in easing may already be old news for BTC, and crypto-native drivers—such as policy progress and institutional flows—could matter more than the direction of monetary easing itself.”
The findings come as markets grapple with renewed stagflation fears tied to rising oil prices and growing geopolitical tensions over the war in the Middle East.
Rate expectations have swung from projected cuts to possible hikes, a backdrop that historically pressured risk assets.
Binance argues that the reaction may be overstated. In past cycles, central banks often pivoted to support growth despite inflation spikes. If history repeats itself, central banks are to eventually prioritize growth over inflation, and bitcoin will likely price that pivot earlier than expected.


Bitcoin drew mixed public views after new comments from market observers focused on long-term performance and price structure.
Summary
- Adam Livingston said Bitcoin trades 0.94 sigma below center as price structure tightens around power law.
- Livingston said Bitcoin’s historical trading range compressed sharply, with crashes and blowoff tops becoming less extreme.
- Peter Schiff said Bitcoin gained 12% in five years, trailing stocks, gold, and silver.
Adam Livingston said Bitcoin’s recent price action shows a more stable pattern. In a post on X, he wrote that the asset’s oscillations are “dampening” and that the “funnel is closing.” He said this pattern shows Bitcoin moving closer to equilibrium around its long-term power law center.
He added that Bitcoin now sits about “−0.94σ below center,” which he described as below trend and below fair value. Livingston said the narrowing range suggests blowoff tops are fading and that large crashes are also becoming less severe.
Livingston said Bitcoin’s trading range has tightened over time. He wrote that the 5.3σ range seen in 2011 to 2013 has compressed to 1.4σ in the 2021 to 2025 period. He argued that this shift shows Bitcoin trading in a narrower channel as the market matures.
He also pointed to the model’s reported strength during major market events. According to his post, the power law model absorbed the 2022 market crash, the FTX collapse, the 2024 recovery, the 2025 top, and the current drawdown, while its R² value rose to 0.961.
Schiff questions Bitcoin’s long-term edge
As we recently reported, Peter Schiff took a different view by focusing on Bitcoin’s five-year return. He said Bitcoin gained 12% over that period. He also said the Nasdaq rose 57.4%, the S&P 500 gained 59.4%, gold climbed 163%, and silver advanced 181%.
Using those figures, Schiff asked,
“If the appeal of Bitcoin is its superior long-term performance, why should anyone keep HODLing it?”
His remarks placed Bitcoin’s recent record next to more traditional markets and metals.

TLDR:
- Silver has surged over 140% in 2026, drawing direct comparisons to the dramatic 2011 price collapse pattern
- Strong industrial demand from EVs and solar panels is attracting more leverage, raising crash risk further
- Silver’s $30B annual market size makes it highly vulnerable to violent swings driven by capital flow shifts
- Forced selling through futures, ETFs, and thin liquidity could trigger a rapid cascade once the turn begins
Silver’s sharp rally in 2026 is drawing comparisons to the dramatic 2011 price collapse, with analysts warning that crowded positioning and thin market liquidity could trigger a violent reversal.
The metal has climbed over 140% recently, fueling widespread optimism. However, some market observers believe the current setup mirrors past cycles where strong narratives masked serious structural risks beneath the surface.
2011 Pattern Resurfaces as Silver Climbs Past Key Levels
The 2011 silver rally remains one of the most studied price events in commodity markets. Silver ran from $18 to $49 within months before collapsing sharply. The driving forces then included quantitative easing, inflation fears, and a retail rush into hard assets.
Narratives during that period sounded strikingly similar to today. Talk of shortages, undervaluation against gold, and early-stage positioning dominated market commentary. Yet the fundamentals never supported those price levels, and supply remained adequate throughout.
Crypto analyst BLADE recently noted on X that the 2011 collapse was never about silver itself. “It was about liquidity,” the post read, adding that high prices killed demand as manufacturers began reducing silver usage.
The breakdown came fast once positioning unwound. Silver dropped from $49 to $30 within days, eventually falling to $15 over time. The move was driven entirely by leverage and positioning shifts rather than any change in the underlying asset.
Strong Fundamentals May Be Attracting More Leverage, Not Less Risk
Today’s silver market does carry stronger fundamentals than 2011. Industrial demand from electric vehicles, solar panels, and electronics is real. Supply deficits exist, and inventory levels are tighter than in prior cycles.
However, BLADE warned that stronger fundamentals can make situations more dangerous. “Strong fundamentals don’t prevent crashes — they attract more leverage,” the post stated directly.
Silver remains a structurally thin market, valued at roughly $30 billion annually. Most trading activity runs through derivatives rather than physical markets. That structure means price action is driven by capital flows, not fundamental value.
Silver does not peak when the story falls apart. It peaks when positioning becomes crowded, margin reaches its limit, and exit liquidity disappears.
At that point, forced selling starts, and the cascade effect moves quickly through futures markets, ETFs, and market makers simultaneously.
The pattern BLADE described shows how silver can still push higher before any reversal. Parabolic moves tend to stretch beyond expectations.
The concern is not about direction but about what happens when the turn comes. In thin, leveraged markets, that turn rarely offers time to react before significant losses accumulate.


Peter Schiff has renewed his criticism of Bitcoin by questioning its long-term value as an investment.
Summary
- Peter Schiff: Bitcoin gained 12% in five years, trailing gold, silver, Nasdaq, and S&P 500.
- Michael Saylor said Bitcoin has outperformed assets since August 2020, arguing time frame changes comparisons.
- Santiment data showed Bitcoin bearish sentiment reached late-February highs, with ratio at 0.81 in comments.
In a post on X, he compared Bitcoin’s five-year return with gains in the Nasdaq, S&P 500, gold, and silver. His remarks framed the debate around whether Bitcoin still offers a stronger long-term case than traditional assets.
Peter Schiff said Bitcoin rose only 12% over the past five years. He also pointed to stronger gains in other markets during the same period. According to the figures shared in his post, the Nasdaq rose 57.4%, the S&P 500 gained 59.4%, gold climbed 163%, and silver advanced 181%.
Schiff used those numbers to raise doubts about Bitcoin’s long-term edge.
“If the appeal of Bitcoin is its superior long-term performance, why should anyone keep HODLing it?,” he asked.
His statement focused attention on Bitcoin’s recent record against both equities and precious metals.
Michael Saylor responded by arguing that the comparison depends on the starting point. He said, “Timeframes matter,” and added that Bitcoin has led major assets since August 2020. His reply shifted the discussion from a fixed five-year window to a broader performance view.
Saylor also said that a longer chart would favor Bitcoin even more. He wrote that Bitcoin is the top-performing major asset since August 2020 and said the gap “only widens” when the time span increases. His response reflected a common view among Bitcoin supporters who prefer longer-term comparisons.
Kiyosaki links pressure to older policy shifts
Robert Kiyosaki added another angle to the discussion by linking current financial stress to changes that began in 1974. In his post, he said “the future created in 1974 has arrived” and tied today’s debt and inflation concerns to that period. He also connected those changes to the petrodollar system and retirement planning.
Kiyosaki said baby boomers now face growing pressure as pensions gave way to market-based retirement accounts. His comments widened the discussion beyond Bitcoin price alone and placed it inside a broader debate about money, savings, and household finances.
In addition, market sentiment data also showed a cautious tone around Bitcoin. Santiment said bearish discussion on social platforms reached its highest level since late February. The platform reported that the bullish-to-bearish comment ratio dropped to 0.81.
That reading showed weaker trader confidence during the latest market discussion. Santiment also noted that extreme fear can sometimes work as a contrarian signal, as markets often move against the crowd when negative sentiment becomes too strong.

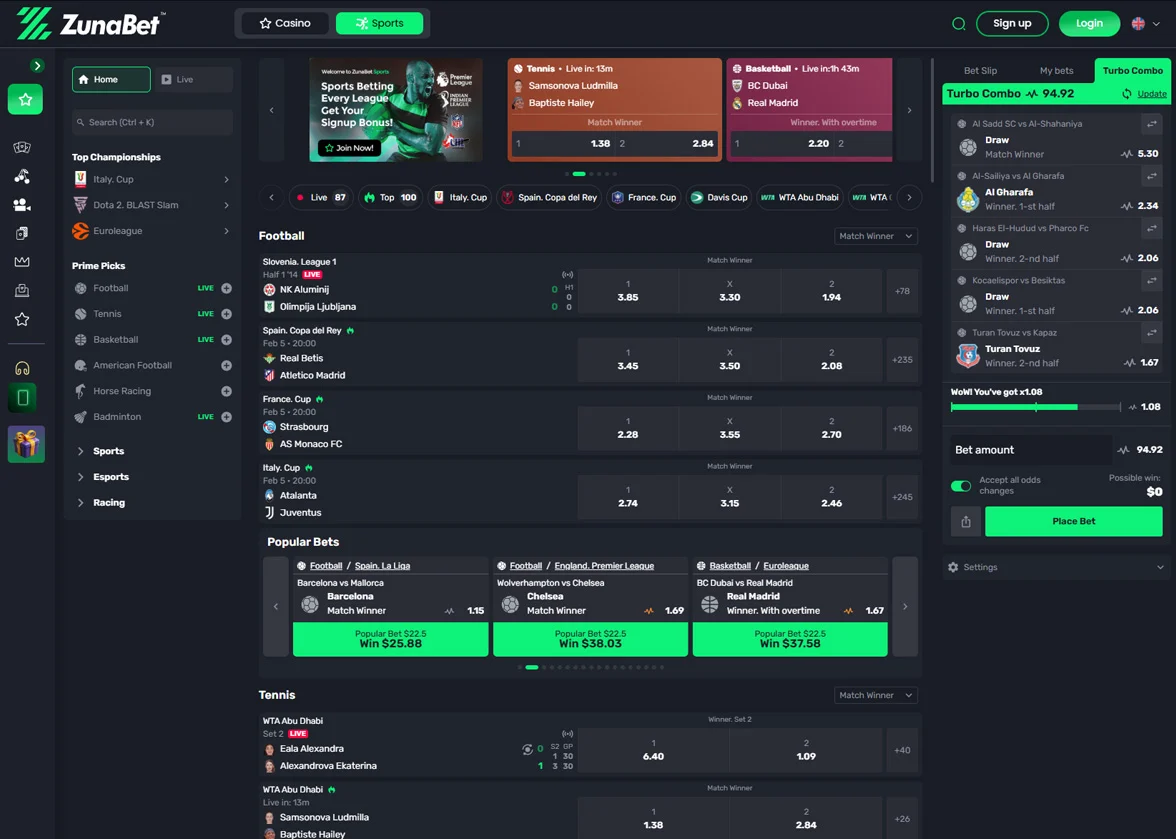
The online gambling industry has seen a noticeable trend in recent months. More players are searching for alternatives to Stake.com, one of the biggest names in crypto gambling. While Stake remains a major player, a growing number of users appear to be looking for something new. One platform that keeps showing up in those conversations is ZunaBet, a crypto-focused casino and sportsbook that launched in 2026.
So what is driving these searches, and does ZunaBet actually offer something different? This article breaks down both platforms and looks at why players are exploring new options.
The Rise of Stake.com
Stake.com has been one of the most recognized names in crypto gambling for several years. It built its reputation on a clean interface, fast crypto transactions, and a strong presence in the sports sponsorship space. The platform offers thousands of casino games, a full sportsbook, and its own original games that have attracted a loyal user base.
Stake also gained significant visibility through partnerships with high-profile figures and sports teams. That marketing push helped it become a household name in the crypto gambling world.
However, no platform stays on top without facing competition. As the crypto casino market has matured, players have started looking for platforms that offer better rewards, bigger game libraries, or a fresh experience. Search data suggests that terms like “Stake alternative” and “sites like Stake” have been climbing steadily. This is not unusual in a fast-moving industry where players are always looking for the next best option.
What Is ZunaBet?
ZunaBet is a crypto-first online casino and sportsbook that launched in 2026. It is owned by Strathvale Group Ltd and operates under an Anjouan gaming license (ALSI-202510047-FI2). The team behind it has over 20 years of combined experience in the online gambling industry.
The platform offers 11,294 games from 63 providers, making it one of the larger crypto-focused game libraries currently available. Providers include well-known names like Pragmatic Play, Hacksaw Gaming, Evolution, Yggdrasil, and BGaming. The game selection covers slots, RNG table games, and live dealer titles.

Beyond the casino, ZunaBet runs a full sportsbook covering major sports like football, basketball, tennis, and NHL, along with esports titles including CS2, Dota 2, League of Legends, and Valorant. Virtual sports and combat sports are also available, making it a genuine hybrid platform.
ZunaBet supports over 20 cryptocurrencies including BTC, ETH, USDT across multiple chains, SOL, DOGE, ADA, and XRP. The platform does not charge processing fees and emphasizes fast withdrawals, which is a selling point for crypto users who are used to waiting at traditional casinos.
The platform also offers dedicated apps for iOS, Android, Windows, and MacOS, along with 24/7 live chat support.
The Welcome Bonus Comparison
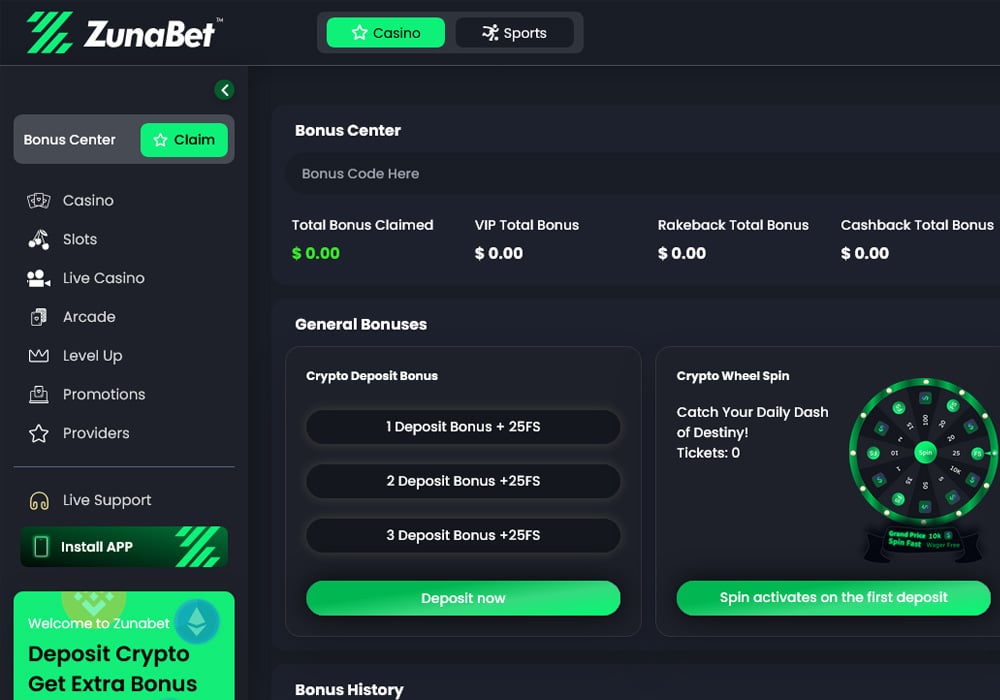
One area where ZunaBet stands out is its welcome offer. New players can access up to $5,000 in bonuses plus 75 free spins spread across their first three deposits. The breakdown is straightforward: 100% up to $2,000 plus 25 spins on the first deposit, 50% up to $1,500 plus 25 spins on the second, and 100% up to $1,500 plus 25 spins on the third.
This structure encourages players to stick around beyond their first session, which benefits both the platform and the player. Compared to many crypto casinos that offer a single deposit bonus, the multi-deposit approach gives players more value over time.
Stake.com, by contrast, has historically taken a different approach to bonuses, often relying on its VIP program and reload offers rather than large upfront welcome packages. For players who want immediate bonus value from day one, ZunaBet’s offer is hard to ignore.
Loyalty Programs: Dragons vs. Traditional VIP
This is where things get interesting. Most online casinos use a fairly standard VIP system with generic tier names and incremental perks. ZunaBet has gone a different route with what it calls a dragon evolution system.
The program has six tiers: Squire, Warden, Champion, Divine, Knight, and Ultimate. Each tier comes with increasing rakeback percentages, starting at 1% for Squire and going up to 20% for Ultimate. Other benefits include tier-based free spins (up to 1,000), VIP club access, and double wheel spins. The program is built around a mascot called Zuno, giving it a gamified feel that sets it apart from the typical loyalty experience.

For players who grind regularly, the difference between 1% and 20% rakeback is significant. It directly impacts how much value they get back from their play over time. This kind of structured, transparent reward system appeals to a generation of players who grew up with progression systems in video games and want that same sense of advancement in their gambling experience.
Stake.com has its own VIP program, which is well-regarded in the industry. But it operates on a more invite-based, less transparent model. Some players prefer knowing exactly where they stand and what they need to do to reach the next level, which is where ZunaBet’s approach has an edge.
Crypto-First vs. Traditional Platforms
The broader trend behind all of this is the ongoing shift from traditional fiat-based gambling platforms to crypto-first operators. Major brands like DraftKings, BetMGM, Caesars, and FanDuel still dominate in regulated markets, but they are built around traditional payment methods. Deposits and withdrawals often take days, come with fees, and require extensive verification processes.
Crypto casinos like ZunaBet and Stake flip that model. Transactions are faster, fees are lower or nonexistent, and players have more control over their funds. For a growing segment of players who already hold and use cryptocurrency, this is simply a better experience.
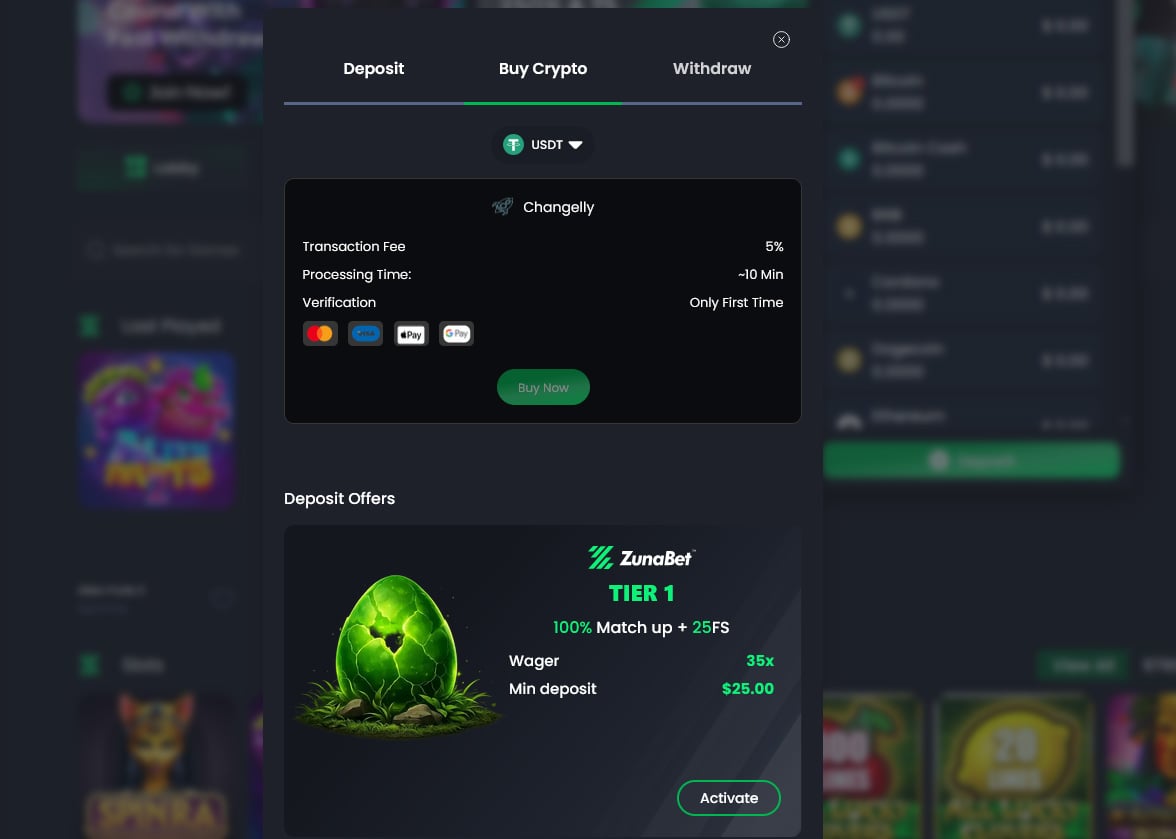
ZunaBet leans into this fully. With support for 20+ coins and no platform processing fees, it is built from the ground up for crypto users rather than being a traditional casino that added crypto as an afterthought.
Is ZunaBet the Future for a New Generation of Players?
There is a reasonable case to be made that platforms like ZunaBet represent where online gambling is heading. The combination of a massive game library, integrated sportsbook and esports betting, crypto-native payments, and a gamified loyalty system checks a lot of boxes for younger, digitally native players.
This is a generation that expects fast transactions, transparent rewards, mobile-first design, and variety. They are not interested in waiting three to five business days for a withdrawal or navigating clunky interfaces built a decade ago.
ZunaBet is still new, and it will need to prove itself over time in areas like customer service consistency, game fairness, and long-term reliability. But the early signs suggest it is a platform worth watching. The fact that it is already appearing in conversations about Stake alternatives says something about the demand for fresh options in the crypto gambling space.
The Bottom Line
The rise in searches for Stake.com alternatives reflects a healthy, competitive market where players are not locked into one platform. Stake remains a strong option with a proven track record, but ZunaBet is making a compelling case as the more exciting new entry in the space.
With 11,000+ games, 20+ supported cryptocurrencies, a $5,000 welcome bonus, a unique dragon-themed loyalty program, and a full sportsbook, ZunaBet offers a package that is hard to overlook. For players looking for something fresh in the crypto casino world, it is quickly becoming the platform to watch in 2026.
Disclaimer: This is a Press Release provided by a third party who is responsible for the content. Please conduct your own research before taking any action based on the content.
Robert Kiyosaki, the author of Rich Dad Poor Dad, argues that the long-running economic shifts set in motion more than five decades ago are now unfolding in full force. He has repeatedly urged readers to consider Bitcoin and gold as hedges against rising debt, inflation and retirement risk, framing them as “real money.”
In a recent post on X, Kiyosaki pointed to 1974 as a turning point that reshaped money and retirement in the United States, linking the move toward a petrodollar framework with policy changes affecting pensions. “The future created in 1974 has arrived,” he wrote, tying the dollar’s evolution after the end of the gold standard to today’s inflationary pressures and energy tensions. He also highlighted the Employee Retirement Income Security Act, known as ERISA, which introduced new rules for pension plans and reflected a broader shift toward market-based retirement savings.
According to Kiyosaki, that transition replaced guaranteed lifetime income for many workers with vehicles such as 401(k)s, placing more risk on individuals. “Millions of baby-boomers will soon find out they have no income once they stop working,” he warned.
Kiyosaki’s stance: Bitcoin and gold as anchors in a shifting era
Kiyosaki reiterated his call for financial education and diversification into non-traditional stores of value. He continues to advocate assets like gold, silver and Bitcoin, which he describes as “real money.”
Last month, he warned that a major financial bubble could be approaching and suggested that a crisis might trigger a sharp rally in scarce assets like Bitcoin. He has previously floated a scenario in which Bitcoin could reach about $750,000 within a year of such a crash.
Bearish sentiment climbs, but contrarian signals linger
In the broader market, Bitcoin sentiment on social media has tilted toward caution. Data from crypto analytics firm Santiment shows the bullish-to-bearish comment ratio has dropped to 0.81—the lowest level in weeks and the strongest bearish tilt since late February. While such mood can reflect near-term pressure, Santiment notes it can also serve as a contrarian indicator, with markets often moving opposite to crowded sentiment.
Cointelegraph has previously highlighted how macro risk and liquidity cycles influence Bitcoin’s price, and recent coverage underscored the dynamics of investor behavior during periods of inflation and tightening financial conditions. For example, Cointelegraph reported that rich Bitcoin traders faced significant daily losses in Q1 2026, underscoring the tension between risk appetite and market fragility. Rich Bitcoin traders lost $337M daily in Q1 2026.
Macro backdrop and what investors should watch next
The thread tying Kiyosaki’s argument is a macro narrative: a decades-long drift from the gold standard toward a petrodollar paradigm, alongside reforms that shifted retirement risk to individuals. Investors are watching how debt levels, inflation, energy geopolitics and retirement policy interact with demand for scarce assets like Bitcoin and gold. The market context remains nuanced, with both optimistic and cautionary viewpoints coexisting as policy signals and macro data evolve.
What matters going forward is not only the timing of any potential price moves but how the broader environment—rising debt, policy shifts, and energy dynamics—shapes demand for hedges and stores of value. The conversation around Bitcoin as a hedge and as a potential growth asset continues to be framed by longer-term macro developments as much as by short-term price action.
Looking ahead, readers should monitor inflation readings, policy guidance, and any shifts in retirement reform or energy supply that could influence demand for Bitcoin and gold as alternative anchors in a changing financial system.

XRP fell to fifth in crypto market cap rankings as BNB moved ahead, with weekly ETF outflows and a seven-month slide weighing on price now.


Bitcoin is showing mixed signals as on-chain data points in two different directions.
Summary
- CryptoQuant said record Bitcoin inflows to accumulation addresses showed whales were quietly building positions daily.
- XWIN Research Japan said STH-SOPR near one showed short-term holders were selling at losses.
- Negative Coinbase Premium showed weak US demand, keeping Bitcoin bottom confirmation out of reach now.
CryptoQuant analyst CW8900 said Bitcoin inflows to accumulation addresses are setting new records each day. The analyst said a large amount of BTC is moving into these wallets even as the market trades in a sideways range.
According to CW8900, whale activity appears to be keeping price action stable while accumulation continues. The analyst said large holders are maintaining prices and adding Bitcoin instead of selling into the market and creating panic among smaller investors.
CW8900 also said retail participation has thinned out. The analyst wrote that most retail investors have already left the market, leaving only a small group of participants while whales continue to build positions.
That reading supports the view that large players are buying quietly during a period of weak volatility. CW8900 said the trend increases the chance of an upward move if buying pressure continues without major disruption to price.
XWIN Research Japan presented a different view and said the market bottom is “not confirmed.” The firm pointed to the Short-Term Holder SOPR, or STH-SOPR, which tracks whether short-term holders are selling Bitcoin at a profit or a loss.
The report said the indicator is hovering around or below 1. That level usually shows that short-term holders are selling at a loss, a pattern often seen when weaker hands exit during a correction.
XWIN Research Japan said this can appear in the early stage of bottom formation. Still, the firm said that selling pressure alone does not confirm a reversal unless buyers step in with clear demand.
That is why the firm also focused on the Coinbase Premium Gap. The metric tracks the price difference between Coinbase and other exchanges and is often used as a signal for US spot demand.
Weak Coinbase premium keeps bottom debate open
XWIN Research Japan said the Coinbase Premium remains in negative territory. The firm said that reading shows US investors are not buying Bitcoin aggressively at current levels.
The report added that earlier bull phases often featured a steady positive premium, which helped support stronger upside momentum. That condition has not returned in the current market, according to the firm.
Taken together, the two views show a divided setup for Bitcoin. Whale wallets appear to be absorbing supply, but weak US demand is keeping the “bottom not confirmed” argument in place for now.
Disclosure: This article does not represent investment advice. The content and materials featured on this page are for educational purposes only.
TLDR:
- Bitcoin’s Easter prices show a steady rise from $5 in 2012 to $84.5K in 2025 before easing in 2026.
- Historical data reveals repeated cycles of growth followed by corrections across different market phases.
- The 2026 Easter price near $67K reflects a cooldown after the late 2025 peak above $120K.
- Current price action remains range-bound, signaling consolidation as the market searches for direction.
Bitcoin traded near $67,000 during Easter 2026, marking a pause after a sharp correction from late 2025 highs. Historical Easter data shows how the asset has evolved through cycles, reflecting both rapid growth phases and periods of consolidation.
Bitcoin’s Easter Prices Trace Its Evolution Across Market Cycles
Data shared by Watcher.Guru outlines Bitcoin’s Easter price history from 2012 to 2026. The asset traded at $5 in 2012 and climbed steadily over the years. By 2017, it had reached $1,195, reflecting early adoption and rising demand.
The trend continued into later cycles, with Easter 2021 recording $58,000 during a strong rally. However, prices have not moved in a straight line.
For instance, Easter 2018 saw $6,850, followed by a drop to $5,325 in 2019. This pattern shows alternating growth and correction phases.
Moving forward, Bitcoin reached $70,000 in Easter 2024 and $84,500 in 2025. These levels followed a strong upward phase that pushed the asset above $120,000 later in 2025. Yet, Easter 2026 shows a pullback to $67,000, reflecting a cooling period after the peak.
This historical data presents a clear pattern of expansion followed by retracement. Each cycle builds on the previous one, although corrections remain part of the trend. As a result, Easter prices provide a snapshot of Bitcoin’s position within broader market cycles.
2026 Easter Reflects Consolidation After Sharp Decline
Price action places Bitcoin near $66,795 as of writing, holding within a narrow range. The market has formed lower highs and lower lows since the late 2025 peak. This structure confirms a bearish trend despite the recent stabilization.
At the same time, the price is moving sideways between $65,000 and $75,000. This range indicates a balance between buyers and sellers after the earlier sell-off. Such periods often appear after strong declines, as the market searches for direction.
Technical indicators support this view of stabilization. The Relative Strength Index remains below 50, showing limited bullish strength. However, it has recovered from oversold levels, suggesting that selling pressure has slowed.
Similarly, the MACD shows weak momentum, with a slight negative reading and limited follow-through. Although a crossover attempt occurred, it has not developed into a clear trend. This aligns with the ongoing consolidation phase.
Key levels remain unchanged during this period. Support holds near $65,000, while $60,000 stands as a deeper floor. On the upside, resistance near $75,000 continues to limit upward movement, with $90,000 acting as a higher barrier.
Looking at the broader cycle, Bitcoin has moved through accumulation, markup, distribution, and markdown phases. The current period appears to be a pause following the markdown phase of early 2026. Price behavior within this range will determine the next stage.
Bitcoin’s Easter history continues to reflect its cyclical nature. While long-term growth remains visible, short-term movements show that corrections remain part of the market structure.
TLDR:
- Ethereum is nearing a multi-year support zone, where demand has historically driven strong price reversals.
- Monthly chart structure shows ETH moving within a defined range between $1,500 and $5,000 levels.
- Tightening volatility suggests a breakout may occur soon as price compresses near key support.
- Traders monitor for bullish confirmation signals before positioning within the current range setup.
Ethereum is approaching a critical support range on higher timeframes, as recent market structure points to a prolonged consolidation phase.
Analysts are closely watching price behavior near key levels, where risk-to-reward setups tend to favor strategic positioning within established boundaries.
Ethereum Tests Range Extremes on Higher Timeframes
Recent analysis shared by market participant Lennaert Snyder points to Ethereum revisiting a key monthly support zone.
His observations focus on a “sell-to-buy” candle that initiated the move toward the all-time high. That area now acts as a technical reference for long-term traders.
According to the tweet, price is testing the lower boundary of a multi-year range. This zone aligns with previous demand and remains a focal point for potential accumulation.
The presence of a long wick in that candle suggests liquidity remains in that region. Markets often revisit such wicks before establishing a directional move.
The broader monthly structure presents a clear cycle. Ethereum surged during 2020 and 2021, followed by a sharp decline in 2022.
Since then, price has moved sideways, forming a wide horizontal range. This structure indicates a market without a strong directional trend.
The range is defined by resistance near $4,800 to $5,000 and support between $1,500 and $1,700. These levels have repeatedly acted as turning points. Buyers tend to step in near the lower boundary, while sellers dominate near the upper limit.
Snyder’s commentary suggests that testing this lower range extreme could offer favorable setups. Traders often seek entries in such zones due to tighter risk control. However, confirmation through price action remains essential before any directional bias is established.
Consolidation Phase Signals Potential Expansion
On lower timeframes, Ethereum reflects a similar pattern of compression. After a sharp decline earlier this year, price stabilized and moved within a narrower range. This aligns with the broader monthly structure, reinforcing the idea of consolidation.
Technical indicators show reduced volatility, as Bollinger Bands have tightened. This typically precedes larger price movements, although direction remains uncertain. At the same time, momentum indicators indicate weakening bullish pressure in the short term.
Price currently trades near the middle to lower portion of its recent range. Resistance remains firm around $2,200 to $2,300, while support sits near $1,900. These levels act as immediate barriers within the broader structure.
The projected path shared in the analysis suggests a possible dip into deeper support. This move could sweep liquidity before a potential reversal. Such behavior is common in range-bound markets, where stop levels attract price action.
Two scenarios remain in focus. If Ethereum holds the lower support zone, a gradual move toward mid-range levels near $3,000 could follow. Continued strength may then push price toward the upper boundary of the range.
On the other hand, a breakdown below $1,500 on a monthly close would shift the structure. This would indicate a loss of support and open the door for further downside. Market participants continue to monitor these levels closely as price approaches a decision point.
As Ethereum trades near range extremes, attention remains on confirmation signals. The coming months are expected to provide clearer direction within this established structure.
10 Fantasy Movie Masterpieces That Are Definitely Not for Kids

What to know about the rescue of a US aviator in Iran

Los Angeles International Airport (LAX) TSA Wait Time Less Than 5 Mins Despite Easter


-

 NewsBeat3 days ago
Steven Gerrard disagrees with Gary Neville over ‘shock’ Chelsea and Arsenal claim | Football
-

 Business3 days ago
No Jackpot Winner and $194 Million Prize Rolls Over
-

 Fashion2 days ago
Weekend Open Thread: Spanx – Corporette.com
-
Entertainment6 days ago
Fans slam 'heartbreaking' Barbie Dream Fest convention debacle with 'cardboard cutout' experience
-

 Crypto World4 days ago
Gold Price Prediction: Worst Month in 17 Years fo Save Haven Rock
-

 Tech7 days ago
The Pixel 10a doesn’t have a camera bump, and it’s great
-
Crypto World5 days ago
Dems press CFTC, ethics board on prediction-market insider trades
-

 Tech7 days ago
Avatar Legends: The Fighting Game comes out in July and it looks pretty slick
-

 Sports19 hours ago
India men’s 4x400m and mixed 4x100m relay teams register big progress | Other Sports News
-

 Business4 days ago
Login and Checkout Issues Spark Merchant Frustration
-

 Tech6 days ago
Apple will hide your email address from apps and websites, but not cops
-

 Sports5 days ago
Tallest college basketball player ever, standing at 7-foot-9, entering transfer portal
-

 Tech5 days ago
EE TV is using AI to help you find something to watch
-

 Politics6 days ago
Should Trump Be Scared Strait?
-

 Tech6 days ago
Flipsnack and the shift toward motion-first business content with living visuals
-

 Fashion6 days ago
The Best Spring Trends of 2026
-

 Sports6 days ago
Women’s hockey camp eyes fitness boost, tactics ahead of WC 2026 campaign | Other Sports News
-

 Tech5 days ago
How to back up your iPhone & iPad to your Mac before something goes wrong
-
Crypto World7 days ago
Bitcoin’s Six-Month Losing Streak: What On-Chain Data Says About the Market’s Next Move
-

 Politics6 days ago
BBC slammed for ignoring author of The Fraud
You must be logged in to post a comment Login