

Crypto World
Scalping Indicators in Forex and CFD Trading
Scalping is a trading style based on frequent transactions within short timeframes, often lasting only a few seconds or minutes. The objective is to capture small Scalping indicators are technical tools that signal entries and exits in forex and CFD markets. They are typically applied on 1-minute to 5-minute charts during very short-term trades. These forex scalping indicators process price, momentum, and volatility data into structured readings. They suit conditions defined by tight spreads, fast execution, and small price fluctuations.
Scalpers execute many trades over minutes or seconds, aiming to capture minor price moves in active markets. Technical indicators offer the structured signals needed to support these fast decisions. This article covers the main indicators for scalping and their application to intraday trading.
Common scalping indicators include:
- Exponential Moving Average (EMA): smooths recent prices to indicate trend direction.
- Hull Moving Average (HMA): a faster moving average designed to reduce lag.
- Relative Strength Index (RSI): a momentum oscillator measuring overbought and oversold conditions.
- Bollinger Bands: volatility bands set around a moving average.
- Stochastic Oscillator: measures the closing price relative to a recent trading range to identify momentum.
- MACD: compares two moving averages to identify momentum and trend direction.
Role of Indicators in Short-Term Execution
As you may know, scalping is a trading strategy where traders aim to take advantage of small price movements by executing numerous trades within short timeframes, often closing trades within a few minutes. This approach requires swift decision-making and precise timing.
Technical indicators may be important tools in this context, as they provide real-time data and insights into market trends, momentum, and volatility. Using these indicators, traders can identify optimal entry and exit points, potentially enhancing their ability to navigate the rapid pace of the market.
Below, we’ll break down five indicators for scalping. You’ll find these scalping indicators in MT4 and MT5, and TradingView. Also, you can get started in seconds with FXOpen’s TickTrader trading platform.
Indicators in scalping are typically used for:
- Trend identification: spotting whether price is moving directionally.
- Entry timing: pinpointing moments to act on a setup.
- Volatility assessment: gauging how widely the price is swinging in real time.
Moving Averages

Moving averages (MAs) are considered by some to be the most popular indicator for scalping, smoothing out price data to help identify trends by calculating the average price over a specific period. In scalping, where quick decisions are crucial, certain types of moving averages can be useful.
Exponential Moving Average (EMA)
Unlike the Simple Moving Average (SMA), which assigns equal weight to all data points, the EMA gives more significance to recent prices, making it more responsive to current market movements. This responsiveness is advantageous for scalpers.
Common EMA settings for scalping include 5, 9, and 20 periods, depending on chart timeframe. For instance, a 9-period EMA reacts swiftly to recent price changes, potentially providing timely signals for entry and exit points. The EMA for scalping may also act as dynamic support or resistance during trending price action.
Hull Moving Average (HMA)
Developed by Alan Hull, the HMA further reduces lag. It does this by weighting recent prices more heavily and applying a different calculation. The result is a moving average that tracks price action more closely while smoothing noise.
Applying Moving Averages in Scalping
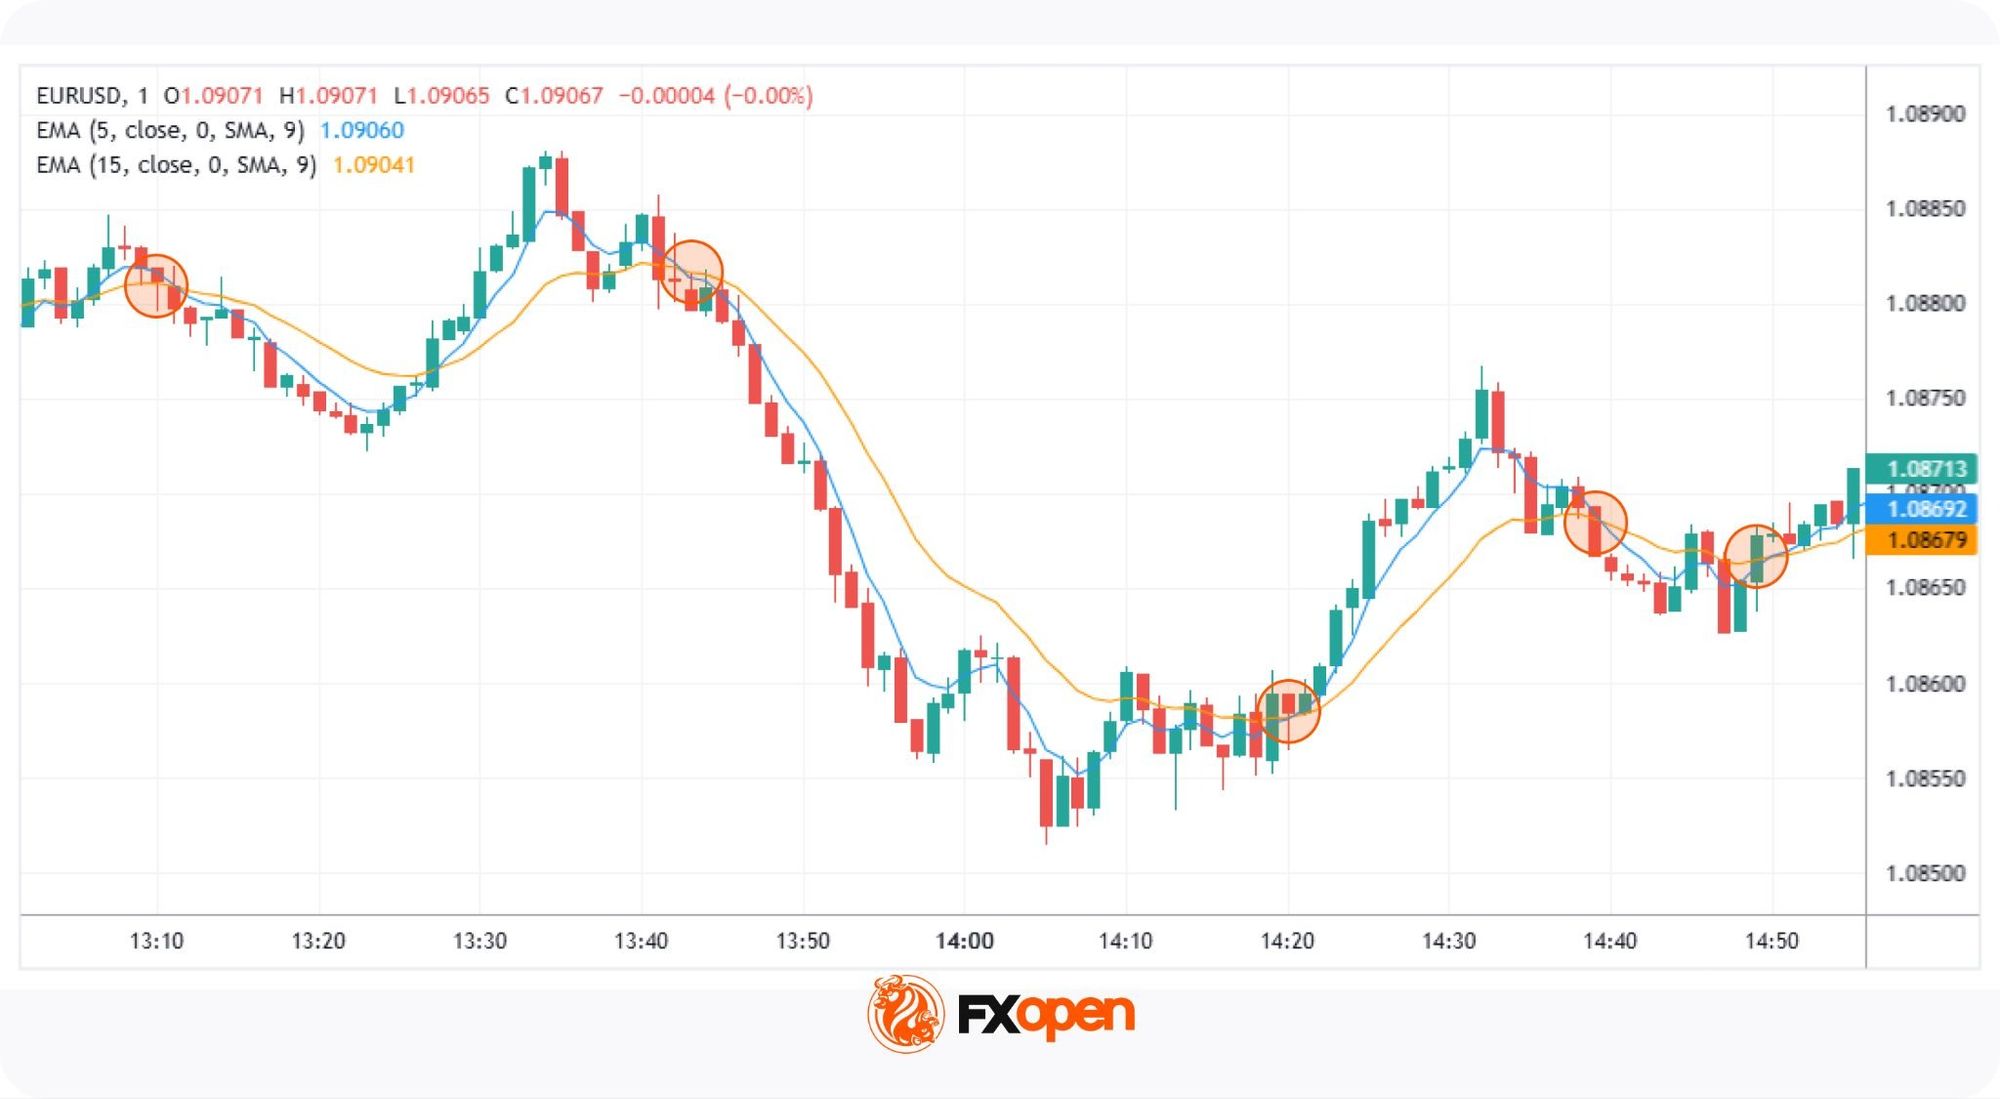
- Crossover Strategy: Scalpers often use two EMAs of different lengths. A common approach involves a fast EMA (e.g., 5-period) and a slow EMA (e.g., 15-period). When the fast EMA crosses above the slow EMA, it may indicate a bullish trend, suggesting an entry point for a buy trade or an exit point for a short trade. Conversely, when the fast EMA crosses below the slow EMA, it may signal a bearish trend, indicating a potential entry for a sell trade or moment to close a long trade.
- Trend Confirmation: The EMA and HMA can be used to confirm trends identified by other indicators. For example, if the moving average is sloping upwards, it may confirm an uptrend, supporting decisions to enter long positions. If it’s sloping downwards, it may confirm a downtrend, supporting decisions to enter short positions.
- Pullbacks: In trending markets, traders often monitor pullbacks to the EMA as potential continuation entries.
You can find these scalping indicators in TradingView and FXOpen’s TickTrader trading platform.
Relative Strength Index (RSI) in Scalping
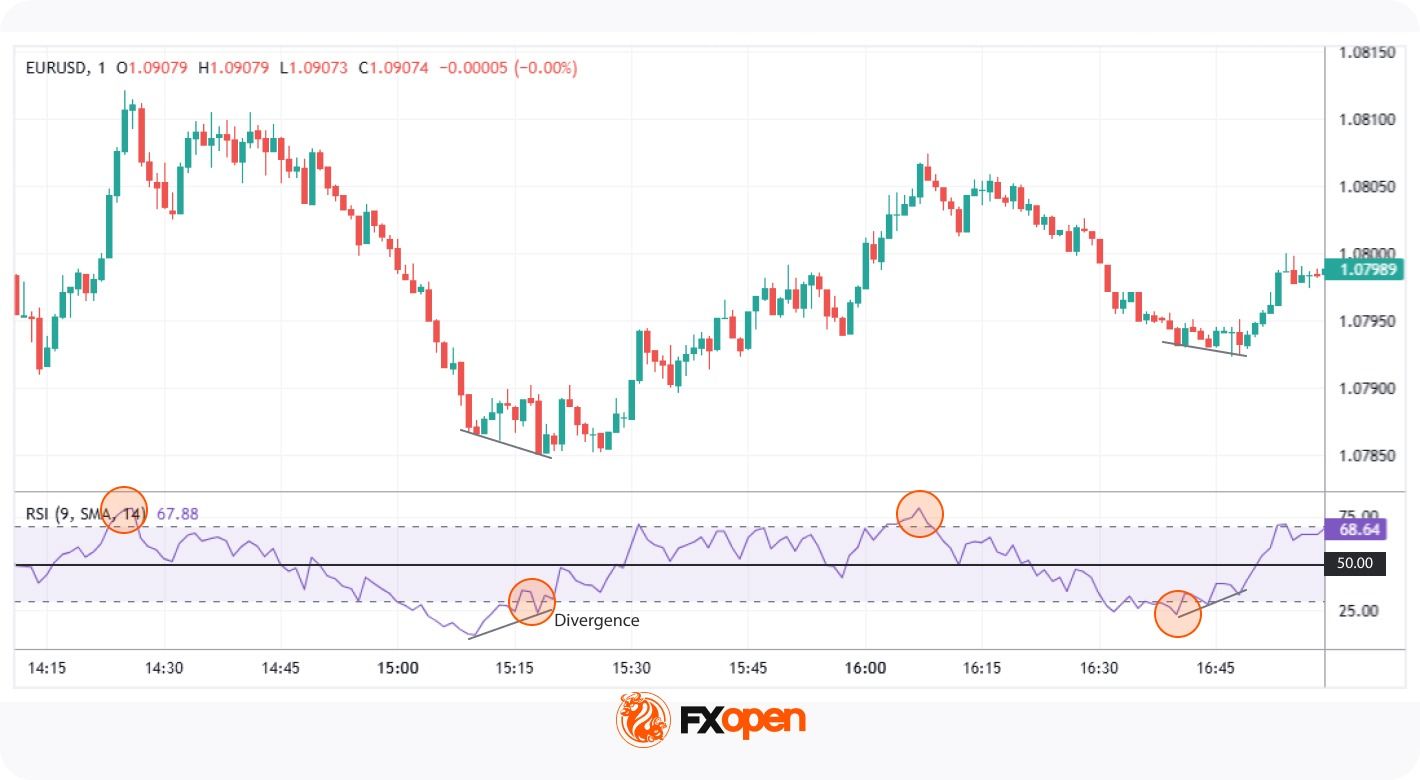
The Relative Strength Index (RSI) is a well-known scalping indicator that measures the speed and change of price movements, oscillating between 0 and 100. Traditionally, an RSI above 70 indicates overbought conditions, while below 30 suggests oversold conditions.
In scalping, traders often adjust the RSI from its typical length of 14 to shorter periods, such as 7 or 9, to capture rapid price swings occurring over minutes. This adjustment makes the RSI more sensitive to recent price changes, providing timely signals for quick trades. Shorter RSI scalping settings between 2 and 6 periods are also commonly used on very fast timeframes.
Applying RSI in Scalping
- Overbought/Oversold Levels: When the RSI moves beyond 70 or drops below 30, traders watch for potential reversal points. However, scalpers may focus on the RSI’s movement back into the 30-70 range as an early sign of momentum shifting.
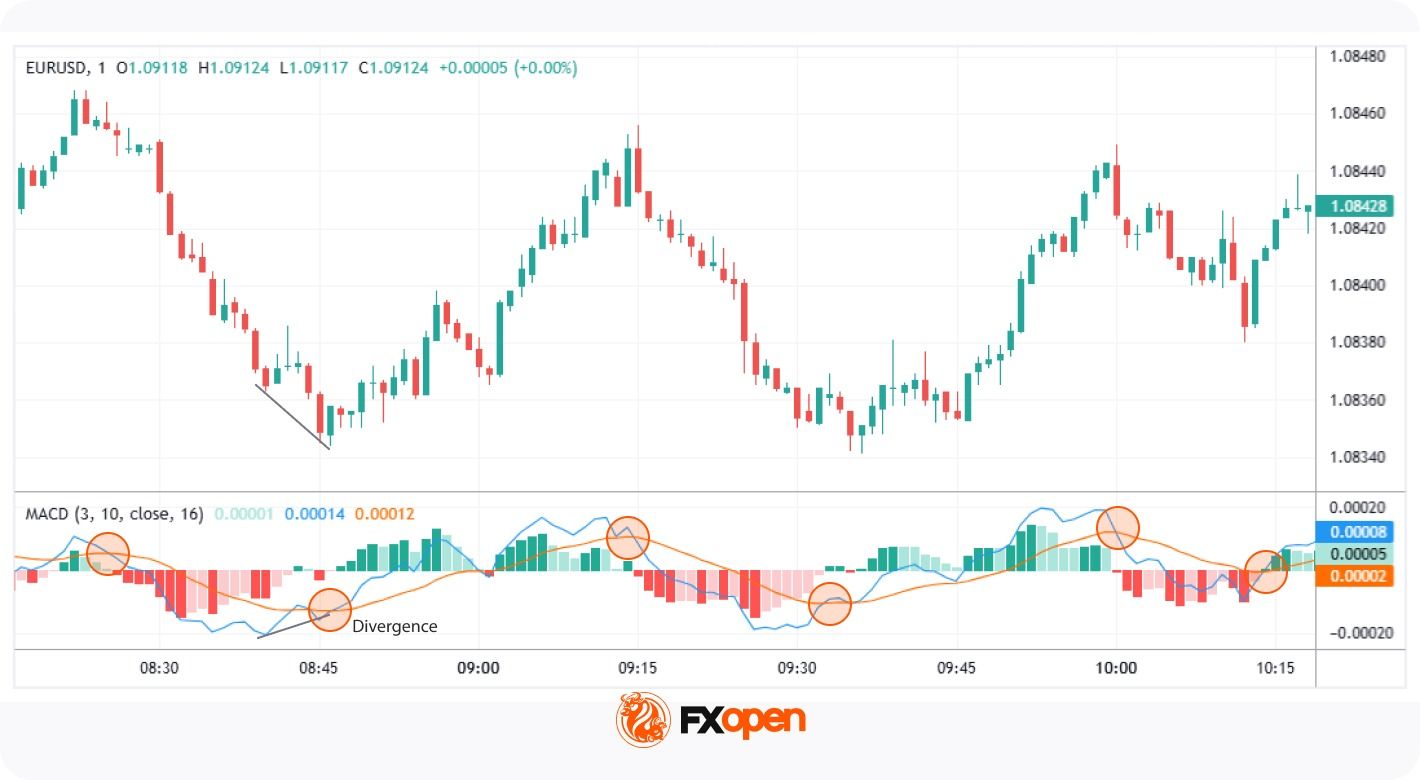
- Divergences: Scalpers also look for divergence between price movement and the RSI. For example, if the price reaches a new high but the RSI does not, it may signal a weakening trend and possible reversal. This divergence may support traders in anticipating quick market shifts.
- Midpoint (50 Level): The 50 level serves as a midpoint, indicating the balance between gains and losses. An RSI crossing above 50 may suggest bullish momentum, while dropping below 50 can indicate bearish momentum. Scalpers use this midpoint to assess the prevailing market trend.
Bollinger Bands
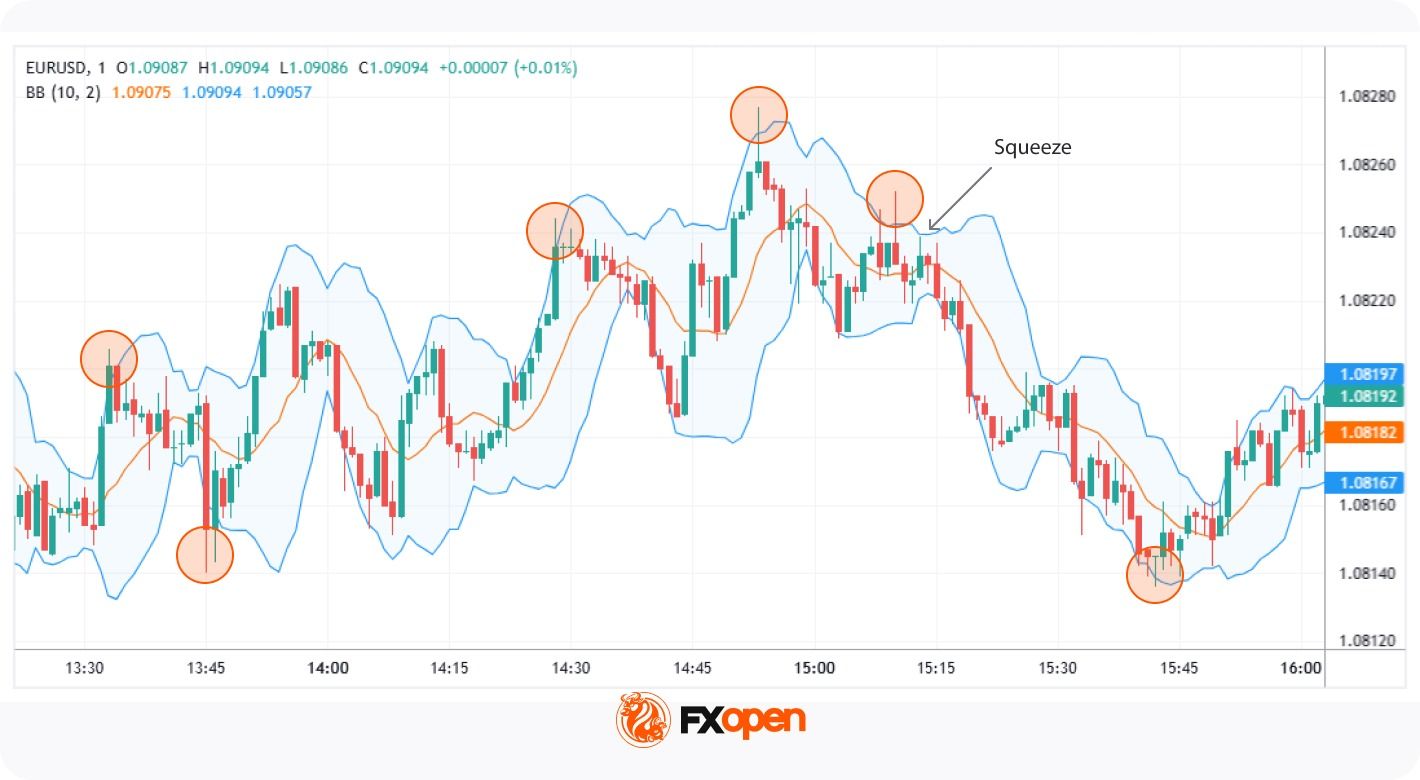
Bollinger Bands are a technical analysis tool comprising three lines: a simple moving average (SMA) in the middle, with upper and lower bands set at a specified number of standard deviations from the SMA. These bands expand and contract based on market volatility, providing a visual representation of price fluctuations. Squeeze conditions, where the bands narrow sharply, often precede expansion and stronger directional moves.
In scalping, traders often adjust Bollinger Bands scalping parameters to shorter timeframes, such as 1-minute or 5-minute charts, to capture quick price movements. A common approach involves setting the SMA period to 7-10 and the standard deviation to 1.5-2, potentially enhancing sensitivity to short-term market changes.
Applying Bollinger Bands in Scalping:
- Bollinger Squeeze: When the bands contract, indicating low volatility, it often precedes significant price movements. Scalpers watch for a breakout above or below the SMA. When the price breaks above the SMA, it may signal that the price will rise, and vice versa.
- Reversal: Price breaching the upper band may suggest overbought conditions, while below the lower band may indicate oversold conditions. Scalpers use these signals to anticipate potential price reversals.
Stochastic Oscillator
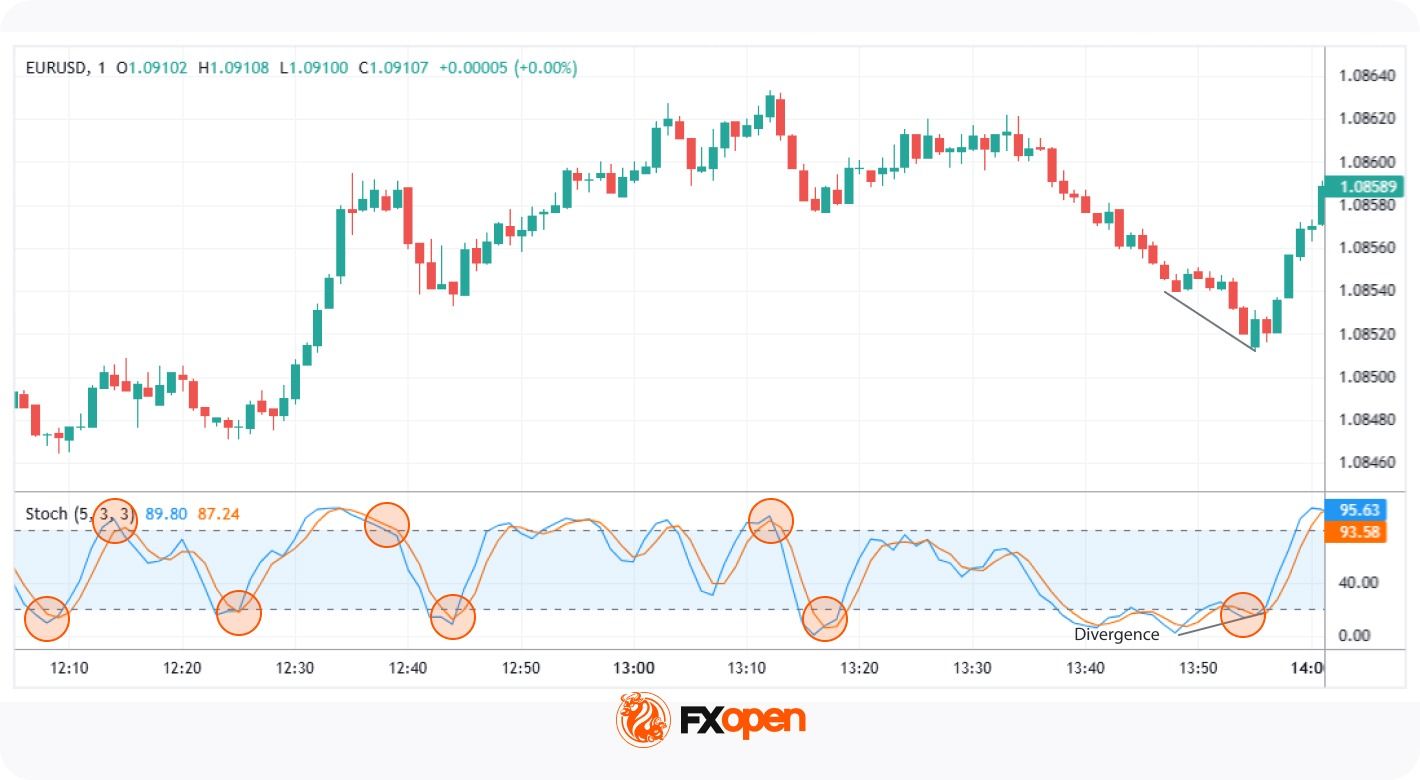
The Stochastic Oscillator is a momentum indicator that compares an asset’s closing price to its price range over a specific period, typically 14. It includes the %K line, the current closing price relative to the range, and the %D line, a moving average of %K. The scale runs from 0 to 100, where readings over 80 suggest overbought levels, and those under 20 point to oversold levels. The Stochastic Oscillator is more popular in range-bound markets than in strong trends.
In scalping, traders may adjust the Stochastic Oscillator to shorter settings, such as 5,3,3, to increase sensitivity to rapid price movements. This adjustment may help in capturing short-term market fluctuations.
Applying the Stochastic Oscillator in Scalping:
- Overbought and Oversold Conditions: When the %K line crosses the %D line in the overbought (above 80) or oversold (below 20) zones, it can signal a potential reversal. Scalpers use these crossovers as quick alerts for shifts in momentum, helping them to act swiftly in volatile markets.
- Crossovers: Besides extreme conditions, traders also monitor crossovers between %K and %D. A %K line crossing above %D from a lower level can suggest an upward move, while a downward crossover may hint at a short-term price decline.
- Divergence: If the price makes a new high/low but the Stochastic Oscillator does not, it may signal a weakening trend, indicating a potential reversal.
Moving Average Convergence Divergence (MACD)
The Moving Average Convergence Divergence (MACD) is a widely used scalping indicator. It’s a momentum indicator that reflects the relationship between two moving averages. It comprises the MACD line (the difference between the 12-period and 26-period exponential moving averages), the signal line (a 9-period EMA of the MACD line), and a histogram, which illustrates the gap between the two lines.
Scalpers prefer to adjust these settings to 3, 10, and 16, respectively, to make the MACD more responsive to rapid price movements.
Applying MACD in Scalping:
- Crossovers: When the MACD line crosses above the signal line, it may indicate bullish momentum; a crossover below suggests bearish momentum. Scalpers monitor these crossovers to identify potential entry and exit points.
- Histogram Analysis: The histogram represents the difference between the MACD and signal lines. Histogram contraction in the MACD scalping indicator may reflect weakening momentum, while expansion tends to indicate momentum building in the prevailing direction. Scalpers use these changes to gauge the intensity of price movements.
- Divergences: A divergence occurs when the price moves in one direction while the MACD line moves in the opposite. For example, if the price reaches a new low but the MACD does not, it may reflect a potential upward reversal. Scalpers watch for such divergences to anticipate shifts in market direction.
Indicator Confluence in Scalping
Confluence refers to combining signals from multiple indicators to potentially filter noise and improve signal reliability. Each indicator offers unique insights, and their combined use may help filter out false signals. Here are some pairings:
- EMA + RSI → trend direction plus momentum confirmation: Utilising the Exponential Moving Average to identify trend direction alongside the Relative Strength Index to gauge momentum may help traders confirm the strength of a trend before making decisions. For instance, if the EMA indicates an uptrend and the RSI is above 50, it may suggest strong bullish momentum.
- Bollinger Bands + Stochastic → volatility plus reversal signals: Bollinger Bands measure volatility, while the Stochastic Oscillator identifies overbought or oversold conditions. When prices touch the upper or lower bands and the Stochastic Oscillator reflects overbought or oversold conditions, it may indicate potential reversal points.
- MACD + RSI → momentum confirmation across two indicators: The Moving Average Convergence Divergence (MACD) highlights momentum changes, and the RSI indicates overbought and oversold conditions. Using them together can support traders in confirming potential entry or exit points. For example, if the MACD shows bullish momentum and the RSI is rising but not yet overbought, it may signal the price will rise.
Indicator Settings Commonly Used in Scalping
The table below summarises typical scalping configurations for each indicator covered above. These are the settings traders most often apply on these indicators for 1-minute trading and 5-minute trading.
Market Conditions and Indicator Behaviour
Indicator readings shift in reliability depending on the underlying market environment. No single tool performs identically across trend, range, and low-volatility conditions.
In trending markets, the EMA and momentum indicators such as MACD tend to dominate. Trend-following signals carry more weight when price moves directionally with sustained pressure.
In range-bound markets, oscillators become more relevant. The Stochastic Oscillator and RSI often produce cleaner reversal signals when price oscillates between defined support and resistance levels. Moving average crossovers may generate frequent false signals in these conditions.
Under low-volatility conditions, signals across all indicator types weaken. Bollinger Bands contract, momentum readings flatten, and crossovers lose meaning. Traders often wait for volatility expansion before acting on indicator-based setups.
Limitations of Indicators in Scalping
Scalping with indicators offers valuable insights, but there are some challenges traders should be aware of:
- False Signals: Rapid market movements can trigger misleading signals, causing traders to act prematurely.
- Overtrading: Relying too heavily on short-term indicators can lead to excessive trades, increasing transaction costs.
- Market Noise: High volatility and frequent price fluctuations can make it difficult to distinguish genuine trends from random market “noise.”
- Lagging Indicators: Some indicators may react too slowly, causing traders to miss potential trades.
- Tuning: Tuning indicators may be necessary to optimise performance. Academic research has tested indicators such as MACD and RSI across multiple developed markets, with results varying by index, period, and parameter settings.
Key Takeaways on Scalping Indicators
Scalping relies on precise and timely decisions, which is why technical indicators play an important role in this trading style. Tools such as moving averages and oscillators provide structured signals that may support traders in navigating fast market movements. The choice of indicators varies depending on individual trading preferences, market conditions, and timeframes.
If you want to test the above-mentioned indicators or find something new for yourself, you can open an FXOpen account to access over 700 markets and trade with tight spreads from 0.0 pips.
FAQ
What Indicators Are Used for Scalping?
Common scalping indicators include the Exponential Moving Average (EMA), Relative Strength Index (RSI), Bollinger Bands, Stochastic Oscillator, and Moving Average Convergence Divergence (MACD). The Hull Moving Average is also used by some traders. Each tool serves a different function across trend identification, momentum measurement, and volatility assessment on short-term charts.
What EMA Settings Are Used in Scalping?
Common EMA settings for scalping include 5, 9, and 20 periods on 1-minute and 5-minute charts. Traders often pair a fast EMA, such as 5 or 9, with a slower EMA, such as 15 or 20, to monitor crossovers. Shorter periods react faster but may produce more false signals.
Can RSI Be Used for Short-Term Trading?
Yes, the RSI is popular among short-term trading indicators. Scalpers typically reduce the RSI period from the standard 14 to between 2 and 7 to capture rapid price swings. Traders watch for crosses above 70 or below 30, divergences with price, and movement around the 50 midpoint.
How Do Bollinger Bands Work in Scalping?
In scalping, traders often use a 7 to 10 period SMA with 1.5 to 2 standard deviations. Squeeze conditions may precede breakouts, while band touches may indicate reversal zones.
Do Indicators Behave Differently in Trending and Ranging Markets?
Yes, indicator reliability shifts with market conditions. In trends, momentum indicators such as MACD and EMAs tend to perform more consistently. In ranges, oscillators such as RSI and Stochastic produce cleaner reversal signals. Under low volatility, signals across all indicator types tend to weaken.
What Is the 1-Minute Scalp Strategy?
The 1-minute scalp strategy involves making rapid trades on a 1-minute chart. Traders look for small price movements and enter multiple trades within a short period, often using scalp trading indicators like the EMA or RSI for quick signals.
What Is the 5-Minute Scalping Strategy?
The 5-minute scalping strategy focuses on capturing short-term price movements on a 5-minute chart. Traders typically combine trend and momentum indicators, like the MACD and Bollinger Bands, to make fast, informed decisions.
Are There Good Stocks for Scalping?
The choice depends on the trader’s risk tolerance, trading approach, experience, and toolkit. However, according to theory, stocks with high liquidity, tight spreads, and significant daily volume are good for scalping. Popular choices include tech giants like Apple (AAPL) and Tesla (TSLA), as they offer frequent price fluctuations. But at the same time, they bear higher risks.
This article represents the opinion of the Companies operating under the FXOpen brand only. It is not to be construed as an offer, solicitation, or recommendation with respect to products and services provided by the Companies operating under the FXOpen brand, nor is it to be considered financial advice.

Crypto World
Hyperliquid (HYPE) Surges 7% as Kalshi Futures Launch and SpaceX IPO Speculation Heat Up
Key Highlights
- HYPE token advanced more than 7% over 24 hours, reaching the $60–$61 range while Bitcoin remained relatively stable
- Kalshi introduced CFTC-regulated perpetual futures for HYPE on June 12, 2026, enabling U.S. retail access
- BitMEX founder Arthur Hayes criticized the SpaceX IPO as a “classic crypto grift,” suggesting insider selling could begin in July
- Open interest in HYPE futures surged to $2.56 billion, surpassing XRP’s $2.48 billion
- Technical analysis shows a falling wedge breakout suggesting potential upside toward $77.8
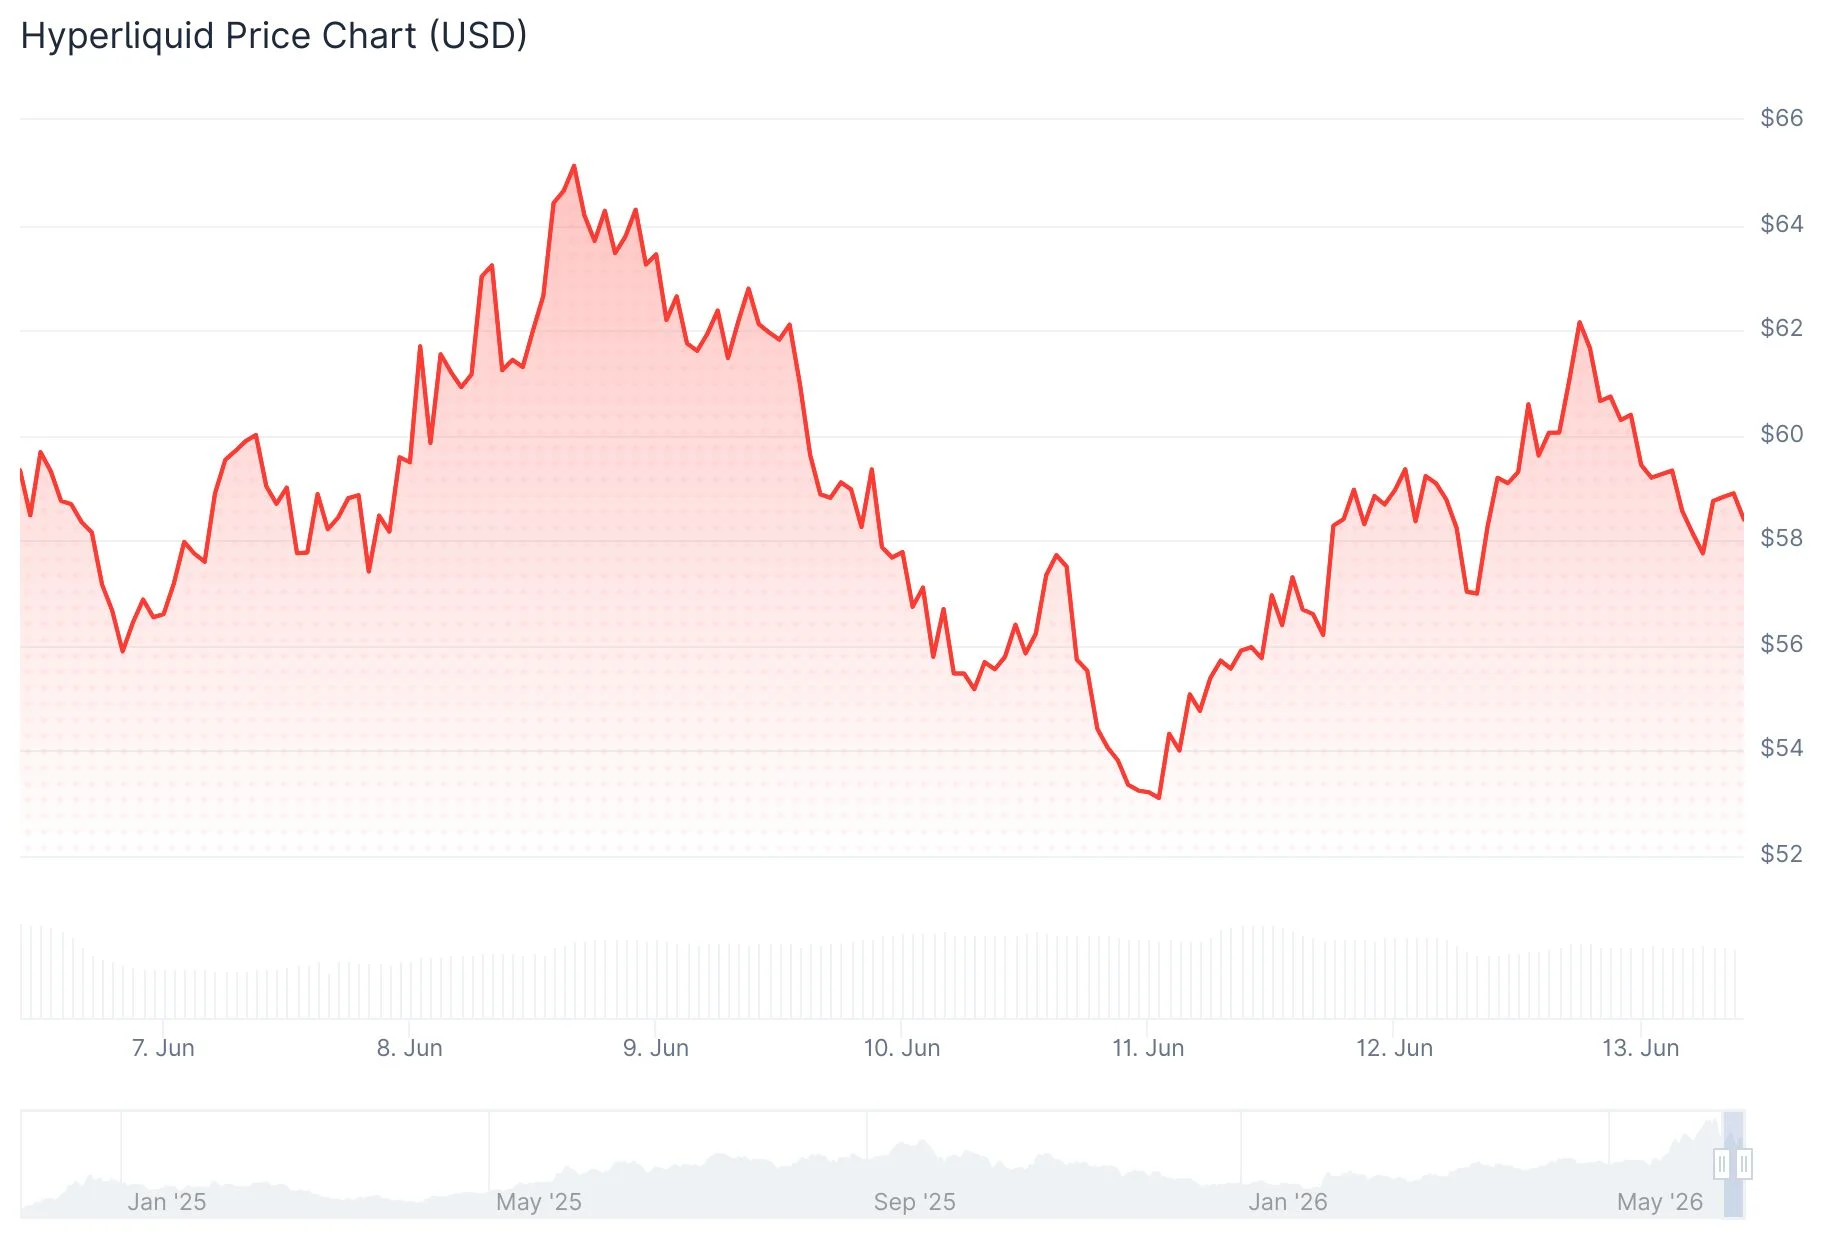
Hyperliquid (HYPE) recorded gains exceeding 7% during the 24-hour period ending June 12, 2026, with prices hovering between $60 and $61 as Bitcoin maintained stability above $63,000 and Ethereum traded around $1,600.

Throughout the previous 30 days, HYPE has registered approximately 50% in gains, bolstered by increasing trading activity and expanding platform usage.
This week’s price movement stemmed from two significant catalysts. Kalshi unveiled CFTC-regulated perpetual futures contracts for HYPE on June 12, establishing a compliant pathway for American traders to access the token.
Additionally, market participants flooded into Hyperliquid’s synthetic SPCX perpetual contract to secure SpaceX exposure before its anticipated public offering. The implied valuations in that market exceeded the IPO pricing, attracting substantial speculative interest.
Crypto analyst Altcoin Sherpa revealed a long position in HYPE ahead of SpaceX’s market debut, highlighting that the event might generate “a ton of volume” and increase awareness of Hyperliquid’s trading venues.
Former BitMEX CEO Arthur Hayes characterized the SpaceX IPO as a “classic crypto grift,” cautioning that early stakeholders might offload shares onto retail investors beginning in July. His remarks intensified speculation surrounding Hyperliquid’s SPCX perpetual contract.
Separately, Fomo rolled out perpetual trading functionality on Hyperliquid and Trade.xyz infrastructure, allowing users to trade equities, pre-IPO shares, cryptocurrencies, indices, and commodities through one unified platform.
HYPE Open Interest Overtakes XRP
Open interest for HYPE futures contracts increased 6.3% within 24 hours, reaching $2.56 billion and moving ahead of XRP’s $2.48 billion following a more modest 2% daily increase.
Daily trading volume expanded 1.71% to $3.89 billion. The simultaneous rise in both open interest and volume indicates fresh positions entering the market rather than simple position rollovers.
The Hyperliquid platform handled approximately $10.4 billion in perpetual futures volume during the past 24 hours. Its fee-based buyback mechanism channels a portion of protocol earnings and at minimum 90% of USDC yield toward HYPE token purchases from the open market.
Technical Analysis: Bullish Pattern Eyes $77.8
Examining the 4-hour timeframe, HYPE escaped from a multi-week falling wedge pattern that developed following the token’s all-time peak near $75.5 in early June. The breakout occurred near the wedge’s upper trendline, with support maintaining around the $54–$55 zone.
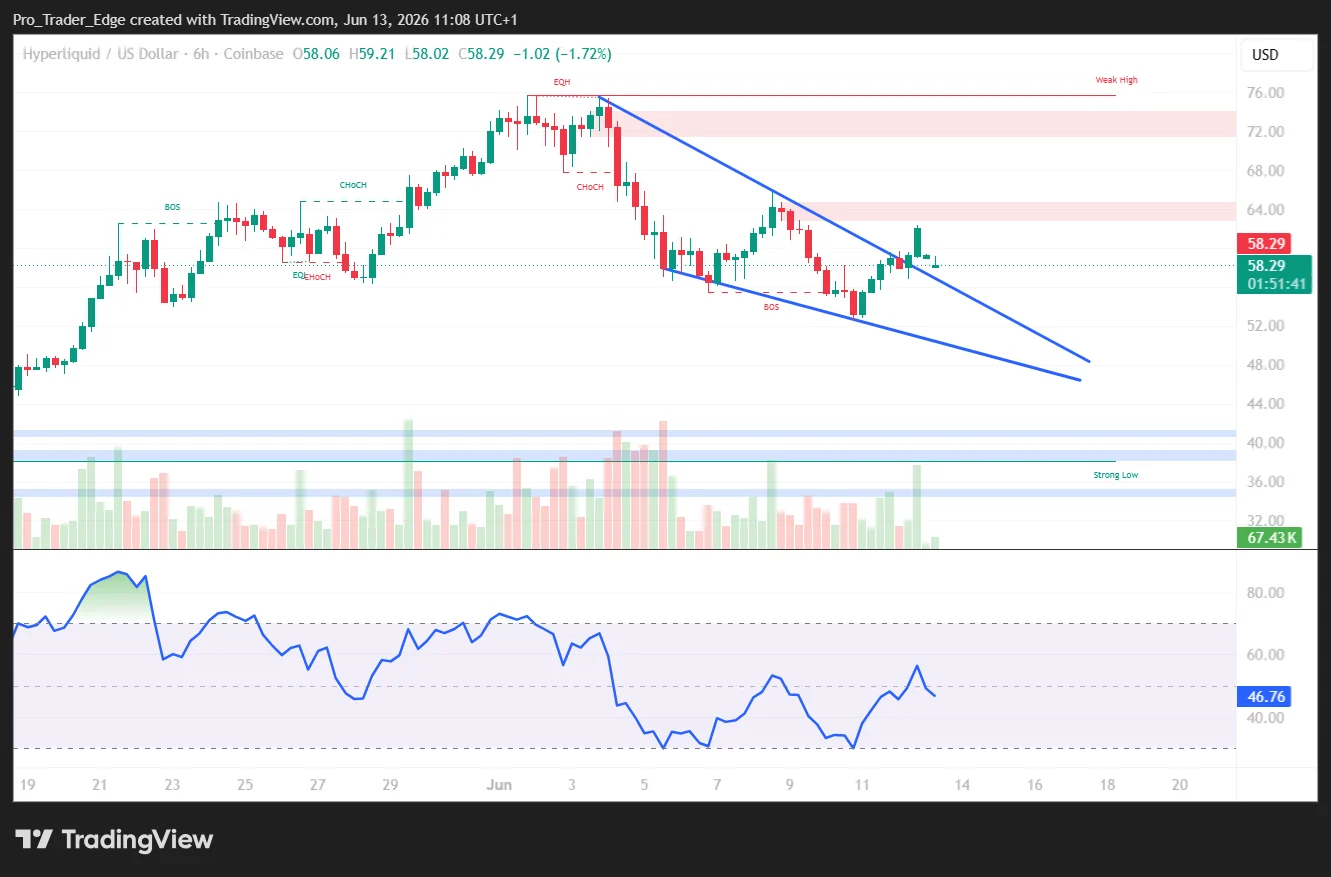
The technical pattern’s measured projection suggests approximately 20% upside potential from the breakout area, establishing a price objective around $77.8.
The 4-hour MACD indicator generated a bullish crossover signal, while the RSI climbed back above the 50 midpoint level. On the daily timeframe, HYPE is challenging the 0.618 Fibonacci retracement at $61.39. Breaking through that level exposes the subsequent resistance zone at $67.69.
The Supertrend indicator remains positioned near $74.3, suggesting the longer-term bullish trend hasn’t fully established confirmation.
Concentrated short liquidation zones between $61.5 and $63 visible on the CoinGlass heatmap may serve as price magnets should bullish momentum persist.


Zimbabwe has placed cryptocurrency firms under Reserve Bank of Zimbabwe oversight through new anti-money laundering rules.
Summary
- Zimbabwe’s Statutory Instrument 99 of 2026 places crypto firms under RBZ AML oversight.
- Crypto companies must register as VASPs before offering digital asset services locally.
- Firms with smart contract control, fund routing, or fee-setting powers must comply.
Statutory Instrument 99 of 2026 places crypto businesses under the RBZ unit that handles financial crime controls. The rules require firms that buy, sell, transfer, or store digital assets to register as VASPs.
Crypto firms must register as VASPs
The new framework gives Zimbabwe a formal rulebook for virtual asset service providers. It covers commercial firms that help customers access, move, hold, or exchange digital assets. The government introduced the regime after years of legal uncertainty in the crypto sector.
In 2018, the central bank ordered banks to stop processing crypto-related transactions. The latest rules end that gap by creating a direct registration process. Crypto companies now need legal recognition before they operate in the domestic market.
According to one report, Zimbabwe wants to avoid the Financial Action Task Force grey list. The report linked the rules to anti-money laundering and financial crime compliance. Techzim described the move as a regulatory message to global watchdogs. “A big part of S.I.99 is really Zimbabwe showing its homework to the world,” Techzim reported.
Compliance rules add banking-style demands
The regulations place crypto operators under compliance demands similar to those in commercial banking. Digital asset firms must create a legally registered domestic subsidiary. The statutory instrument also sets an annual registration fee of $500.
Directors must clear background checks before their firms receive approval. The rules require crypto companies to implement the travel rule. That requirement makes firms collect and share transaction data during qualifying asset transfers.
The framework focuses on financial crime controls rather than crypto adoption as legal tender. Techzim reported that the rules do not give sovereign endorsement to cryptocurrencies. The RBZ anti-money laundering arm will oversee the registered entities under the new regime. The rules therefore, connect crypto activity with existing national financial surveillance systems.
Smart contract control triggers compliance
The statutory instrument uses a technology-neutral approach for digital finance activities. It states that decentralization alone does not remove legal responsibility from operators. Organizations that can alter smart contracts meet the control test under the rules. Firms that route funds or set transaction fees also meet that compliance threshold.
This approach brings some decentralized finance structures into the regulatory perimeter. It focuses on control over systems, rather than labels used by crypto projects. Local fintech startups may face higher operating costs under the new requirements.
However, supporters of the rules say clear guidelines reduce the risk of sudden regulatory action. The legislation now gives Zimbabwe a formal registration path for crypto businesses. It also gives the RBZ direct oversight over companies that handle digital asset services.

Key Highlights
- Bitcoin surged past the $64,000 threshold following statements from Iran’s Foreign Minister indicating unprecedented progress toward a peace agreement with the United States.
- U.S. Vice President J.D. Vance corroborated reports that an accord is imminent, catalyzing further momentum in digital asset markets.
- The leading cryptocurrency began the trading week at $60,804 and temporarily fell beneath $60,000—a level not seen since November 2024.
- The Securities and Exchange Commission granted approval for NYSE Arca to list the T. Rowe Price Active Crypto ETF.
- Market analyst Ted Pillows forecasts BTC may decline to $50,000 before staging a substantial recovery toward $100,000.
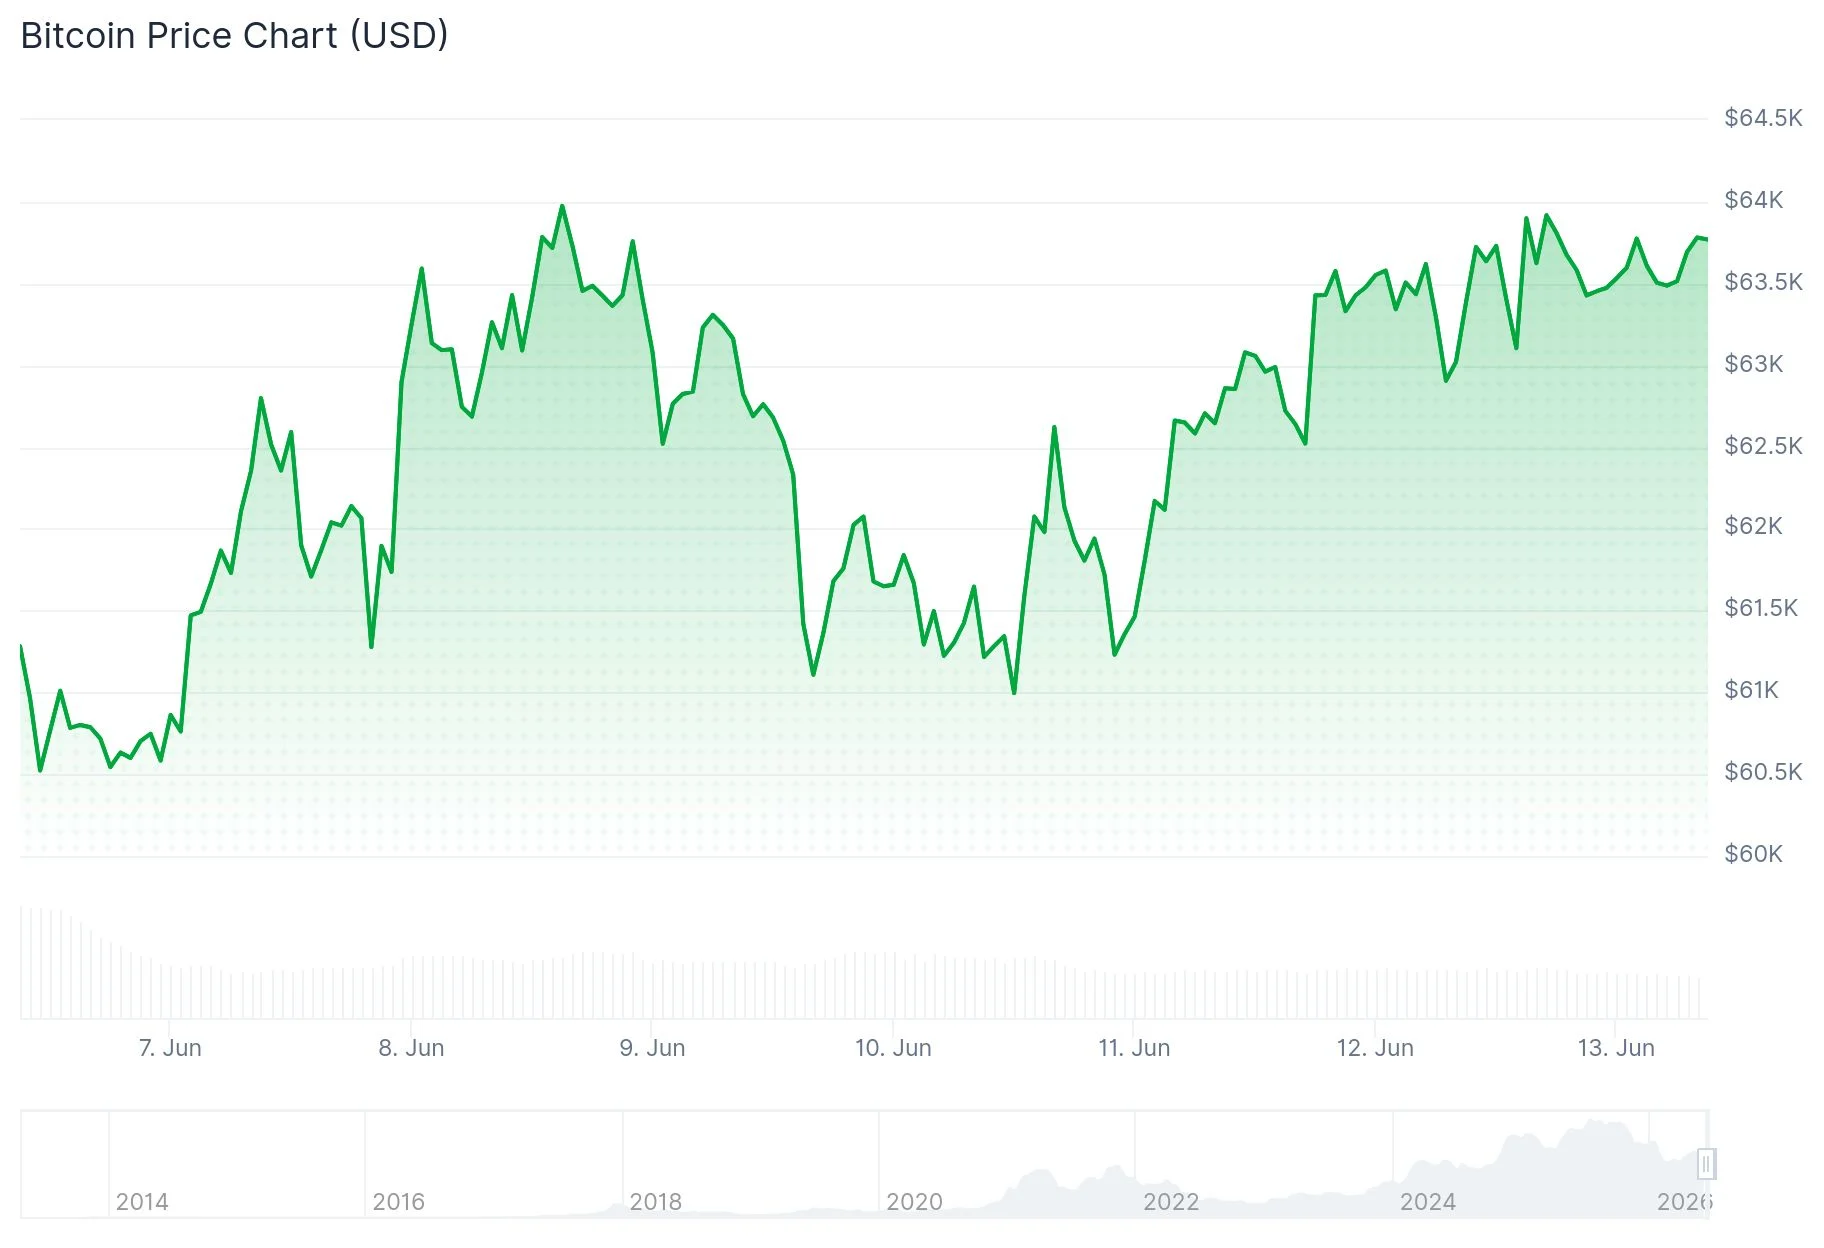
Bitcoin has recovered to trade above $64,000 as optimism surrounding a potential diplomatic agreement between the United States and Iran bolstered appetite for risk-sensitive assets globally. The premier digital currency experienced significant volatility throughout the week before finishing with strong gains.
The cryptocurrency commenced the week trading at $60,804, having declined from elevated levels due to escalating geopolitical tensions across the Middle East, increasing crude oil valuations, and persistent inflation concerns that could maintain elevated interest rates. During this period, BTC briefly traded below the $60,000 mark for the first time since November 2024.
The reversal in market sentiment occurred when American government representatives indicated meaningful advancement toward finalizing an agreement with Iran. President Trump announced that a deal was within reach and suspended previously scheduled military operations against Iran. He further stated that both nations would jointly announce the location and timing for a formal signing ceremony.
Bitcoin advanced beyond $63,000 in response to Trump’s announcement, then gained additional momentum following confirmation from Iran’s Foreign Minister Abbas Araghchi.
Araghchi indicated that the Islamabad Memorandum of Understanding “has never been closer” to realization, while cautioning media outlets against speculating about specific terms before official publication.
Cryptocurrency market observer Ted Pillows offered his perspective on X, referencing historical pricing trends. He observed that BTC typically traded 10–20% beneath the 300-week exponential moving average prior to establishing a market bottom in previous cycles, and anticipates a comparable pattern currently—suggesting a potential floor around $50,000 before a substantial advance toward $100,000.
Cryptocurrency Markets Rally as International Tensions Subside
U.S. Vice President J.D. Vance likewise verified that an agreement is approaching finalization, while simultaneously dispelling circulating misinformation. He clarified that Iran would not receive direct monetary transfers and emphasized that no frozen assets would be released merely through signing the document.
“This agreement possesses the capability to fundamentally transform the region and establish enduring peace,” Vance declared.
Notwithstanding the encouraging rhetoric from both governments, decentralized prediction platform Polymarket currently assigns only a 37% probability to a permanent agreement being executed by June 30, with a 46% likelihood for completion at a subsequent date. Market participants remain cautious about fully incorporating a successful deal into asset valuations.
Bitcoin received additional support from the impressive Nasdaq introduction of SpaceX. The aerospace company founded by Elon Musk saw its shares appreciate approximately 19% during initial trading, generating positive momentum for growth-focused investments across multiple sectors.
Regulatory Approval Granted for Novel Crypto ETF
The Securities and Exchange Commission authorized NYSE Arca’s application to list the T. Rowe Price Active Crypto ETF. This actively managed investment vehicle will maintain the flexibility to allocate capital across multiple digital assets including Bitcoin, Ether, XRP, Solana, and Dogecoin.
This development represents continued progress in the proliferation of regulated cryptocurrency investment instruments available to American investors.
In related corporate news, Strategy—which maintains the largest institutional Bitcoin holdings—revealed it liquidated 32 BTC for approximately $2.5 million during the period spanning May 26 through May 31. The proceeds were allocated to fund dividend obligations on its preferred equity securities, representing a minimal portion of its comprehensive digital asset portfolio.
Spot Bitcoin exchange-traded funds have experienced consistent capital withdrawals in recent periods. Bitcoin is presently valued at approximately $63,814, remaining roughly 50% beneath its October 2025 all-time peak of $126,000.

You know the trade: pick an asset, pick a price level, pick a deadline. If BTC closes above $70,000 by Friday at noon, you take a fixed payout. If not, you lose your stake. Crypto binary options are familiar to anyone who has traded options on a CEX or TradFi derivatives desk. The problem is finding that instrument on-chain. Decentralized exchanges do spot and perpetuals. Prediction market platforms do event outcomes. Nobody built the decentralized binary options layer. SeerDEX did.
The Gap Crypto Derivatives Traders Know Well
Polymarket and Kalshi dominate on-chain event trading, but both offer prediction markets, not binary options. A prediction market is where YES/NO shares price implied probability and settle at $1 or $0 on a real-world outcome. That’s a different instrument. A binary option bets on a price level by a deadline, not on an event’s implied probability.
Kalshi operates under US regulation, which limits what it can list and who can use it. Polymarket has no native token and is working toward a token generation event (TGE) expected in Q4 2026. Neither offers crypto binary options. For that instrument, derivatives traders still need a separate CEX account, with all the custody risk and centralized control that comes with it.
What SeerDEX Offers: Three Instruments, One Platform
SeerDEX combines prediction markets, crypto binary options, and perpetuals in one app, with one token: $SEERX (ERC-20 on Ethereum), bridgeable to Solana and other supported networks. Perpetuals are planned for Phase 5 and are not currently live. Traders enter the presale ETH, BNB, or card; purchases up to $1,000 don’t require KYC.
Markets are permissionless: any user can propose and launch a binary option or prediction market by staking $SEERX. An AI engine screens each proposal for clarity and oracle-resolvability before it goes on-chain. Settlement draws on a multi-oracle system — Chainlink, Pyth, and UMA — so no single data source controls the outcome. The $SEERX token contract has been audited by CredShields with zero critical or high-severity issues; a platform audit is planned pre-mainnet.
How Do Crypto Binary Options Work on SeerDEX?
A binary option on SeerDEX works like this: will BTC exceed $70,000 by Friday at 12:00 UTC? Traders take a YES or NO position. If BTC closes above that level at expiry, YES positions pay out; if not, NO positions win. Unlike perpetuals, there’s no funding rate and no liquidation. The payoff is binary.
Chainlink, Pyth, and UMA all verify the outcome independently before payouts go out on-chain.
| Platform | Prediction Markets | Crypto Binary Options | Permissionless Creation | Native Token |
|---|---|---|---|---|
| Polymarket | ✓ | ✗ | ✗ | ✗ (TGE Q4 2026) |
| Kalshi | ✓ | ✗ | ✗ | ✗ |
| SeerDEX | ✓ | ✓ | ✓ | ✓ ($SEERX, presale live) |
$SEERX Tokenomics and Presale Structure
The $SEERX presale is a multi-stage sale opening at $0.00050 (Stage 1), with price stepping up with each new stage. Presale allocation: 8 billion tokens (40% of the 20 billion total supply).
Token distribution: 24% project development, 15% ecosystem, 15% liquidity, 6% staking. Staking rewards release at 2% of supply per year over three years. The protocol routes 40% of all trading fees into $SEERX buybacks. Bonus tokens scale by purchase size: +10% at $1,000, +20% at $2,000, +30% at $5,000.
What Does the $SEERX Presale ROI Look Like?
A $1,000 entry at Stage 1 ($0.00050) buys 2,000,000 $SEERX. The Stage 1 purchase bonus (+10% on $1,000 entries) lifts that to 2,200,000 $SEERX. This is not an exchange-listing guarantee or a post-launch price prediction. Analysts suggest early presale buyers could see meaningful upside if the platform attracts users after launch, but returns are not guaranteed. Early buyers lock in the lowest available entry; later buyers pay more for the same tokens.
How to Buy $SEERX
Go to seerdex.com and connect a compatible wallet. The presale accepts ETH, BNB, and card payments. Purchases up to $1,000 don’t require KYC. Select your amount, confirm the transaction, and $SEERX arrives in your wallet. The current stage price is valid only until the next stage opens.
About SeerDEX: SeerDEX is a Solana-native trading platform combining prediction markets, binary options, and perpetuals in a single ecosystem. Powered by an AI governance engine for permissionless market creation, $SEERX is issued on Ethereum as an ERC-20 token and is multichain by design — bridgeable to Solana and other supported networks so holders can use it wherever they trade. The platform accepts ETH, BNB, and card payments (up to $1,000 without KYC). Website: https://seerdex.com/ | Twitter/X: @seerdexmarkets | Telegram: @seerdexofficial
Disclaimer: This is a Press Release provided by a third party who is responsible for the content. Please conduct your own research before taking any action based on the content.
Crypto World
XRP (XRP) Bounces From $1.05 Low as Analysts Call Market Bottom and Target $1.30 Breakout
Key Takeaways
- XRP maintains position above $1.14 after touching $1.05 during the latest market-wide selloff
- Technical indicators reveal bullish RSI divergence, with market analysts eyeing $1.30 as the next significant level
- Derivatives market activity has cooled, with Futures Open Interest declining from $2.96 billion to $2.45 billion since early June
- XRP ETF activity shows inconsistent patterns, recording no inflows on Thursday despite earlier weekly gains; total cumulative inflows reach $1.43 billion
- Price action remains constrained below all primary moving averages, with the 50-day EMA positioned near $1.30 serving as critical overhead resistance
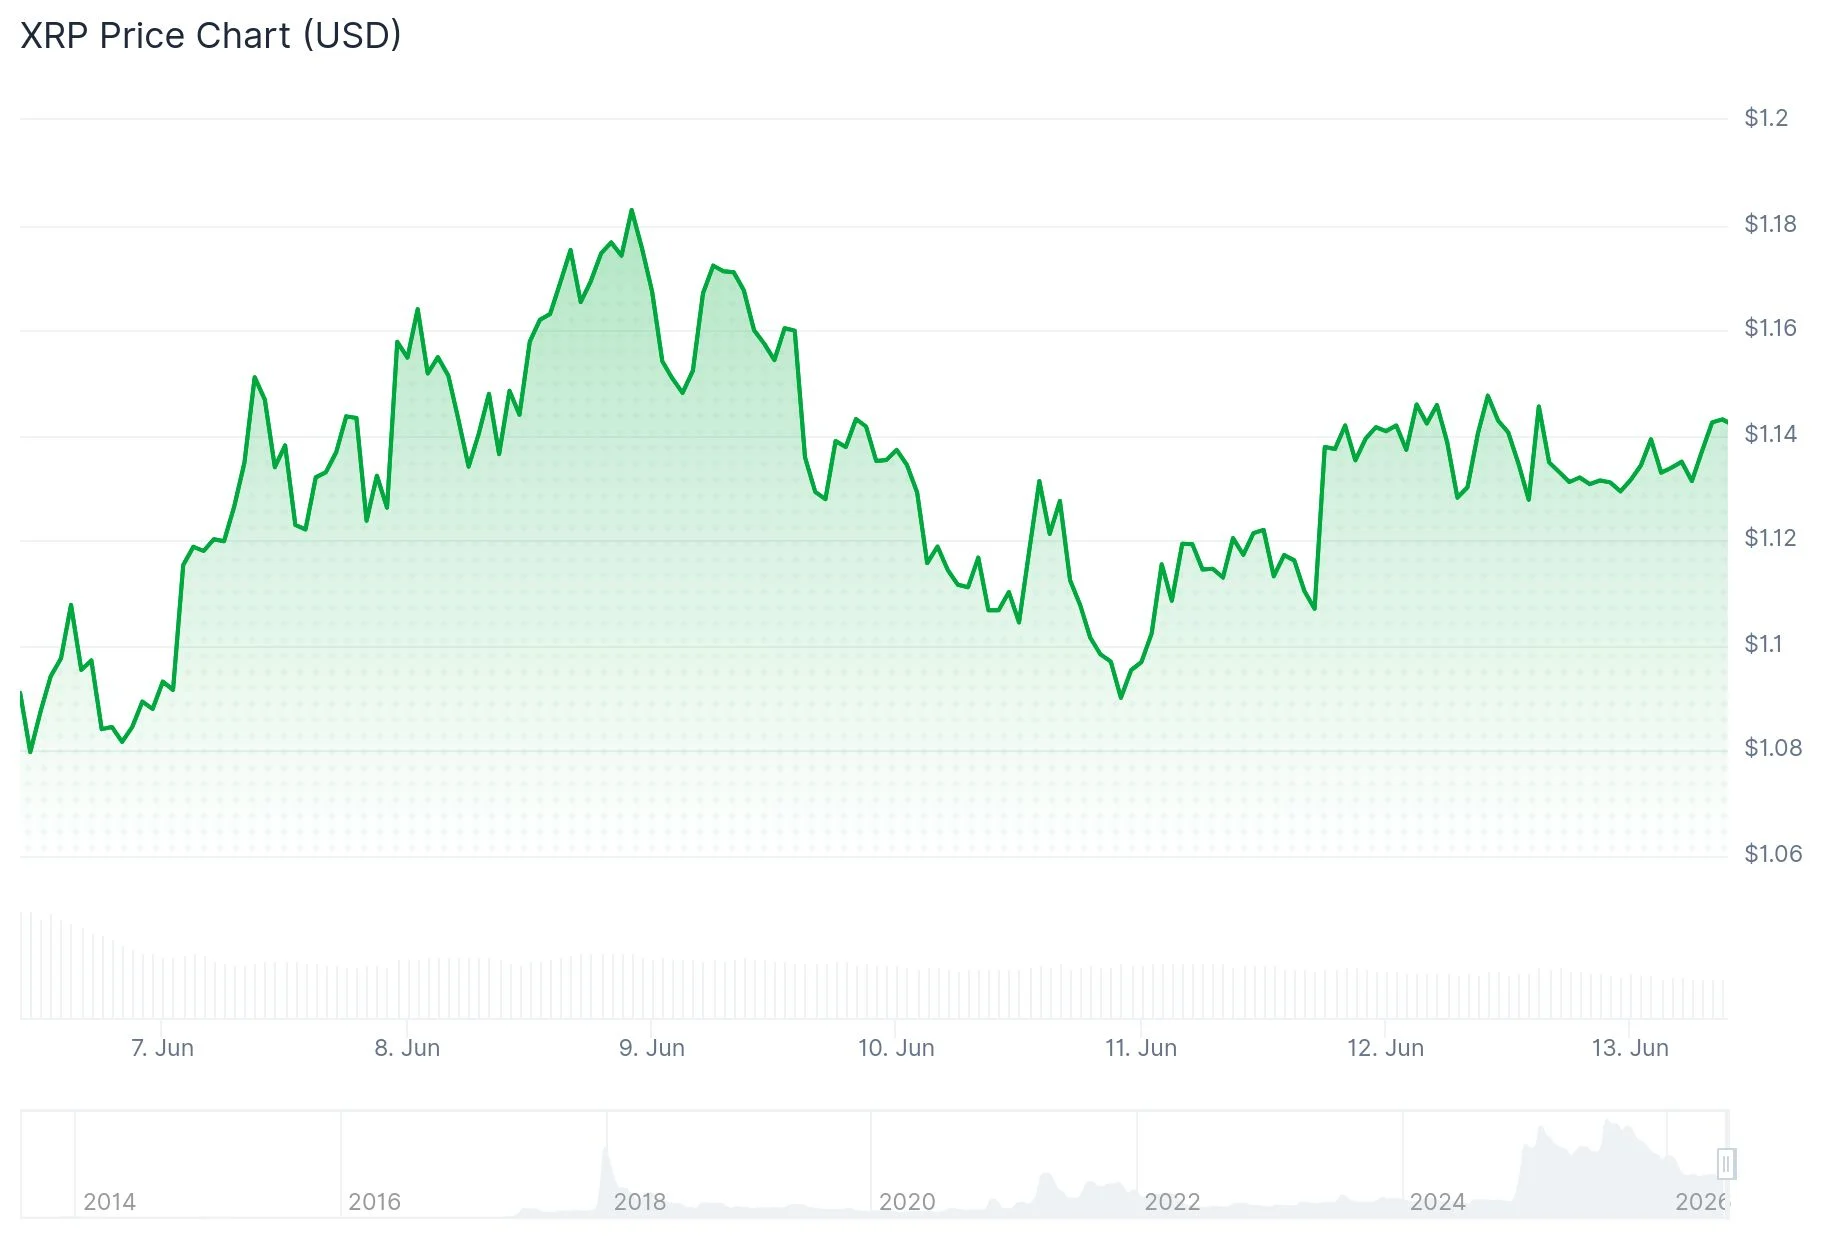
Ripple’s native digital asset is currently changing hands near $1.14 following a rebound from its June bottom at $1.05. The recent downturn eliminated stop-loss orders and cleared out overleveraged positions before demand reemerged in the market.

CryptoPulse, a prominent market technician, characterized the price action as a “capitulation flush,” noting that the breach of $1.13 support represented a needed cleansing event before any meaningful upward movement could materialize.
The subsequent bounce has highlighted an emerging technical formation on the Relative Strength Index. Despite price action establishing a lower low, the RSI registered a higher low — creating a bullish divergence pattern that indicates weakening downside momentum.
Derivative Markets and ETF Activity Show Weakness
Futures Open Interest stood at an average of $2.96 billion at the beginning of June but has contracted to $2.45 billion. This contraction signals diminished participation from speculators and reflects waning conviction in an imminent upward move.
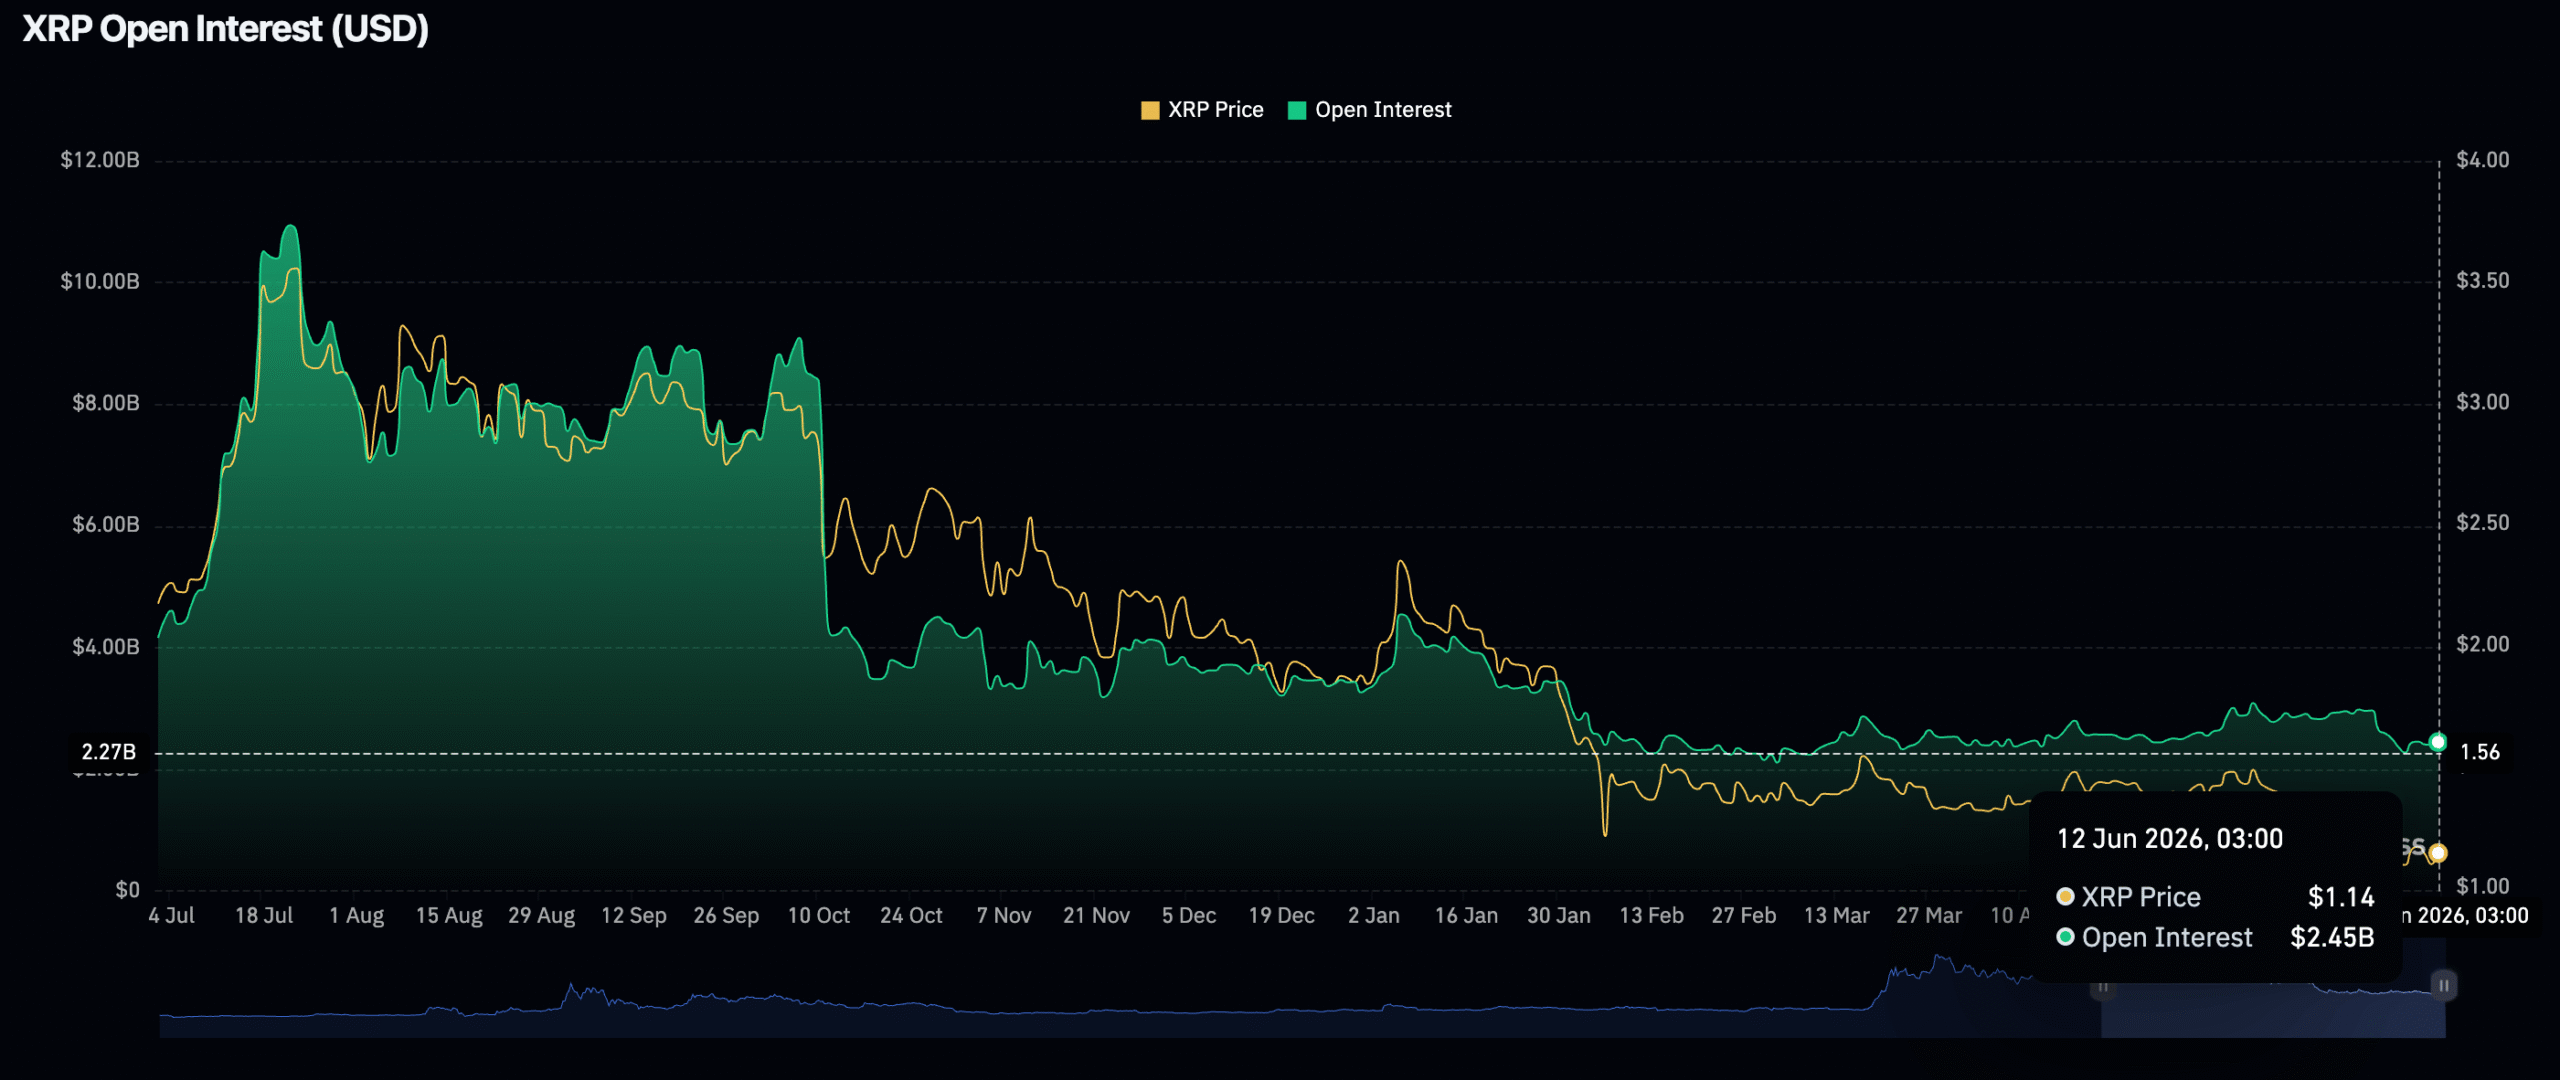
Spot ETF activity for XRP has displayed irregular patterns. Capital inflows reached $7.44 million on Tuesday and $1.2 million on Wednesday, yet Thursday recorded zero movement. Total ETF inflows currently total $1.43 billion, while net assets under management sit at $985 million.
ChartNerd, a technical analyst, identified an important development on the bi-weekly timeframe. Price has retraced to the lower regression band of the Gaussian Channel around $1.04, a threshold that has emerged at comparable junctures during previous cycles. ChartNerd labeled this zone as “the land of macro opportunity” and noted this pattern has reliably repeated throughout earlier market phases.
Technical Resistance Levels Create Overhead Pressure
XRP continues to trade beneath its 10-day, 50-day, 100-day, and 200-day exponential moving averages. The 50-day EMA hovers around $1.30, coinciding with the significant resistance threshold that market participants are monitoring closely.
The 100-day EMA is positioned near $1.39, whereas the 200-day EMA rests around $1.61. These price points create an extensive overhead supply region that must be overcome for any durable uptrend to establish itself.
The RSI (14) currently registers 35.10, hovering above oversold conditions but moving closer to that threshold. The MACD indicator remains marginally negative at -0.06656. The Momentum (10) indicator has recently generated a Buy signal, potentially suggesting that near-term selling pressure is diminishing.
TradingView’s composite technical assessment stands at Neutral, incorporating 14 Sell indicators, 10 Neutral readings, and only 2 Buy signals.
From an Elliott Wave perspective, analysts suggest XRP could be finalizing a Wave (2) correction as part of a broader Cycle Wave V pattern. The identified accumulation range spans between the 50% and 61.8% Fibonacci retracement levels, approximately $1.19 to $0.91. Market technicians assign a 65-70% probability that the larger bullish framework remains valid.
At press time, XRP was trading around $1.14, reflecting a 3.06% gain over the preceding 24-hour period.


Standard Chartered has kept its $100,000 Bitcoin target and $4,000 Ethereum target after the selloff.
Summary
- Standard Chartered kept its $100K Bitcoin target after BTC rebounded from the $59K zone.
- Geoffrey Kendrick linked the selloff to forced selling, weak ETF flows, and liquidity stress.
- Kendrick kept the $4K Ethereum target and expects ETH to outperform Bitcoin.
Standard Chartered digital-assets research head Geoffrey Kendrick said the drop likely set the cycle bottom in his latest note. Bitcoin fell toward $59,000 before rebounding near $63,500, while Ethereum traded near $1,665.
Bitcoin’s price target stays at $100,000
Kendrick described the $59,000 Bitcoin move as the “likely low” for the current cycle. He kept the bank’s $100,000 year-end Bitcoin target after the rebound toward $63,500. His note framed the latest move as the end of crypto winter. It did not treat the drop as the start of another breakdown.
Kendrick tied the selling pressure to forced selling, weak ETF flows, and liquidity stress. He said those factors had caused the deepest damage during the drawdown. The bank’s call extends its earlier bullish Bitcoin view after a sharp decline.
Bitcoin trades far below Standard Chartered’s target, despite its recovery from $59,000. Kendrick’s call depends on stronger confirmation from ETF flows and institutional demand. The note kept its focus on price levels, flows, and treasury demand.
Bitcoin ETF flows and SpaceX liquidity stay in focus
Spot Bitcoin ETF redemptions remain a central test for Kendrick’s bottom call. Market context showed U.S. funds saw heavy outflows during the selloff. Those redemptions weakened the institutional bid that supported Bitcoin earlier. Kendrick said consistent inflows would support his recovery thesis.
The liquidity picture also includes the SpaceX IPO window, according to Kendrick’s note. He cited cash demand around the listing as pressure on risk assets. Crypto markets tracked SPCX trading on Nasdaq after SpaceX’s $75 billion IPO, according to related context.
Synthetic SpaceX-linked markets drew crypto-native volume during the same period. Strategy remains a demand factor in Bitcoin’s short-term market setup. Market participants tracked whether Michael Saylor’s company would keep absorbing Bitcoin supply.
Ethereum’s target remains at $4,000
Kendrick also kept his $4,000 Ethereum target and expects ETH to outperform Bitcoin. Ethereum traded near $1,665, well below that target. Standard Chartered’s existing Ethereum thesis links ETH demand to stablecoins, tokenized assets, and onchain settlement.
The bank has argued that Ethereum network use remains stronger than price action. Ethereum’s recent weakness kept the ETH/BTC ratio under pressure. Kendrick said a ratio rebound would show renewed investor demand for Ethereum exposure.
The note placed Ethereum’s path beside Bitcoin’s ETF flow test. It also kept institutional demand and macro stress in view as market confirmation points. Kendrick listed several markers for the next market stage. They include Bitcoin holding $59,000, ETF inflows returning, Strategy demand stabilizing, and Ethereum regaining relative strength.
Key Takeaways
- Ethereum currently sits around $1,670, posting a modest 1% gain over the past day while maintaining bearish technical signals
- Technical analysis reveals a bear flag formation constraining upside potential below the $1,700 threshold
- Bulls need a decisive move above $1,700 to target $1,850–$1,900; downside breakdown could revisit $1,500
- Approximately 500,000 ETH tokens valued at roughly $800 million exited centralized exchanges in the past week
- Spot Ethereum ETF products recorded $16 million in net redemptions on Thursday, marking the third consecutive session of outflows
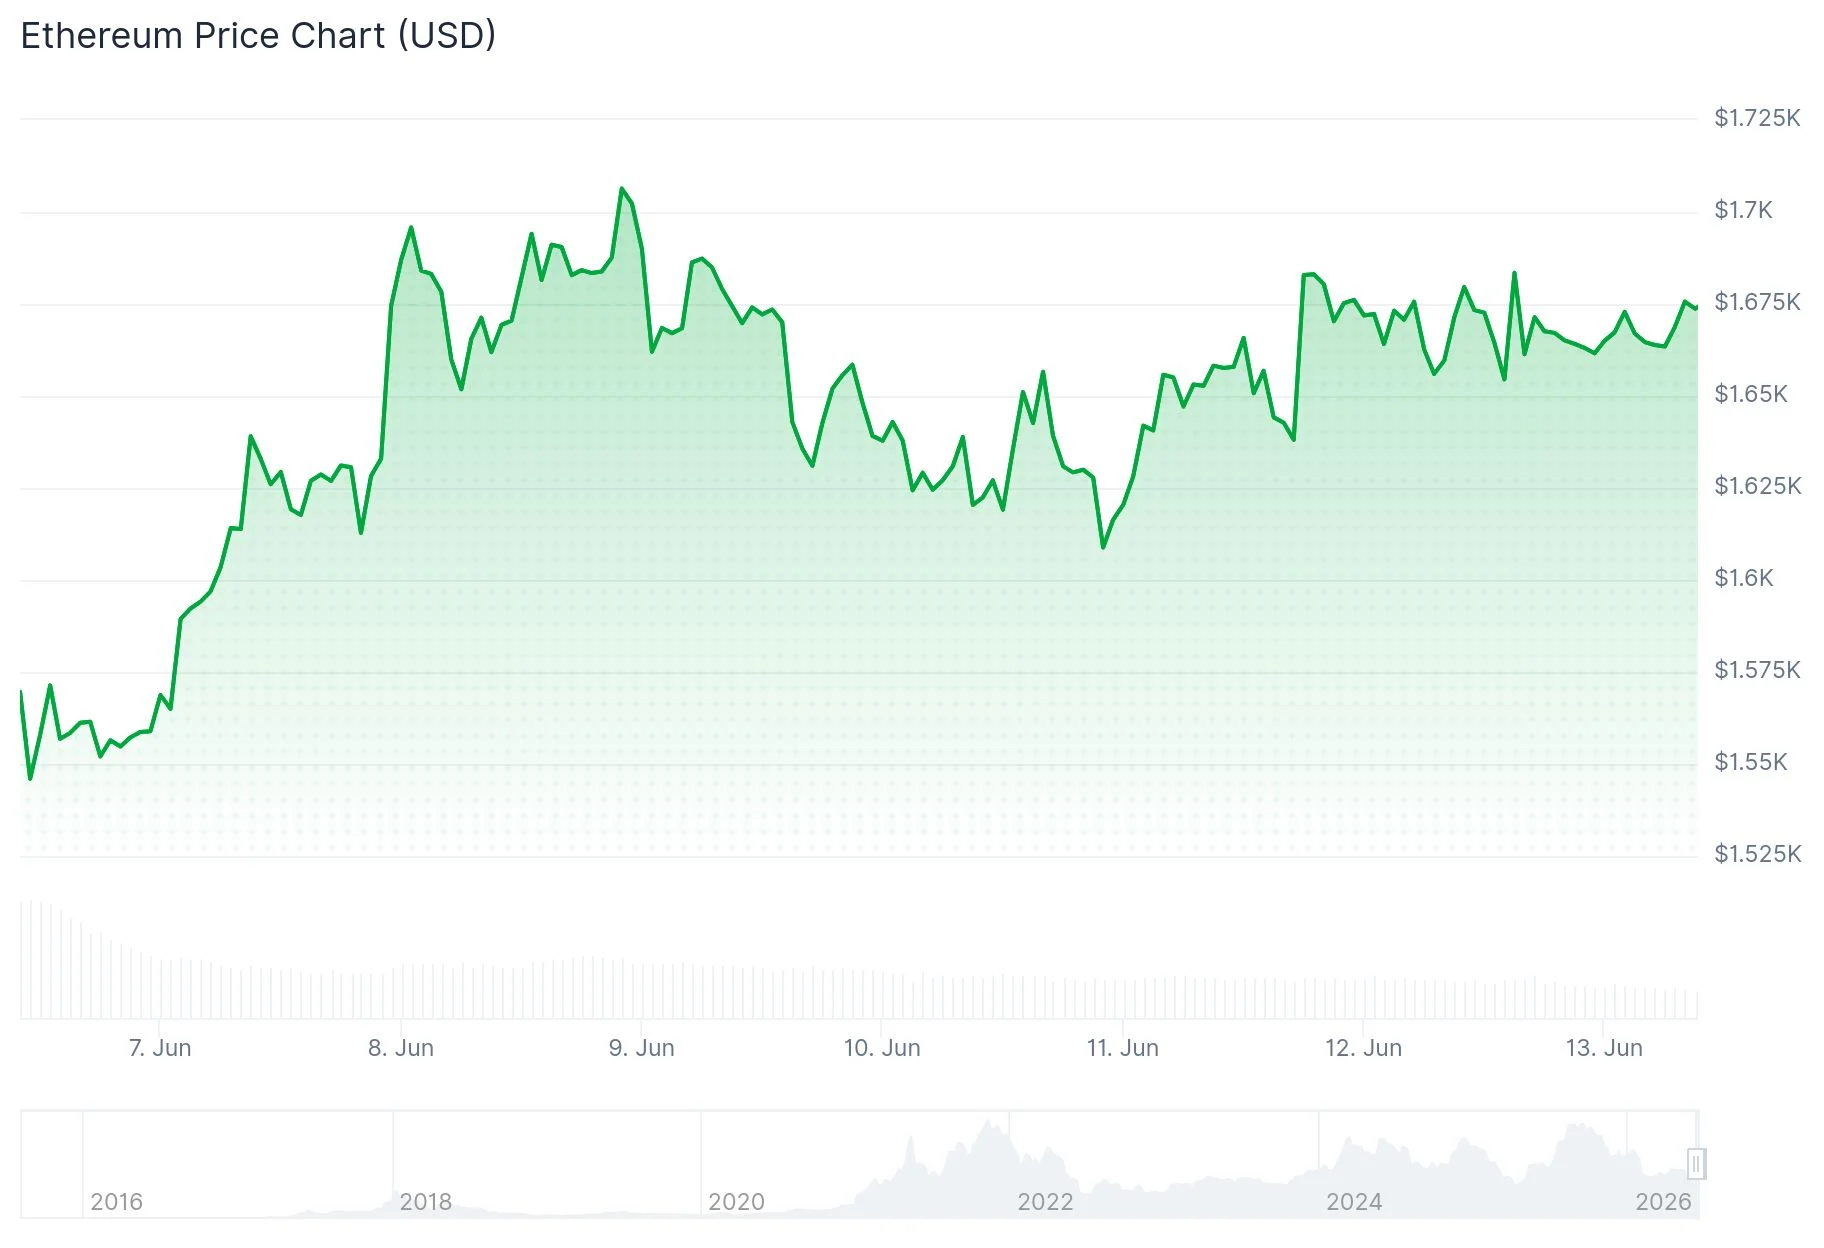
Ethereum’s price action reveals tentative stabilization following recent declines, though bearish momentum continues to dominate the technical landscape. The second-largest cryptocurrency by market capitalization currently hovers around $1,670, registering slight positive movement of approximately 1% in the 24-hour window.

This marginal uptick follows substantial losses that began in mid-May, fueled predominantly by escalating geopolitical tensions and broader macroeconomic headwinds. The current bounce appears tentative and lacks the conviction needed for a sustained reversal.
Market technician Ted highlighted that ETH remains confined within a bear flag configuration. This particular chart pattern traditionally indicates additional downward pressure unless price action decisively escapes the formation’s boundaries.
For Ethereum to fundamentally alter its trajectory, a convincing daily close above the $1,700 resistance zone becomes essential. Successfully clearing this technical hurdle could unleash momentum toward the $1,850–$1,900 price range.
Should resistance at $1,700 prove insurmountable, the probability of renewed downside increases substantially. Under such circumstances, traders would likely refocus attention on the $1,500 support threshold.
Significant Exchange Outflows Suggest Potential Accumulation Phase
Cryptocurrency analyst Ali Charts highlighted via social media platform X that approximately 500,000 ETH tokens — representing roughly $800 million in value — departed centralized trading venues during the previous seven-day period. Substantial token migrations away from exchanges frequently suggest investors are transferring holdings into self-custody solutions, which market participants often interpret as preparatory accumulation behavior.
Blockchain metrics provide additional perspective on current market dynamics. Active Ethereum wallet addresses declined to approximately 480,000 on Thursday, retreating from 554,000 in recent sessions and substantially below the 738,000 figure recorded in late April.
Declining network participation during attempted price recoveries indicates the rally lacks widespread engagement across the user base. Such divergences between price and fundamental activity metrics frequently precede correctional moves.
Investment Product Redemptions Compound Selling Pressure
Ethereum-focused exchange-traded fund products have experienced three consecutive sessions of net capital withdrawals. Thursday’s redemptions totaled $16 million, following $41 million and $36 million in outflows on Tuesday and Wednesday respectively.
Derivatives market indicators similarly reflect cautious positioning. Aggregate open interest across Ethereum futures contracts contracted to $22.98 billion on Friday, down sharply from $30.95 billion recorded at June’s beginning.
The Moving Average Convergence Divergence indicator registers approximately -138.24, positioned beneath its signal line at -130.37, confirming sellers maintain market control. Meanwhile, the Relative Strength Index hovers marginally above 30, indicating the asset approaches oversold conditions without yet confirming directional reversal.
ETH currently trades substantially below its 50-day, 100-day, and 200-day exponential moving averages positioned at $2,000, $2,148, and $2,405 respectively. These technical levels constitute formidable overhead resistance barriers.
The most current pricing data places ETH at $1,688, remaining constrained beneath the pivotal $1,700 level with no confirmed bullish reversal signal evident on daily timeframe charts.
Crypto World
SEC Plan to Scrap Rule 611 Could Be the Biggest Regulatory Unlock Yet for Crypto Tokenized US Stocks

The SEC just removed the single biggest legal obstacle standing between Crypto DeFi and US equity markets. On June 11, the agency formally proposed to rescind Rule 611 of Regulation NMS, the trade-through prohibition that has governed stock order routing since 2005, along with Rule 610(e), which bans locked and crossed quotations.
For tokenized stocks, the structural implications are immediate and profound.
Galaxy Digital’s head of research Alex Thorn called the proposal “one of the biggest unlocks yet for tokenized stocks”, the removal of what he described as “one of the biggest structural barriers to tokenized US equities trading in DeFi.”
The proposal is now open for a 60-day public comment period before the SEC moves toward a final rule.
TODAY
: The Commission proposed the rescission of Regulation NMS Rules 611 and 610(e).
This proposal would reduce costs for market participants and allow competition, innovation, and other market forces to shape the continued evolution of U.S. equity markets. pic.twitter.com/oIxAAdcSmE— U.S. Securities and Exchange Commission (@SECGov) June 11, 2026
The move sits inside the SEC’s broader Project Crypto initiative, launched in August 2025 to modernize the regulatory framework for digital assets and blockchain technology in US markets. Rule 611’s repeal, if finalized, would be the most consequential piece of that puzzle yet.
Discover: The Best Crypto to Diversify Your Portfolio
Rule 611 and the Order Protection Rule: Why AMMs Have Been Structurally Illegal
Rule 611, also called the Order Protection Rule, was adopted in 2005 as the centerpiece of Regulation NMS. It prohibits trade-throughs, executing a stock order at a price worse than the best protected quote available on any other registered exchange.
In theory, it hard-wires the National Best Bid and Offer (NBBO) into every equity transaction across all venues.
The problem for tokenized equities is structural and unsolvable under the current framework. A DeFi AMM prices trades algorithmically, against whatever the pool price is at the moment of execution, derived from a constant-product formula rather than by routing to the NBBO.
Thorn put it plainly: any AMM pool offering tokenized US stocks “would commit trade-throughs constantly and arguably be an illegal trading center.” Rule 610(e) compounds the problem – AMMs cannot halt a trade when a better quote exists elsewhere, meaning they would be in continuous violation on that front too.
The SEC’s proposed replacement is a principles-based best execution framework applied at the broker-dealer level rather than on every individual trade across venues.
That shift is what makes AMM-based tokenized equities workable, brokers interfacing with DeFi pools would need to demonstrate policies reasonably designed to achieve best execution for clients overall, without needing to guarantee NBBO compliance on each atomic swap.
Commissioner Hester Peirce, in her supporting statement, argued the existing Order Protection Rule had “helped fuel disorder” by encouraging exchange proliferation and suppressing innovation rather than protecting investors.
Discover: The Best Token Presales
Crypto RWA Tokenization Stakes: The Market This SEC Rule Change Was Blocking
Tokenized equities sit inside the fast-expanding real-world asset (RWA) category, where institutional capital has been steadily building infrastructure for on-chain versions of traditional financial instruments.
Platforms including Robinhood and Kraken have been developing tokenized stock capabilities, and the SEC had reportedly prepared a separate innovation exemption for authentic tokenized versions of exchange-listed US equities, backed 1:1 by underlying shares at a qualified custodian, before postponing its release last month after traditional exchange officials raised execution concerns.
Rescinding Rule 611 resolves the core incompatibility that made that exemption legally fraught in the first place.

Policy analysts at TD Cowen’s Washington Research Group expect a final SEC vote on rescission by Q1 2027, assuming a standard comment-and-reproposal cycle, a timeline that would align with other market-structure reforms under Regulation NMS modernization.
International regulatory movement is also accelerating the pressure: Japan’s recent reclassification of crypto assets as financial instruments signals that competing jurisdictions are not waiting for Washington to act.
The competitive window is real. Wall Street is not debating tokenization anymore, it is building the rails. Citi, DTCC, and a growing roster of prime brokers are already deep into on-chain settlement infrastructure, and the removal of Rule 611 clears the last major regulatory obstacle for AMM-based tokenized US equity trading to operate at scale.
The post SEC Plan to Scrap Rule 611 Could Be the Biggest Regulatory Unlock Yet for Crypto Tokenized US Stocks appeared first on Cryptonews.

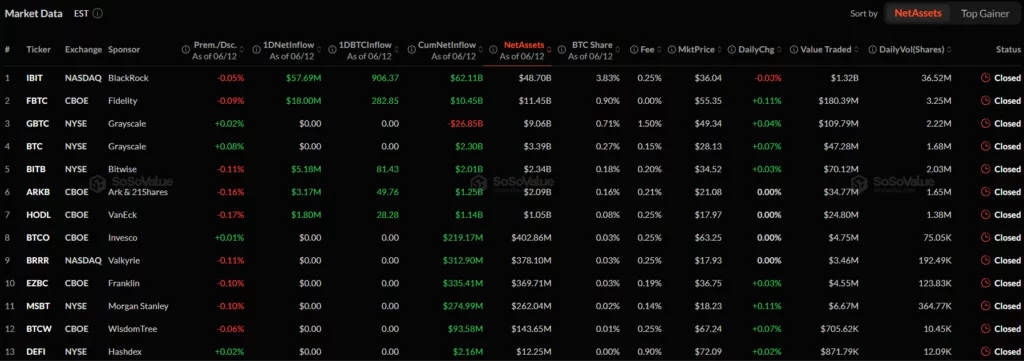
According to a recent SoSoValue update, U.S. spot Bitcoin ETFs recorded $85.85 million in daily total net inflow on June 12.
Summary
- U.S. spot Bitcoin ETFs recorded $85.85M in daily net inflows on June 12.
- BlackRock IBIT led all funds with $57.69M in daily net inflow.
- Grayscale GBTC and BTC recorded zero daily inflows, while BITB added $5.18M.
Total value traded reached $1.81 billion, while total net assets stood at $79.65 billion. Those assets represented 6.26% of Bitcoin’s market capitalization after the update completed.
BlackRock IBIT draws $57.69M as Fidelity FBTC adds $18M
A deep dive into the performance of individual Bitcoin ETFs reveals that market data showed BlackRock’s IBIT leading the group by assets and daily inflow. IBIT held $48.70 billion in net assets, equal to a 3.83% Bitcoin share. The fund drew $57.69 million in daily net inflow and 906.37 BTC in daily BTC inflow. IBIT traded at $36.04, down 0.03%, with $1.32 billion in value traded. Its premium or discount stood at minus 0.05%, and volume reached 36.52 million shares.
Source: SoSoValue (Bitcoin ETFs)
Fidelity’s FBTC ranked second with $11.45 billion in net assets and a 0.90% Bitcoin share. FBTC added $18.00 million in daily net inflow and 282.85 BTC in daily BTC inflow. The fund traded at $55.35, up 0.11%, with $180.39 million in value traded. Its premium or discount stood at minus 0.09%, and volume reached 3.25 million shares.
Grayscale Bitcoin ETFs record zero daily inflows as BITB adds $5.18M
Grayscale’s GBTC held $9.06 billion in net assets and carried no daily net inflow. The fund also showed zero daily BTC inflow during the session. GBTC traded at $49.34, up 0.04%, with $109.79 million in value traded. Its premium or discount stood at positive 0.02%, and daily volume reached 2.22 million shares.
Grayscale’s BTC product held $3.39 billion in net assets and also recorded no daily inflow. It traded at $28.13, up 0.07%, with $47.28 million in value traded. BITB held $2.34 billion in net assets and added $5.18 million in daily net inflow. BITB traded at $34.52, up 0.03%, with $70.12 million in value traded.
ARKB and HODL post modest inflows as smaller Bitcoin ETFs stay flat
Ark 21Shares’ ARKB held $2.09 billion in net assets and added $3.17 million in daily inflow. Its price stood at $21.08 with no daily change, while the value traded reached $34.77 million. VanEck’s HODL held $1.05 billion and added $1.80 million in daily net inflow. The HODL Bitcoin ETF traded at $17.97 with no daily change and $24.80 million traded.
Smaller funds showed limited movement across inflows and prices. BTCO, BRRR, EZBC, MSBT, BTCW, and DEFI recorded zero daily net inflow. BTCO, BRRR, and EZBC held $402.86 million, $378.10 million, and $369.71 million in net assets. MSBT, BTCW, and DEFI followed with $262.04 million, $143.65 million, and $12.25 million.
Daily price changes stayed narrow across these funds, ranging from flat to positive 0.11%. Fee data showed GBTC at 1.50%, the highest level among listed funds. DEFI Bitcoin ETF followed at 0.90%, while several large funds carried fees near 0.25%. FBTC showed a 0.00% fee, the lowest displayed figure.

Sam Bankman-Fried’s latest attempt to overturn his FTX fraud conviction has been rejected. In a unanimous decision issued by a three-judge appeals panel of the US Court of Appeals for the Second Circuit in Manhattan, the court denied his bid for relief and upheld the conviction and 25-year prison sentence linked to the 2022 collapse of FTX.
According to Reuters, the panel characterized the government’s case as “conservatively stated, robust,” signaling that the appeals court found the original trial record supported the conviction.
Key takeaways
- Bankman-Fried’s appeal was rejected unanimously by a Second Circuit panel, leaving the fraud conviction and 25-year sentence intact.
- The appellate court said the government’s case against him was “robust,” indicating strong support in the trial record.
- The ruling does not end the matter for Bankman-Fried, who is pursuing other legal options including clemency.
- His effort to seek a presidential pardon appears to face uncertainty given prior public statements from President Donald Trump.
A conviction upheld, not reopened
The Second Circuit decision means Bankman-Fried’s conviction for fraud and conspiracy charges tied to FTX’s collapse will stand for now. The appellate court’s ruling did not suggest the case was close or that errors undermined the verdict. Instead, the judges described the prosecution’s evidence as substantial.
In the decision, Circuit Judge Barrington Parker wrote about what the court viewed as the contradiction between Bankman-Fried’s public messaging and the conduct alleged in the case. As reported by Reuters, Parker noted that while Bankman-Fried was publicly reassuring customers, investors, and regulators that FTX customer funds were safe, the government’s narrative portrayed FTX as being used to cover spending tied to Bankman-Fried personally—described as including real estate expenditures, political contributions, and investments.
For investors and crypto market participants who have been tracking the long legal aftermath of the FTX bankruptcy, the appeals ruling underscores how firmly the judiciary has treated aspects of the case. The longer this process runs without reversal, the more difficult it becomes for defendants relying on appellate arguments to change outcomes, even as other avenues remain open.
Clemency replaces appeal as the next path
The appeals court’s rejection shifts the focus to Bankman-Fried’s other legal strategy. Earlier coverage from Cointelegraph said he formally applied for a presidential pardon from Donald Trump. The request appeared on the US Department of Justice Office of the Pardon Attorney website in early June, according to the reporting cited in that article.
Bankman-Fried was sentenced to 25 years in 2024 after being convicted on fraud and conspiracy charges related to FTX’s multibillion-dollar collapse.
While clemency is a different process from appeals—often grounded more in executive discretion than legal error—it remains a meaningful watch point for the broader crypto community. It is also a reminder that even when appeals fail, defendants may still seek relief through political or executive channels.
Why a pardon remains uncertain
Public signals around the clemency effort appear mixed. In an interview with Fox Business, Bankman-Fried said he was “absolutely” seeking a presidential pardon from Donald Trump. However, the strongest obstacle is the president’s prior posture.
Trump told The New York Times in January that he had no plans to pardon Bankman-Fried. Separately, a White House spokesperson declined to comment on the clemency request, Bloomberg reported, referencing the earlier remarks.
Even so, Trump has demonstrated willingness to grant high-profile pardons in the past. One example cited in the reporting is a pardon granted in January 2025 to Ross Ulbricht, the founder of the dark web marketplace Silk Road. Ulbricht had been serving two life sentences plus 40 years before the pardon. Silk Road’s platform used Bitcoin as a primary payment method, which keeps the case relevant to crypto-linked audiences even years after the marketplace was shut down.
For observers trying to interpret Bankman-Fried’s odds, the key tension is straightforward: past statements suggest reluctance, but precedent shows the executive branch can change course depending on the case.
What to watch next
The immediate development is clear—Bankman-Fried cannot undo the conviction through this appeals ruling. The next decisive question is whether his pardon application gains traction, and what any further statements from the White House or the DOJ’s Pardon Attorney process indicate about the likelihood of executive relief.

Trooping the Colour 2026: Princess of Wales and children among royals at King’s birthday celebrations

Motels, marshland and luxury rates: Welcome to the World Cup in New Jersey

Upset ‘Tommeh’ gives Canary’s print edition free advertising


-

 NewsBeat5 days ago
Alexander Zverev wins the French Open to finally earn a 1st Grand Slam title
-
 Entertainment6 days ago
The Best Mystery Series of All Time Is Surging on Streaming 30 Years After It Ended
-

 Crypto World5 days ago
Anatomy of the June crypto crash: Fed, Iran, Saylor
-

 Crypto World2 days ago
Oppenheimer backs SpaceX as $70 billion retail frenzy builds
-

 Crypto World2 days ago
Markets Rally as SpaceX IPO Looms Amid Iran Tensions and Inflation Surge
-
Crypto World7 days ago
Senator Cynthia Lummis Calls CLARITY Act the Most Consequential Financial Legislation of This Generation
-
 NewsBeat6 days ago
Alexander Zverev conquers demons and outlasts Flavio Cobolli to win French Open for first major title
-
 Tech6 days ago
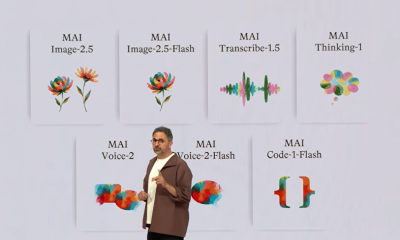
Microsoft unveils seven homegrown AI models in new bid for ‘long term self-sufficiency’
-

 Business5 days ago
High Stakes for Wembanyama as New York Pushes for 3-0 Lead
-

 Tech5 days ago
Notion restores access to Anthropic after service disruption
-
 Business6 days ago
The Pain Points Taking a Fragile Tech Rally Down a Notch
-
 Crypto World5 days ago
Eli Lilly (LLY) Stock Surges 4% Following Breakthrough Sleep Apnea Trial Results
-
 Business6 days ago
The investment to transform historic St Helen’s ground in Swansea
-

 Crypto World6 days ago
Trump’s AI Ownership Plan Could Benefit Anthropic at OpenAI’s Expense
-
 Sports4 days ago
Bangladesh beat Australia after 20 years in ODIs, register only their second win over six-time world champions | Cricket News
-

 Tech9 hours ago
NanoClaw integrates JFrog registries to secure AI agent downloads
-

 Crypto World4 hours ago
Bitget enters Argentina’s regulated crypto market through PSAV registration
-

 Tech20 hours ago
This Week In Security: Microsoft On Microsoft, Register Your Domains, Linux On ARM, And FreeBSD Joins The File Cache Club
-

 Politics2 days ago
Politics Home | Healey Resignation Is “Colossal Failure Of Government”, Says Former Labour Defence Secretary
-

 Sports2 days ago
First Time Since 1971: Australia Register Historic Low In ODI Cricket
You must be logged in to post a comment Login