

Crypto World
Scalping Indicators in Forex and CFD Trading
Scalping indicators are technical tools that signal entries and exits in forex and CFD markets. They are typically applied on 1-minute to 5-minute charts during very short-term trades. These forex scalping indicators process price, momentum, and volatility data into structured readings. They suit conditions defined by tight spreads, fast execution, and small price fluctuations.
Scalpers execute many trades over minutes or seconds, aiming to capture minor price moves in active markets. Technical indicators offer the structured signals needed to support these fast decisions. This article covers the main indicators for scalping and their application to intraday trading.
Common scalping indicators include:
- Exponential Moving Average (EMA): smooths recent prices to indicate trend direction.
- Hull Moving Average (HMA): a faster moving average designed to reduce lag.
- Relative Strength Index (RSI): a momentum oscillator measuring overbought and oversold conditions.
- Bollinger Bands: volatility bands set around a moving average.
- Stochastic Oscillator: measures the closing price relative to a recent trading range to identify momentum.
- MACD: compares two moving averages to identify momentum and trend direction.
Role of Indicators in Short-Term Execution
As you may know, scalping is a trading strategy where traders aim to take advantage of small price movements by executing numerous trades within short timeframes, often closing trades within a few minutes. This approach requires swift decision-making and precise timing.
Technical indicators may be important tools in this context, as they provide real-time data and insights into market trends, momentum, and volatility. Using these indicators, traders can identify optimal entry and exit points, potentially enhancing their ability to navigate the rapid pace of the market.
Below, we’ll break down five indicators for scalping. You’ll find these scalping indicators in MT4 and MT5, and TradingView. Also, you can get started in seconds with FXOpen’s TickTrader trading platform.
Indicators in scalping are typically used for:
- Trend identification: spotting whether price is moving directionally.
- Entry timing: pinpointing moments to act on a setup.
- Volatility assessment: gauging how widely the price is swinging in real time.
Moving Averages

Moving averages (MAs) are considered by some to be the most popular indicator for scalping, smoothing out price data to help identify trends by calculating the average price over a specific period. In scalping, where quick decisions are crucial, certain types of moving averages can be useful.
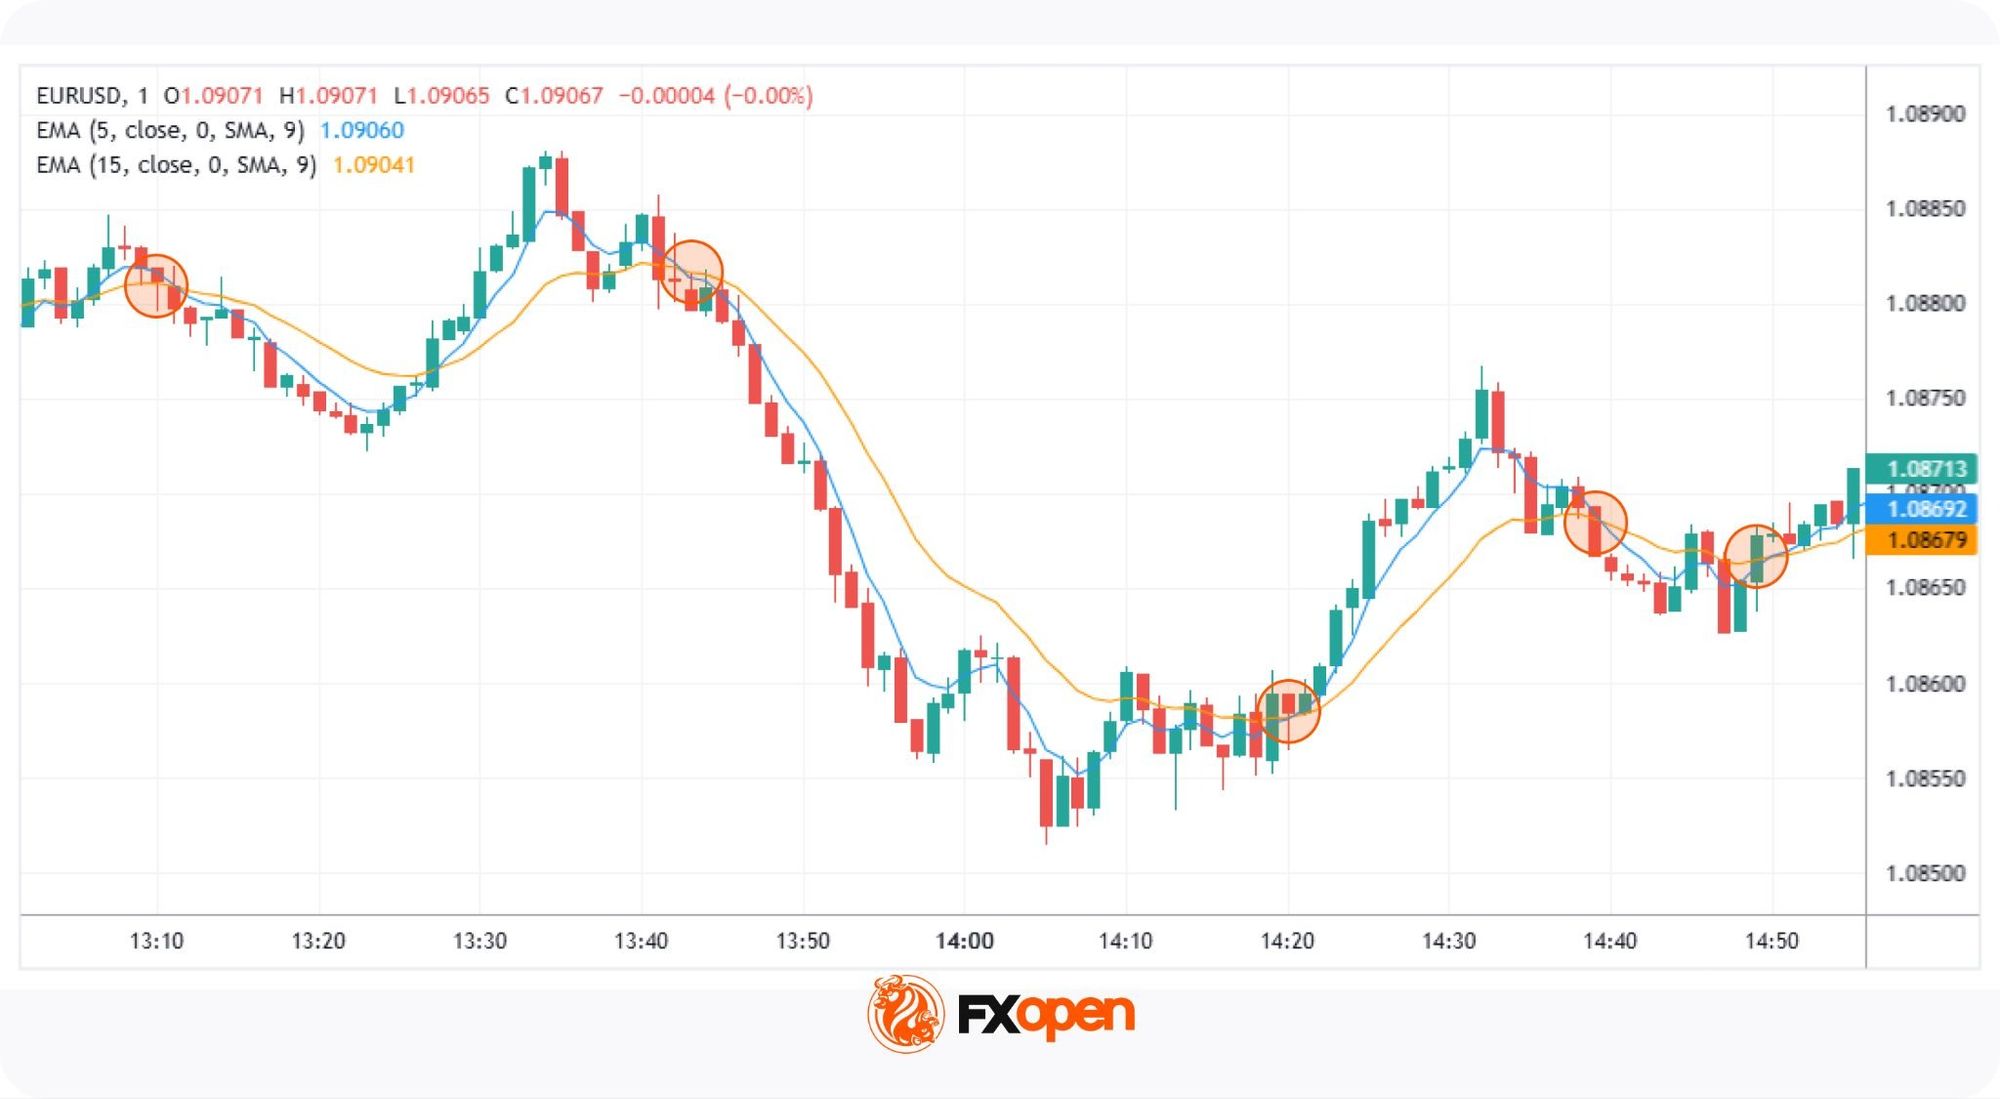
Exponential Moving Average (EMA)
Unlike the Simple Moving Average (SMA), which assigns equal weight to all data points, the EMA gives more significance to recent prices, making it more responsive to current market movements. This responsiveness is advantageous for scalpers.
Common EMA settings for scalping include 5, 9, and 20 periods, depending on chart timeframe. For instance, a 9-period EMA reacts swiftly to recent price changes, potentially providing timely signals for entry and exit points. The EMA for scalping may also act as dynamic support or resistance during trending price action.
Hull Moving Average (HMA)
Developed by Alan Hull, the HMA further reduces lag. It does this by weighting recent prices more heavily and applying a different calculation. The result is a moving average that tracks price action more closely while smoothing noise.
Applying Moving Averages in Scalping
- Crossover Strategy: Scalpers often use two EMAs of different lengths. A common approach involves a fast EMA (e.g., 5-period) and a slow EMA (e.g., 15-period). When the fast EMA crosses above the slow EMA, it may indicate a bullish trend, suggesting an entry point for a buy trade or an exit point for a short trade. Conversely, when the fast EMA crosses below the slow EMA, it may signal a bearish trend, indicating a potential entry for a sell trade or moment to close a long trade.
- Trend Confirmation: The EMA and HMA can be used to confirm trends identified by other indicators. For example, if the moving average is sloping upwards, it may confirm an uptrend, supporting decisions to enter long positions. If it’s sloping downwards, it may confirm a downtrend, supporting decisions to enter short positions.
- Pullbacks: In trending markets, traders often monitor pullbacks to the EMA as potential continuation entries.
You can find these scalping indicators in TradingView and FXOpen’s TickTrader trading platform.
Relative Strength Index (RSI) in Scalping
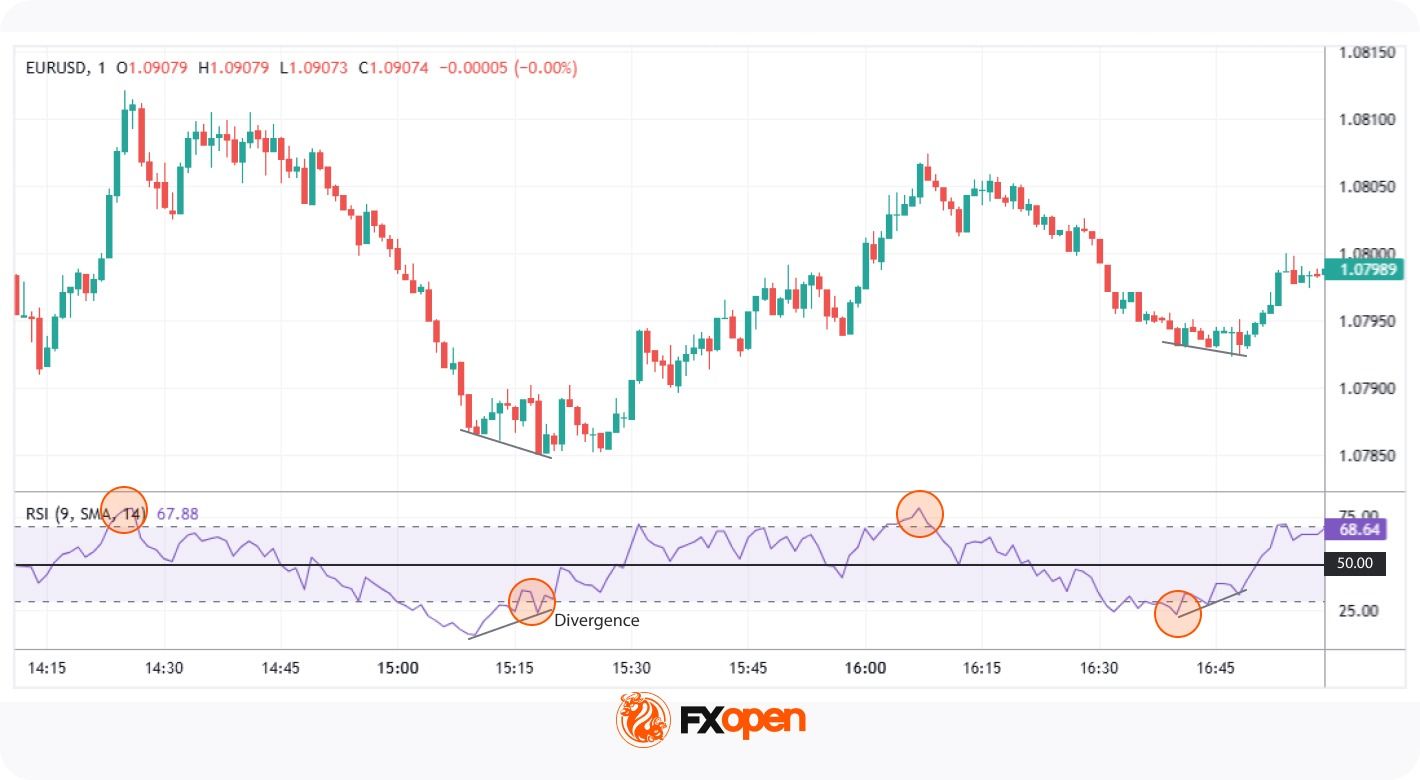
The Relative Strength Index (RSI) is a well-known scalping indicator that measures the speed and change of price movements, oscillating between 0 and 100. Traditionally, an RSI above 70 indicates overbought conditions, while below 30 suggests oversold conditions.
In scalping, traders often adjust the RSI from its typical length of 14 to shorter periods, such as 7 or 9, to capture rapid price swings occurring over minutes. This adjustment makes the RSI more sensitive to recent price changes, providing timely signals for quick trades. Shorter RSI scalping settings between 2 and 6 periods are also commonly used on very fast timeframes.
Applying RSI in Scalping
- Overbought/Oversold Levels: When the RSI moves beyond 70 or drops below 30, traders watch for potential reversal points. However, scalpers may focus on the RSI’s movement back into the 30-70 range as an early sign of momentum shifting.
- Divergences: Scalpers also look for divergence between price movement and the RSI. For example, if the price reaches a new high but the RSI does not, it may signal a weakening trend and possible reversal. This divergence may support traders in anticipating quick market shifts.
- Midpoint (50 Level): The 50 level serves as a midpoint, indicating the balance between gains and losses. An RSI crossing above 50 may suggest bullish momentum, while dropping below 50 can indicate bearish momentum. Scalpers use this midpoint to assess the prevailing market trend.
Bollinger Bands
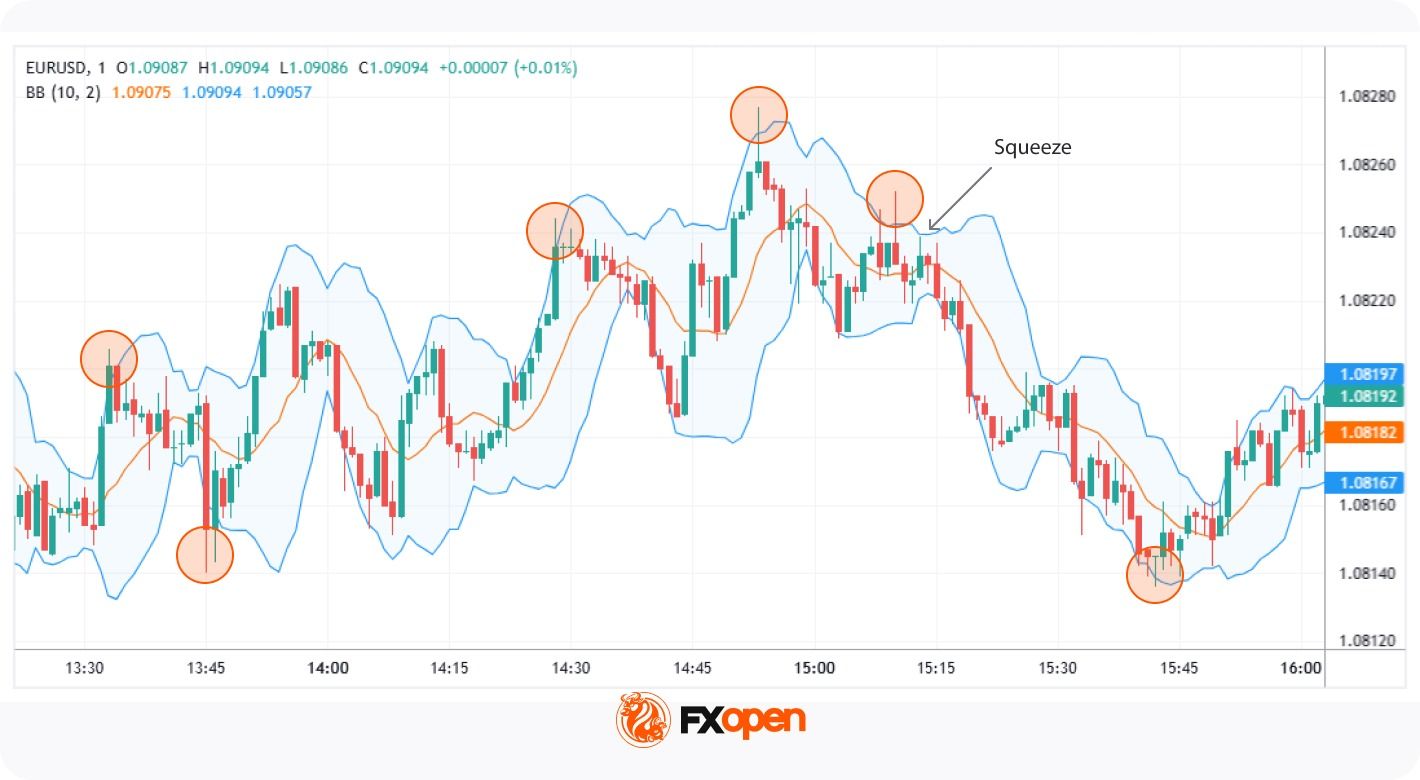
Bollinger Bands are a technical analysis tool comprising three lines: a simple moving average (SMA) in the middle, with upper and lower bands set at a specified number of standard deviations from the SMA. These bands expand and contract based on market volatility, providing a visual representation of price fluctuations. Squeeze conditions, where the bands narrow sharply, often precede expansion and stronger directional moves.
In scalping, traders often adjust Bollinger Bands scalping parameters to shorter timeframes, such as 1-minute or 5-minute charts, to capture quick price movements. A common approach involves setting the SMA period to 7-10 and the standard deviation to 1.5-2, potentially enhancing sensitivity to short-term market changes.
Applying Bollinger Bands in Scalping:
- Bollinger Squeeze: When the bands contract, indicating low volatility, it often precedes significant price movements. Scalpers watch for a breakout above or below the SMA. When the price breaks above the SMA, it may signal that the price will rise, and vice versa.
- Reversal: Price breaching the upper band may suggest overbought conditions, while below the lower band may indicate oversold conditions. Scalpers use these signals to anticipate potential price reversals.
Stochastic Oscillator
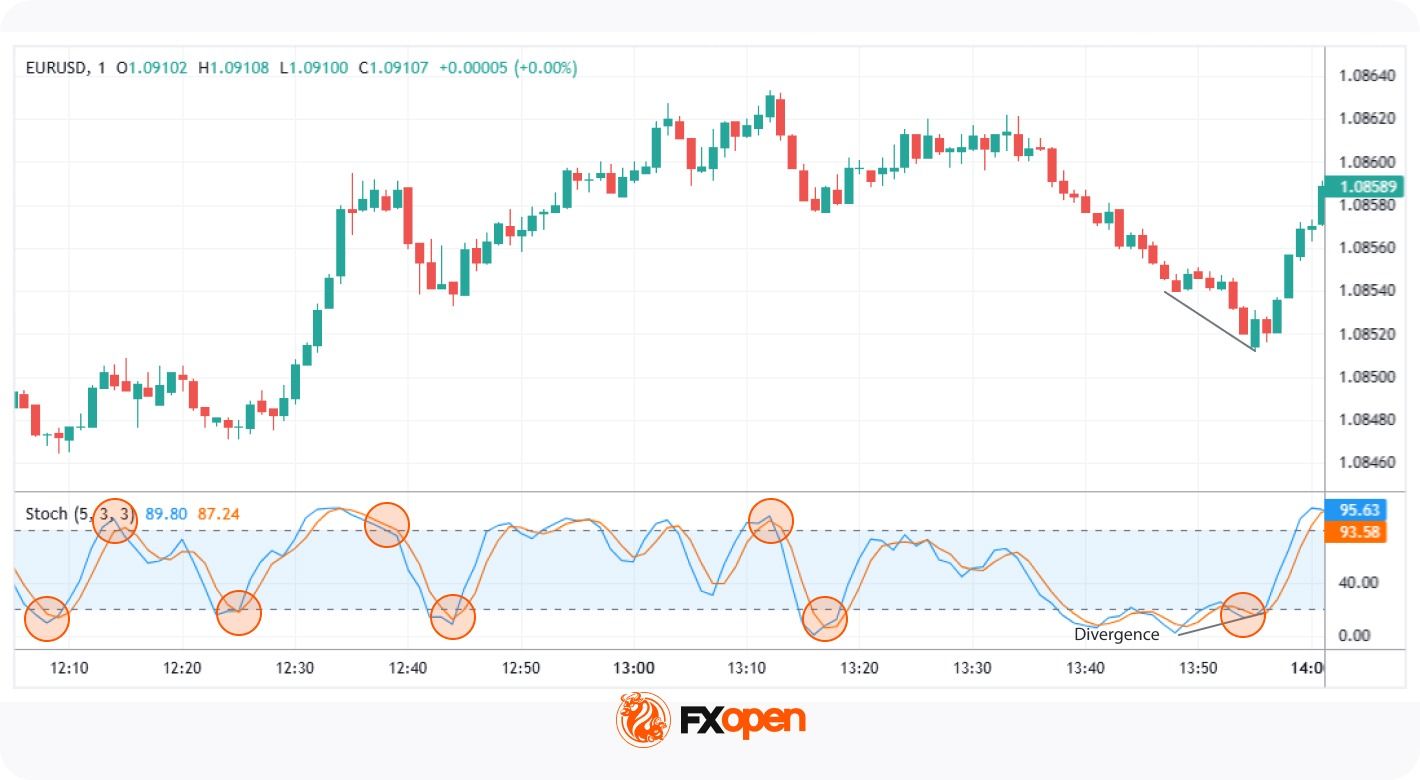
The Stochastic Oscillator is a momentum indicator that compares an asset’s closing price to its price range over a specific period, typically 14. It includes the %K line, the current closing price relative to the range, and the %D line, a moving average of %K. The scale runs from 0 to 100, where readings over 80 suggest overbought levels, and those under 20 point to oversold levels. The Stochastic Oscillator is more popular in range-bound markets than in strong trends.
In scalping, traders may adjust the Stochastic Oscillator to shorter settings, such as 5,3,3, to increase sensitivity to rapid price movements. This adjustment may help in capturing short-term market fluctuations.
Applying the Stochastic Oscillator in Scalping:
- Overbought and Oversold Conditions: When the %K line crosses the %D line in the overbought (above 80) or oversold (below 20) zones, it can signal a potential reversal. Scalpers use these crossovers as quick alerts for shifts in momentum, helping them to act swiftly in volatile markets.
- Crossovers: Besides extreme conditions, traders also monitor crossovers between %K and %D. A %K line crossing above %D from a lower level can suggest an upward move, while a downward crossover may hint at a short-term price decline.
- Divergence: If the price makes a new high/low but the Stochastic Oscillator does not, it may signal a weakening trend, indicating a potential reversal.
Moving Average Convergence Divergence (MACD)
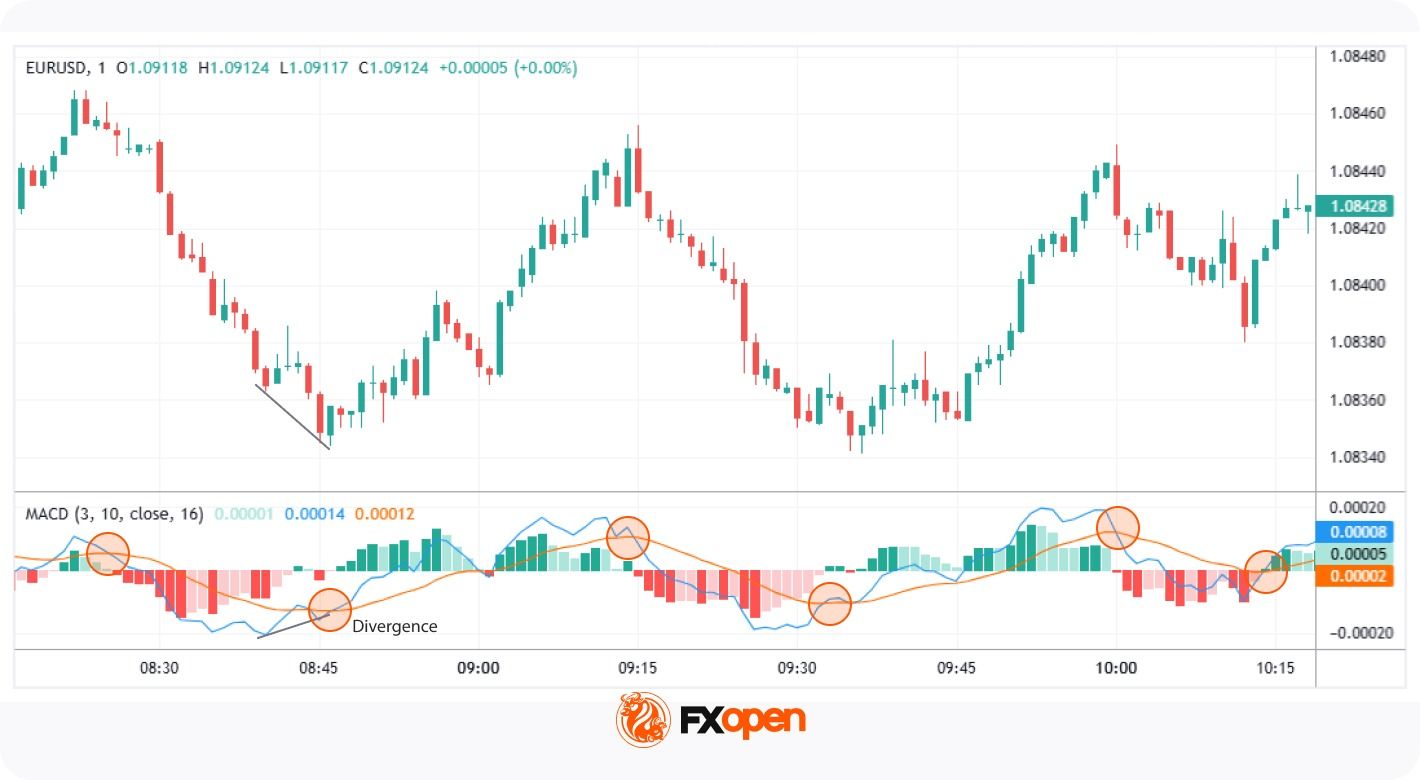
The Moving Average Convergence Divergence (MACD) is a widely used scalping indicator. It’s a momentum indicator that reflects the relationship between two moving averages. It comprises the MACD line (the difference between the 12-period and 26-period exponential moving averages), the signal line (a 9-period EMA of the MACD line), and a histogram, which illustrates the gap between the two lines.
Scalpers prefer to adjust these settings to 3, 10, and 16, respectively, to make the MACD more responsive to rapid price movements.
Applying MACD in Scalping:
- Crossovers: When the MACD line crosses above the signal line, it may indicate bullish momentum; a crossover below suggests bearish momentum. Scalpers monitor these crossovers to identify potential entry and exit points.
- Histogram Analysis: The histogram represents the difference between the MACD and signal lines. Histogram contraction in the MACD scalping indicator may reflect weakening momentum, while expansion tends to indicate momentum building in the prevailing direction. Scalpers use these changes to gauge the intensity of price movements.
- Divergences: A divergence occurs when the price moves in one direction while the MACD line moves in the opposite. For example, if the price reaches a new low but the MACD does not, it may reflect a potential upward reversal. Scalpers watch for such divergences to anticipate shifts in market direction.
Indicator Confluence in Scalping
Confluence refers to combining signals from multiple indicators to potentially filter noise and improve signal reliability. Each indicator offers unique insights, and their combined use may help filter out false signals. Here are some pairings:
- EMA + RSI → trend direction plus momentum confirmation: Utilising the Exponential Moving Average to identify trend direction alongside the Relative Strength Index to gauge momentum may help traders confirm the strength of a trend before making decisions. For instance, if the EMA indicates an uptrend and the RSI is above 50, it may suggest strong bullish momentum.
- Bollinger Bands + Stochastic → volatility plus reversal signals: Bollinger Bands measure volatility, while the Stochastic Oscillator identifies overbought or oversold conditions. When prices touch the upper or lower bands and the Stochastic Oscillator reflects overbought or oversold conditions, it may indicate potential reversal points.
- MACD + RSI → momentum confirmation across two indicators: The Moving Average Convergence Divergence (MACD) highlights momentum changes, and the RSI indicates overbought and oversold conditions. Using them together can support traders in confirming potential entry or exit points. For example, if the MACD shows bullish momentum and the RSI is rising but not yet overbought, it may signal the price will rise.
Indicator Settings Commonly Used in Scalping
The table below summarises typical scalping configurations for each indicator covered above. These are the settings traders most often apply on these indicators for 1-minute trading and 5-minute trading.
Market Conditions and Indicator Behaviour
Indicator readings shift in reliability depending on the underlying market environment. No single tool performs identically across trend, range, and low-volatility conditions.
In trending markets, the EMA and momentum indicators such as MACD tend to dominate. Trend-following signals carry more weight when price moves directionally with sustained pressure.
In range-bound markets, oscillators become more relevant. The Stochastic Oscillator and RSI often produce cleaner reversal signals when price oscillates between defined support and resistance levels. Moving average crossovers may generate frequent false signals in these conditions.
Under low-volatility conditions, signals across all indicator types weaken. Bollinger Bands contract, momentum readings flatten, and crossovers lose meaning. Traders often wait for volatility expansion before acting on indicator-based setups.
Limitations of Indicators in Scalping
Scalping with indicators offers valuable insights, but there are some challenges traders should be aware of:
- False Signals: Rapid market movements can trigger misleading signals, causing traders to act prematurely.
- Overtrading: Relying too heavily on short-term indicators can lead to excessive trades, increasing transaction costs.
- Market Noise: High volatility and frequent price fluctuations can make it difficult to distinguish genuine trends from random market “noise.”
- Lagging Indicators: Some indicators may react too slowly, causing traders to miss potential trades.
- Tuning: Tuning indicators may be necessary to optimise performance. Academic research has tested indicators such as MACD and RSI across multiple developed markets, with results varying by index, period, and parameter settings.
Key Takeaways on Scalping Indicators
Scalping relies on precise and timely decisions, which is why technical indicators play an important role in this trading style. Tools such as moving averages and oscillators provide structured signals that may support traders in navigating fast market movements. The choice of indicators varies depending on individual trading preferences, market conditions, and timeframes.
If you want to test the above-mentioned indicators or find something new for yourself, you can open an FXOpen account to access over 700 markets and trade with tight spreads from 0.0 pips.
FAQ
What Indicators Are Used for Scalping?
Common scalping indicators include the Exponential Moving Average (EMA), Relative Strength Index (RSI), Bollinger Bands, Stochastic Oscillator, and Moving Average Convergence Divergence (MACD). The Hull Moving Average is also used by some traders. Each tool serves a different function across trend identification, momentum measurement, and volatility assessment on short-term charts.
What EMA Settings Are Used in Scalping?
Common EMA settings for scalping include 5, 9, and 20 periods on 1-minute and 5-minute charts. Traders often pair a fast EMA, such as 5 or 9, with a slower EMA, such as 15 or 20, to monitor crossovers. Shorter periods react faster but may produce more false signals.
Can RSI Be Used for Short-Term Trading?
Yes, the RSI is popular among short-term trading indicators. Scalpers typically reduce the RSI period from the standard 14 to between 2 and 7 to capture rapid price swings. Traders watch for crosses above 70 or below 30, divergences with price, and movement around the 50 midpoint.
How Do Bollinger Bands Work in Scalping?
In scalping, traders often use a 7 to 10 period SMA with 1.5 to 2 standard deviations. Squeeze conditions may precede breakouts, while band touches may indicate reversal zones.
Do Indicators Behave Differently in Trending and Ranging Markets?
Yes, indicator reliability shifts with market conditions. In trends, momentum indicators such as MACD and EMAs tend to perform more consistently. In ranges, oscillators such as RSI and Stochastic produce cleaner reversal signals. Under low volatility, signals across all indicator types tend to weaken.
What Is the 1-Minute Scalp Strategy?
The 1-minute scalp strategy involves making rapid trades on a 1-minute chart. Traders look for small price movements and enter multiple trades within a short period, often using scalp trading indicators like the EMA or RSI for quick signals.
What Is the 5-Minute Scalping Strategy?
The 5-minute scalping strategy focuses on capturing short-term price movements on a 5-minute chart. Traders typically combine trend and momentum indicators, like the MACD and Bollinger Bands, to make fast, informed decisions.
Are There Good Stocks for Scalping?
The choice depends on the trader’s risk tolerance, trading approach, experience, and toolkit. However, according to theory, stocks with high liquidity, tight spreads, and significant daily volume are good for scalping. Popular choices include tech giants like Apple (AAPL) and Tesla (TSLA), as they offer frequent price fluctuations. But at the same time, they bear higher risks.
This article represents the opinion of the Companies operating under the FXOpen brand only. It is not to be construed as an offer, solicitation, or recommendation with respect to products and services provided by the Companies operating under the FXOpen brand, nor is it to be considered financial advice.

Crypto World
BOJ Rate Decision Looms: What Japan’s Corporate Funding Crisis Means for Crypto Markets

Key Takeaways
-
Corporate credit concerns push BOJ toward potential June rate adjustment amid market uncertainty
-
Yen carry trade dynamics threaten Bitcoin stability as Japan considers monetary policy shift
-
XRP traders monitor Japanese credit market developments ahead of central bank announcement
-
Rising energy expenses and sluggish economic expansion challenge BOJ’s rate decision timeline
-
Central bank’s inflation projections heighten concerns over cryptocurrency liquidity and yen-based trades
The Bank of Japan’s upcoming policy decision extends beyond simple inflation management, as corporate financing vulnerabilities now dominate central bank considerations. A governmental advisory committee has pushed the monetary authority to evaluate credit market health before implementing any policy adjustments. This recommendation intensifies scrutiny ahead of the June 16 Tokyo policy announcement, particularly as energy sector pressures mount.
Business representatives on the economic and fiscal strategy council delivered their recommendations Monday via Cabinet Office documentation. They requested the BOJ monitor both funding availability and pricing dynamics in financial markets simultaneously. The group emphasized that resource scarcity and escalating costs could strain borrowing requirements for small and medium enterprises throughout the country.
This guidance arrives after last month’s split decision by central bank leadership, which maintained existing policy parameters. The 6-3 voting outcome revealed growing support among policymakers for another rate adjustment. Market-based swap contracts currently indicate a 75% probability of a June increase at the upcoming meeting.
Yen Carry Trade Mechanics Threaten Bitcoin Positions
Cryptocurrency market participants face direct exposure to Japan’s monetary trajectory through yen-denominated carry strategies. Market operators secure low-cost yen financing and redirect capital toward higher-yielding opportunities during stable policy environments. Japanese rate increases can trigger forced liquidations across Bitcoin and alternative digital assets.
The central bank elevated its core inflation projection to 2.8% for the present fiscal period. Simultaneously, officials reduced growth expectations to 0.5%, signaling economic weakness. This contrasting data complicates decision-making before the June gathering.
Bitcoin has profited from extended periods of inexpensive yen financing throughout international markets during accommodative financial conditions. However, any abrupt BOJ policy reversal could dismantle leveraged holdings and deplete market liquidity. Consequently, digital asset traders stand ready to respond swiftly to firmer rate indications from Japanese authorities.
Energy Pressures and Credit Vulnerabilities Impact XRP Outlook
XRP exists within the wider asset universe vulnerable to yen carry trade adjustments. Historical Japanese rate modifications have prompted rapid position reductions across prominent cryptocurrency tokens. XRP may experience downward pressure should traders decrease leverage exposure before the central bank’s determination.
The advisory group connected corporate financial strain to Middle Eastern geopolitical tensions and elevated crude oil valuations. Climbing energy expenditures can damage Japanese corporate profitability and amplify default probabilities, particularly among financially weaker entities. Additionally, Tokyo authorities have broadened subsidized loan program availability for struggling enterprises since April.
The BOJ Financial System Report highlighted vulnerabilities in shadow banking sectors and potential contagion from international conflicts. The IMF emphasized the necessity for transparent policy messaging given Japan‘s substantial sovereign debt burden and elevated debt servicing vulnerability. As a result, cryptocurrency market participants currently evaluate BOJ communications alongside inflation trajectories, energy market developments, corporate financing pressures, and worldwide liquidity dynamics.


Disclosure: The author of this story owns shares in Strategy (MSTR).
Michael Saylor, the executive chairman of Strategy (MSTR), the largest publicly traded corporate holder of bitcoin , announced Monday on X the purchase of 535 bitcoin for roughly $43 million at an average price of about $80,340 per coin
The purchases bring the company’s total holdings to 818,869 BTC, acquired for $61.86 billion at an average cost basis of $75,540. With bitcoin currently trading above $81,000, Strategy’s stash is currently in profit.
Last week’s purchases were funded by $42.9 million raised through sales of the company’s preferred stock, according to a May 11 SEC filing.
This purchase follows Strategy’s first-quarter earnings call, where the company said it was prepared to sell bitcoin to repay convertible debt or fund dividend obligations, provided the move remains accretive on a bitcoin-per-share basis.
MSTR shares rose more than 1% in pre-market trading.
Two Trump-branded ventures aimed at retail buyers are both in difficult positions months after their debuts, though for different reasons.
Roughly 600,000 buyers have paid $100 deposits for the gold-colored Trump Mobile T1 phone since its initial announcement, putting around $60 million into a venture that has not delivered a single confirmed device as of May 2026, per Moneywise.
Deposits were paid to Trump Mobile’s registered company T1 Mobile LLC, which uses a limited liability agreement from DTTM Operations, LLC – the company that manages intellectual property, trademarks, and likeness on merchandise associated to U.S. president Donald Trump.
Wow those Gold Trump phones that 590,000 people paid a $100 deposit on still haven’t been delivered after told they would be by September so NBC who bought one tried to call the Company & there’s no phone number only a email.They asked if they could get a refund & were told NO!😂 pic.twitter.com/EucWcjyorm
— Suzie rizzio (@Suzierizzo1) November 26, 2025
Promised delivery dates have slipped from late summer 2025 to November, then to December, and finally to first-quarter 2026, before being removed from the website entirely.
According to IBTimes reporting, the company updated its terms of service in April to clarify that deposits represent a “conditional opportunity” to buy the device if the company chooses to sell it, removing any binding contract. (CoinDesk has not independently reviewed the previous version of the terms.)
Trump Mobile did not respond to a request for comment send by email as of publication time.
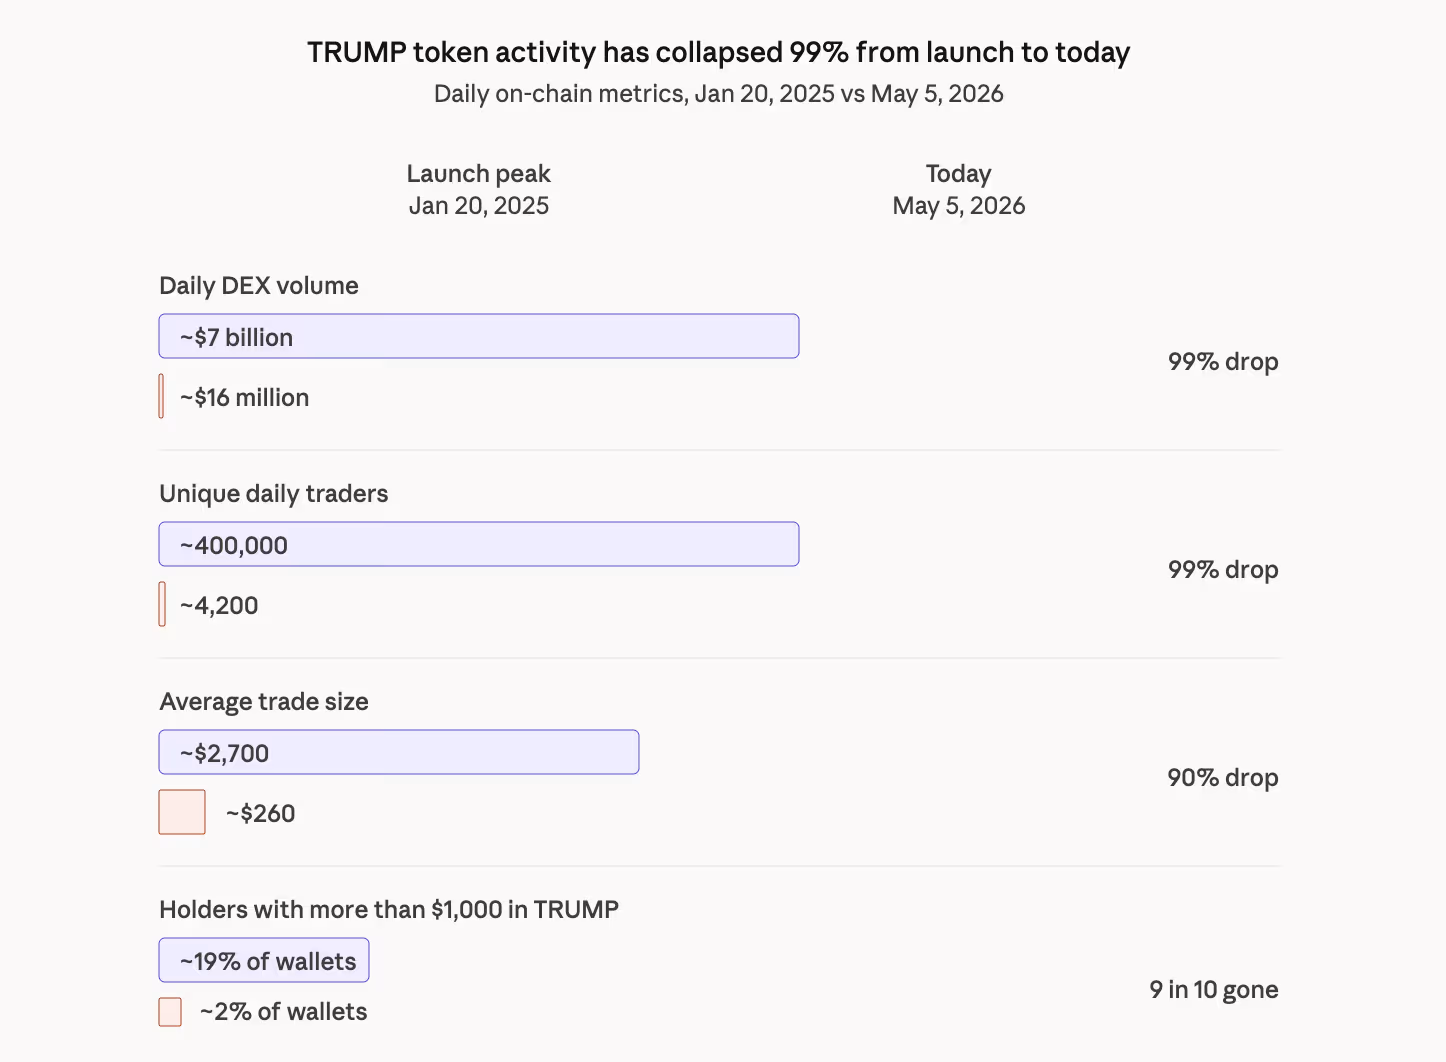
The TRUMP memecoin, a separately structured venture, has had its own difficult run. The token launched in January 2025 at $1.21, zoomed to $73 within 48 hours as retail speculators piled in around the inauguration, and has spent the 16 months since grinding lower.
TRUMP traded at $2.45 on Monday, down roughly 97% from its peak and 82% on the year, CoinGecko data show. Chainalysis estimated retail investors in TRUMP have collectively lost roughly $2 billion since its introduction.
TRUMP launched with 80% of supply held by Trump-affiliated entities CIC Digital and Fight Fight Fight, with those tokens scheduled to unlock at approximately $500,000 worth per day (at current prices) through mid-2028. The schedule was disclosed as part of the token’s launch terms, but has produced sustained sell-side supply during a period of declining buyer interest.
TRUMP’s daily DEX trading volume has dropped from a January 20, 2025 peak of nearly $7 billion across roughly 400,000 traders to about $16 million across just 4,200 traders on May 5, 2026, per Dune Analytics data tracked by user @seoul.
That is a 99% drop in both daily turnover and unique daily participants. Average trade size has fallen from around $2,700 to $260 over the same period, suggesting the remaining buyers are smaller retail accounts rather than the larger speculators who drove the original launch.
The share of TRUMP holders with more than $1,000 in the token has collapsed from roughly 19% at launch to about 2% today, meaning almost every remaining wallet now holds less than $1,000 worth of TRUMP. The token has effectively settled into a long tail of small bag-holders with no large position holders left to drive meaningful price action.

For TRUMP holders, the onchain math suggests that a return to launch-era valuations is becoming increasingly unlikely. At current prices, the remaining insider token unlocks represent more than $2.5 billion in potential supply overhang.
Absorbing that supply would require a demand event larger than anything the token has seen since launch, with the token down 13.6% over the past 30 days and roughly 0.1% on the day.
A dinner hosted by Trump for the top 220 token holders at his Virginia golf club in May 2025 produced a rally that faded within weeks. Tron founder Justin Sun pledged $100 million in TRUMP purchases ahead of the July 2025 unlock, with the token continuing to drift lower in the months that followed.
A separate Mar-a-Lago Crypto & Business Conference on April 25, 2026, limited to the top 297 TRUMP token holders with VIP access for the top 29, drew a letter from Senators Warren, Adam Schiff (Democrat, California), and Richard Blumenthal (Democrat, Connecticut) requesting documents about the President’s role in promoting the event.
While Trump tokens and the mobile ventures have different structures and mechanisms, they debuted on the back of front-loaded political enthusiasm, and have struggled in the months since to translate that initial momentum into either delivered product or sustained price support.


Ripple’s prime-brokerage unit has secured up to $200 million in financing from Neuberger Berman to expand margin services for institutional investors.
Summary
- Ripple Prime can draw up to $200 million based on institutional client borrowing demand across markets.
- The Neuberger facility supports margin trading across crypto, equities, fixed income, and foreign exchange.
- The deal follows Ripple’s Hidden Road acquisition and wider push into institutional brokerage services.
The facility was arranged through Neuberger Berman’s specialty finance group, according to Bloomberg.
The funding is designed to support trading across traditional and digital markets. Ripple Prime can draw on the facility based on client borrowing demand across equities, fixed income, foreign exchange, and crypto assets.
Meanwhile, Prime brokers provide financing, custody, clearing, and trading support to large clients. In this case, Ripple Prime plans to use the debt facility to increase the margin it can offer investors trading across multiple asset classes.
Ripple Prime President Noel Kimmel said, “The future of prime finance is supporting all major asset classes through a single structure and credit line.” That remains Ripple Prime’s position, while the actual use of the facility will depend on client demand and market conditions.
Hidden Road deal set up Ripple Prime
The move follows Ripple’s $1.25 billion acquisition of Hidden Road, which closed in October 2025. After the deal closed, Ripple renamed the multi-asset prime brokerage business Ripple Prime.
That transaction gave Ripple a larger role in institutional trading. Hidden Road already served clients across digital assets, foreign exchange, derivatives, and fixed income before becoming part of Ripple’s wider finance stack.
Moreover, Ripple has also moved Ripple Prime deeper into U.S. digital asset trading. In November 2025, the company launched digital asset spot prime brokerage for U.S. institutional clients, including over-the-counter spot access for XRP and RLUSD.
The institutional push continued in April, when Ripple Prime connected clients to Bullish’s regulated Bitcoin options market. That deal gave clients direct access to a crypto-settled BTC options venue while Ripple and OKX also worked to expand RLUSD access in compliant markets.
Credit line adds to Wall Street strategy
The Neuberger Berman facility gives Ripple Prime more capacity at a time when crypto firms are trying to serve institutional investors with products that resemble traditional finance. The structure also links credit, margin, and multi-asset trading under one brokerage platform.
Ripple’s wider expansion has included custody, treasury, stablecoin, and wallet infrastructure. In November 2025, the company acquired Palisade, adding another institutional custody and wallet business to a year of dealmaking.
Crypto World
Bitcoin Price Prediction: Bitcoin Is Coiling Below $83,000: Can CME’s New Volatility Futures Push BTC to $85,000 This Week?
Bitcoin price is clinging to the $81,000 zone right now, but the chart whispers a far more dramatic prediction than that flat headline suggests.
BTC has already slipped roughly 2% from its recent multi-month peak above $82,800, and the big question is whether this tight consolidation will hold—or if stretched oscillators will drag it into a sharper unwind.
One level towers over the entire setup: the $83K mark, home to the 200-day simple moving average that bulls must reclaim to reignite momentum. Fresh institutional infrastructure is arriving fast.
CME Group recently announced Bitcoin Volatility futures, set to launch June 1 (pending regulatory approval).
This marks a game-changing shift, letting big players hedge or speculate on BTC swings without touching the spot market itself, pure volatility exposure in a regulated wrapper.
ETF flows paint a nuanced picture of conviction mixed with caution. Morgan Stanley’s Bitcoin Trust has shown strong early traction with solid inflows since its debut, while Grayscale’s vehicle has posted net positives in recent sessions.

Yet selective profit-taking persists—BlackRock’s IBIT and Fidelity’s FBTC have seen mixed action, with some days of outflows (e.g., around May 8) amid broader choppiness, even as the complex logged strong multi-week inflow streaks earlier in May totaling billions.
Corporate buying marches on undeterred. Strategy (formerly MicroStrategy) continues its legendary accumulation, now holding over 818,000 BTC, close to 4% of total supply, with relentless quarterly additions that dwarf many ETF flows.
Public company Bitcoin treasuries keep climbing overall, underscoring a structural bid from balance sheets even as retail and some institutions rotate.
Macro crosswinds add spice. Lingering US-Iran tensions and stalled peace talks have injected risk-off vibes, propping up oil while keeping Bitcoin range-bound despite the building institutional scaffolding beneath it.
The next big directional cue will likely come from a decisive weekly close outside this consolidation zon, either breaking higher on fresh catalysts or testing lower supports if geopolitics or profit-taking intensify.
The setup is tense but loaded with potential: technical hurdles at $83K, volatility tools on the horizon, selective ETF appetite, and corporate giants still stacking. Bitcoin isn’t just holding ground, it’s coiling.
Bitcoin Price Prediction: Can BTC Price Hit $85,000 This Week?
Bitcoin is trading at $80,849, sitting above its SMA-20 at $78,658 and SMA-50 at $73,922. The structure is technically constructive but pinned below the SMA-200 at $82,755, which has capped every rally attempt this week.
The 24-hour range has been tight between $80,525 and $82,303. Daily volume at $18.3 billion shows engagement but not the explosive buying pressure that typically precedes breakouts.
Momentum is mixed. MACD and ADX lean bullish on the daily chart, but oscillators are flashing caution. RSI at 68, Stoch RSI at 94, and CCI at 140 are all approaching or inside overbought territory.
Sporadic lower-timeframe selling has already appeared.
One level defines everything right now. The SMA-200 at $82,755.
Clear it on a daily close, and the path toward $85,000 opens up, with CoinCodex projecting further upside toward $92,800 in an extended range.
Fail to break it, and Bitcoin grinds sideways between $77,000 and $82,755 as overbought conditions normalize. Polymarket currently assigns 60% odds to BTC trading in the $80,000 to $82,000 band near-term.
Lose $78,000 to $78,500, near the Ichimoku Kijun at $78,079, and selling accelerates as oscillators unwind. Key supports stack at $79,700 and $79,300. The 5-day probability of a meaningful upward move from that level is assessed at less than 20%.
Longer-term targets of $120,000 remain in play for analysts focused on macro tailwinds. But the near-term picture demands patience. A close above $82,755 changes everything. A break below $78,000 confirms the retracement.
The post Bitcoin Price Prediction: Bitcoin Is Coiling Below $83,000: Can CME’s New Volatility Futures Push BTC to $85,000 This Week? appeared first on Cryptonews.
XRP price is trading at $1.46, up 2% in 24 hours, and quietly outpacing both Bitcoin and Ethereum on a relative basis. The move builds on a breakout through $1.43 resistance that held traders hostage for weeks, and the volume behind it was anything but big.
The breakout accelerated yesterday when volume surged above $3.6 billion and forced the price through the $1.43 ceiling. XRP briefly tagged $1.50 before profit-taking pulled it back toward $1.45.
Meanwhile, network activity and institutional adoption metrics have been accelerating in parallel, adding structural weight to the technical setup.
Bitcoin sits at $81,000, and Ethereum is stalling at $2,330. Both are consolidating, and both also need triple-digit percentage gains to reach analyst targets.
Discover: The best crypto to diversify your portfolio with
Can XRP Price Hit $2 Short-Term, and Is $10 A Realistic Target?
XRP is holding above the prior breakout zone at $1.44–$1.45, which has flipped from resistance to support. As long as the price stays above it, the bullish thesis remains intact. Immediate resistance sits at $1.50, where sellers returned aggressively after the session high. A sustained close above $1.50 reopens momentum toward $1.60 first, then the $1.80 zone.
The scenario map breaks down cleanly. If XRP absorbs the $1.50 rejection, it could consolidate in a tight range to reclaim $1.50 on volume, which targets $1.80 and eventually $2.35 resistance. In this scenario, a breakout at that level points toward $3–$5.
We place the $10 trajectory in the context of XRP’s 580% surge from $0.50 to $3.40 between late 2024 and January 2025, a move that established the asset’s capacity for violent repricing. The $10 target is not fringe. A trader consensus is building around $10 before 2026 closes, citing regulatory clarity post-SEC settlement, RippleNet expansion, and Ripple Payments adoption by firms including Rakuten.
Discover: The best pre-launch token sales
LiquidChain Presale Approaches $750K as Cross-Chain Infrastructure Gains Attention
XRP’s outperformance reflects a market rotation into assets with clear utility narratives and institutional catalysts. But now, already more than 200% above its 2024 pre-surge levels, the asymmetric upside available to late entrants is structurally compressed compared to what early holders captured. That gap is driving renewed interest in early-stage infrastructure plays where price discovery has barely begun.
LiquidChain is one project attracting that attention. Positioned as a Layer 3 cross-chain infrastructure layer, it fuses Bitcoin, Ethereum, and Solana liquidity into a single execution environment. It is here, solving the fragmentation problem that forces traders and developers to manage separate positions across disconnected ecosystems.
The final layer emerges. — LiquidChain (@getliquidchain) May 10, 2026
LiquidChain is the future.  ⟁https://t.co/vqvBcdSQYC pic.twitter.com/gAhIyFxdXV
The presale is currently priced at $0.01458 per $LIQUID token, with $750K raised to date, and 1470% APY staking bonus. Key architecture features include a Unified Liquidity Layer, Single-Step Execution, Verifiable Settlement, and a Deploy-Once Architecture that lets developers access BTC, ETH, and SOL ecosystems without redeployment overhead.
Explore LiquidChain’s presale details here.
The post XRP Price Outperforms ETH and BTC: $2 Next Target as Ripple Token Eyes $10 appeared first on Cryptonews.

Strategy CEO Phong Le believes there is more to the company than the Bitcoin (BTC) on its balance sheet. Le stressed that the company’s enterprise business model remains a key part of operations after it posted its strongest financial quarter in a decade.
Enterprise Software Remains a Core Part
Le believes that its enterprise software business remains a crucial part of the company’s long-term plans. The software business serves over 3,000 customers and 500,000 active users, along with Fortune 500 companies, leading banks, healthcare companies, retailers, and government agencies.
According to Le, the software side of Strategy’s business, comprising engineers, enterprise customers, cloud teams, compliance systems, and global operations, gives the company an edge over other digital asset firms. However, Le’s arguments can only hold if the software side of Strategy’s business continues growing while competing with its Bitcoin strategy for investor attention.
Record Financial Quarter
Le highlighted Strategy’s stellar Q1 2026 performance to back his argument. The Bitcoin treasury company reported $124.3 million in total Q1 2026 revenue, up 12% from $111.1 million a year earlier. Strategy also reported $83.4 million in gross profit with a 67.1% gross margin. Le stated that Q1 2026 was the company’s strongest quarter in over a decade, supported by a 12% revenue growth and a 59% growth in cloud revenue. Controllable margin increased by 27%, helping Strategy fund its Bitcoin operations.
Bitcoin Strategy Under Scrutiny
Strategy’s Bitcoin strategy has come under intense scrutiny in recent months as debt and losses mount. The company reported a $12.54 billion net loss, significantly higher than the $4.22 billion loss in the same period last year. Strategy raised over $25 billion in 2025 to fund its Bitcoin operations. Strategy co-founder Michael Saylor recently said during an earnings call that the company could strategically sell some of its Bitcoin holdings to fund dividend obligations. Saylor’s comments have worried investors about the impact of such a move on the asset’s price.
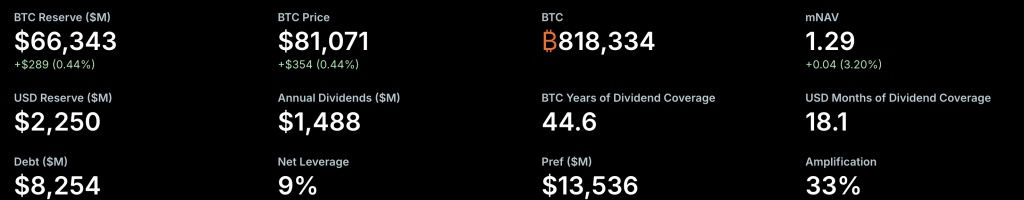
Le sought to calm market jitters, clarifying that the company will sell BTC only in specific cases, adding that it will sell a small portion of its holdings to pay dividends on its Series A Perpetual Stretch Preferred Stock (STRC) and to offset taxes. The STRC pays 11.5% dividend to holders. Strategy currently holds 818,334 BTC, valued at around $66 billion.
Disclaimer: This article is provided for informational purposes only. It is not offered or intended to be used as legal, tax, investment, financial, or other advice.
Crypto World
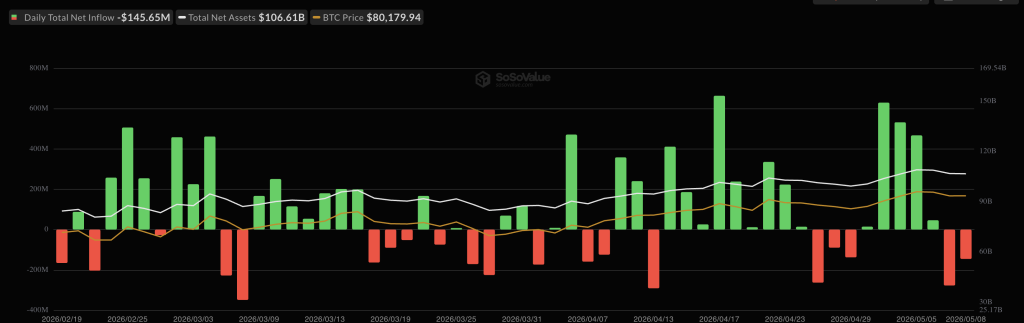
Bitcoin (BTC) funds capture $700 million as institutions place their bets: Crypto Daily
This is an excerpt from CoinDesk newsletter ‘Daybook.’ Sign up here, if you haven’t already.
Institutional demand for crypto is real, and suggests there may be a sustained bitcoin price move above its pivotal 200-day simple moving average (SMA).
Investors poured $858 million into crypto funds issued by asset managers like BlackRock and 21Shares last week, extending a five-week inflow streak and marking the strongest weekly total since late April, according to CoinShares.
More importantly, bitcoin funds alone pulled in over $700 million, taking year-to-date flows to $4.9 billion. Talk about the demand for the leading cryptocurrency. The catalyst? Improving sentiment around the Clarity Act, according to CoinShares’ head of research, James Butterfill.
Bitcoin recently traded at $81,000, having narrowly missed the 200-day SMA positioned above $82,000 late Sunday. That’s the second such near miss since last week. Prices remain above $80,000, indicating that bulls are simply taking a breather, not retreating.
Analysts say the next big leg higher could unfold once prices top $82,000, effectively rising above the 200-day SMA, which is largely seen as a barometer of long-term trends.
“The clean next step is a daily close above $82,000 with steady spot demand. Without that, it can chop between $79,000 and $82,000 while macro sets the tone,” analysts at Marex said.
On the downside, immediate support is seen around $80,400, and the broader demand zone remains between $78,200 and $78,600., according to Vikram Subburaj, CEO of India-based Giottus.com, said in an email.
In the broader market, Sui blockchain’s SUI has surged 12% to $1.26 in 24 hours. The rally comes as developers behind the blockchain look to foray into privacy. Adeniyi Abiodun, co-founder and chief product officer of Mysten Labs, the development team behind Sui, posted on X that confidential transactions on Sui will be introduced this year, enabling fee-free privacy-preserving payments at scale.
Last week, Nasdaq-listed Sui Group Holdings (SUIG) said that it had staked most of the $108.7 million worth of SUI tokens in its treasury, removing roughly 2.7% of supply from the active market. That likely greased the bullish momentum.
The other major gainer is XDC Network’s XDC token, which climbed over 10%. Several other tokens, such as KAS, HASH and ATOM , have gained 5% or more in 24 hours.
In traditional markets, U.S. Treasury yields rose as dimming hopes of U.S.-Iran peace deal kept oil prices elevated. Stay alert!
Read more: For analysis of today’s activity in altcoins and derivatives, see Crypto Markets Today . For a comprehensive list of events this week, see CoinDesk’s “Crypto Week Ahead.”
What’s trending
Today’s signal

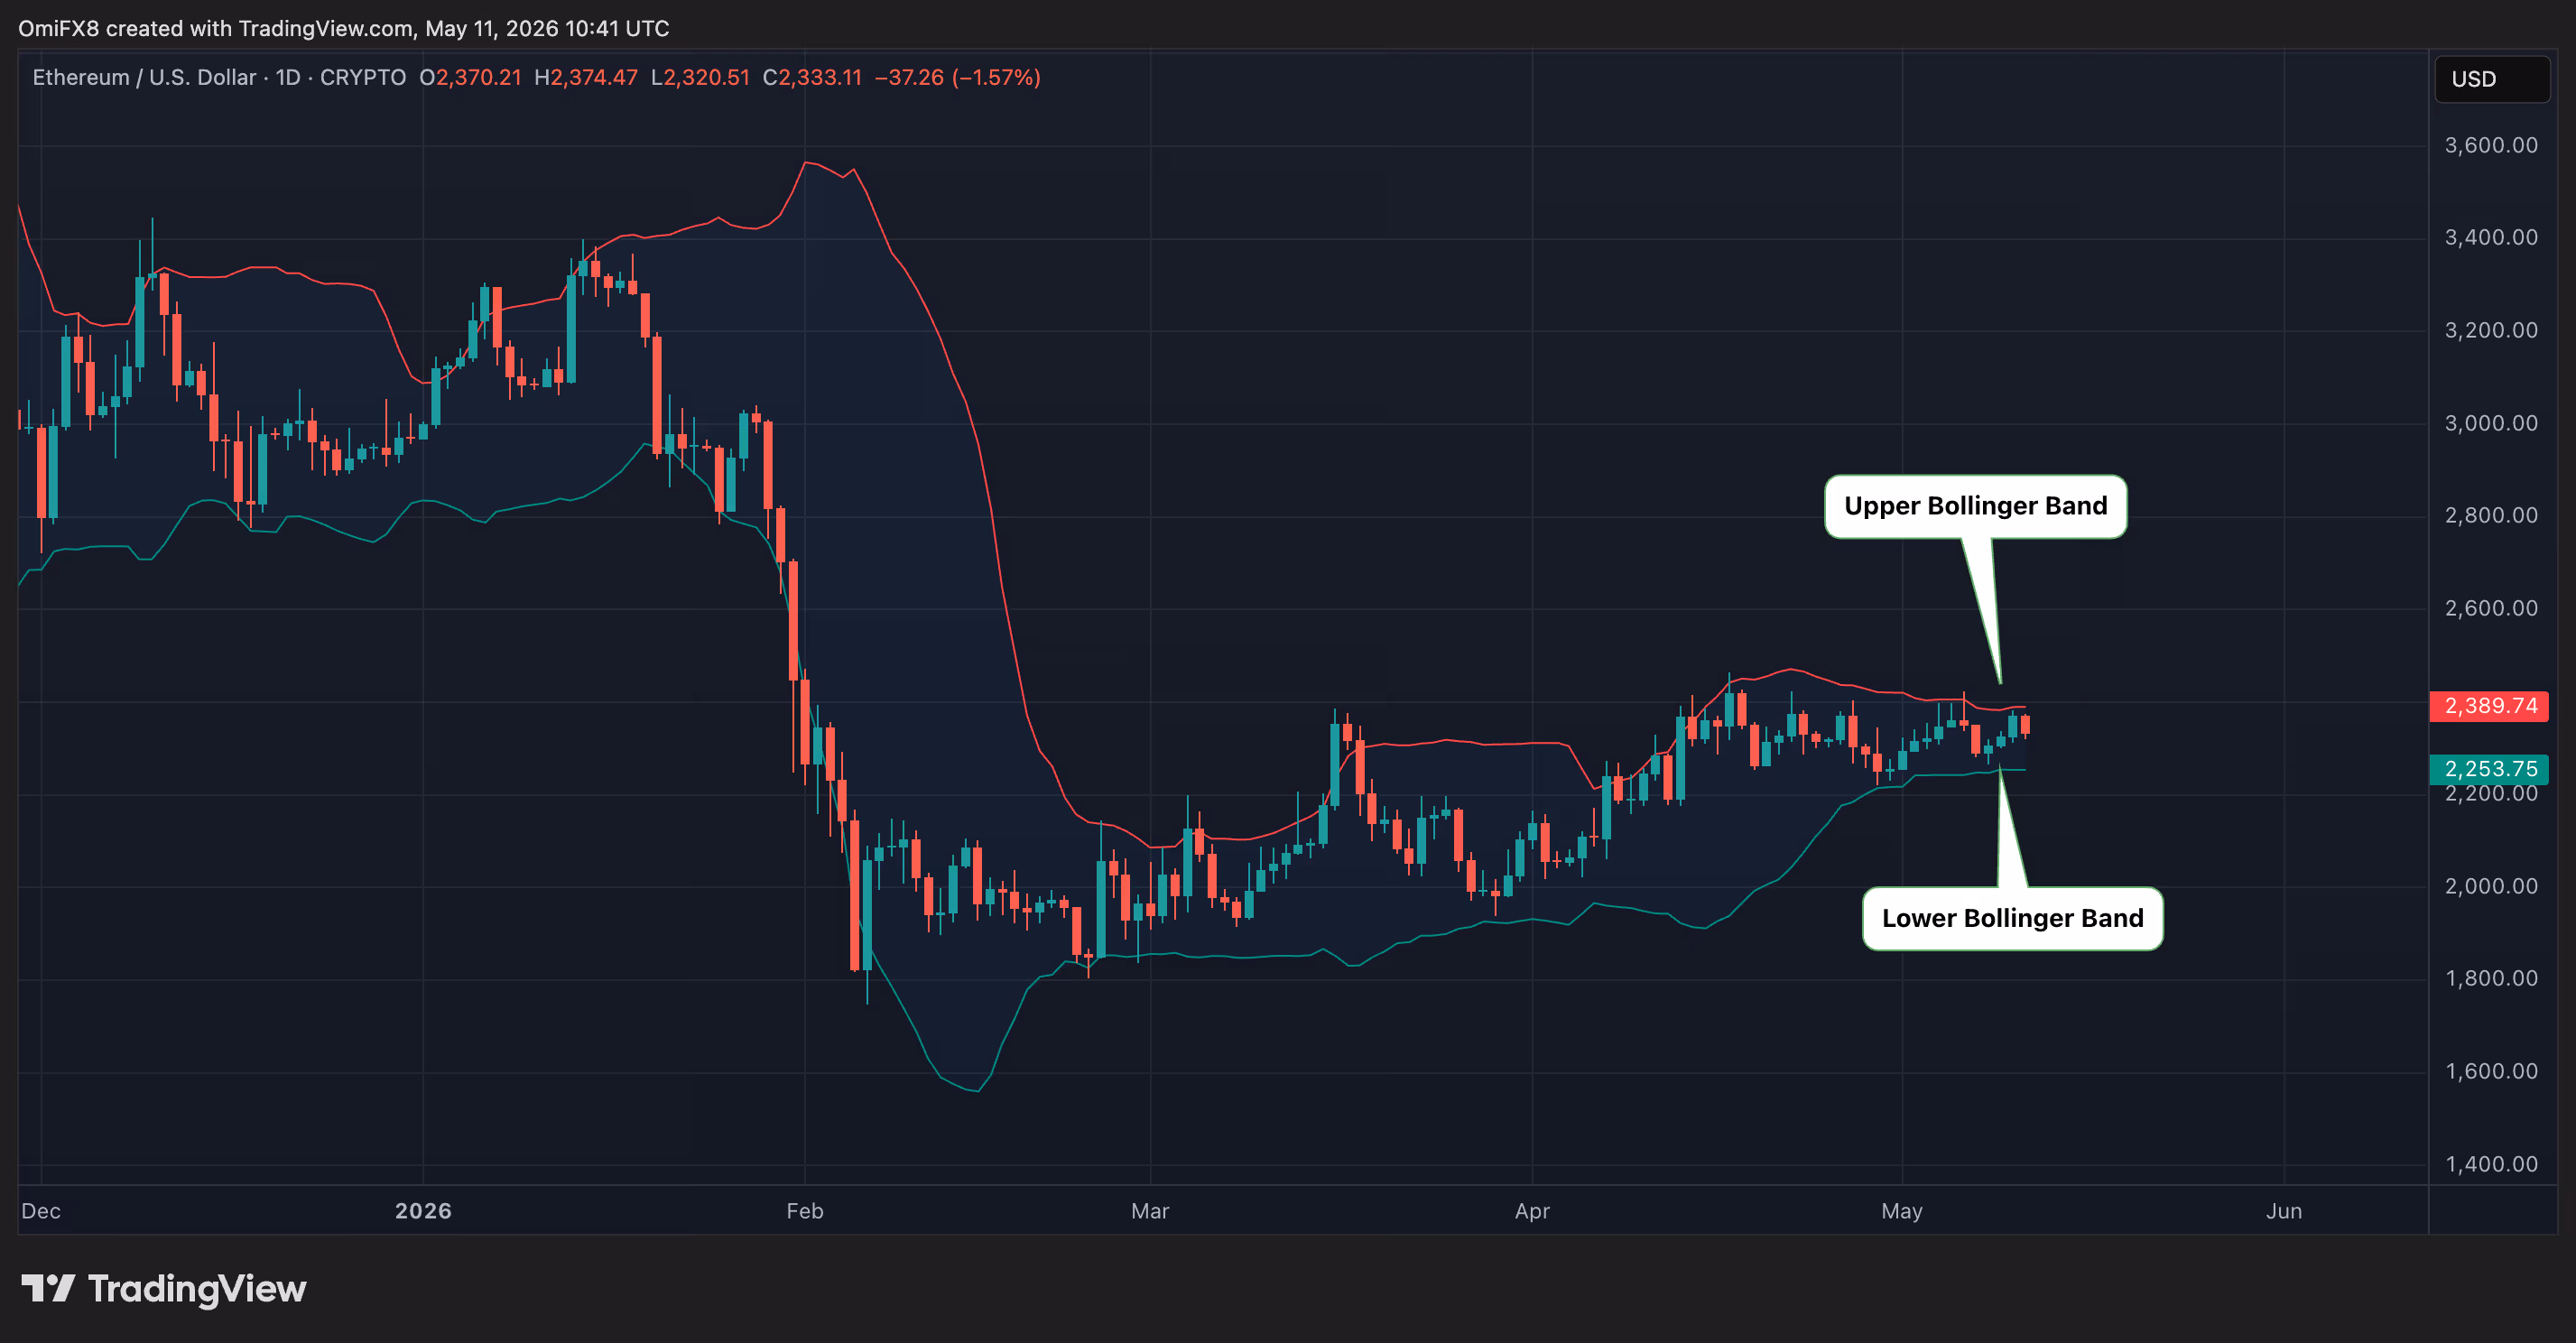
The chart shows ether’s (ETH) daily price swings in candlestick format since late 2025. Overlaid are Bollinger Bands, which are volatility bands placed two standard deviations around the 20-day moving average of the price.
The gap between upper and lower bands is currently the narrowest since late 2023. In other words, at their tightest in 2.5 years, signaling an extended period of compressed volatility.
Such tightening typically reflects a market in equilibrium, with both buyers and sellers unwilling to lead the price action. Such low-volatility phases tend not to persist for long, often resolving into sharper directional moves once bulls or bears reassert dominance.
In short: Watch out for a large directional move ahead.

A Bitcoin whale wallet that has been dormant since November 2013 is making huge news. The wallet moved 500 BTC, worth $40 million, to a new address at 19:16 UTC on Sunday, triggering a panic, although the destination address is not linked to any known exchange.
The transfer originated from address 1KAA8GGhVjjUjVTz1HKAjCyGNzAKQd882j, funded in late 2013 with probable mining rewards per Blockchair data, and landed at bc1qm6m6d33d02edr0k8yj9jgt027zl6dvx6thjrxy, a Bech32 native SegWit address created just the previous day on May 10, 2026. Freshly generated destination address, decade-old source wallet.
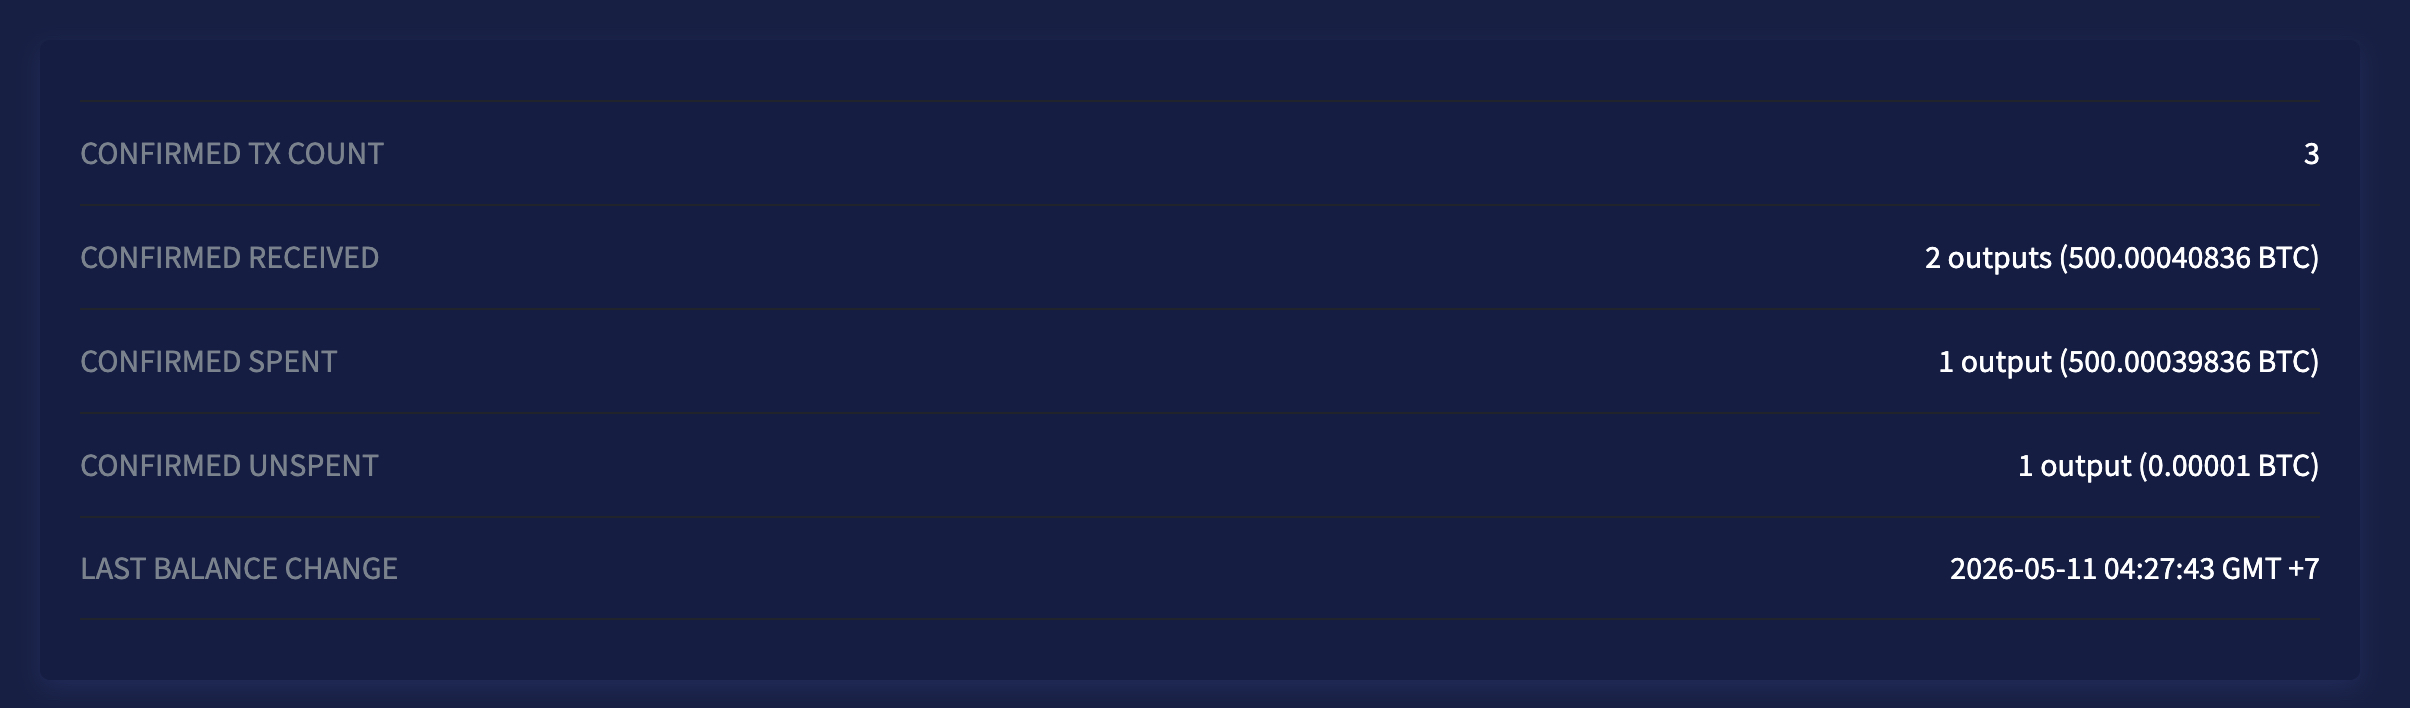
However, the transaction fee was 0.0001 BTC, or just $8 at current prices. For context, typical BTC exchange inflow transactions have average fees that are 10 times higher, according to Chainalysis’s 2026 Crypto Crime Report. Low fees signal non-urgent intent, with the whale not racing to hit a bid on a centralized exchange before the market moves.
Arkham Intelligence’s address labeling flags the destination format as consistent with custodial OTC desk infrastructure, matching patterns used by institutional counterparties for privacy-preserving large transfers.
The coins in this wallet qualify as a genuine Satoshi Era holding. The whale acquired when BTC traded under $100, now worth $40 million at $80,700 spot.
Discover: The best pre-launch token sales
Bitcoin News: Exchange Dump or OTC Absorption?
If this resolves as an OTC transaction, the sale is absorbed off-book, order-book depth is unaffected, and the spot price impact is minimal. If the coins route to a centralized exchange hot wallet, that is a different conversation entirely.
Ki Young Ju of CryptoQuant called it plainly on May 10: “Classic OTC prep, not dump pressure, low fees and non-CEX destination scream institutional.”
Lookonchain data reinforces that read: 72% of 2026 whale moves involving BTC dormant more than seven years resolved as OTC within 48 hours, per their tracking dashboard. T
A comparable November 2025 event, 500 BTC moved from a 2012 wallet to a Wintermute-linked address, was later confirmed OTC by the firm’s executives directly. The structural fingerprints here are nearly identical: aged UTXO, fresh SegWit destination, minimal fee, no exchange association. The data points toward OTC, not exchange sell pressure.

OTC desks typically distribute 10–25% of a position daily to avoid slippage. If outflows from that address begin routing toward known exchange deposit wallets, the thesis flips. Glassnode’s Exchange Inflow Multiple report, due May 14, will provide the aggregate view on whether dormant supply is hitting order books at scale.
Bitcoin was trading at $80,700, down just over 1% since midnight, as the market absorbed geopolitical headwinds that have kept BTC range-bound below the $83,000 resistance cluster.
Discover: The best pre-launch token sales
The post Bitcoin News: $40M Dormant BTC Whale Making A Move After 13 Years appeared first on Cryptonews.


Crypto traders paid annualized fees of 8,700% to service a leveraged, synthetic bet on the valuation of Anthropic.
Even as the privately-held AI giant neared a $1 trillion valuation, some paid 1% per hour, imputing an expected Anthropic rally to $88 trillion within a year, just to cover the cost of their leveraged long.
For context, the most valuable publicly-traded company in the world today, Nvidia, has a market capitalization of $5.2 trillion.
Worse, the market they selected doesn’t actually deliver real Anthropic shares.
A combination of arcane terminology and abbreviations, off-page terms of service, a small open interest cap, and a simplified interface for trading compressed those disturbing realities into an easy-to-click “Buy” button alongside a flickering price chart.
Normally, short-sellers pay their brokers for the privilege of loaning out shares to sell first, with the hopes of buying back cheaper later.
In the topsy-turvy world of crypto, buying long exposure to Anthropic was even more expensive than shorting over the weekend.
Paying 8,700% annualized fees to bet on Anthropic
Because Anthropic isn’t publicly traded, crypto exchange Hyperliquid lists a USDH-denominated contract using the Ventuals deployer on $7.5 million worth of Anthropic open interest partially based on Notice’s estimate of Anthropic’s valuation.
If you didn’t understand the above sentence, you haven’t read the full terms of service for ANTHROPIC on Hyperliquid and are probably no different than many traders who bought it anyway.
USDH calls itself a stablecoin, even though it’s traded between $0.72 and $1.11 over the past year.
In addition, Notice doesn’t actually know the real-time value of Anthropic.
Moreover, the whole artifice relies on two proprietary altcoins plus innumerable service provider risks.
Despite these stratospheric risks, traders paid up to 1% per hour to use 3x leverage on Anthropic’s private valuation.
For most of the past two days, the contract traded well above the Notice oracle’s reference price, forcing longs to pay hourly funding rates to shorts. Those payouts briefly made shorting one of the most-hyped AI companies a de facto, high-yield income strategy.
Don’t worry, funding is capped at 4% per hour
Incredibly, Hyperliquid settles funding rates hourly and caps them not at 1% but at 4% per hour.
On Hyperliquid’s ANTHROPIC, the hourly rate exceeded 1.5% over the weekend, equivalent to annualized fees in the five-digit percentages.
Across a 48-hour period this weekend, longs paid shorts over 15% of their position size in funding alone. That isn’t a typo. A $10,000 long with no Anthropic valuation movement at all would have bled $1,500 to the short side within two days.
Disclosures explaining these losses exist on off-webpage disclosures. In essence, the gap between the contract’s mark price and Notice’s oracle reference drives the funding rates on Ventuals contracts on Hyperliquid.
On the ANTHROPIC Ventuals contract, Notice’s oracle sat near $934 while Hyperliquid Ventuals traders paid over $1,060.
Each unit on Ventuals represents $1 billion of valuation, so those numbers translate to a $934 billion oracle-implied valuation relative to a $1.06 trillion Hyperliquid exponential moving average or “mark” valuation.
That 13.6% premium of mark over oracle, which varied by the hour, is what generated the lavish payouts to anyone willing to short Anthropic.
Read more: Sam Bankman-Fried’s $500M stake in AI startup ‘irrelevant’, prosecutors say
Fake shares in a real Anthropic
In February 2026, Anthropic closed a $30 billion Series G led by GIC and Coatue at a $380 billion post-money valuation. Annualized revenue then increased from $9 billion at year-end 2025 to $30 billion by April.
Forge Global’s CEO Kelly Rodriques told Business Insider that secondaries had pushed the implied price near $1 trillion within three months.
Bloomberg and the Financial Times have since reported that a fresh round near $900 billion is being lined up with Dragoneer, General Catalyst, and Lightspeed.
Notice is a private-market data vendor. Its algorithm folds private-market trade prints, bids and offers, fresh funding announcements, valuation marks of funds, appraisals, and a peer basket of listed companies, all into a single number.
Notice publishes its number with a three-second refresh.
Ventuals on Hyperliquid also discloses its lack of equity transference directly. “When you have a position in a company on Ventuals, you do not have any underlying economic ownership in the company – you’re merely speculating on its valuation change.”
Its documentation reiterates, traders “trade valuations, not shares.”
Although Anthropic funding rates on Hyperliquid annualized in the four- and even five-digit percentages over the weekend, they’ve settled down to triple- and double-digit rates as of publication time.
As funding rates fluctuate by the hour, no Anthropic shares ever need to change hands for bearish traders to be paid by exuberant bulls.
Got a tip? Send us an email securely via Protos Leaks. For more informed news and investigations, follow us on X, Bluesky, and Google News, or subscribe to our YouTube channel.

What’s Making Teenagers Anxious? Therapists Share Their Thoughts
IPL 2026 | ‘You die from that cramp’: Ex-CSK star’s remark on Krunal Pandya sparks fan outrage | Cricket News
Arctic blast to sweep Northern Ireland with cold snap
Manchester United reach agreement with Casemiro over contract clause amid transfer speculation

US brings back mandatory military draft registration

Steven Gerrard disagrees with Gary Neville over ‘shock’ Chelsea and Arsenal claim | Football


-
 Crypto World3 days ago
HarrisX Poll Found 52% of Registered Voters Support the CLARITY Act
-

 Crypto World4 days ago
Upbit adds B3 Korean won pair as Base token gains Korea access
-

 Fashion3 days ago
Weekend Open Thread: Marianne Dress
-

 Tech7 days ago
Image AI models now drive app growth, beating chatbot upgrades
-
 NewsBeat4 days ago
NCP car park operator enters administration putting 340 UK sites at risk of closure
-

 Politics2 days ago
Politics Home Article | Starmer Enters The Danger Zone
-
 Business2 days ago
Ignore market noise, India’s long-term story intact, say D-Street bulls Ramesh Damani and Sunil Singhania
-

 Tech1 day ago
Auto Enthusiast Carves Functional Two-Stroke Engine from Solid Metal
-

 Tech6 hours ago
GM Agrees To Pay $12.75 Million To Settle California Lawsuit Over Misuse Of Customers’ Driving Data
-

 Crypto World6 days ago
UAE Free Zone Deploys Blockchain IDs to Verify Registered Firms
-
 Sports7 days ago
2026 NHL playoff picks: Second-round predictions, series odds, Stanley Cup bracket
-

 Crypto World5 days ago
BlackRock CEO Larry Fink Discusses a New Asset Class
-

 Crypto World4 days ago
Robinhood says Wall Street is building onchain
-
Entertainment6 days ago
Serena Williams hits Met Gala in metallic dress after GLP-1 reveal
-

 Entertainment7 days ago
Skai Jackson Responds To AI Baklash After Viral Snapchat Photos
-

 Tech5 days ago
Apple and Samsung are dominating smartphone sales so thoroughly that only one other company makes the top 10
-

 Tech5 days ago
I tested the Xiaomi 17 Ultra’s camera and I don’t think I’ll ever go back to an iPhone
-

 Politics6 days ago
Met Gala 2026: Madonna’s Dramatic Red Carpet Look Steals The Show
-

 Fashion5 days ago
The Best Work Pants for Women in 2026
-
 Sports7 days ago
Hearts v Rangers LIVE: Prediction, team news and line-ups as Scottish Premiership title rivals meet at Tynecastle
You must be logged in to post a comment Login