

Crypto World
Solana Foundation Launches Framework for Protocol Governance

The Solana Foundation, the Swiss organization that supports the Solana network’s development, launched a new framework for protocol-level governance that enables proposing and voting on governance decisions for the Solana blockchain.
The Solana Governance Proposals (SGPs) establish a standard that enables validators to submit core protocol proposals and vote onchain, with voting power based on their delegated Solana (SOL) stake, the Foundation announced in a Thursday X post.
“An SGP captures a stake-weighted directional decision. It records what the community wants. It is not strictly focused on the technical detail of how to build the feature,” according to the GitHub repository, launched on Thursday.
The new framework offers Solana a transparent, community-driven way to make major protocol decisions, reducing reliance on centralized coordination while keeping technical implementations, or Solana Improvement Documents (SIMDs), separate from community governance.
Other blockchain networks with similar stake-weighted governance mechanisms include Polkadot, Cosmos, Cardano, Tezos and Avalanche.

Source: Solana Foundation on X.com
Proposals require minimum 15% support
A proposal must receive endorsements from validators representing at least 15% of actively staked Solana tokens to qualify for a formal onchain vote, a measure that seeks to filter out low-quality proposals.
Validators with at least 100,000 SOL delegated can open a new governance proposal via SGP. SOL stakers can delegate their stake to validators, allowing them to participate in the governance process on their behalf.
Delegators who disagree with how their validator has voted can now override the validator and submit their own vote on the proposal, hence overriding the validator’s vote for that proposal.
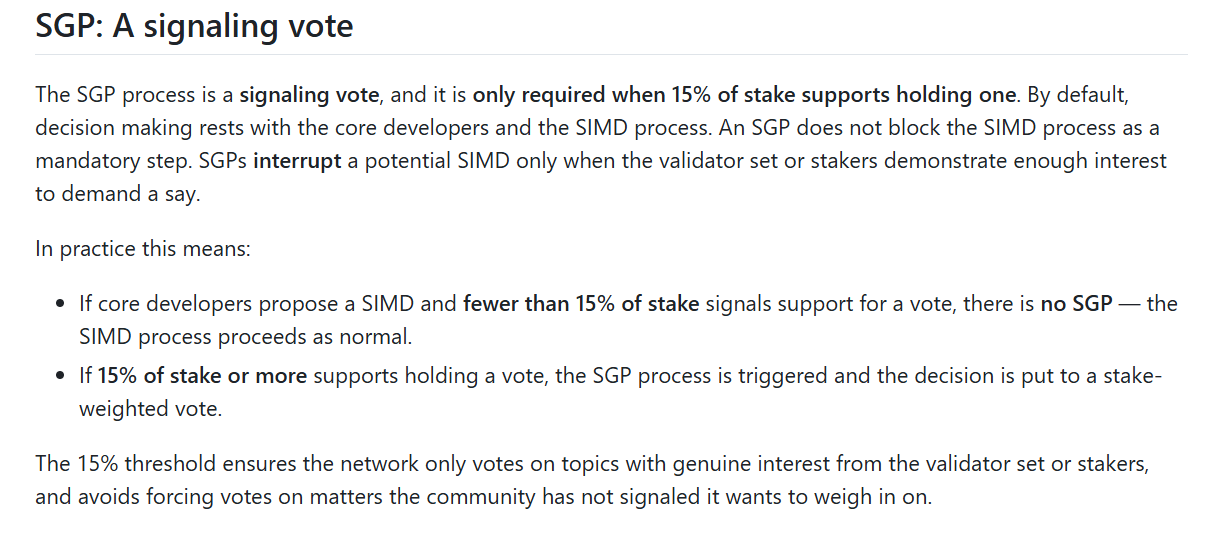
SGP voting information, minimum threshold. Source: GitHub
The Solana Foundation said that governance-level proposals will be SGPs, while smaller SIMD proposals will focus on technical protocol upgrades.
“SIMDs should focus on protocol changes, SGPs should be signals from the ecosystem,” wrote the Foundation.
Related: South Korea’s Shinhan Card taps Solana to test real-world stablecoin payments
In April, the Solana Foundation introduced a new security auditing framework and incident-response network for Solana-based protocols, in partnership with Web3 security firm Asymmetric Research.
The new initiative, the Solana Trust, Resilience and Infrastructure for DeFi Enterprises (STRIDE), is a “structured program for evaluating, monitoring and escalating security across Solana projects,” according to the April announcement.
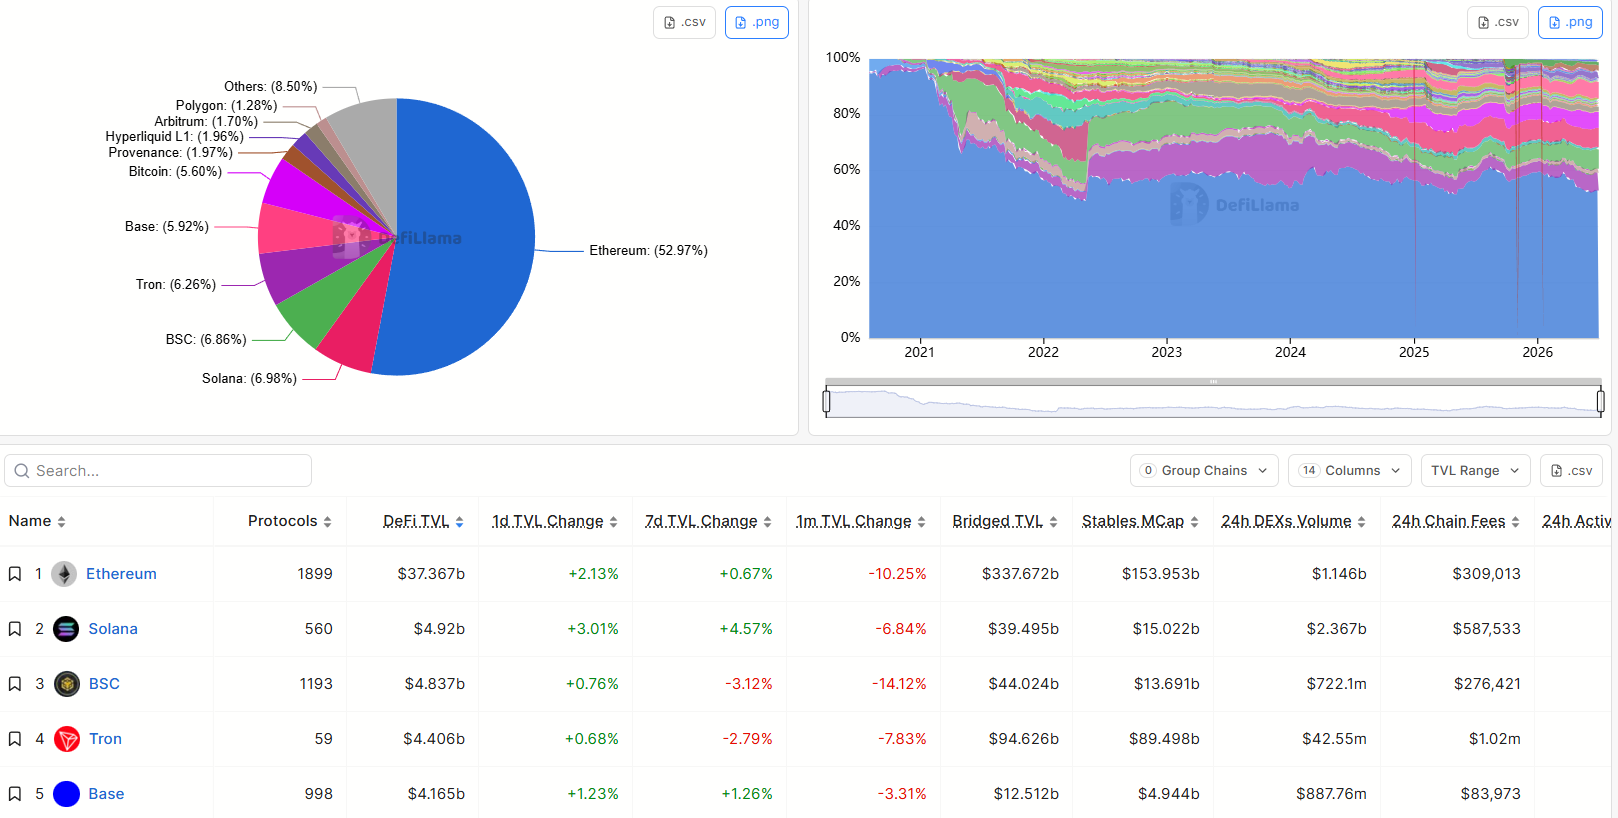
Top blockchain networks by TVL. Source: DefiLlama
Solana ranks as the second-largest blockchain network with $4.92 billion in total value locked (TVL), behind Ethereum’s $37.3 billion. Solana generated over $587,000 in blockchain fees during the past 24 hours, according to DefiLlama at last look.
Magazine: ‘If you want to be great, make enemies’: Solana economist Max Resnick

Securitize entered the public market with an onchain push that ties its NYSE debut to tokenized equity. The BlackRock-backed platform tokenized its common stock, SECZ, on Solana and Avalanche as trading began. The move also came as crypto-linked stocks rallied, while Bitcoin recovered to the $62,000 level.
Securitize Brings SECZ Shares Onchain
Securitize launched its tokenized common stock on the same day it listed on the New York Stock Exchange. The company trades under the ticker SECZ after completing its merger process with Cantor Equity Partners II. Therefore, the listing gives the tokenization firm a public-market platform and an onchain equity structure together.
The company made tokenized SECZ available to eligible U.S. users through its regulated platform. It selected Solana and Avalanche for the initial rollout, giving the stock exposure across two major blockchain networks. However, the company said the tokenized version represents the same common stock listed on the NYSE.
Securitize has long built its business around regulated tokenized assets and issuer-led market infrastructure. The company has supported tokenized funds and real-world asset products across public blockchains. As a result, its own stock tokenization marks a direct test of the model it promotes.
Tokenized Stock Keeps The Same Share Rights
Securitize said the tokenized SECZ does not create a separate share class or change the underlying stock. Instead, tokenization changes the form of ownership while the traditional share remains the same. Therefore, legal limits, transfer rules, and contractual restrictions still apply to the equity.
The company expects the launch to create an onchain shareholder base from its first day as a public firm. It also expects future market tools and utility to develop around the tokenized shares. However, the current rollout focuses on regulated access and direct representation of listed common stock.
The launch adds fresh context to the wider tokenization market, which has gained stronger institutional interest. Asset managers and blockchain firms have moved more bonds, funds, and securities onto digital rails. Consequently, Securitize’s public listing places tokenized equity closer to mainstream market infrastructure.
SECZ Stock Rises As Crypto Market Rebounds
SECZ gained more than 10% during its first trading session, according to TradingView data cited in the report. The stock traded near $12 as broader crypto-linked equities also advanced. Meanwhile, Bitcoin’s rebound to around $62,000 helped improve sentiment across the digital asset sector.
The rally followed a stronger session for several companies connected to crypto markets and blockchain infrastructure. Securitize benefited from its public debut and its tokenization announcement on the same day. Moreover, the BlackRock connection added further attention to the company’s market entrance.
The debut also arrived after Cantor Equity Partners II shareholders approved the merger that allowed the listing. That approval cleared the path for Securitize to enter public markets through the transaction. Now, the company has positioned SECZ as both an NYSE-listed stock and a regulated onchain equity product.
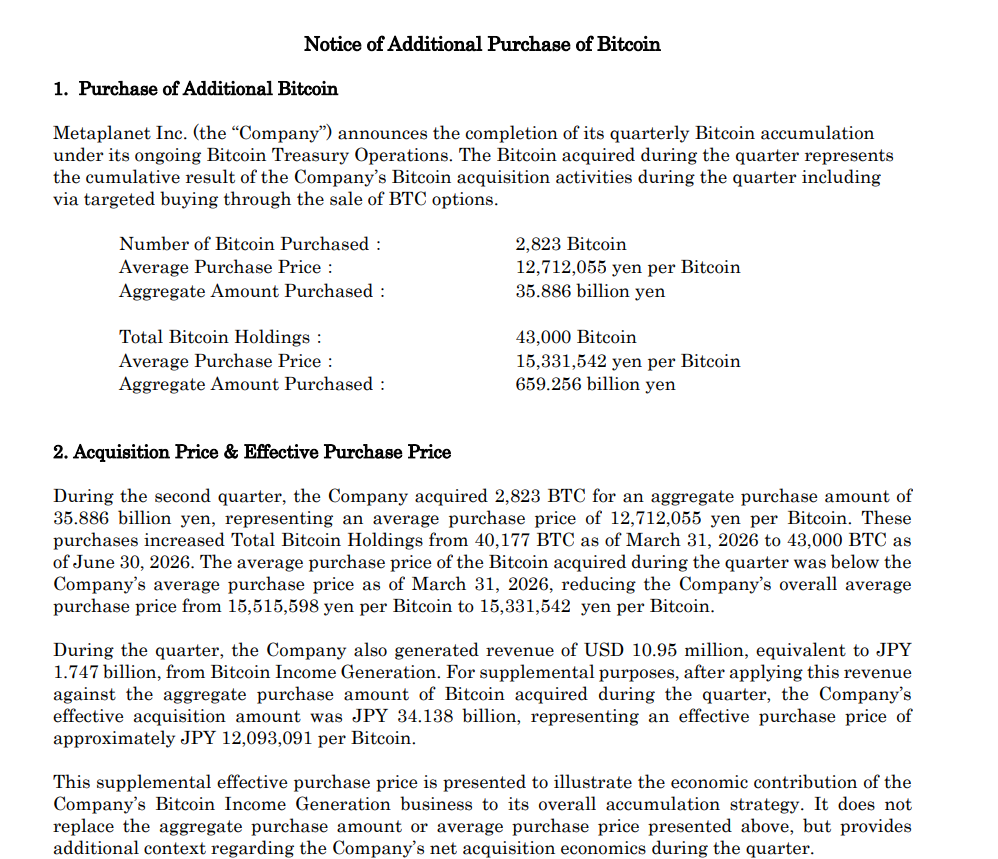
Japanese investment company Metaplanet acquired 2,823 Bitcoin during the second quarter at a price below its average purchase price, as its holdings surpassed 43,000 BTC.
The company acquired its latest trove at an average price of about 12.71 million yen ($78,850 at current exchange rates), reducing its average acquisition cost to about $95,117 per BTC from $96,258, according to a Thursday announcement.
Metaplanet now holds 43,000 Bitcoin acquired for about $4.1 billion. It also reported about $10.95 million in revenue from its Bitcoin income generation strategy in the quarter, which earns premiums by selling cash-secured options and employing other Bitcoin-related yield strategies.
The purchase extends Metaplanet’s aggressive accumulation strategy, which has made the company one of the world’s largest corporate Bitcoin holders. The acquisition comes days after Michael Saylor’s Strategy, the world’s largest corporate Bitcoin holder, skipped its usual weekly Bitcoin purchase while unveiling a new capital framework designed to support dividends and expand its cash reserves.

Metaplanet Notice of Additional Bitcoin Purchase. Source: Metaplanet
Metaplanet shares closed 3.5% higher on Thursday but remain down 48% year-to-date, underperforming Bitcoin, which has fallen 31% over the same period.
K Wave latest company to exit Bitcoin treasury strategy
While companies such as Metaplanet continue buying more Bitcoin, a handful of treasury companies are scaling back their exposure.
Nasdaq-listed South Korean company K Wave Media sold its remaining 88 BTC to repay $6 million in debt, exiting the Bitcoin treasury strategy, according to a Tuesday filing with the US Securities and Exchange Commission.
K Wave Media, FORM F-3 filing. Source: SEC.gov
The move marked a sharp reversal as the company previously announced plans to expand its holdings to 10,000 BTC after securing $1 billion in capital capacity to drive its Bitcoin treasury strategy in July 2025.
Related: Swan’s Cory Klippsten sees record Bitcoin holder supply revealing early bottom
On May 28, France-based semiconductor company Sequans Communications said it would monetize its remaining Bitcoin holdings over time. The company held 658 BTC at the time, and its shares rose about 14.5% following the announcement.
Magazine: Bitcoin, the ‘canary in the coal mine,’ XRP transaction demand falls 91.5%: Market Moves
Key takeaways:
- Soft US jobs market data triggered a rotation of capital from overheated AI stocks into Bitcoin and gold.
- Bitcoin onchain indicators hint at seller exhaustion while the decline in oil prices opens room for monetary expansion.
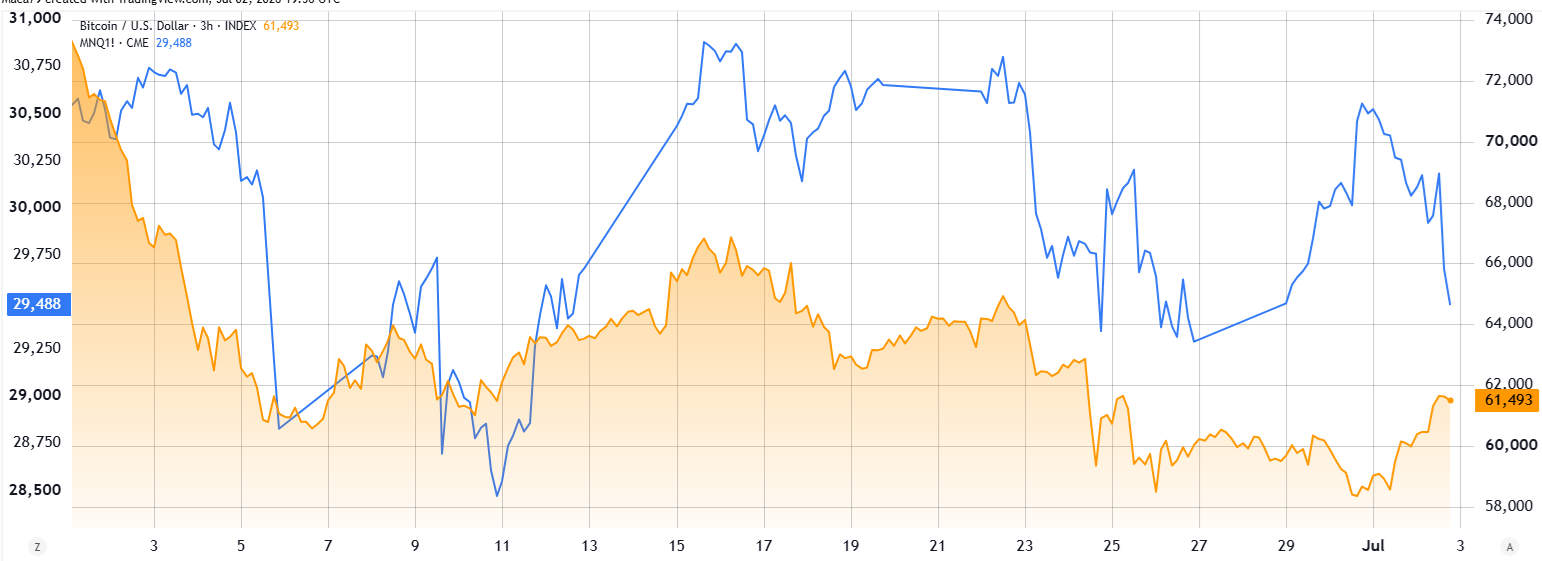
Bitcoin reclaimed the $61,000 mark following a disappointing US job market report. Traders grew less certain of a near-term interest rate hike from the US Federal Reserve (Fed) given the worsening labor data. The tech-heavy Nasdaq index sold off, fueling hopes of a capital rotation favoring Bitcoin.

Nasdaq 100 Index futures (blue) vs. Bitcoin/USD (orange). Source: TradingView
The Nasdaq 100 Index erased gains from the three prior days, while Bitcoin distanced itself from Wednesday’s $57,750 low. US non-farm payrolls increased by only 57,000 in June, missing the 113,000 expected, according to Yahoo Finance. The US Labor Department also revised data for April and May downward by 74,000 jobs.
Gold prices reacted positively on Thursday, hinting at potential bullish momentum for scarce assets. The weak economic data prompted investors to cut odds of Federal Reserve interest rate hikes by September to 54% from 64% the prior day, according to the CME FedWatch Tool. Meanwhile, crude WTI oil prices stabilized below $70, opening the door for possible economic stimulus measures

Gold/USD (red) vs. Crude WTI oil (teal). Source: TradingView
Oil prices dropped after the Qatar Foreign Ministry cited “positive progress” in the latest round of discussions between US and Iranian representatives on Wednesday. Gold recovered some of the 8% losses accumulated over the prior two weeks, a possible sign that investors anticipate a less tight monetary policy and further FED balance sheet expansion.
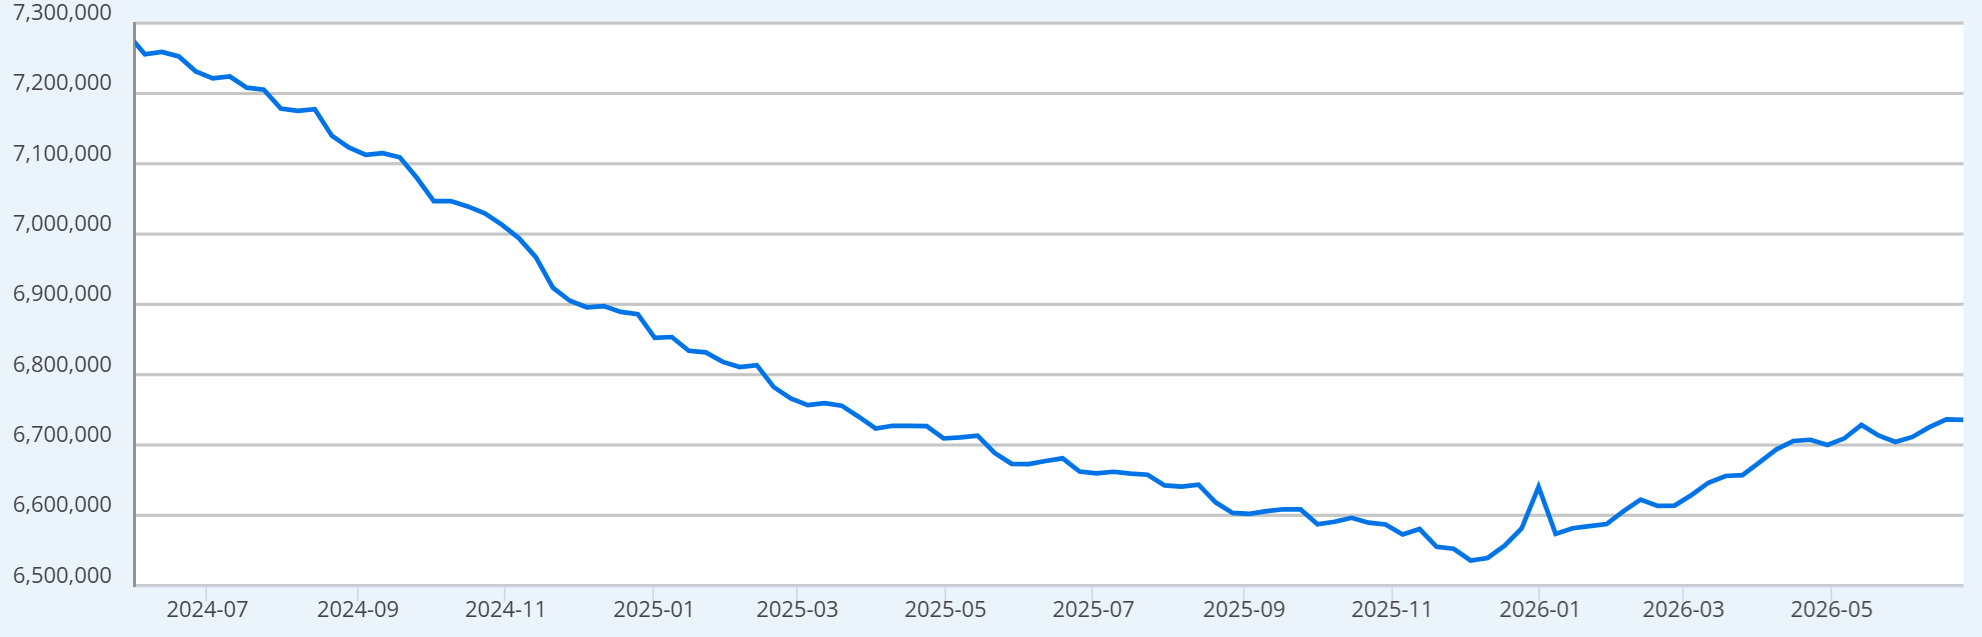
US Federal Reserve total assets, USD millions. Source: FED St Louis
The Federal Reserve balance sheet stagnated at $6.73 trillion, although its mandate allows for $40 billion monthly purchases in short-term Treasuries and bonds. Weak job market data and reduced inflationary pressure are widely seen as catalysts for accelerated liquidity injection, creating incentives to invest in scarce assets, including gold and Bitcoin.
Overheated AI stocks clash with Bitcoin flashing a bottom
Weakness in the AI sector, especially among chipmakers, has led traders to anticipate capital shifting toward alternative assets. Shares of SanDisk, Seagate, Western Digital, and Applied Materials saw intraday losses of 9% or higher on Thursday. In contrast, Bitcoin is showing signs of seller exhaustion two months after rejection at $82,500.
Related: Bitcoin tops $60K amid Fed inflation talks–Is bull trap or $65K next?
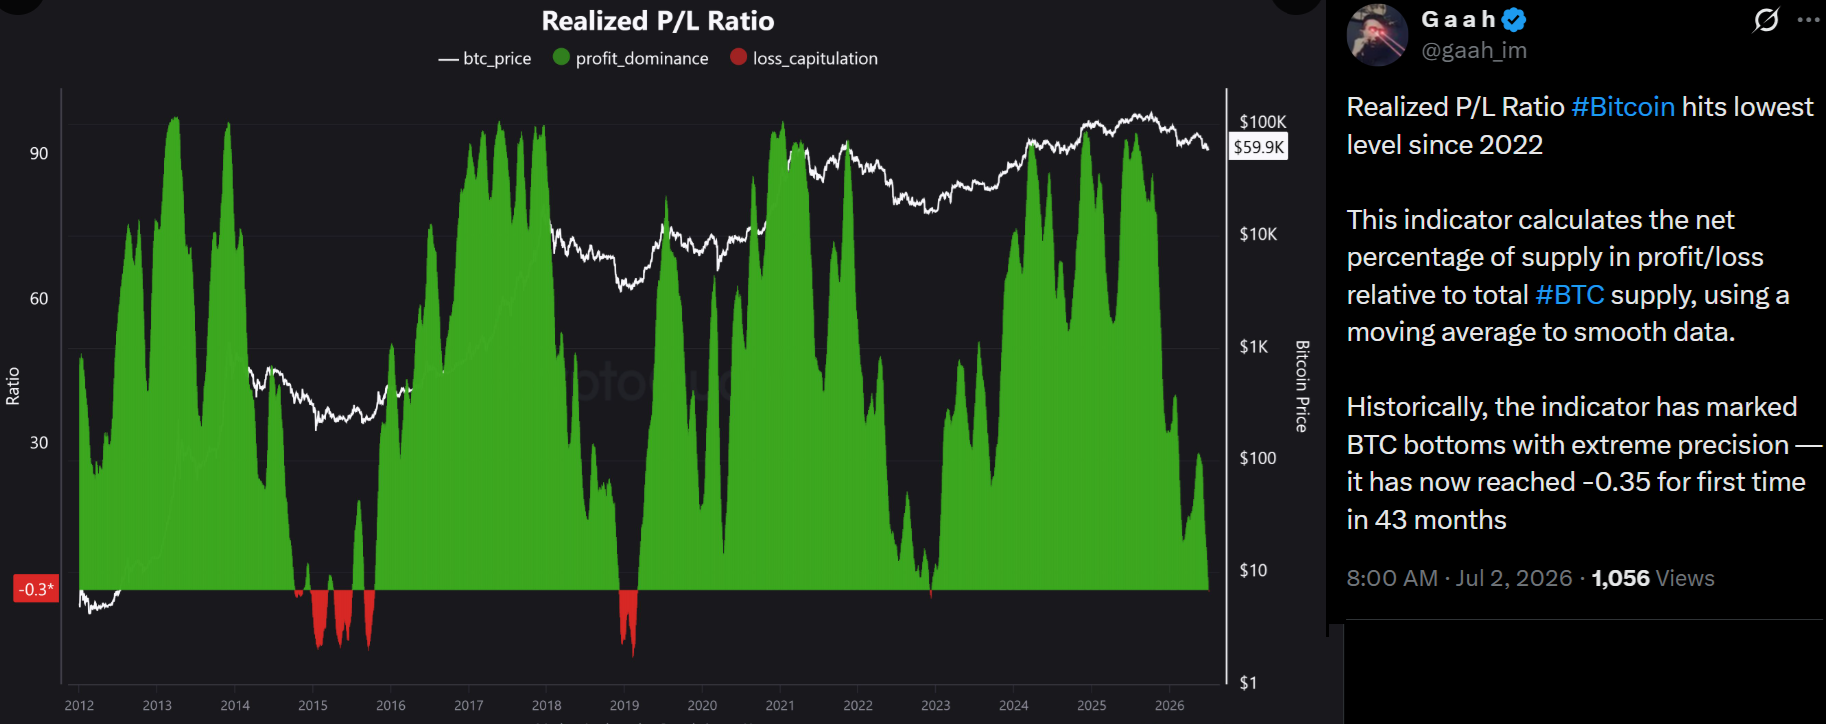
Source: X/gaah_im
Onchain analyst and CryptoQuant author gaah_im said that Bitcoin’s realized profit-to-loss ratio has hit its lowest level since 2022. The net percentage of supply in profit relative to the total supply has turned negative, which historically has marked cycle bottoms with “extreme precision,” according to the analyst. In essence, onchain data hints at further Bitcoin upside.
Part of Bitcoin’s recent weakness stems from traders’ disappointment with Strategy. Despite a healthy 8% net leverage and $56.8 billion in enterprise value, holders faced dilution from accelerated MSTR share issuance used to buy back some debt and cover dividends on preferred stocks.
If weakness in the AI sector accelerates, some of that money will likely rotate into gold and Bitcoin, making a near-term recovery to $70,000 possible.


Anchorage Digital has integrated Lido into its institutional platform, allowing clients to access wrapped staked Ether (wstETH) while keeping assets inside its regulated custody environment.
Summary
- Anchorage Digital has integrated Lido, letting institutions mint and burn wstETH without leaving regulated custody.
- Clients can access Ethereum staking rewards while keeping custody, governance, reporting, and settlement on one platform.
- Lido says rising institutional demand and its audited staking infrastructure are driving adoption of custody-based staking.
According to a July 2 announcement from Anchorage Digital, institutional clients can now connect directly to the Lido application to mint and burn wstETH without transferring assets outside the firm’s custody platform.
The integration lets investors earn Ethereum staking exposure while continuing to use the custody, governance, reporting, and settlement processes they already rely on.
Institutions can stake Ethereum without moving assets
The newly added service centers on wstETH, a liquid staking token that represents staked Ether while remaining transferable. Instead of distributing staking rewards directly, the token’s value increases relative to stETH over time, allowing institutions to retain liquidity alongside staking exposure.
Commenting on the launch, Anchorage Digital co-founder and CEO Nathan McCauley said liquid staking has become one of Ethereum’s most important components for institutional participation.
“By integrating with Lido, we’re giving institutions access to wstETH without the operational or security tradeoffs that have historically kept large allocators on the sidelines.”
Anchorage Digital, which operates the first federally chartered crypto bank in the United States, said clients can now complete staking-related activity without moving assets across multiple providers. The company said keeping custody, staking, governance, and settlement within one regulated platform simplifies institutional operations.
Earlier this week, as reported by crypto.news, Anchorage Digital also expanded its institutional infrastructure through a partnership with Binance. The agreement allows eligible institutional clients to trade on Binance while keeping assets in segregated custody through Anchorage’s Atlas platform. Binance said the arrangement separates custody from trade execution, mirroring practices commonly used in traditional financial markets.
Lido highlights security and institutional demand
Interest from institutional investors has continued to grow as staking infrastructure and regulation have matured, according to Kean Gilbert, head of institutional relations at the Lido Ecosystem Foundation.
Gilbert told Crypto Briefing that asset managers, liquid funds, and Ether treasury holders have increasingly sought custody-based access to staking because it reduces operational complexity and compliance concerns while fitting existing institutional workflows.
The first phase of the integration focuses on minting and burning wstETH inside Anchorage Digital. Institutions can convert ETH into wstETH and redeem it back through the platform, while the token remains transferable for collateral use or deployment into other investment strategies.
Unlike conventional staking positions that often require investors to wait before withdrawing funds, wstETH can be transferred without first exiting the underlying staking position. According to Lido, this gives institutions additional flexibility while preserving exposure to Ethereum staking rewards.
Gilbert also pointed to Lido’s security record as institutional adoption continues to expand. He said the protocol has spent more than $4 million on smart contract audits, received an A+ security rating from independent firms including Credora, and has operated since 2020 without a smart contract exploit.
He added that Lido distributes staked Ether across more than 900 node operators, with no individual operator controlling more than 1% of the network, reducing reliance on any single participant.
Looking ahead, Gilbert said that institutional adoption will depend on whether staking products fit existing operational requirements. He said making wstETH available through Anchorage Digital brings the token onto a major U.S. institutional platform and strengthens the role of Lido’s staking infrastructure for professional Ethereum investors.
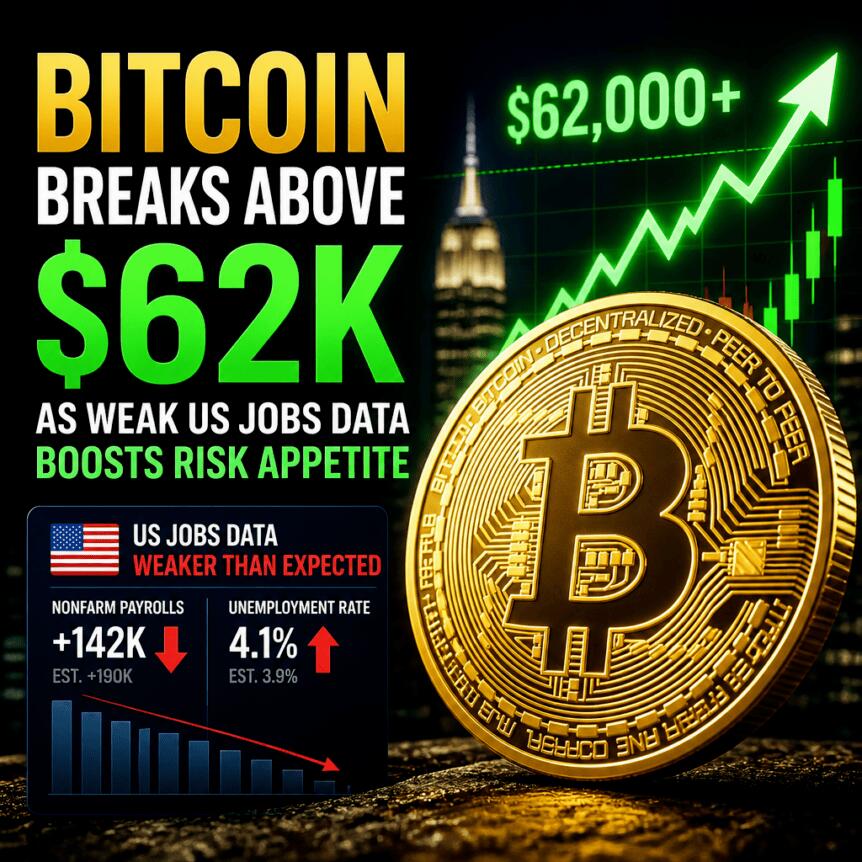
Bitcoin pushed through the $62,000 level at the start of Thursday’s Wall Street session, gaining as traders digested softer-than-expected US employment data. The move came alongside renewed optimism that inflation pressures may continue to cool—an outlook that typically supports risk assets, including crypto.
According to TradingView data cited in the market coverage, BTC/USD rose to a new July high of $62,137 on Bitstamp, up nearly 4% on the day. While the rally remains sensitive to macro headlines, crypto traders also pointed to a visible short squeeze beginning for “green July.”
Key takeaways
- US June nonfarm payrolls came in well below expectations, with 57,000 jobs added versus 114,000 forecast, helping lift Bitcoin.
- BLS data showed the unemployment rate held at 4.2% and the number of unemployed people was largely unchanged at 7.1 million.
- Traders highlighted an unwind of short positions, with CoinGlass reporting nearly $450 million in crypto short liquidations over 24 hours at the time of writing.
- Some analysts framed the move as buyers returning via exchange order-book dynamics, even as they caution the broader trend may still be choppy.
US jobs data shifts the macro tone for crypto
The immediate catalyst was the Bureau of Labor Statistics (BLS) nonfarm payrolls release for June. The report indicated that the US economy added far fewer jobs than expected—57,000 compared with the 114,000 consensus forecast.
The BLS also said the unemployment rate remained at 4.2% and the number of unemployed people changed little, staying around 7.1 million. In market terms, the combination of weaker job growth without a sharp deterioration in unemployment can be read as less immediate pressure on inflation—at least in the short run.
That interpretation is important for Bitcoin because expectations around Federal Reserve policy often drive rates-sensitive flows. A softer labor print can revive speculation that financial conditions may ease, benefiting assets that trade like a high-beta alternative to traditional markets.
Still, the data also carried a reminder that the labor narrative remains unstable. One trading-focused commentary, the Kobeissi Letter, noted that May’s jobs figure was revised down by 43,000 jobs, suggesting the picture is still being recalibrated in official statistics.
“The labor market remains in a volatile situation.”
Analysts see “signals” for markets, but watch $65,000
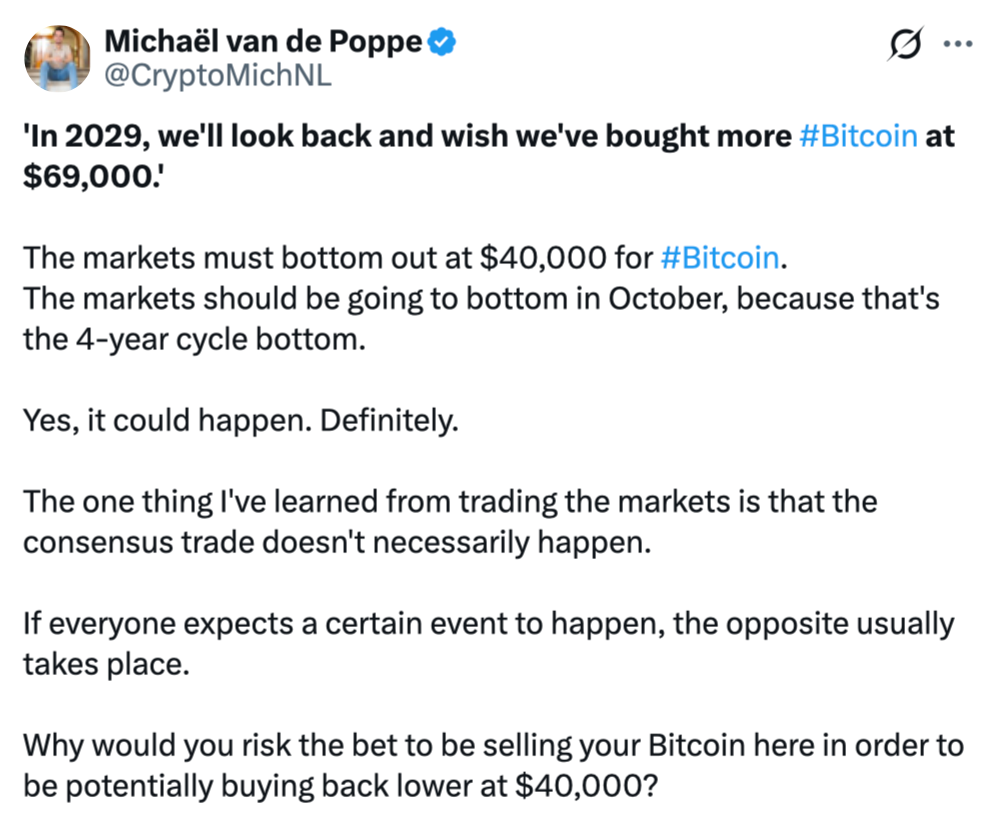
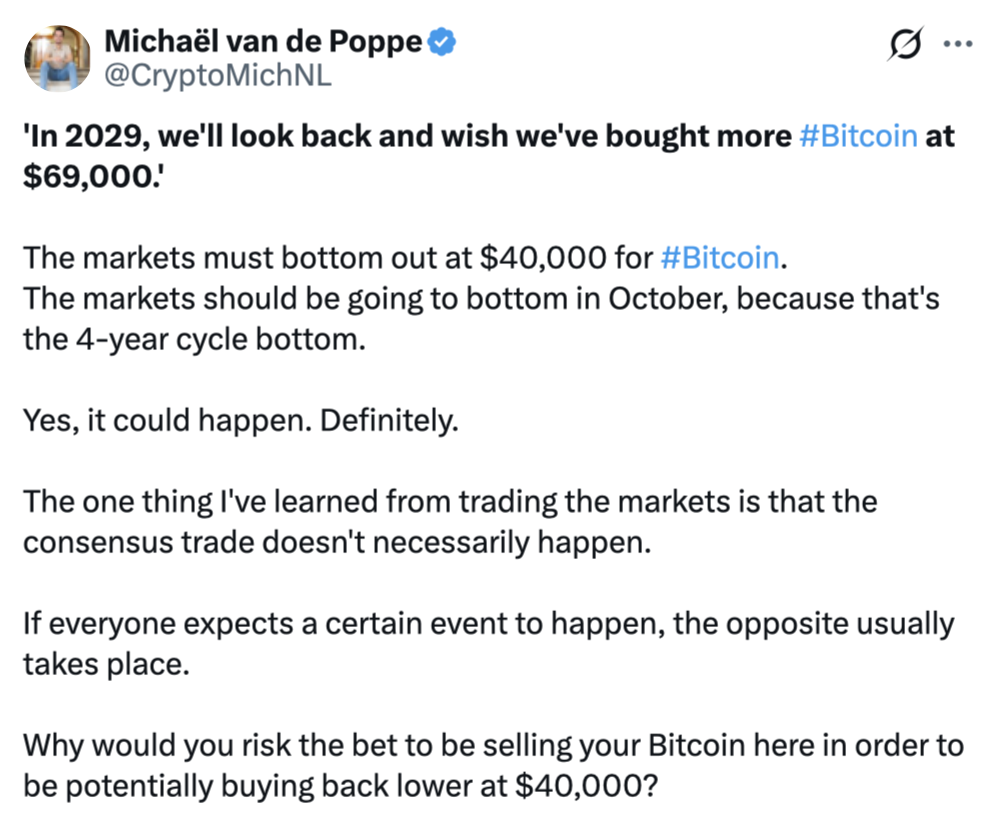
As Bitcoin and broader altcoins moved higher, at least one widely followed trader argued that the macro setup is improving. Crypto analyst Michaël van de Poppe pointed to falling inflation expectations alongside the job-market trend, adding that unemployment is at its lowest level in close to a year.
In an X post, he said these are “strong, public signals about the direction of the markets,” while also setting a technical condition for his outlook. He stated that he does not expect another drop in Bitcoin “if Bitcoin can clearly break through $65,000 from here.”
“I don’t think we’ll see another drop on Bitcoin if Bitcoin can clearly break through $65,000 from here.”
For traders, that framing matters because it ties the macro tailwind to a specific market level. If price fails to clear resistance, the relief rally can fade quickly—even when macro data is supportive.
Short liquidations and exchange order books fuel the rally
Alongside macro drivers, crypto-specific positioning appeared to worsen for short sellers. CoinGlass data—referenced in the coverage—showed nearly $450 million in 24-hour crypto short liquidations at the time of writing.
Liquidations are often a catalyst for sharp intraday swings: when leveraged short positions are forced out as price rises, buying pressure can accelerate through automated and discretionary rebalancing. While liquidations do not guarantee a sustained trend, they can help explain why Bitcoin climbed quickly through key psychological levels during the session.
Market participants also cited order-book dynamics on major venues. Commentator Exitpump said “price drilling through large asks on Binance perps orderbook is actually sign of strength,” arguing that “chasing bids” were supporting aggressive buyers as BTC moved higher.
“Buyers are back and strong.”
This kind of exchange liquidity reading is closely watched by day traders because it can reveal whether buy pressure is broad and persistent or simply the result of a short-lived burst of market orders.
Rekt Capital’s “green July” view: relief rally possible, but trend risk remains
Beyond the immediate squeeze, longer-cycle chart commentary continued to shape how investors interpret the rally. Trader and analyst Rekt Capital echoed the “green July” idea, referencing a view that Bitcoin may experience a relief move before bearish momentum resumes later.
The prior market framing cited in the coverage suggested a pattern where relief rallies occur in summer months, followed by a return of downtrend pressure into August. In additional commentary, Rekt Capital highlighted that Bitcoin could face headwinds once it flips key moving averages into resistance—specifically pointing to the 50-month exponential moving average (EMA) after a relief advance.
“And once Bitcoin turns the 50 EMA into new resistance on this relief rally, it will likely enter additional Bearish Acceleration over time,”
For investors, the practical takeaway is that the rally’s durability may hinge on whether buyers can keep pushing without triggering the reversal that longer-term chart followers expect. In other words, the macro surprise may be acting as the spark, but the technical path will determine whether it becomes a sustained trend or a tactical bounce.
As July begins, traders will likely keep watching both sides of the equation: further labor and inflation signals that can move expectations for Fed policy, and BTC’s ability to hold above resistance areas such as the $65,000 level referenced by van de Poppe. The combination of ongoing liquidation dynamics and moving-average behavior could decide whether this “green July” starts as a short squeeze—or develops into something more enduring.


TradingView has expanded its market coverage by adding real-time data for Hyperliquid and Trade[XYZ], giving users access to onchain perpetual and spot markets directly through its charting platform.
Summary
- TradingView has added real-time Hyperliquid and Trade[XYZ] market data to its charting platform.
- Users can now track crypto, equities, commodities, forex, and pre-IPO perpetual markets around the clock.
- The integration comes days after Singapore’s MAS placed Hyperliquid on its Investor Alert List.
According to TradingView, the new integration brings live pricing for Hyperliquid’s crypto perpetual and spot markets alongside Trade[XYZ] markets covering equities, commodities, foreign exchange, and pre-IPO companies.
The data is available through TradingView’s Supercharts, allowing traders to follow price movements throughout the day, including when traditional financial markets are closed.
The addition extends the range of assets available on TradingView without requiring users to leave the platform for onchain market data. Hyperliquid markets appear under the HYPERLIQUID symbol prefix, while Trade[XYZ] listings can be accessed using the HIP3XYZ prefix through the platform’s symbol search.
Hyperliquid expands beyond its core exchange
Built on its own layer-1 blockchain, Hyperliquid operates an onchain perpetual futures exchange that currently supports more than 300 perpetual and spot markets across cryptocurrencies, commodities, and indices.
The ecosystem has also grown through HIP-3, a protocol upgrade that allows third-party developers to launch perpetual markets using Hyperliquid’s infrastructure. Under that framework, Trade[XYZ] has become the first major deployment, offering perpetual markets tied to multiple asset classes, including cryptocurrencies, equities, as well as crypto spot trading.
By adding both Hyperliquid and Trade[XYZ] feeds, TradingView has made those markets available alongside its existing charting tools, enabling traders to monitor perpetual contracts and spot assets from a single interface.
Regulatory attention has continued alongside platform growth
The TradingView integration comes days after the Monetary Authority of Singapore added Hyperliquid to its Investor Alert List, as previously reported by crypto.news.
According to the regulator, the listing covers both the Hyper Foundation website and the Hyperliquid trading application. MAS said the Investor Alert List is intended as a consumer protection measure identifying entities that could be mistakenly viewed as licensed or regulated by the authority. The regulator also stated that inclusion on the list does not constitute a ban or an enforcement action.
Following the listing, Hyperliquid said it had never claimed to be licensed or authorized by MAS.
Despite the regulatory attention, the decentralized exchange has remained one of the largest trading platforms in the sector. According to CoinGecko, Hyperliquid ranks as the sixth-largest decentralized exchange by trading volume. Separately, DefiLlama estimates that the protocol currently secures about $5.76 billion in total value locked.
The latest TradingView integration gives market participants another way to follow activity across Hyperliquid’s expanding ecosystem, combining live data from crypto perpetuals, spot assets, and Trade[XYZ]’s cross-asset markets within a single charting environment.
Venice pairs a real product, private, uncensored AI used by millions, with a buy-and-burn token and shrinking emissions. VVV touched $21 in June, then pulled back. Here is the bull case, the bear case, and where VVV could head next.
Summary
- Venice is a private, uncensored generative-AI platform, and VVV is its utility token, used to stake for access to the platform’s AI capacity instead of paying per request.
- VVV stands out among AI tokens for real product traction, with more than 2 million users and millions of monthly visits, plus a buy-and-burn model and staged emissions cuts that add deflationary pressure.
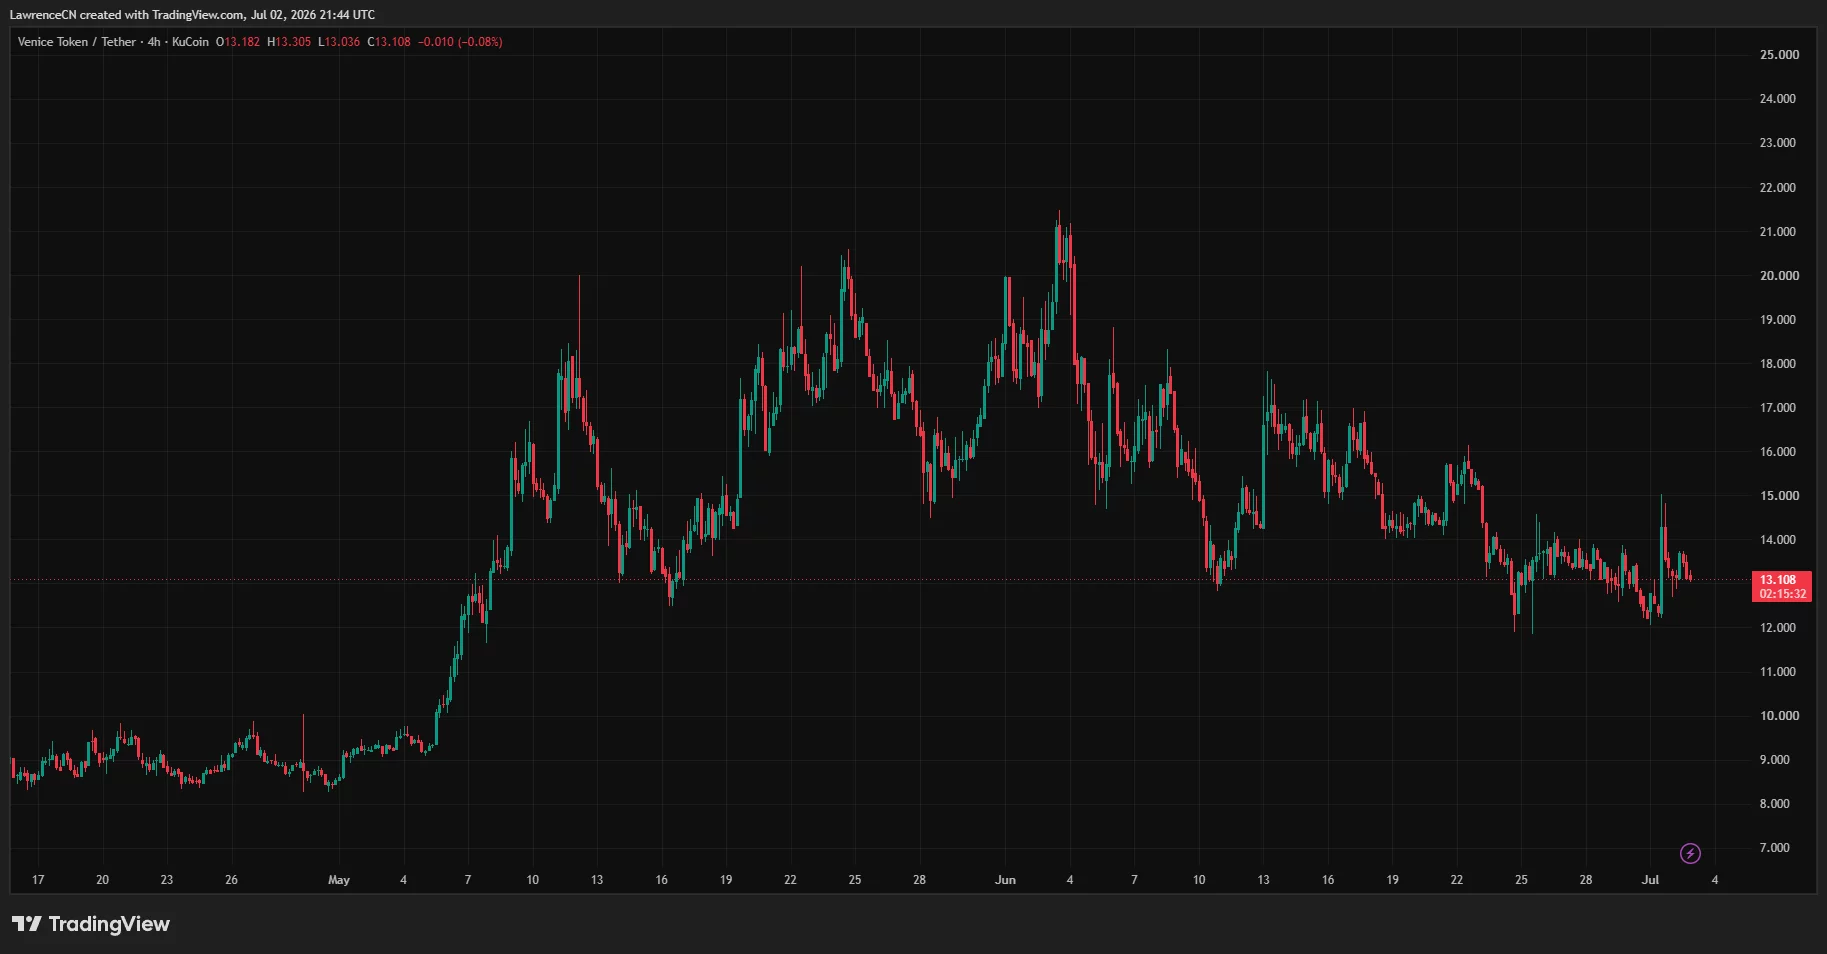
- The token reached an all-time high above $21 in early June 2026 before pulling back into the mid-teens, leaving it below that peak but well above its late-2025 lows.
- The bull case rests on genuine usage, deflationary tokenomics, and the private-AI narrative, while the bear case centers on a weak AI token sector, a history of sharp post-rally retracements, and ongoing token emissions.
- A reclaim of the $21 high is plausible if the AI narrative and burn mechanics align, while a break of support near $14.50 would point back toward the low teens.
Venice and its VVV token occupy an unusual spot in the crypto market: an artificial-intelligence project with an actual product that millions of people use, instead of a token attached to a promise.
VVV climbed to an all-time high above $21 in early June 2026, outperforming Bitcoin over the surrounding month, before retracing into the mid-teens as the AI trade cooled. The combination of real traction, deflationary tokenomics, and a volatile AI narrative makes VVV both compelling and difficult to forecast.
This price prediction covers what Venice is, why VVV is trending, the strongest arguments on each side, the technical picture, and bull, base, and bear scenarios. It is not financial advice, and VVV is a volatile token, so the ranges here are wide.
What is Venice, and why is VVV trending?
Venice is a private, permissionless generative-AI application that lets users produce text, images, and code without accounts, data storage, or surveillance. It emphasizes privacy by keeping conversations on the user’s device and encrypting data in transit, and it positions itself as an uncensored alternative to mainstream AI services that filter outputs and log activity.
VVV is the utility token that powers access to the platform. Instead of paying per request, users, agents, bots, and third-party apps stake VVV to unlock a proportional share of the platform’s inference capacity, and staking can also earn income. In effect, holding and staking VVV is how you buy ongoing access to private AI compute.
What makes VVV unusual among AI tokens is that the product genuinely has users. Venice reports more than 2 million registered users and millions of monthly visits, a level of real traction that most tokens riding the AI narrative simply do not have. That usage matters because it connects the token to an actual service with demand, instead of a roadmap.
When an AI token is backed by a product people use every day, the investment case rests on something more durable than sentiment, even if sentiment still drives the short-term price.
The trend in VVV comes from the intersection of that traction with a strong tokenomic design and a hot narrative. The token surged to an all-time high above $21 in early June 2026, part of a broader wave of interest in AI and privacy-focused crypto, and it has remained one of the more actively searched and discussed tokens since.

The pullback that followed is typical of parabolic moves, but the underlying story, a real private-AI platform with a deflationary token, is why VVV keeps drawing attention instead of fading into the long tail of AI launches.
The bull case for VVV
The bull case begins with product traction that is rare in its category. More than 2 million users and millions of monthly visits give Venice a genuine, revenue-relevant user base, which is exactly what most AI tokens lack. That usage creates real demand for the token, because access to the platform’s AI capacity runs through staking VVV. As more agents, bots, and third-party applications need private, uncensored inference, they have a functional reason to acquire and stake the token, which ties token demand to actual platform adoption rather than to speculation alone.
The second pillar is the tokenomics. Venice uses a buy-and-burn model, where platform revenue is used to buy VVV and remove it from supply, and it has been reducing token emissions in stages, targeting a sharply lower issuance rate, with a further cut scheduled.
Buy-and-burn plus declining emissions is a deflationary combination: it shrinks or slows the growth of supply while usage-driven demand rises. Compared with AI tokens that rely purely on narrative, VVV’s burn mechanics offer structural support that can cushion downturns and amplify upturns, because the supply side is actively working in holders’ favor.
The third pillar is the narrative and the niche. Private, uncensored AI is a distinct and defensible position in a world increasingly worried about surveillance, censorship, and data control. When the AI narrative runs hot, VVV has shown it can move fast, and its differentiated positioning gives it a story that resonates beyond generic AI exposure.
Sitting within an active ecosystem and maintaining strong trading volume adds liquidity to that story. The bull case is that Venice is one of the few AI tokens with real usage, deflationary tokenomics, and a defensible niche, and that a return of the AI trade could carry VVV back to and beyond its highs.
The bear case for VVV
The bear case starts with the sector. Artificial-intelligence tokens have been among the weaker performers in 2026, and a token is not immune to its category: when the AI trade cools, even fundamentally stronger names like VVV get pulled down. If capital continues rotating out of AI tokens, VVV faces a headwind that its product traction cannot fully offset in the short term, because sentiment and sector flows dominate price action over weeks and months even when fundamentals are sound.
The second problem is VVV’s own volatility and history of sharp retracements. The token has a documented pattern of retracing meaningfully after parabolic moves, and its price history is a series of dramatic swings, including an earlier all-time high, a deep decline to near $1, and then a fresh high many months later. That kind of boom-and-bust behavior means buying after a rally carries real risk of a large drawdown, and the move to $21 was itself parabolic. Entry timing relative to the trend matters enormously for a token that can shed a third or more of its value in a normal correction.
The third pressure is on the supply side, which is a double-edged sword. While buy-and-burn and emissions cuts are deflationary forces, VVV still has ongoing token emissions and does not have a hard-capped supply in the way some assets do, so new tokens continue to enter circulation even as the rate slows.
If usage-driven burns fail to keep pace with emissions, or if platform revenue softens, the deflationary thesis weakens. Add competition from the many other AI and privacy tokens vying for the same narrative and capital, and the bear case is that VVV is a strong project whose token remains hostage to a weak sector, its own volatility, and the need for burns to outrun emissions.
The technical picture
VVV’s chart is defined by its June 2026 peak and the pullback that followed. The token set an all-time high above $21 in early June, then retraced into the mid-teens, a decline of roughly a quarter to a third from the top that fits its familiar pattern of post-rally corrections. Despite that pullback, VVV has held well above its late-2025 lows near $1, and over the surrounding month it outperformed Bitcoin, so the medium-term structure has been constructive even as the short-term move cooled.
The levels traders are watching are clear. On the downside, support sits around $14.50, with a deeper level near $12; losing $14.50 would suggest the correction has further to run toward the low teens. On the upside, resistance stands near $18.30, then around $20.40, and finally the all-time high above $21; reclaiming those in sequence would signal renewed momentum. Momentum readings have been broadly neutral, with the token holding above its longer-term moving average, which points to an intact broader uptrend even during the consolidation. That mix, a neutral short-term posture inside a constructive longer-term structure, describes a token digesting a big move instead of breaking down.
The honest technical read is that VVV is consolidating beneath its all-time high, bounded by support near $14.50 and resistance running up to the $21 peak. As with any volatile token, these levels are guides rather than certainties, and a shift in the AI narrative or the broader market can override the chart quickly.
For a price prediction, the technicals frame a wide band: a hold of support keeps a run back toward the highs on the table, while a break of $14.50 tilts the odds toward a deeper retracement into the low teens.
What could move VVV next
The clearest token-specific catalyst is the emissions schedule and burn rate. Venice has been cutting emissions in stages, with a further reduction planned, and each cut tightens supply. If those cuts land while platform usage and revenue keep the buy-and-burn engine running, the deflationary pressure builds, which is supportive for price.
The metric to watch is whether burns are outpacing emissions on a net basis, because that balance determines whether the token’s supply is actually shrinking or merely growing more slowly.
The second driver is user and usage growth. Because token demand is tied to staking for platform access, continued growth in Venice’s user base, and in the agents and applications that need private inference, translates into structural demand for VVV. Evidence that the more than 2 million user base is expanding, and that more third-party demand is flowing through staking, would strengthen the fundamental case. Stagnating usage would do the opposite, leaving the token more dependent on narrative.
The third set of catalysts is external: the AI narrative and the broader market. VVV is sensitive to how the AI token sector trades, so a rotation of capital back into AI would lift it, while continued weakness in the sector would weigh on it regardless of fundamentals. The ecosystem VVV sits within, and its overall liquidity also matter, as does the macro backdrop that sets risk appetite across all of crypto.
The interplay of tightening supply, growing usage, and a recovering AI narrative is the combination that could push VVV back toward its highs, while the absence of any of them keeps it consolidating or sends it lower.
How VVV compares to other AI tokens
To judge VVV fairly, it helps to place it against the wider field of artificial-intelligence tokens, because that comparison is where its case is strongest and its risks are clearest. The defining feature of most AI tokens is that they are narrative first and product second: they attach a token to the idea of AI, often with little real usage, revenue, or working software behind it.
In a strong AI market, these tokens can run hard on story alone, but they have little to fall back on when sentiment turns, which is part of why the AI token sector as a whole has been weak in 2026. Against that backdrop, the single most important thing about VVV is that Venice is a real, used product, not just a narrative.
That product traction is VVV’s main differentiator. A platform with more than 2 million users and millions of monthly visits generates the kind of genuine demand that most AI tokens cannot claim, and because access to the platform runs through staking VVV, that usage connects directly to token demand.
Where a typical AI token asks buyers to believe a future will arrive, VVV points to a service people already use for private, uncensored inference today. That does not make it immune to the sector’s swings, but it gives it a floor of real utility that narrative-only tokens lack, and it is the reason VVV tends to be discussed as one of the more fundamentally grounded names in the category.
The tokenomics deepen the contrast. Many AI tokens have inflationary or loosely defined supply schedules that work against holders, whereas VVV pairs a buy-and-burn mechanism with staged emissions cuts, actively tightening supply as usage grows. That combination of real demand and shrinking or slowing supply is uncommon among AI tokens and is the structural reason bulls argue VVV can outperform its peers over a full cycle. The catch, as always, is that the burns have to keep pace with ongoing emissions for the deflationary story to hold, so the comparison is favorable but conditional.
The honest conclusion is that VVV screens as one of the stronger AI tokens on fundamentals, but it still lives inside a weak and volatile sector. Being the best house on a bad street helps on a relative basis and offers some downside cushion, but it does not fully protect a token when capital rotates out of AI entirely.
For anyone weighing VVV, the comparison cuts both ways: its real product and deflationary design set it apart from the narrative-only crowd, while its membership in a struggling sector means it can still fall with its peers regardless of how it stacks up against them.
Venice price prediction scenarios
Because VVV is a volatile token whose price depends heavily on the AI narrative and its own supply dynamics, the most honest forecast is a set of scenarios rather than a single figure. The levels below are illustrative reasoning based on the drivers and technicals above, not guarantees, and VVV can move outside these ranges quickly.
Bull case
In the bull scenario, the AI narrative reignites, capital rotates back into AI tokens, and Venice’s user growth continues while its emissions cuts and buy-and-burn tighten supply on a net basis. Demand for staking rises as more agents and applications need private inference, and the deflationary tokenomics amplify the move. In this case, VVV reclaims resistance near $18.30 and $20.40 and pushes back to and potentially beyond its all-time high above $21, with further upside if the supply keeps shrinking against rising usage. This is the reward side of owning an AI token with real traction and deflationary mechanics.
Base case
In the base scenario, Venice remains a strong product in a mixed market, with steady but not explosive user growth and an AI sector that trades sideways. Burns roughly offset emissions, and the token consolidates beneath its all-time high, ranging between support near $14.50 and resistance around $18 to $20 without a decisive breakout. This is a digestion outcome, where VVV holds its medium-term gains and waits for a clearer catalyst from either the AI narrative or its own supply dynamics. Given the current environment, this range-bound path is a realistic central expectation.
Bear case
In the bear scenario, the AI token sector stays weak, capital keeps rotating away from AI, and VVV follows its category lower despite its fundamentals. Usage growth stalls, burns fail to outpace emissions, and the token’s history of sharp post-rally retracements plays out again. Support near $14.50 breaks, and VVV slides toward the low teens or lower, giving back much of its June rally. For a volatile AI token in a hostile sector, this downside is real, which is why timing and risk management weigh heavily on any position instead of any single target.
Frequently Asked Questions
What is Venice (VVV)?
Venice is a private, uncensored generative-AI platform that lets users create text, images, and code without accounts, data storage, or surveillance, keeping conversations local and encrypting data in transit. VVV is its utility token: instead of paying per request, users, agents, and applications stake VVV to access a share of the platform’s AI capacity, and staking can earn income. Holding and staking VVV is effectively how you buy ongoing private AI access.
Why is VVV trending?
VVV is trending because it combines rare product traction with strong tokenomics and a hot narrative. Venice has more than 2 million users and millions of monthly visits, unusual for an AI token, and VVV uses a buy-and-burn model with staged emissions cuts. The token surged to an all-time high above $21 in early June 2026 during a wave of AI and privacy interest, and it has remained heavily searched and discussed since.
Can VVV reach $21 again?
It is plausible but not guaranteed. Reclaiming the $21 all-time high would likely require
the AI narrative to reignite, Venice’s usage to keep growing, and its emissions cuts and
burns to tighten supply on a net basis. VVV would need to clear resistance near $18.30
and $20.40 first. Because the token is volatile and sensitive to the AI sector, it could
return to that level in a strong phase or fall further in a weak one.
How do Venice’s tokenomics work?
Venice uses a buy-and-burn model, where platform revenue buys VVV and removes it from supply, combined with staged reductions in token emissions. Together, these create deflationary pressure by shrinking or slowing supply growth. On the demand side, access to the platform’s AI capacity requires staking VVV, so usage translates into token demand. The key question is whether burns outpace ongoing emissions on a net basis.
What are the biggest risks for VVV?
The main risks are a weak AI token sector that can drag VVV down regardless of fundamentals, the token’s history of sharp retracements after parabolic moves, and ongoing emissions that require burns to keep pace to preserve the deflationary thesis. Competition from other AI and privacy tokens and the token’s general volatility add to the risk, so entry timing and position sizing matter a great deal.
Is VVV a good investment?
That depends on your risk tolerance and research, and this is not financial advice. VVV offers exposure to a rare AI token with real product traction and deflationary tokenomics, but it is volatile, sensitive to a weak AI sector, and prone to large drawdowns after rallies. Anyone considering it should weigh the strong fundamentals against the sector and volatility risks and size any position accordingly.
What levels should I watch for VVV?
On the downside, support sits around $14.50, with a deeper level near $12; a break of $14.50 would suggest a further slide toward the low teens. On the upside, resistance runs near $18.30, then around $20.40, and finally the all-time high above $21. Reclaiming those levels in sequence would signal renewed momentum. The token holding above its longer-term moving average points to an intact broader uptrend.
What could push VVV higher from here?
The main catalysts are the emissions cuts and burn rate tightening supply on a net basis, continued growth in Venice’s user base and in third-party demand that flows through staking, and a rotation of capital back into the AI token sector. A recovering broader market that lifts risk appetite would help too. The combination of shrinking supply, rising usage, and a warmer AI narrative is what could carry VVV back toward its highs.
Disclaimer: This article is for information and educational purposes only and does not constitute financial, investment, or trading advice. Price predictions are speculative scenarios, not guarantees, and VVV is a volatile asset that can lose value rapidly. Nothing here is a recommendation to buy or sell any asset. Always do your own research and consider consulting a qualified financial professional before making investment decisions. Information is accurate as of July 2, 2026, and will change.

SLX exploded onto Korean exchanges, spiked to $0.47, then gave most of it back. Behind the volatility sits a Solana yield protocol with real total value locked. Here is the bull case, the bear case, and where SLX could go next.
Summary
- Solstice is a Solana-native yield protocol built around institutional-style strategies and its own USX stablecoin, and SLX is its governance and utility token, launched in early 2026.
- SLX drew heavy attention through rapid listings on major exchanges including Upbit and Bithumb, spiking to an all-time high near $0.47 before pulling back sharply into the high-teens to low-thirties cents.
- The bull case rests on genuine total value locked, deep exchange liquidity, Solana ecosystem momentum, and a fixed token supply, which set Solstice apart from purely speculative launches.
- The bear case centers on vesting-driven sell pressure, the token’s short and unproven history, extreme volatility, and its exposure to Solana and the broader risk-off market.
- The realistic path for SLX is wide: a reclaim toward $0.47 is possible if total value locked keeps growing, while a break of key support near $0.20 would open the door to launch-era lows.
Solstice and its SLX token became one of the few things moving in a bruised crypto market, spiking more than 50% in a single day at one point and drawing intense trading volume across Korean and global exchanges.
Behind the price action is a Solana-based yield protocol that, unlike many recent launches, arrived with a working product and real capital already flowing through it. That combination of genuine fundamentals and violent volatility is exactly what makes SLX interesting and hard to forecast.
This price prediction walks through what Solstice is, why SLX is trending, the strongest arguments on both sides, the technical picture, and a set of bull, base, and bear scenarios. None of it is financial advice, and SLX is a small, volatile asset, so the ranges here are wide by necessity.
What is Solstice, and why is SLX trending?
Solstice is a decentralized finance protocol built on Solana that positions itself as a yield layer, bringing institutional-style strategies on-chain instead of chasing meme-driven hype. Its approach centers on strategies such as delta-neutral funding trades and tokenized credit exposure, the kind of yield generation that has traditionally lived outside public blockchains.
At the center sits USX, the protocol’s native stablecoin, which supports lending, yield, and capital-efficient strategies across the Solana ecosystem. SLX is the governance and utility token that powers all of this, and a staked version, stSLX, is already live through integrations such as Exponent Finance.
What separates Solstice from the long tail of small-cap launches is that it came to market with a real product and real capital. The protocol reported total value locked in the hundreds of millions of dollars around its 2026 launch, with staking infrastructure securing over $1 billion in validator operations. That is a genuine fundamental backdrop, not a promise, and it is the main reason serious traders have paid attention instead of dismissing SLX as another listing pump. The token also has a fixed supply, which matters for any long-term valuation argument.
The trending began with distribution. SLX listed rapidly across major venues, with Upbit adding a Korean won pair and Bithumb, OKX, Bybit, Kraken, Gate, and others following within days, plus futures markets on several large exchanges. That breadth of liquidity, combined with strong Korean retail demand, produced enormous volume and sharp moves, including a spike to an all-time high near $0.47 and a later single-day surge of more than 50% on hundreds of millions of dollars in volume.
The token has since pulled back well off that high, which sets up the central question: was the spike a first taste of price discovery for a real protocol, or a listing-driven pump that is now fading?
The bull case for SLX
The bull case starts with the product being real. Solstice is not a whitepaper promise; it is a protocol with meaningful total value locked and a functioning stablecoin in USX, generating the kind of on-chain activity that can support a token’s value beyond speculation. In a market crowded with launches that have no users and no revenue, a Solana yield protocol with hundreds of millions of dollars locked and over $1 billion in secured validator operations stands out. If that total value locked keeps growing, it provides a fundamental floor under SLX that pure momentum tokens lack.
The second pillar is liquidity and reach. SLX is not stranded on one exchange; it trades across Upbit, Bithumb, OKX, Bybit, Kraken, and more, with active futures markets. That multi-exchange presence, and the strong Korean demand that has driven much of the volume, means SLX can attract capital from many directions and can move fast when sentiment turns positive. Deep, distributed liquidity is a real asset for a young token, because it lowers the friction for new buyers and supports larger positions without extreme slippage.
The third pillar is the Solana ecosystem itself. Solstice is a bet on Solana, and Solana has its own momentum, with major protocol upgrades in progress and spot Solana exchange-traded funds already drawing inflows even during the downturn. If Solana strengthens, its native yield protocols benefit from rising activity and capital, and SLX is positioned squarely in that flow as an institutional-yield and stablecoin play. Add a fixed token supply and a live staking mechanism through stSLX, and the bull case is that SLX is an early-stage bet on real Solana yield infrastructure, with room to reprice higher if adoption compounds and the market rotates back toward risk.
The bear case for SLX
The bear case is equally concrete, and it starts with sell pressure baked into the token’s design. Solstice used vesting mechanics tied to its early reward programs, and those mechanics have created real, forced selling. Users who chose vesting options faced deadlines and requirements to maintain total value locked or risk losing unclaimed tokens, which forces decisions that ripple through the market in short, sharp bursts. When early participants are pushed to claim, sell, or restructure positions on a schedule, that overhang weighs on price regardless of how good the underlying protocol is.
The second problem is that SLX is new and unproven over any meaningful time horizon. It launched in 2026, so it has no track record across a full market cycle, no history of how its yield strategies perform under stress, and no evidence yet that its total value locked is sticky rather than mercenary capital chasing incentives. Delta-neutral and tokenized-credit strategies carry their own risks, and a young protocol has not been tested by a genuine crisis. Small market capitalization compounds this: a token this size can move violently in both directions, and the same volatility that produced a 50% up-day can produce equally brutal declines.
The third pressure is external. As a small-cap token, SLX is highly sensitive to the broader market, and small caps are typically hit first and hardest when risk appetite fades. The wider crypto market entered the second half of 2026 off its worst month on record, with macro headwinds from a hawkish Federal Reserve and tight liquidity, and in that environment speculative Solana tokens are vulnerable. SLX also depends heavily on Solana; any weakness in the ecosystem, or a rotation away from it, pulls SLX down with it. The bear case is that the listing-driven spike was the peak of attention, and that vesting overhang plus a hostile macro backdrop grinds the token back toward its launch-era lows.
The technical picture
The chart tells a story of a sharp discovery phase followed by a deep retracement. SLX reached an all-time high near $0.47 in its early weeks, driven by listing momentum and Korean demand, then fell hard as that initial euphoria faded and vesting pressure kicked in.
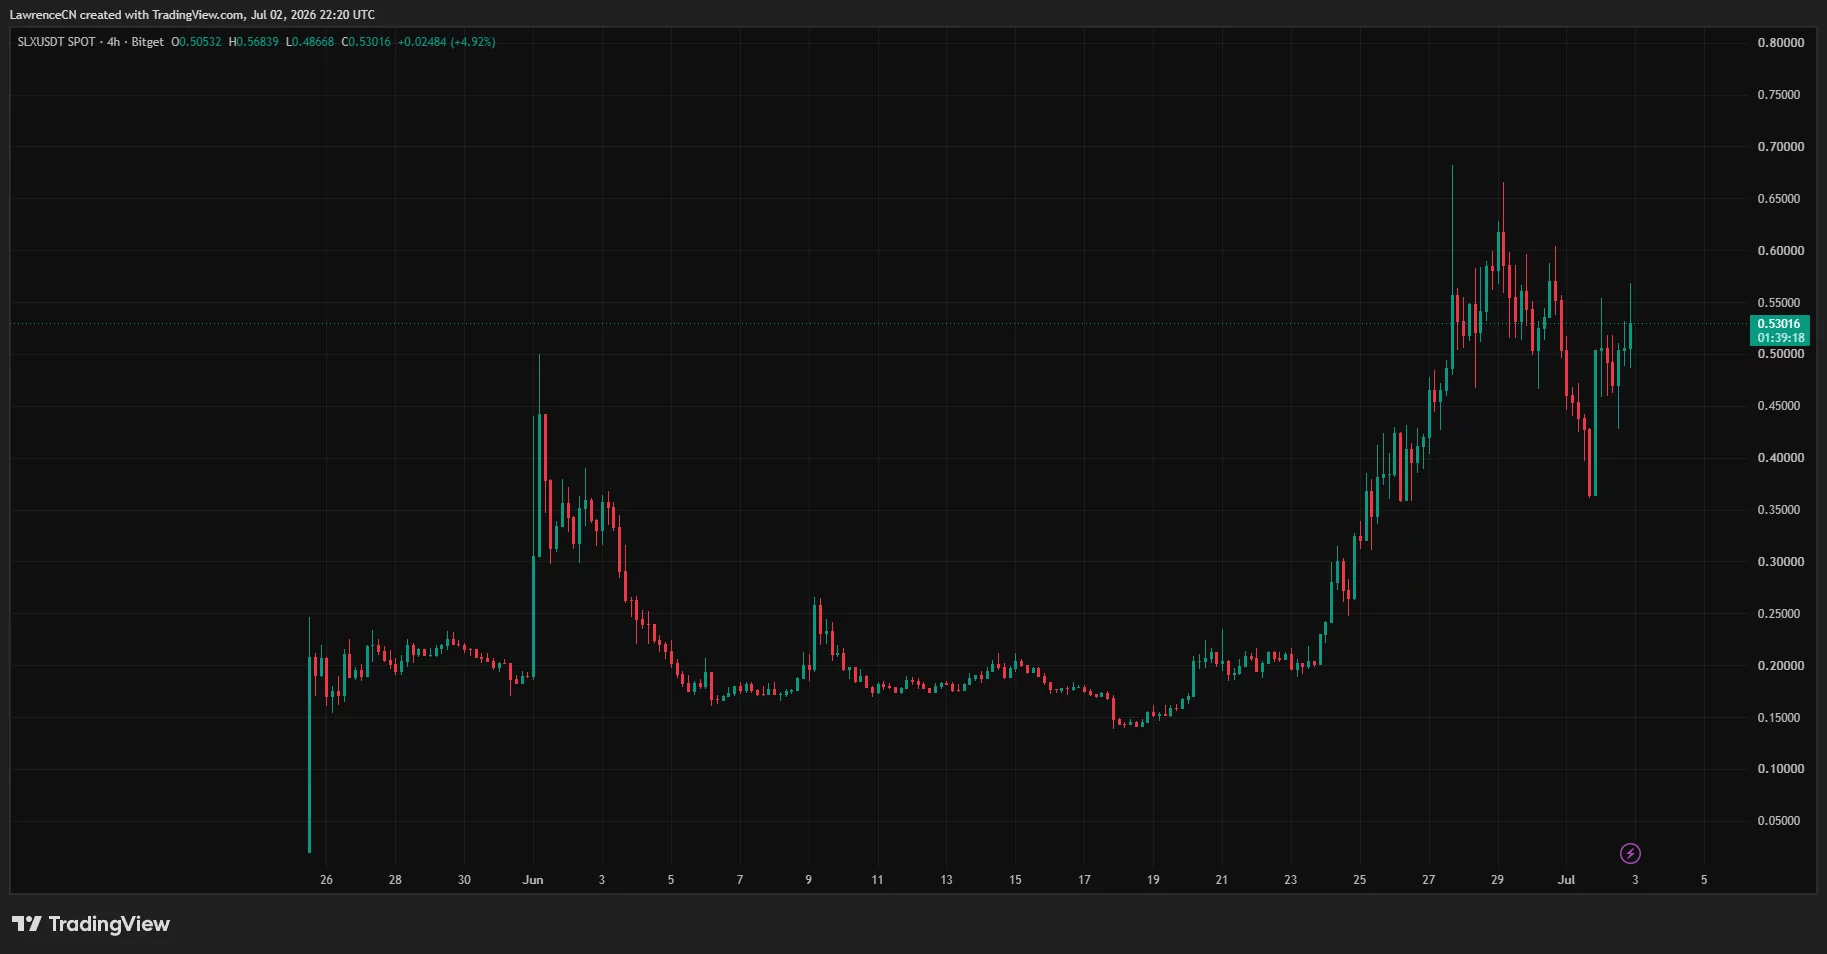
Along the way, it printed dramatic moves, including a single-day surge of more than 50% to around $0.26 on roughly $253 million in volume, the kind of volatility that defines a young, thinly seasoned token in active price discovery. Since the high, the token has traded well below it, at times slipping into the high teens in cents.
The key level bulls and bears are watching is support around $0.20. That zone has acted as a line in the sand: holding it keeps a recovery structure intact, while a decisive break below it signals that the earlier bounce was just a bounce and opens the path toward launch-era lows. On the upside, the token has to reclaim and hold higher ranges before the $0.47 all-time high comes back into view, and doing so would require sustained volume and improving sentiment rather than a single spike. Momentum indicators have swung with the price, reflecting a token that has not yet settled into a stable trend.
The honest read of the technicals is that SLX is in an unresolved range beneath its all-time high, with $0.20 as the pivotal support and the high near $0.47 as the reference resistance. Because the token is young and volatile, technical levels are less reliable than they are for seasoned assets, and a single macro or protocol catalyst can override the chart.
For a price prediction, the technicals mostly define the boundaries: a wide zone between the low-twenties cents on the downside and the high-forties on the upside, with the resolution depending on fundamentals and market conditions more than on any pattern.
What could move SLX next
Several specific catalysts will likely decide which way SLX breaks. The most important is total value locked. Because Solstice’s entire investment thesis rests on being a real yield protocol, the trajectory of its total value locked is the single best signal to watch.
Growing total value locked, especially if it proves sticky after incentive programs wind down, would validate the fundamental case and support a higher token price. Shrinking total value locked, or evidence that the capital was purely mercenary, would undercut the whole argument. Adoption of the USX stablecoin is part of the same story, since real usage of USX in lending and yield is what turns Solstice from a launch into a lasting protocol.
The second driver is the vesting and unlock schedule. Because forced selling from vesting has already pressured the token, the timing and size of upcoming unlocks matter directly. Periods of heavy unlocking are headwinds; periods where supply pressure eases give the token room to recover. Traders watching SLX should track the schedule closely, because unlocks are among the most predictable sources of selling for a young token.
The third set of catalysts is external: Solana and the macro backdrop. Strength in Solana, whether from protocol upgrades, exchange-traded-fund inflows, or a broad rotation back into the ecosystem, would lift SLX, while Solana weakness would drag it down. Above that sits the overall market, where macro signals like inflation data and Federal Reserve policy set the risk appetite that small caps live and die on.
Continued Korean exchange demand is a further wildcard, since that flow has driven much of SLX’s volume and could reignite momentum or fade. The interplay of protocol growth, unlock pressure, Solana health, and macro risk appetite is what will move SLX from here.
Is SLX a trade or a long-term hold?
One of the most useful ways to think about SLX is to separate the short-term trade from the long-term thesis, because they are governed by very different forces. As a short-term trade, SLX is a momentum and liquidity story. Its price has been driven by listing events, Korean exchange demand, volume spikes, and vesting-related selling, and those forces produce sharp, fast moves in both directions.
A trader focused on this timeframe cares about volume, the $0.20 support, unlock dates, and shifts in market risk appetite, and treats the token as a high-volatility instrument to be sized small and managed tightly. On this horizon, fundamentals matter less than flows, and the biggest risk is being caught on the wrong side of an unlock or a broad risk-off move.
As a long-term hold, SLX is a bet on Solstice becoming durable Solana infrastructure. That thesis rests on whether the protocol’s total value locked proves sticky after incentives fade, whether USX earns real adoption as a stablecoin, and whether Solstice’s institutional-yield strategies keep working across market conditions.
A long-term holder is effectively wagering that a real yield protocol with genuine capital will grow into and beyond its current valuation as Solana matures, and is willing to sit through severe volatility to get there. On this horizon, the daily chart matters far less than the trajectory of the fundamentals.
The two views can point in opposite directions at the same moment. A token can look dangerous as a short-term trade, with unlocks looming and momentum fading, while looking attractive as a long-term accumulation if you believe in the protocol, or the reverse, with strong short-term momentum masking a fragile long-term case.
This is why a single price target is misleading for an asset like SLX: the right answer depends on whether you are trading the flows or investing in the protocol. Being honest with yourself about which one you are doing is the most important risk decision, more important than any level on the chart.
For most people, the practical takeaway is to match position size and time horizon to conviction. If the interest is the trade, keep positions small, respect the levels, and watch the unlock schedule and macro closely. If the interest is the long-term protocol thesis, the questions that matter are about total value locked, USX adoption, and Solana’s health over quarters and years, not about this week’s candle. Blurring the two, holding a trade that went wrong as if it were a long-term investment, or trading in and out of a position meant to be a multi-quarter thesis, is how small-cap tokens do the most damage to a portfolio.
Solstice price prediction scenarios
Because SLX is a young token with limited price history, the most honest approach is to frame scenarios instead of pretending precision. The ranges below are illustrative and built from the drivers discussed above, not guarantees. SLX can move well outside them if the market or Solana shifts suddenly.
Bull case
In the bull scenario, Solstice proves that its total value locked is durable rather than incentive-driven, USX adoption keeps expanding, and Solana remains one of the strongest ecosystems in crypto. Vesting-related sell pressure fades, Korean demand stays healthy, and broader market sentiment improves as liquidity returns to crypto. Under those conditions, SLX reclaims the higher trading ranges, breaks back through resistance, and retests the all-time high near $0.47. If protocol growth continues beyond expectations, price discovery above that level becomes possible, supported by a fixed token supply and expanding usage instead of listing hype alone.
Base case
In the base scenario, the protocol continues growing but at a slower pace than the market hoped. Total value locked remains stable, USX adoption gradually improves, and vesting pressure offsets much of the organic demand. Solana performs reasonably well without entering another major bull phase, leaving SLX trading inside a broad range between roughly $0.20 support and the low-$0.30s. This is the “working protocol, patient market” outcome where fundamentals improve faster than price.
Bear case
In the bear scenario, total value locked begins falling as incentive capital leaves, unlock-related selling continues weighing on the token, and Solana weakens alongside the broader crypto market. The $0.20 support fails, sending SLX back toward launch-era lows as speculative interest fades. Because the token is still early in its life cycle, confidence could deteriorate quickly if growth slows or the macro backdrop remains hostile. This outcome does not require the protocol to fail; it only requires demand to remain weaker than the ongoing supply pressure.
Frequently Asked Questions
What is Solstice (SLX)?
Solstice is a decentralized finance protocol built on Solana that focuses on institutional-style yield strategies. It combines products such as delta-neutral strategies, tokenized credit exposure, and its USX stablecoin to create capital-efficient yield opportunities. SLX is the protocol’s governance and utility token, while stSLX represents the staked version used within the ecosystem.
Why is SLX trending?
SLX gained attention after listing on major exchanges including Upbit, Bithumb, OKX, Bybit, Kraken, and others in quick succession. Strong Korean trading activity, high volume, and a rapid move toward an all-time high near $0.47 pushed the token into the spotlight. Unlike many new launches, Solstice also arrived with meaningful total value locked, giving traders a real protocol to evaluate instead of only speculation.
Can SLX return to $0.47?
A move back to the all-time high is possible but depends on several conditions. Solstice would need to continue growing its total value locked, expand USX adoption, reduce the impact of vesting-related selling, and benefit from a stronger Solana ecosystem and broader crypto recovery. Without those factors aligning, the token could remain below its previous peak for an extended period.
What are the biggest risks for SLX?
The largest risks include vesting-related sell pressure, the protocol’s limited operating history, heavy dependence on Solana, and overall crypto market weakness. Because SLX is a relatively small-cap asset, it can experience much larger swings than established cryptocurrencies, making volatility an important consideration.
Why does total value locked matter?
Total value locked measures how much capital users have committed to the protocol. Rising total value locked suggests growing adoption and confidence, while falling total value locked can indicate users are withdrawing funds or incentives are no longer attracting capital. For Solstice, it is one of the most important indicators of whether the protocol is building lasting value.
Is SLX a long-term investment or a short-term trade?
It can be either, depending on the strategy. Short-term traders generally focus on exchange flows, unlock schedules, volume, and technical levels such as the $0.20 support. Longer-term investors are betting on Solstice becoming important infrastructure within the Solana ecosystem through sustained growth in total value locked, USX adoption, and institutional-style yield products.
What levels should traders watch?
Support around $0.20 remains the key downside level. Holding above it keeps the recovery structure alive, while losing it could send the token back toward launch-era prices. On the upside, reclaiming the low-$0.30 range would improve momentum, with the all-time high near $0.47 remaining the major resistance level.
What could drive SLX higher?
The strongest catalysts would be continued growth in total value locked, broader adoption of the USX stablecoin, easing vesting pressure, stronger activity across the Solana ecosystem, and improving macro conditions that bring capital back into higher-risk crypto assets.
Disclaimer: This article is for informational and educational purposes only and does not constitute financial, investment, or trading advice. Cryptocurrency prices are highly volatile, and forecasts are speculative rather than guaranteed. Nothing in this article should be considered a recommendation to buy or sell any asset. Always conduct your own research and consult a qualified financial professional before making investment decisions. Information is accurate as of July 2, 2026, and may change.
Bitcoin rises amid Fed inflation talks: Bull trap or $65K next?
Bitcoin (BTC) reacted positively to US Federal Reserve Chair Kevin Warsh’s remarks on stubborn inflation. Despite the gains on Wednesday, traders fear that incentives for fixed-income investments and strong earnings momentum in tech stocks will continue to pressure non-yield-bearing assets like cryptocurrencies.
The US five-year Treasury yield jumped to 4.22%, meaning traders demanded higher returns to hold government bonds. Even as inflation eventually eases and WTI crude oil prices fell to a 4-month low, investors anticipate monetary expansion.
Regardless of how the Fed manages interest rates and its balance sheet, the US Treasury dictates debt issuance trends.
Bitcoin bounces off 21-month low, but leverage data signals caution: Was $57K the bottom?
Bitcoin (BTC) is trading at around $61,490 at the time of publication after falling to a 21-month low of $57,737 earlier on Wednesday.
Ether (ETH) and Solana (SOL) also gained, up 3% and 4.85%, respectively.
The bounce took place amid deep investor caution, with sentiment trackers gauging the balance of fear and greed in crypto markets currently reading around 11 out of 100, which is in “Extreme Fear” territory. Despite the rebound from the yearly low, Bitcoin remains down roughly a third since the start of the year.
Investors’ cautious stance shows up clearly in the institutional products. US spot Bitcoin exchange-traded funds (ETFs) have hemorrhaged funds in recent weeks, including a reported $4.5 billion total outflow in June, the largest since the ETFs launched.
Related: Bitcoin price taps new July high above $62K on weak US jobs data
Analyst warns BTC could drop further after worst June since 2022
Bitcoin could face further downside pressure after ending June below its 200-week moving average while still trading above its realized price, a combination that crypto analyst PlanB says suggests the market has yet to reach a bear market bottom.
Bitcoin fell 20.5% in June to close the month at $58,526 — its worst monthly performance since June 2022 — below its 200-week moving average of $62,000 but above its realized price of $52,000.
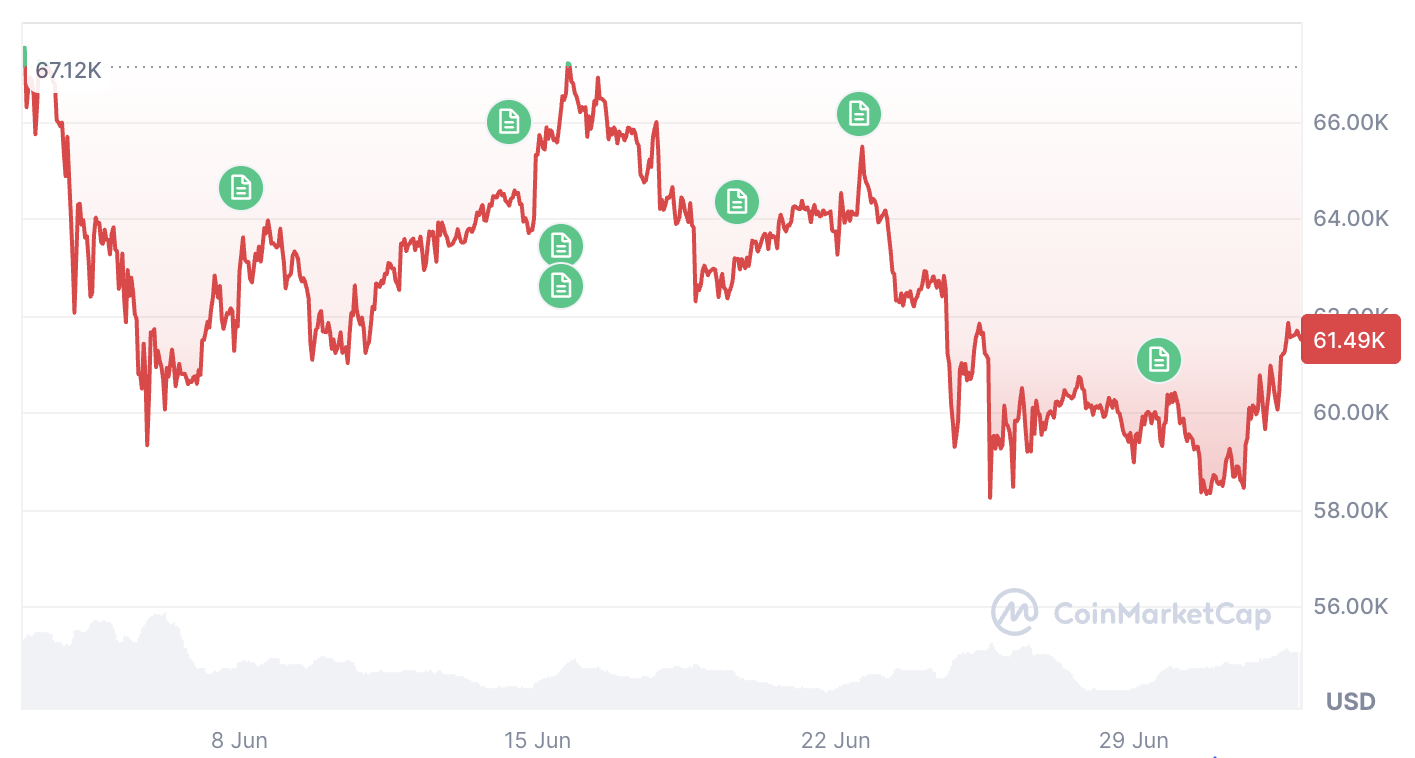
Bitcoin is down 8.80% over the past 30 days. (CoinMarketCap)
“ALL previous bear market bottoms were below realized price,” said PlanB, the creator of the stock-to-flow pricing model. He added in a separate post that Bitcoin could drop to $52,000.
Ether treasury Sharplink bought $16M ETH last week
Crypto treasury company Sharplink, which resumed buying Ether last week after an eight-month pause, has bought a total of $16 million worth of Ether since June 25.
Onchain data from Arkham shows that after Sharplink bought 5,000 ETH on June 25, it bought another 5,000 ETH (worth $8.5 million) on June 26.
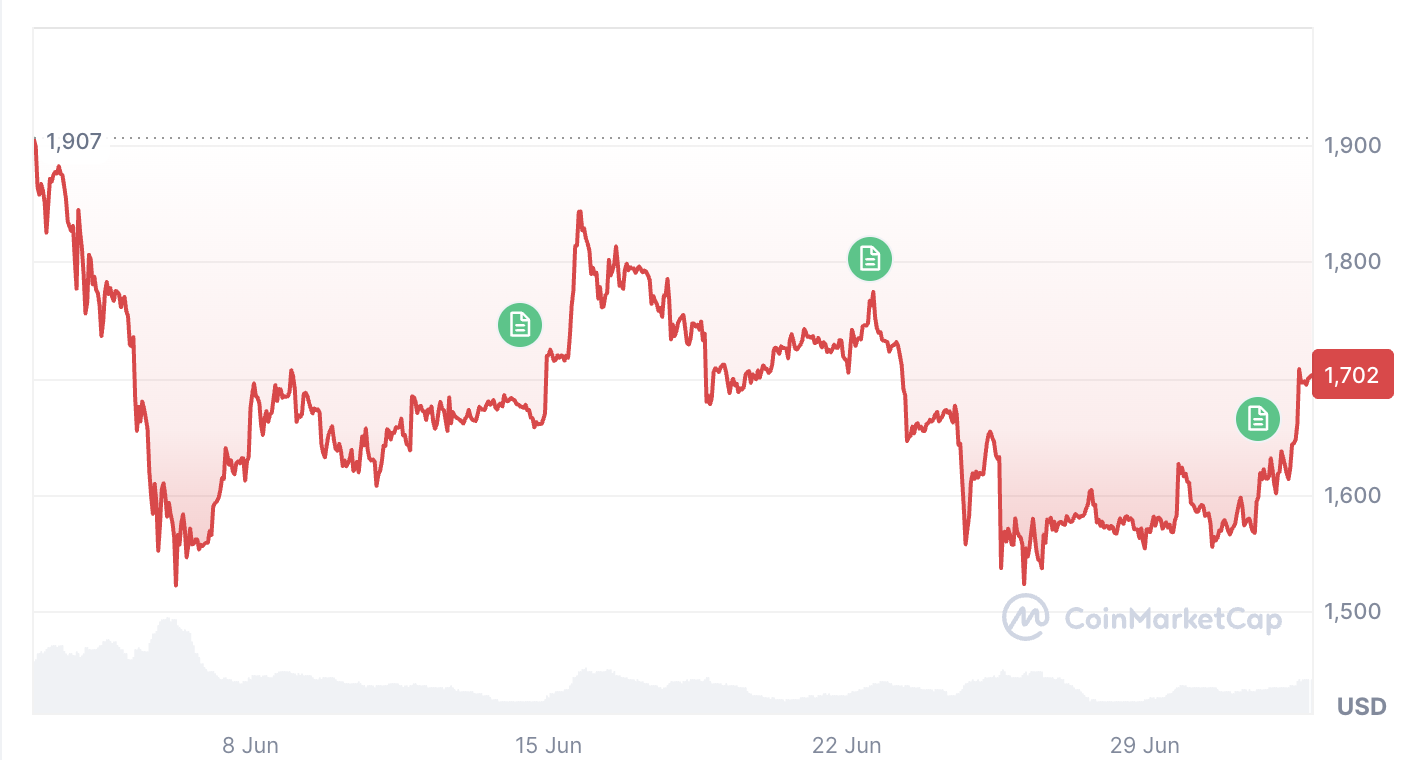
Ether is down 10.73% over the past 30 days. (CoinMarketCap)
The company confirmed the ETH purchases in an announcement, adding it bought it at an average price of $1,611 per ETH.
The two-day buying spree adds to evidence that Sharplink has revived its active Ether accumulation strategy, with its total Ether holdings now at 866,725 ETH. The crypto treasury company was once a close competitor to Bitmine as the world’s largest ETH treasury company, but has fallen far behind.
“The Company’s ETH purchases reflect its continued commitment to growing its ETH treasury as a long-term reserve asset,” it said in a statement on Tuesday.
Crypto enters Q3 with thinner liquidity but less leverage after Q2 reset: Talos
Cryptocurrency markets entered the third quarter of 2026 with less leverage but thinner liquidity after a wave of liquidations cleared speculative positions while major sources of demand weakened during the second quarter.
According to a market update from institutional data provider Talos, Bitcoin (BTC) and Ether (ETH) long liquidations totaled $8.35 billion in Q2. The data provider pointed out that the deleveraging coincided with spot Bitcoin exchange-traded fund (ETF) outflows, reduced Bitcoin buying by Strategy and a contraction in stablecoin supply.
While the reset left the market more stable heading into Q3, Talos said reduced order-book depth weakened its ability to absorb renewed selling pressure. This means the market could be less vulnerable to a chain reaction of forced selling, but prices may still swing sharply because there’s less trading activity to absorb large orders.
Features: Has Strategy’s capital overhaul put an end to ‘death spiral’ fears?
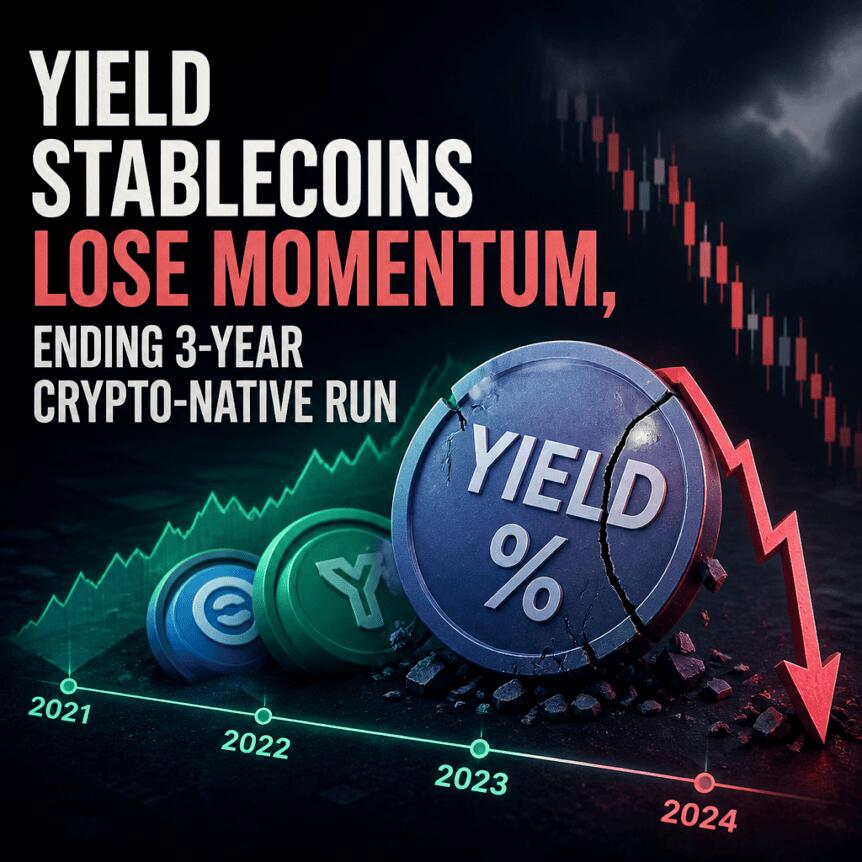
Stablecoin supply contracted in the second quarter of 2026, undoing almost three years of consistent quarterly growth and underscoring a growing split between crypto-native yield products and offerings backed by traditional reserves. According to a Q2 2026 stablecoin report published by crypto exchange CEX.IO, the category fell 15% in Q2—by more than $3.5 billion—marking the first quarterly decline since Q3 2023.
The shift was driven by reductions in yield-bearing, crypto-issued tokens, even as treasury-backed stablecoin yield products gained ground. CEX.IO’s figures point to a total stablecoin supply of $312 billion in Q2 and an adjusted transaction volume decline of 5.5%, alongside meaningful weakness in overall transaction counts.
Key takeaways
- Stablecoin supply fell more than $3.5 billion in Q2 2026, according to CEX.IO’s Q2 report, reversing nearly three years of quarterly growth.
- Crypto-native yield stablecoins shrank sharply: Ethena’s sUSDe supply dropped 52% (nearly $2 billion) and Sky’s sUSDS declined 16%.
- Treasury-backed products expanded while crypto-native contraction accelerated, including BlackRock’s BUIDL (+2%), Circle’s USYC (nearly +16%), and Ondo Finance’s USDY (up over 66%).
- Activity deteriorated at the transaction-count level: CEX.IO reports stablecoin transaction counts fell by 530 million to 4.48 billion, the largest quarterly drop on record.
- Smaller transfers looked relatively more resilient: transfers under $250 rose 5% to $19.39 billion, even as overall usage weakened.
Crypto-native yield tokens lose traction
CEX.IO’s report centers on a clear divergence in the stablecoin yield landscape. During Q2, yield-bearing stablecoin supply declined significantly as crypto-native products contracted. Ethena’s sUSDe stood out as the largest contributor to the downturn, losing 52% of its supply—shedding nearly $2 billion. Sky’s sUSDS also declined, down 16% over the same period.
The implication for users is straightforward: when demand for crypto-native yield strategies weakens, supply can retract quickly because these products are tightly linked to onchain activity and the availability of capital within crypto trading and hedging structures. In practice, that means stablecoin “yield” is not a uniform category—different issuers and reserve models can experience very different supply dynamics in the same quarter.
Treasury-backed products pick up share
While crypto-native yield tokens shrank, treasury-backed offerings moved in the opposite direction. CEX.IO reported that BlackRock’s BUIDL rose 2% in Q2, Circle’s USYC increased by nearly 16%, and Ondo Finance’s USDY climbed by more than 66%. Taken together, the data suggests investors may have shifted toward products perceived as more directly tied to traditional reserve mechanisms rather than crypto activity.
For market participants, this matters because treasury-backed expansion can stabilize parts of the stablecoin ecosystem even when broader crypto-native demand softens. However, the data also highlights an unresolved question: whether treasury-backed growth will fully offset crypto-native contraction, or whether the overall decline in supply signals that stablecoin usage itself is cooling.
First quarterly contraction since late 2023
CEX.IO frames Q2 as a turning point. The category recorded its first quarterly contraction since Q3 2023, with total stablecoin supply reaching $312 billion. The report also notes that adjusted transaction volume declined by 5.5%—a sign that not only did supply shrink, but the underlying flow of stablecoin-related activity also moderated.
Transaction data adds further detail on what changed. CEX.IO said total stablecoin transaction counts fell by 530 million to 4.48 billion, described in the report as the largest quarterly decline on record. At the same time, the report found that smaller transfers—below $250—rose 5% to $19.39 billion. That combination suggests that smaller peer-to-peer or retail-style use may be holding up better than transaction-heavy activity associated with larger automated or trading flows.
It’s an important nuance for traders and builders: the headline supply decline doesn’t necessarily mean everyday transfers disappeared. Rather, the weakness appears concentrated in higher-frequency, larger-dollar, or more automation-dependent segments of stablecoin utilization.
Weaker signals in Q1 preceded the Q2 drop
The slowdown didn’t arrive without warning. In Q1 2026, stablecoin supply still increased by about $8 billion to a record $315 billion, according to reporting referenced by CEX.IO. However, the report also points to earlier signs that organic demand was softening.
During Q1, retail-sized transfers declined by 16%, while automated activity made up roughly 76% of stablecoin transaction volume. By Q2, these patterns were more pronounced: transaction counts fell sharply, yet sub-$250 transfers increased. Together, the data suggests a market where the “type” of stablecoin activity shifted—away from larger, automation-heavy usage and toward smaller transfers, even as overall activity and supply eventually contracted.
Broader crypto demand concerns weigh on stablecoin dynamics
Stablecoin contraction in Q2 also aligns with concerns about weaker momentum across broader crypto markets. Earlier in the week, institutional data provider Talos identified declining stablecoin supply alongside spot Bitcoin ETF outflows and slower Bitcoin purchases by Strategy as three demand channels that weakened in Q2.
In comments relayed to Cointelegraph, Talos’s Tanay Ved argued that a recovery in stablecoin supply would be a useful signal of “fresh capital coming back into the ecosystem more broadly,” potentially supporting onchain liquidity. Ved also emphasized that spot ETF flows remain among the most important channels to watch, since they tend to reflect more durable shifts in institutional appetite.
Crucially, Ved noted that ETF flows, corporate Bitcoin purchases, and stablecoin supply often move together when market momentum changes. That observation frames stablecoins as more than a settlement tool: when capital rotates out of crypto exposure, stablecoin issuance and onchain usage can weaken as well—especially in segments dependent on active trading and capital deployment.
For readers tracking the next phase, the key question is whether Q2’s contraction represents a temporary reset or the start of a longer decline. CEX.IO’s data shows a sharp internal reshuffle—crypto-native yield tokens losing supply while treasury-backed products gain—so investors should watch both overall stablecoin issuance trends and the relative growth of different reserve models as new quarterly figures arrive.

Morocco’s Ismael Saibari signs for Bayern Munich

Newly discovered PamStealer isn’t your typical macOS malware

Spain finally clicking into gear at World Cup as Mikel Oyarzabal double and Pedro Porro header seal 3-0 win over Austria


-

 Fashion6 days ago
Weekend Open Thread: Staud – Corporette.com
-

 Politics7 days ago
The House | Manchesterism won’t survive the painful trade-offs unless it gets citizens on board
-

 Crypto World3 days ago
Strategy authorizes up to $1.25B in Bitcoin sales under new capital plan
-

 Politics7 days ago
Potential 2028er World Cup attendee leaderboard
-

 Business7 days ago
Asia stock markets slide as tech shares slump
-

 News Videos4 days ago
MAJOR BITCOIN & MARKET UPDATE!!!! (MUST WATCH ASAP!!!)
-

 Crypto World5 days ago
Coinbase, Circle Deepen Crypto Stock Losses Despite Resilient S&P 500
-

 Tech3 days ago
Anonymous researcher drops 0-day ‘exploitarium’ repo
-

 Business3 days ago
Australia treasurer says alleged access of prime minister’s bank data ’incredibly concerning’
-

 Crypto World6 days ago
Kraken's xStocks Opens Bending Spoons IPO Registration to EEA Retail
-

 Sports6 days ago
FIH Pro League: India defeat Pakistan 7-1, register biggest win of campaign | Other Sports News
-
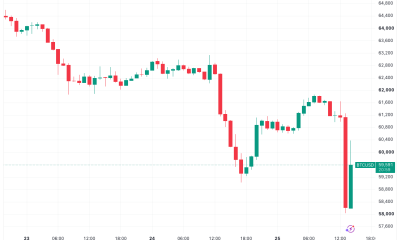
 Crypto World7 days ago
Bitcoin Sparks $600M Hourly Liquidations With $65,000 Set To Become Resistance
-

 Tech5 days ago
Bluekit phishing kit adopts browser-in-the-middle for login theft
-

 Tech5 days ago
Russian hackers now target Signal backup recovery keys
-
 Crypto World6 days ago
Hyperliquid Named on Singapore MAS Investor Alert Register
-

 Crypto World6 days ago
RTX holders must register wallets before token distribution begins
-
 Crypto World7 days ago
Tether (USDT) Passes Ether in Market Cap as ETH Drops Toward $1.5K
-

 Sports1 day ago
Broncos roster: OL Ben Powers (No. 74) entering final year of contract
-
 Business3 days ago
The AI boom won’t burst all at once. It will pop in ‘rolling bubbles’: Macquarie
-

 Tech5 days ago
Silicon Valley paid to kill AI regulation, now it wants the rules back
You must be logged in to post a comment Login