
Crypto World
Solana Tries to Rebound but a DeFi Contagion Sends 1.32 Million SOL to Exchanges

Solana (SOL) price trades at $84.15 on the 12-hour chart, attempting a rebound from the $82.93 support. A hidden bullish divergence has formed between April 15 and April 19, signaling that selling momentum may be exhausting.
However, rising sell volume and a massive spike in exchange inflows complicate the setup. Someone is consistently offloading SOL into each rebound attempt, and the DeFi contagion spreading from Ethereum explains why.
Price Flashes a Rebound Signal but Sell Volume Tells a Different Story
Solana price peaked at $90.79 on April 17 before pulling back sharply. The low at $82.93 on April 19 marked a higher low compared a level reached on April 15. During that same window, the Relative Strength Index (RSI) printed a lower low. RSI is a momentum indicator that measures the speed of recent price changes.
That pattern is a hidden bullish divergence. Price made a higher low while RSI made a lower low, which typically signals that selling pressure is weakening. A rebound attempt has already started from that level.
Want more token insights like this? Sign up for Editor Harsh Notariya’s Daily Crypto Newsletter here.
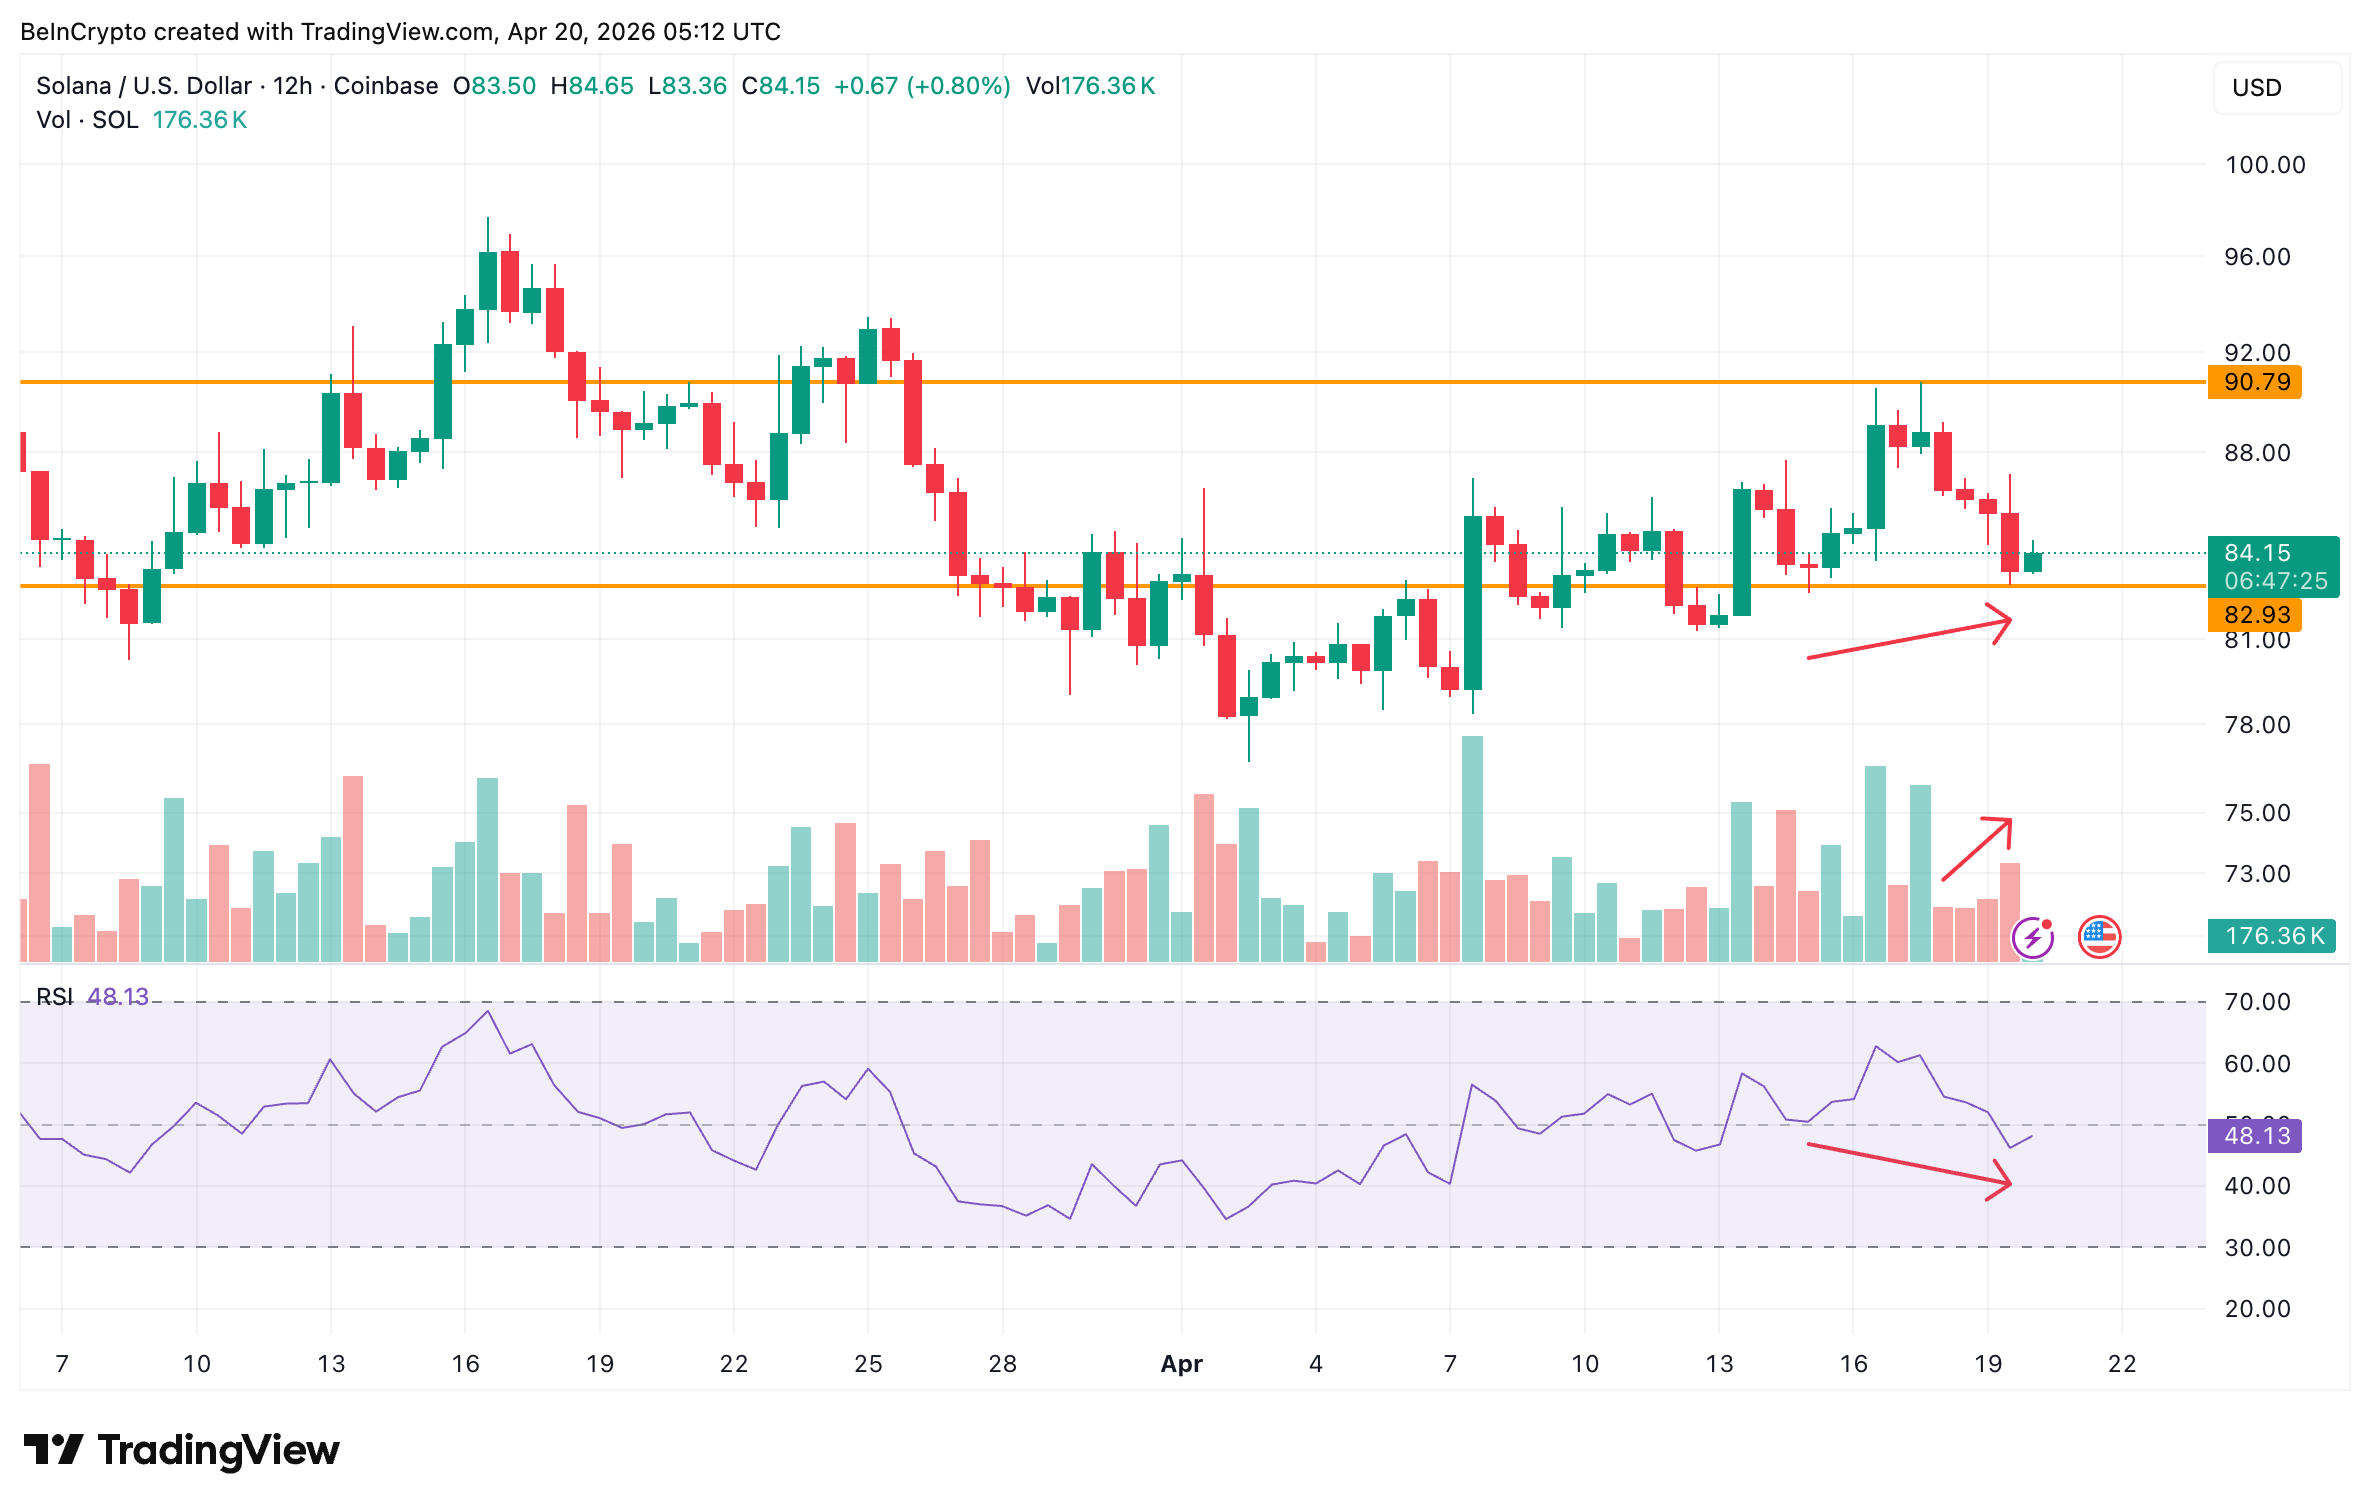
Yet volume tells the opposite story. Sell-side volume has been rising since April 18, even as RSI suggests momentum is fading. That combination carries a specific meaning. Fewer percentage moves per sell wave, paired with more participants, points to distribution rather than panic. Someone is consistently unloading SOL into each small rebound.
Meanwhile, the likely source is the spreading DeFi contagion. Following the KelpDAO rsETH exploit, Solana’s Kamino Prime Market USDC reserve hit 100% utilization on April 20.
Zero liquidity is available. Multiple USDC vaults are above 95% utilization. Funds with stuck USDC positions may be selling SOL on spot markets to raise cash. That pressure creates the supply cap the chart is showing.
Exchange Inflows Surge 1,102% as Hodlers Add Nearly 500K SOL
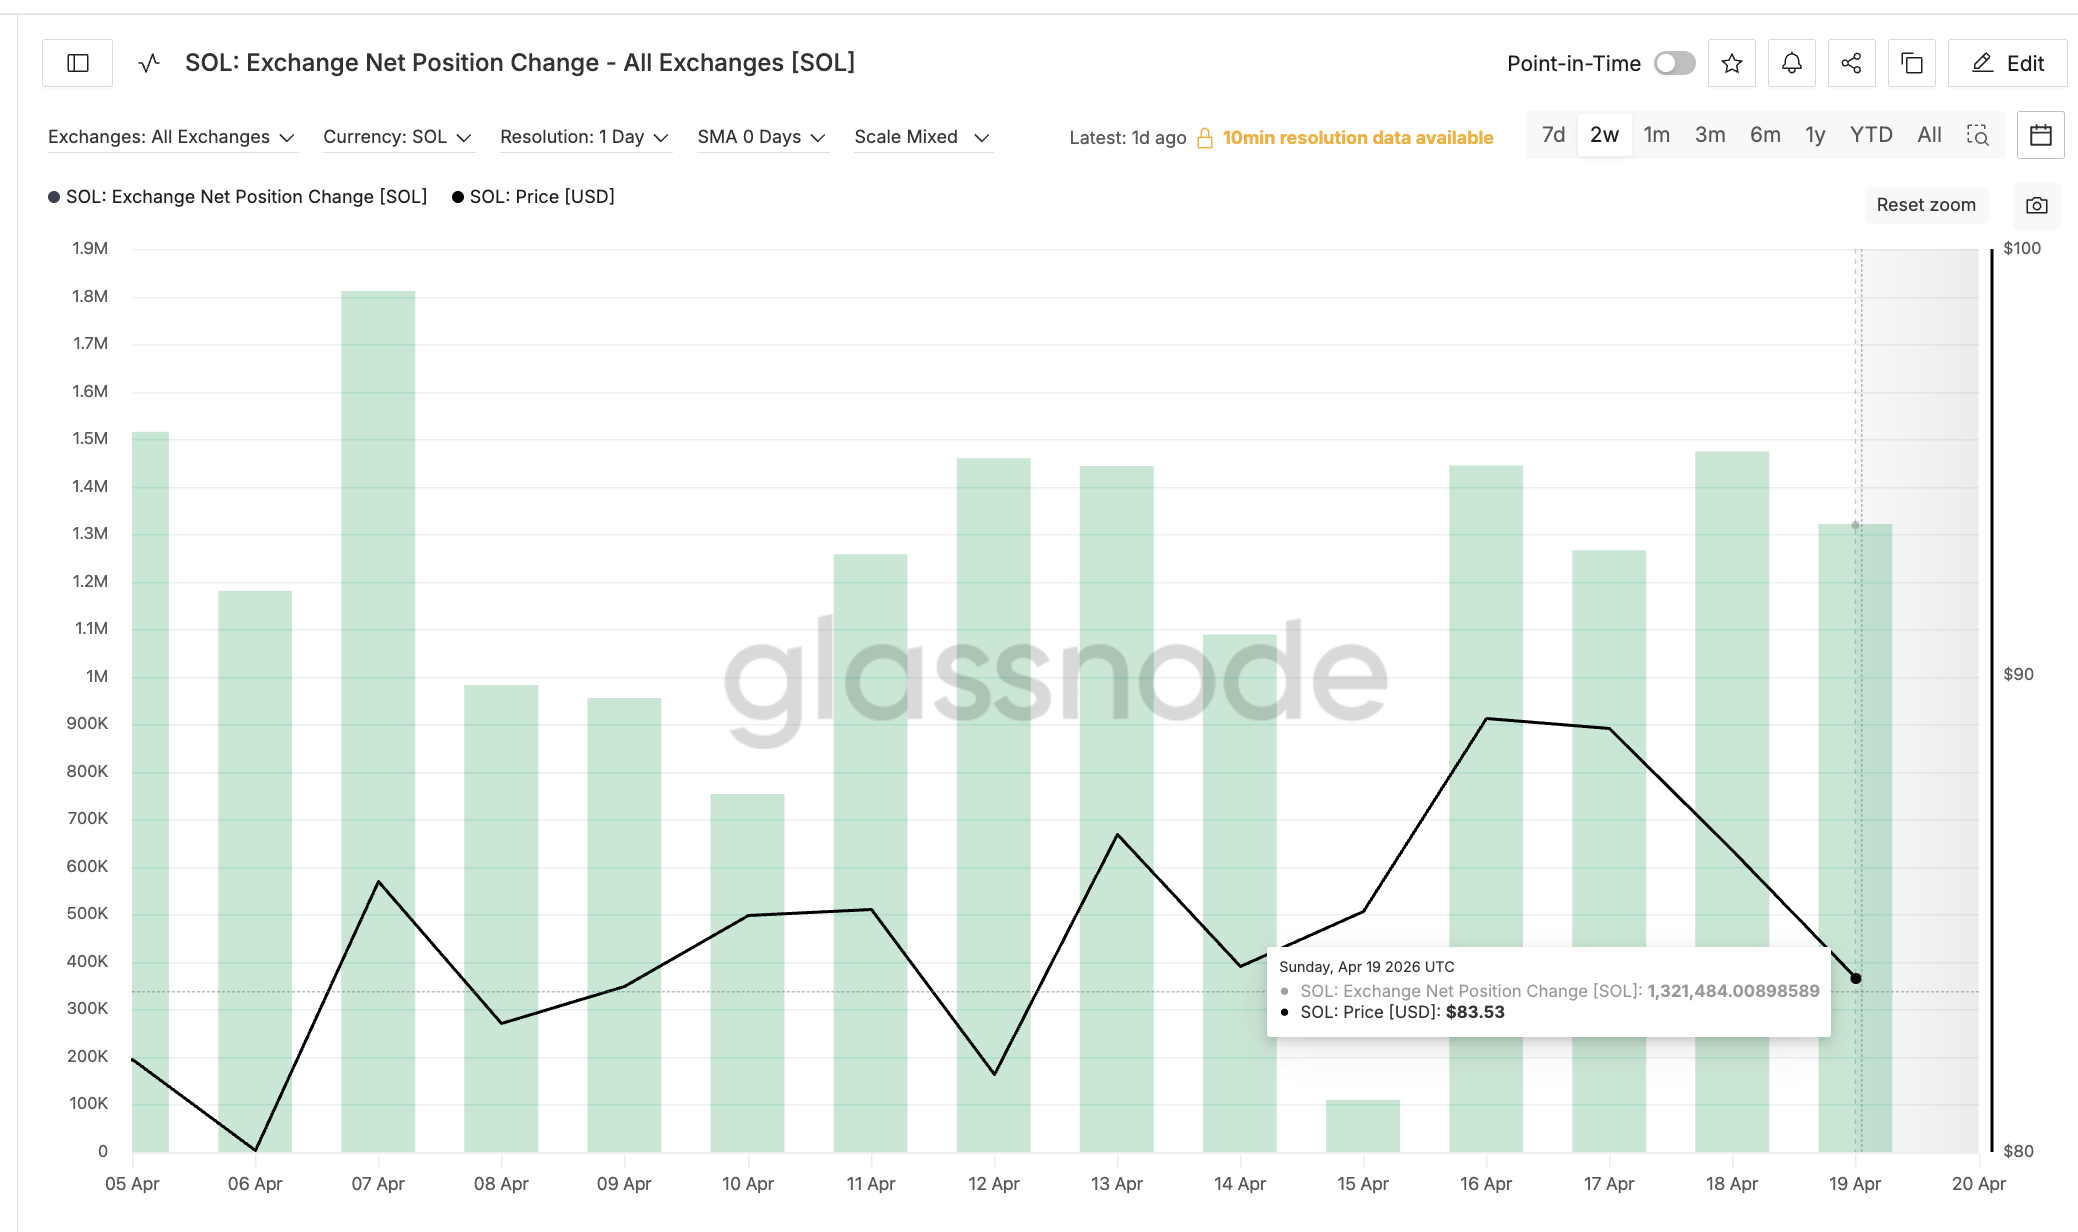
On-chain data confirms the forced-selling thesis. The SOL Exchange Net Position Change has exploded. This metric tracks the 30-day flow of coins into or out of exchange wallets.
Meanwhile, on April 15, the metric read 109,932 SOL. By April 19, it had surged to 1,321,484 SOL. That is a 1,102% increase in four days. More SOL is now sitting on exchanges, typically a precursor to selling.
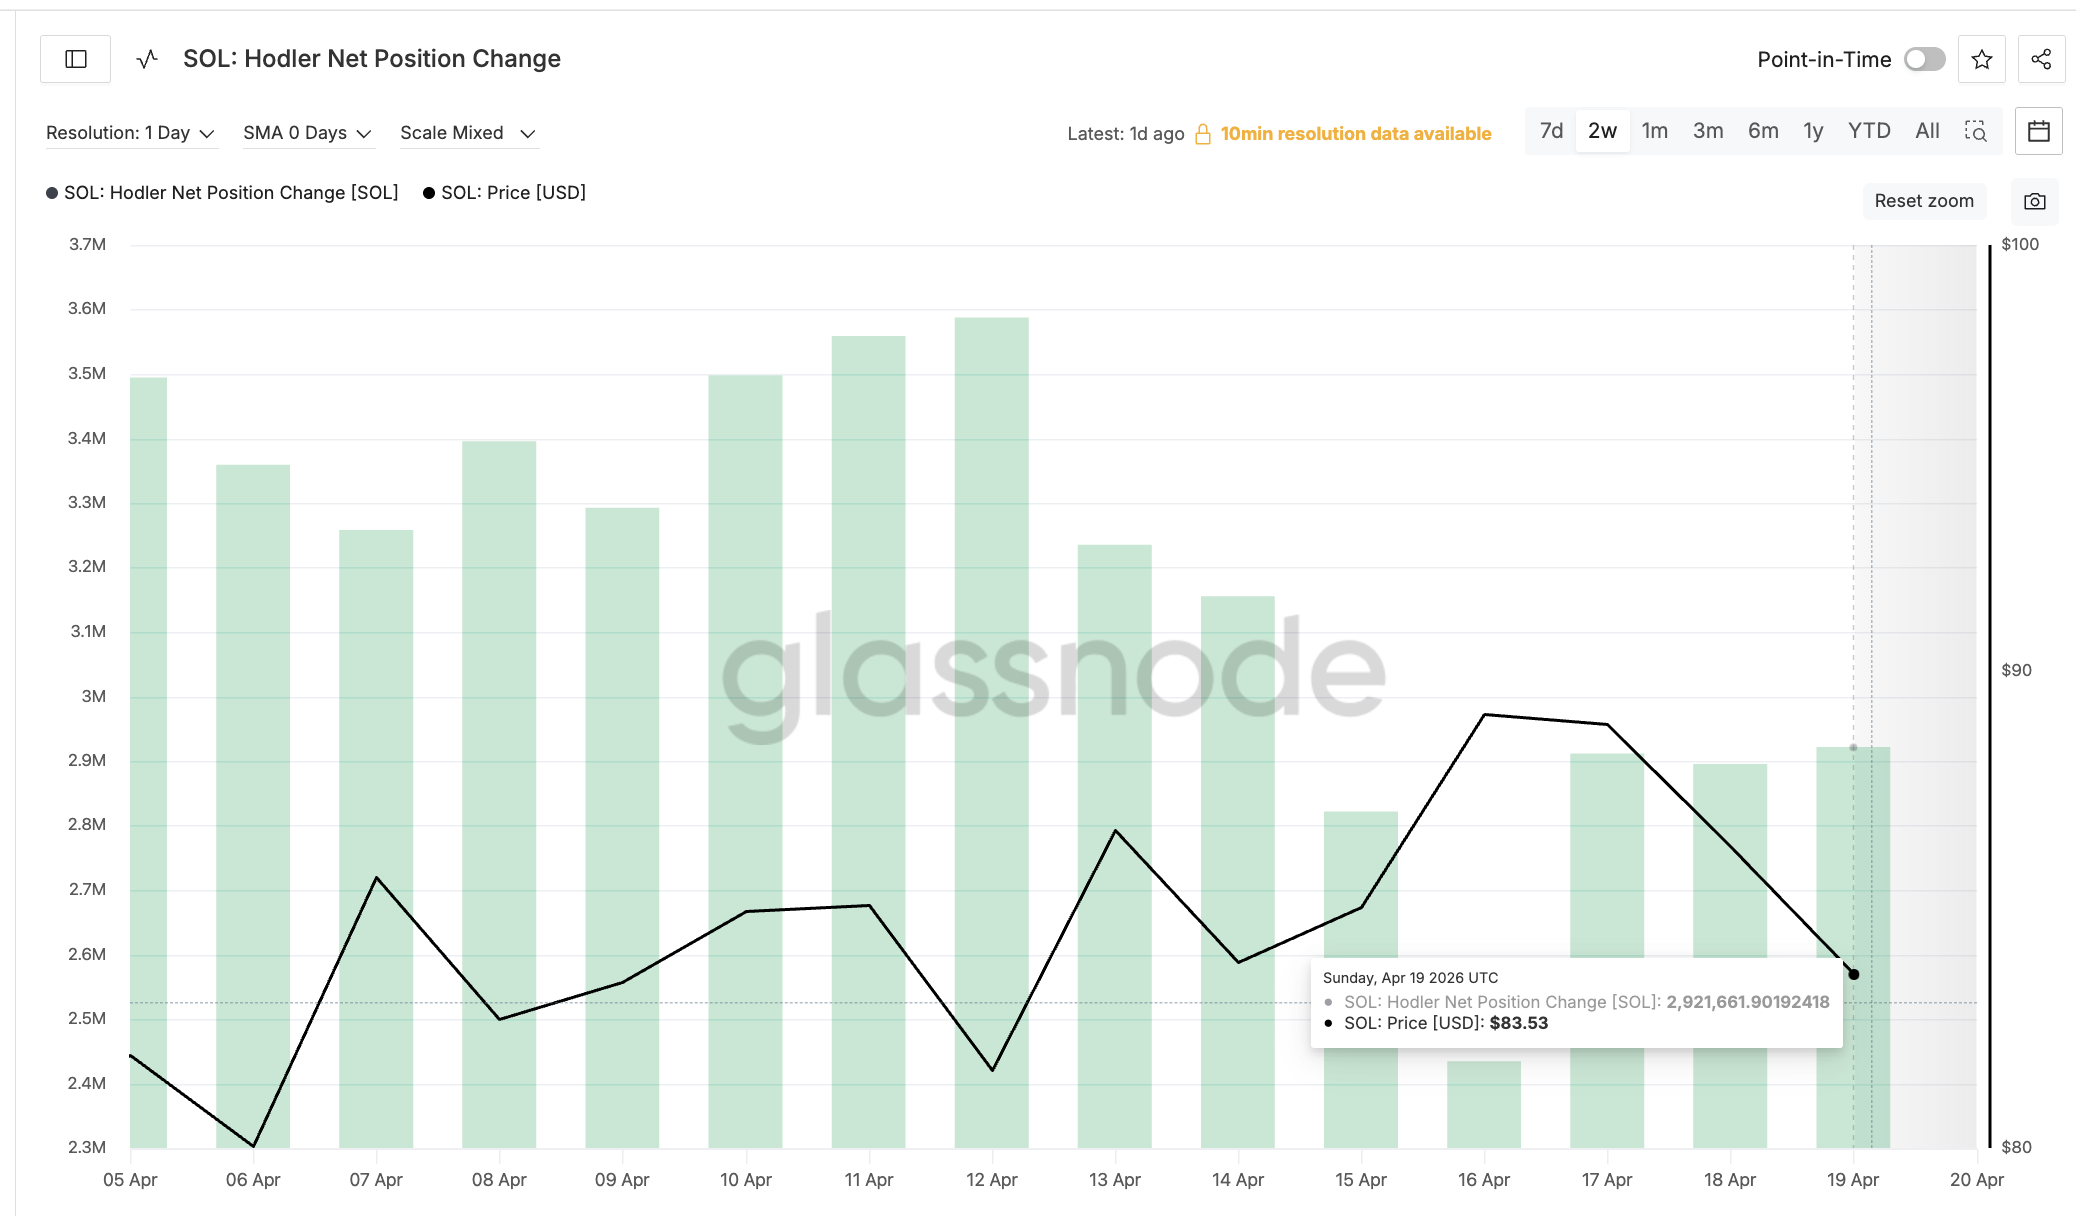
Yet the other side of the market is doing the opposite. The SOL Hodler Net Position Change is climbing. This metric tracks the 30-day change in supply held by wallets older than 155 days.
On April 16, hodlers held a net 2,434,566 SOL added over the prior month. By April 19, that figure had climbed to 2,921,661 SOL. Long-term holders added roughly 487,000 SOL in three days, a 20% jump.
The split is the key to the entire picture. Forced sellers from the DeFi crisis are possibly depositing to exchanges. Long-term holders are absorbing the supply. That structure produces a shallow rebound rather than a collapse, with each side fighting for control at specific price levels.
Solana Price Levels That Decide Between a Shallow Bounce and a Breakdown
Solana price at $84.15 sits between two tight levels. The first upside test is $85.42. A clean move above that strengthens the rebound. However, the next resistance at $90.79 is the April 17 high, a level that already rejected once. A reclaim there would neutralize the current weakness and open a path toward $93.40.
Yet if forced sellers overwhelm the hodler bid, the rebound fails. A touch of $82.93 invalidates the hidden bullish divergence. A break of $82.11, the 0.618 Fibonacci, opens $79.95 and $76.74 as the next downside targets.
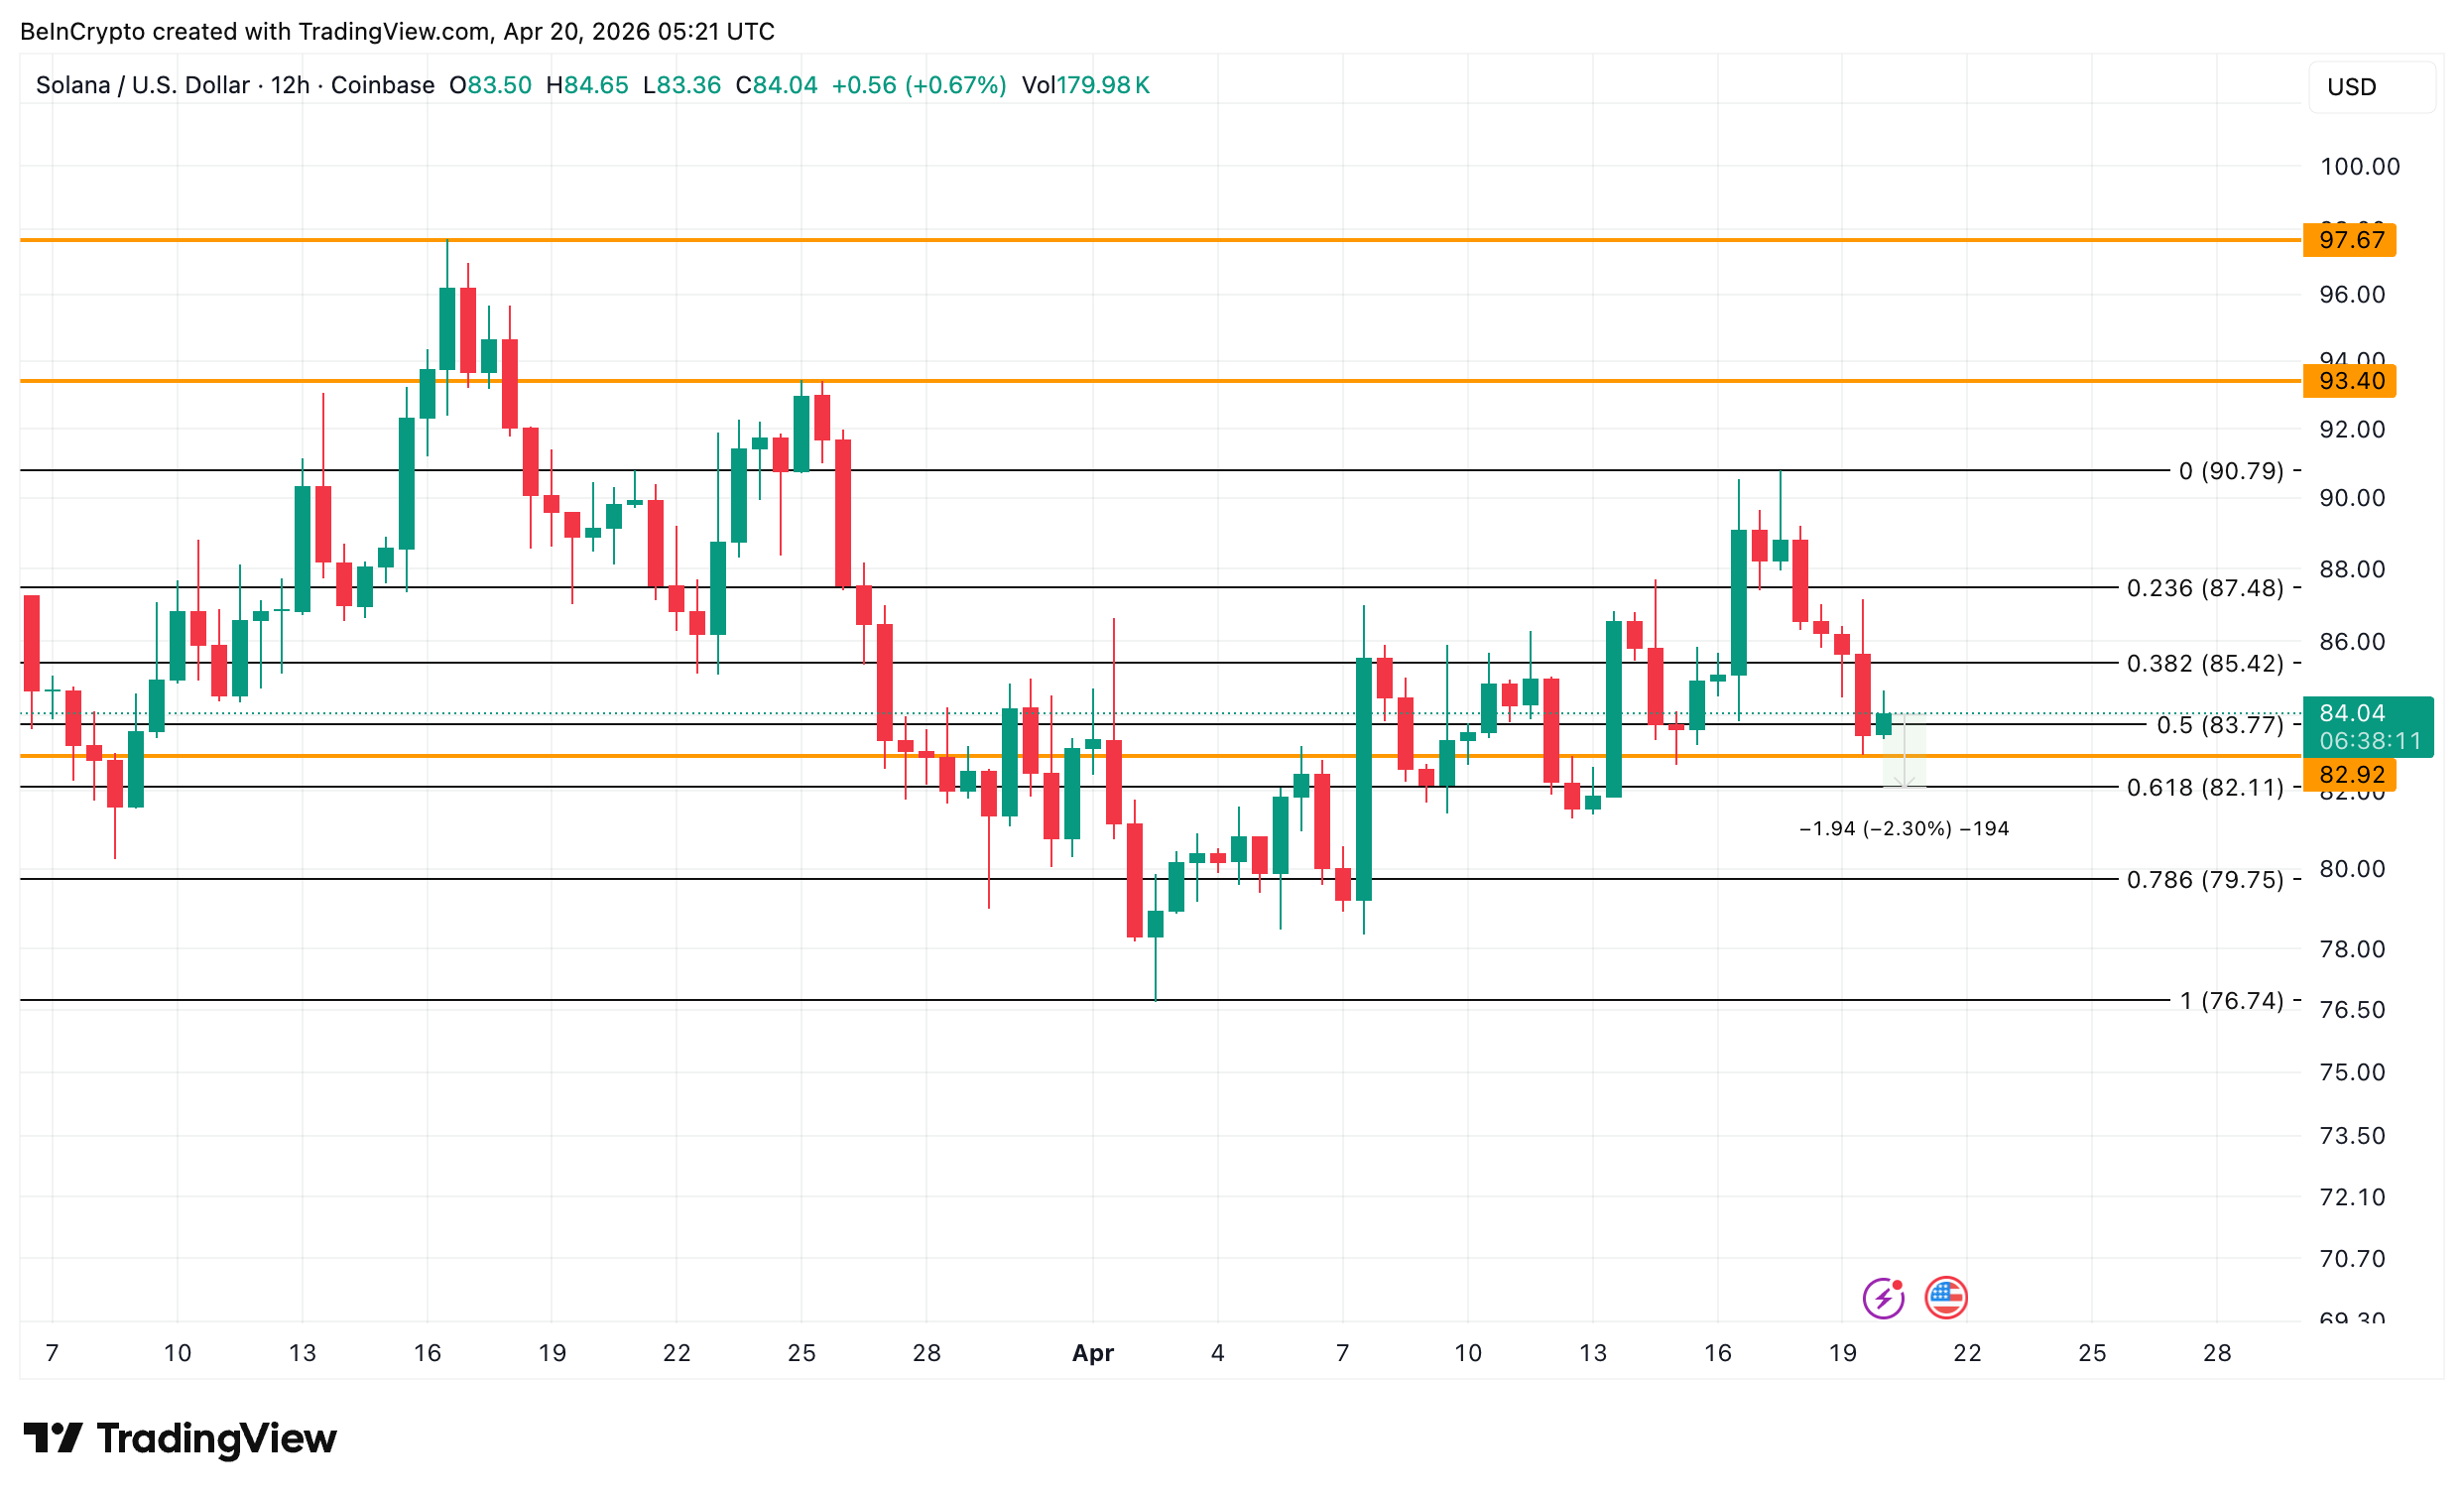
Solana price at $82.93 separates a rebound that holds long-term conviction from a breakdown driven by the DeFi crisis.
The post Solana Tries to Rebound but a DeFi Contagion Sends 1.32 Million SOL to Exchanges appeared first on BeInCrypto.

Bitcoin (BTC) has recovered 25% from its multi-year low below $60,000, with momentum indicators flashing rare “buy” signals.
Key takeaways:
-
Bitcoin’s MACD and RSI indicators forecast a sharp BTC price rally in the coming days.
-
Bitcoin price must reclaim $78,000 in the coming days to sustain upward momentum.
Bitcoin’s MACD, RSI confirm “bull market is on”
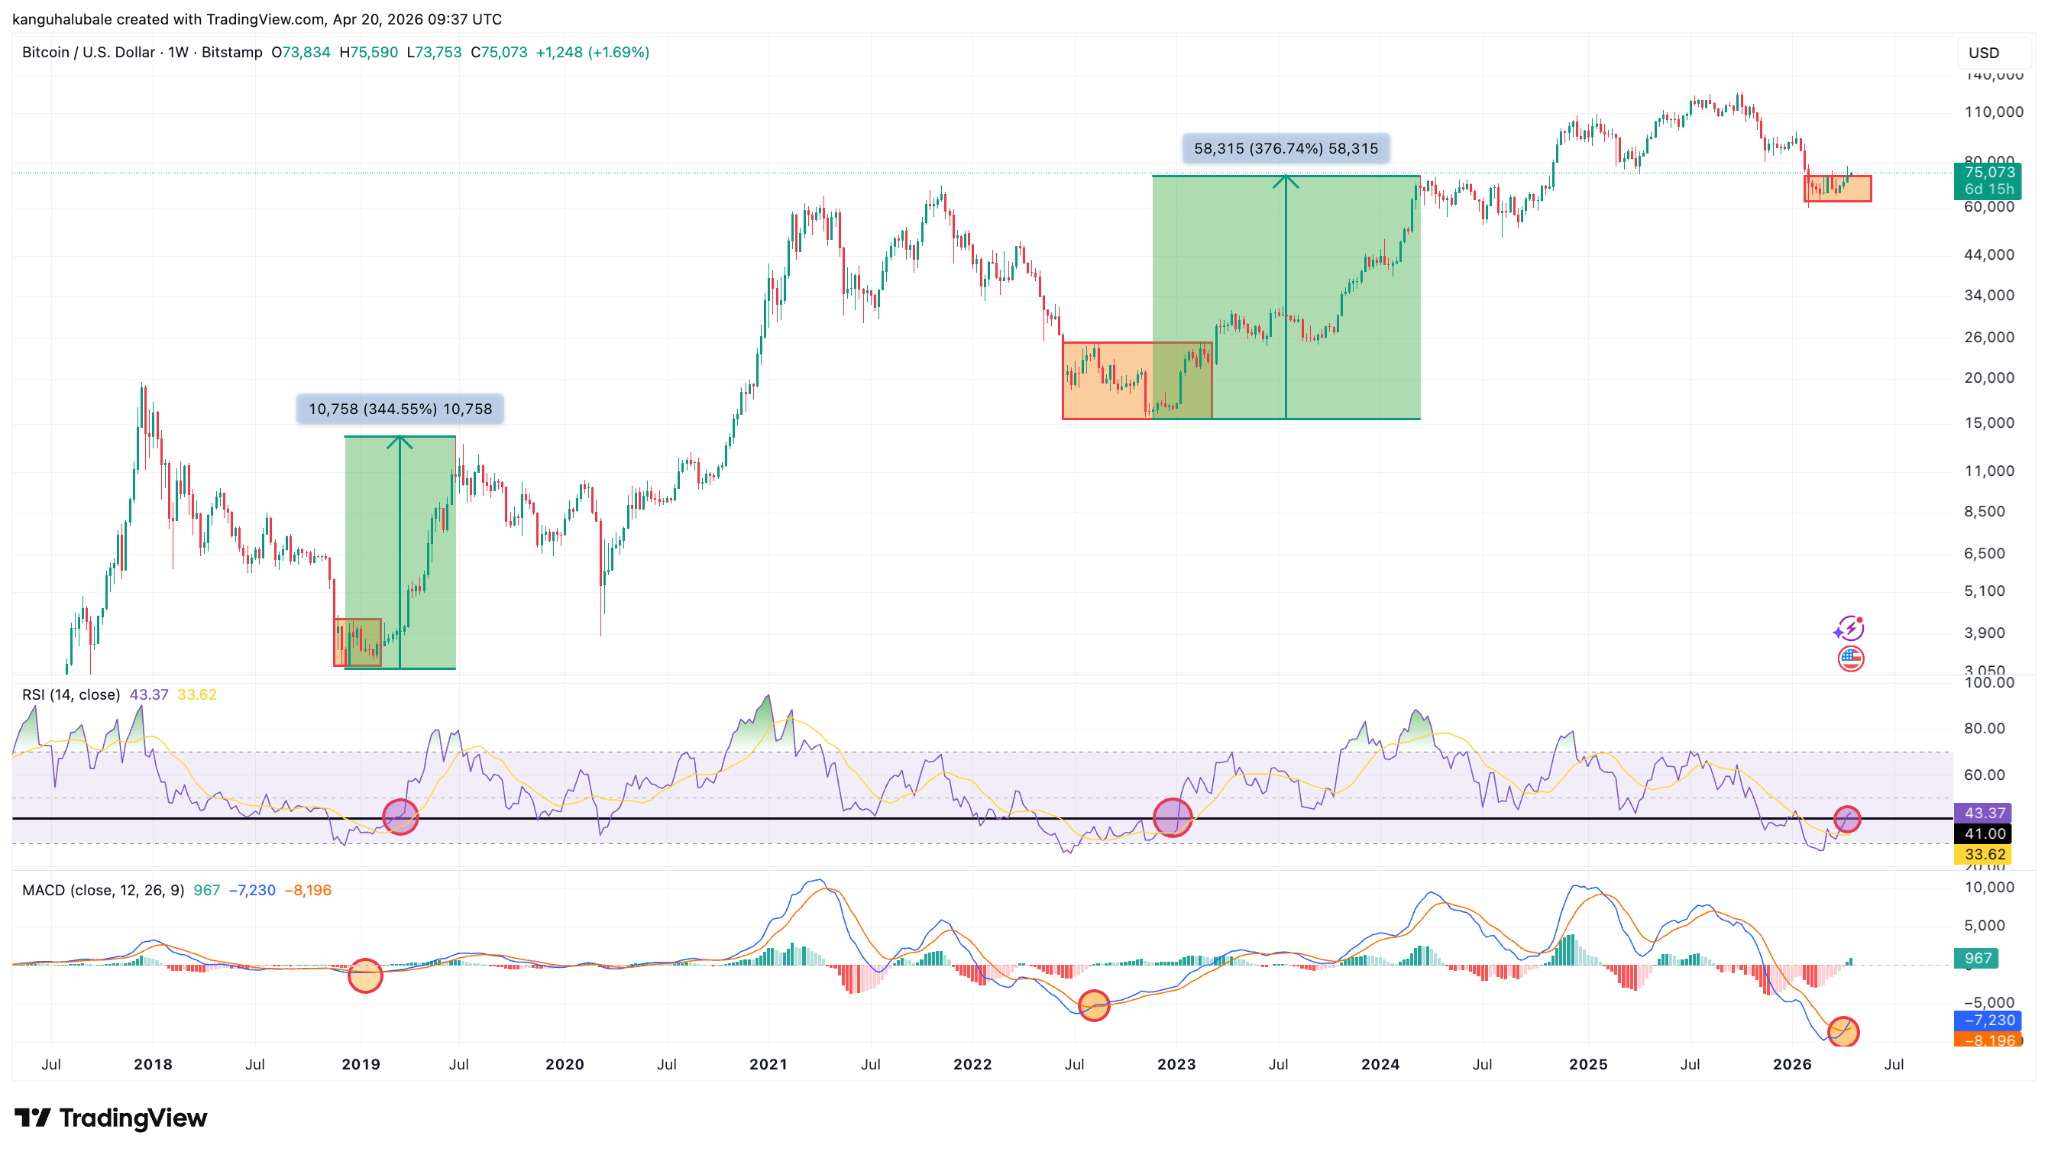
Data from TradingView showed BTC/USD trading at $75,300, 4% below its 10-week high of $78,380 reached on Friday.
Despite this pullback, fueled by uncertainties over the US and Israel-Iran war, price indicators hinted at continued upside to come.
Analyzing the moving average convergence divergence (MACD) indicator in the weekly time frame, trader Sykodelic flagged a key bullish crossover, setting Bitcoin up for an upward run.
Related: BTC price due ‘new highs:’ Five things to know in Bitcoin this week
“Not only do we have a 1W MACD bullish cross and break of trend, we have it from the lowest point the MACD has ever dropped to,” analyst Sykodelic said in a recent post on X, adding:
“We are at a very important level here, and the weekly close will be very important.”
Previous instances show that Bitcoin tends to rise sharply when the MACD line (blue) crosses above the signal line (orange).
This ultimately has led to 340%-380% BTC price gains, as seen in 2018-2019 and 2022-2023.

“A big move usually follows whenever this weekly MACD bullish cross happens,” analyst Mikybull Crypto said in a recent post on X.
Meanwhile, the relative strength index, or RSI, has now recovered to 43 from 21 in mid-February. When combined with a buy signal on the MACD, the picture begins to resemble previous cycles.
In a recent video posted on X, trading resource Material Indicators said that the weekly RSI holding above the 41 level was among the “macro things that need to happen to say a validated bull market is on.”
Previous occurrences in 2023, 2020 and 2019 have led to 660%, 1,600% and 316% BTC price rallies, respectively.
Other Bitcoin analysts suggest that sustained spot market buy volume and consistent inflows to the Bitcoin ETFs are the necessary components required for a rally to new highs.
Bitcoin must reclaim $78,000 next
As Cointelegraph reported, Bitcoin’s bullish case hinges on flipping the resistance at $78,000 into support, where the true market mean currently sits.
Analyzing Bitcoin’s price action on lower time frames, Telegram trading resource Technical Crypto Analyst said that after reclaiming the $70,000 level, the BTC/USD pair is “now pushing into a major supply zone around 75K–78K, which is acting as resistance,” adding:
“A clean breakout above this zone could continue the move toward new highs, while rejection may lead to a pullback toward the 68K–70K support region.”

Fellow analyst Bitcoinsensus said failure to break above $78,000 would suggest that the latest rally was a “possible bull trap,” as seen in previous failed breakouts.
“If price loses momentum from here, the setup keeps downside pressure in focus in the near term.”

As Cointelegraph reported, a close above the $76,000-$78,000 area would confirm that the buyers are in control, clearing the path for a potential rally to $84,000.
This article is produced in accordance with Cointelegraph’s Editorial Policy and is intended for informational purposes only. It does not constitute investment advice or recommendations. All investments and trades carry risk; readers are encouraged to conduct independent research before making any decisions. Cointelegraph makes no guarantees regarding the accuracy or completeness of the information presented, including forward-looking statements, and will not be liable for any loss or damage arising from reliance on this content.

TLDR
- The NSA reportedly used Anthropic’s Mythos Preview despite a Pentagon supply chain risk designation.
- Axios cited sources who confirmed the NSA accessed the model after the restriction.
- The Pentagon labeled Anthropic a supply chain risk in March over safeguard disputes.
- The dispute involved Anthropic’s refusal to loosen controls tied to autonomous weapons and surveillance.
- Anthropic limited Mythos Preview access to about 40 organizations due to offensive cyber capabilities.
The National Security Agency has used Anthropic’s Mythos Preview despite a Pentagon supply chain risk designation. Axios cited multiple sources who confirmed the agency’s access to the model. The report shows internal differences across federal departments over Anthropic technology use.
Anthropic Model Access Expands Inside NSA
Axios reported that two sources confirmed NSA use of Mythos Preview. One source said the department expanded usage beyond limited internal testing.
However, the Pentagon designated Anthropic as a supply chain risk in March. The designation restricted the company’s technology in military contracts after a policy dispute.
The dispute centered on Anthropic’s refusal to loosen safeguards. The company declined to adjust controls linked to autonomous weapons and domestic surveillance systems.
As a result, the Pentagon limited procurement pathways for Anthropic products. Still, Axios reported that the NSA accessed Mythos through existing channels.
The report did not explain the technical route used for access. However, it confirmed that usage occurred after the risk designation.
Axios stated that it remains unclear how the NSA deployed the model. Yet, other authorized organizations have used Mythos to scan systems for vulnerabilities.
Anthropic limited Mythos Preview access to about 40 organizations. The company restricted access because of the model’s offensive cyber capabilities.
Sources told Axios that the NSA relied on the model’s security testing features. They did not describe operational outcomes or contract values.
The report did not state whether the NSA violated formal procurement rules. It also did not clarify if the usage involved classified systems.
White House Engages Anthropic Leadership
The White House has explored options to work with Anthropic despite the ongoing court dispute. Axios reported that discussions took place at senior levels.
Anthropic CEO Dario Amodei met White House Chief of Staff Susie Wiles. He also met Treasury Secretary Scott Bessent to discuss government usage.
Axios reported that Amodei addressed Mythos access and broader security practices. The outlet cited a source familiar with the meeting.
The meeting occurred while the court fight over the Pentagon designation continued. However, officials have not announced any policy change.
The White House did not publicly outline next steps. Still, the talks showed active engagement with Anthropic leadership.
Anthropic has defended its safeguards in previous statements. The company has said it maintains strict controls over high-risk applications.
Pentagon officials have not rescinded the supply chain risk designation. Therefore, formal contract limits remain in place.
Axios reported that agency-level adoption may differ from procurement policy. However, it did not provide internal compliance details.

The Zondacrypto withdrawal crisis has frozen millions of customer funds at Poland’s largest crypto exchange. The company cites a 4,500 BTC wallet as proof of solvency, though no one there can move the coins.
The private key belongs to founder Sylwester Suszek, who sold the exchange in 2021 and disappeared in March 2022. Regulators, prosecutors, and the country’s prime minister are now circling the company.
How the zondacrypto Withdrawal Crisis Started
Withdrawal delays first surfaced in December 2025. Users reported on the exchange’s official Telegram channel that funds sat in pending status for days. Management blamed high demand and new security protocols.
Complaints multiplied by late March 2026. A whistleblower site, zonda-alert.pl, launched to gather customer testimonials. Blockchain analysts followed with hard data.
Average monthly Bitcoin (BTC) balances across zondacrypto’s known hot wallets collapsed between August 2024 and April 2026. Holdings fell from 55.7 BTC to 0.086 BTC, a 99.7% drop.
The exchange processes a large share of Polish retail crypto volume. Any sustained freeze hits hundreds of thousands of customers at once.
The Missing Key and a Vanished Founder
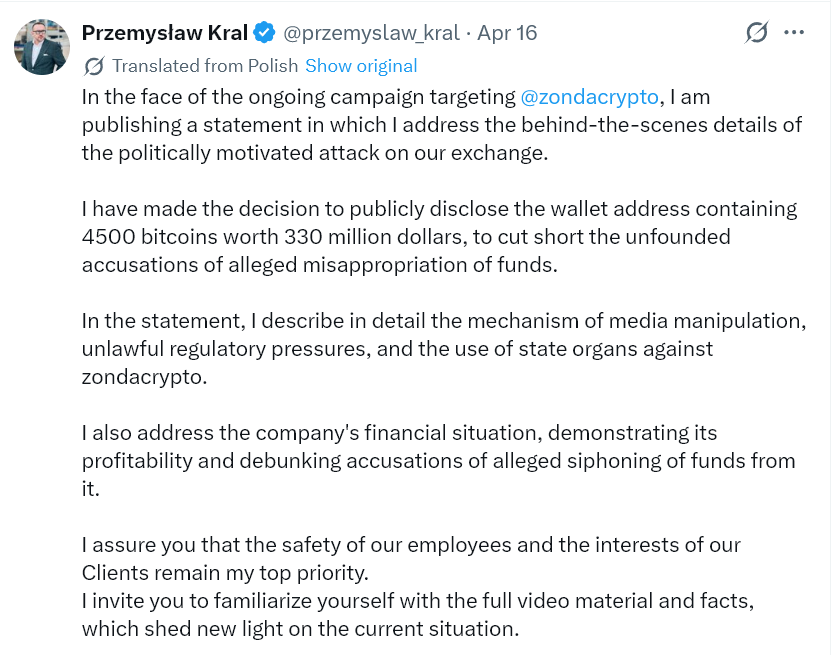
CEO Przemysław Kral addressed the allegations on April 17. He cited a wallet holding roughly 4,500 BTC, worth around $330 million. Kral argued the reserves prove the exchange remains solvent.
The defense unraveled quickly. Kral admitted zondacrypto cannot access those coins. The private key belongs only to Suszek, who failed to hand it over when he sold the business in 2021.

Suszek dropped out of public view in March 2022 and has never reappeared. Polish media and private investigators have chased leads across Europe without confirming his location.
A separate investigation now targets Suszek himself. Even his own family cannot confirm whether he is still alive. A wallet no one can move is effectively empty for any practical purpose.
Independent analysts at Recoveris tracked 511 transfers moving from zondacrypto wallets to a single Kraken deposit address. The transfers totaled over $21 million between December 2025 and April 2026.
Kral has rejected the findings and threatened legal action. The silence around the transfers deepens the trust deficit with customers.
A National Political Firestorm
The story has dominated Polish national media as breaking news in recent days. Television, radio, and leading newspapers have led their bulletins with each new revelation.
Prime Minister Donald Tusk escalated the pressure on April 18. He told parliament that zondacrypto financially backed politicians who voted against crypto market rules. Tusk also alleged the exchange maintains links to Russia.
Poland’s largest parliamentary parties have begun using zondacrypto to attack or defend their own politicians. The exchange has become a political weapon on all sides of the chamber.
Regulators Move In
Poland’s National Prosecutor’s Office had opened a formal investigation on April 8. The Office of Competition and Consumer Protection confirmed it has been collecting complaints since 2022.
That consumer office began probing zondacrypto’s parent company in January 2025. Poland’s internal security agency is now reportedly examining the exchange.
Analysts compare the situation to Cinkciarz.pl, a Polish currency exchange that collapsed in 2024. Temporary technical delays there preceded license revocation and heavy customer losses.
What Comes Next
The zondacrypto withdrawal crisis follows a pattern seen in crypto markets during the FTX collapse. Frozen funds, vague statements, a CEO defending solvency, and on-chain data telling a different story.
Over one million customers and Poland’s broader stance on MiCA rules now hinge on what regulators uncover next. The coming weeks will test whether authorities can untangle the wallet, the founder, and the political fallout. Customer patience may not hold. The man who holds the keys is still missing.
The post Poland’s Biggest Crypto Exchange Falls, and Nobody Can Find the Man Who Holds the Keys appeared first on BeInCrypto.
TLDR
- Coinbase has launched crypto-backed USDC loans for users in the United Kingdom through Morpho on Base.
- UK customers can borrow USDC against Bitcoin, Ethereum, and cbETH without selling their holdings.
- The platform allows loans to be issued in under one minute, and funds can be used onchain or converted to fiat.
- Coinbase offers Bitcoin-backed loans up to $5 million USDC, depending on the collateral pledged.
- Interest rates remain variable and update with Base block production instead of following a fixed schedule.
Coinbase has introduced crypto-backed USDC loans for customers in the United Kingdom. The company allows users to borrow against Bitcoin, Ethereum, and cbETH without selling assets. It powers the product through Morpho on Base and issues loans in under one minute.
Coinbase and Morpho Expand USDC Lending to the UK
Coinbase rolled out the borrowing service after expanding its US product earlier this year. The company routes all loans through Morpho’s onchain lending infrastructure on Base. As a result, users access open market liquidity instead of a traditional internal loan book.
The platform allows customers to borrow USDC against pledged crypto assets. Coinbase said borrowers can use funds onchain or convert them into fiat for spending. The company confirmed that interest rates remain variable and update with Base block production.
Coinbase reported that total loan originations through Morpho exceeded $2.17 billion USDC as of April 14, 2026. The figure reflects activity before the product’s first international launch. Morpho described the integration as “one of the largest DeFi distribution moves to date.”
Bitcoin, Ethereum, and cbETH Back UK Borrowing
The UK version supports Bitcoin, Ethereum, and cbETH as eligible collateral. Coinbase offers Bitcoin-backed loans up to $5 million USDC, depending on pledged assets. The company applies variable interest rates determined by onchain markets.
Borrowers do not face a fixed repayment schedule under the current structure. However, the system can liquidate positions if loan value rises too high against collateral. Coinbase stated that rates adjust automatically with each new Base block.
The company launched its US borrowing product in January 2025. At that time, eligible US customers could borrow USDC against Bitcoin through Morpho. The company structured those loans with variable rates set by onchain supply and demand.
Coinbase said the UK expansion aligns with its broader consumer finance plans. Over the past year, the company secured UK VASP registration from the Financial Conduct Authority. It also introduced a GBP savings account in partnership with ClearBank.
The company expanded decentralized exchange trading access for British customers during the same period. Now, it adds borrowing as another feature for UK users. Coinbase aims to convert idle crypto balances into accessible liquidity.
The product operates fully on Morpho’s decentralized lending framework. Coinbase connects customers directly to liquidity pools on Base. Therefore, the company avoids maintaining its own lending inventory.
Coinbase confirmed that loans can be issued in less than one minute. Users can draw USDC immediately after pledging collateral. The company stated that the process runs entirely through smart contracts on Base.
Coinbase continues to monitor loan originations across supported markets. As of April 14, 2026, total originations surpassed $2.17 billion USDC. The UK launch marks the company’s first expansion of the Morpho-powered borrowing product outside the United States.
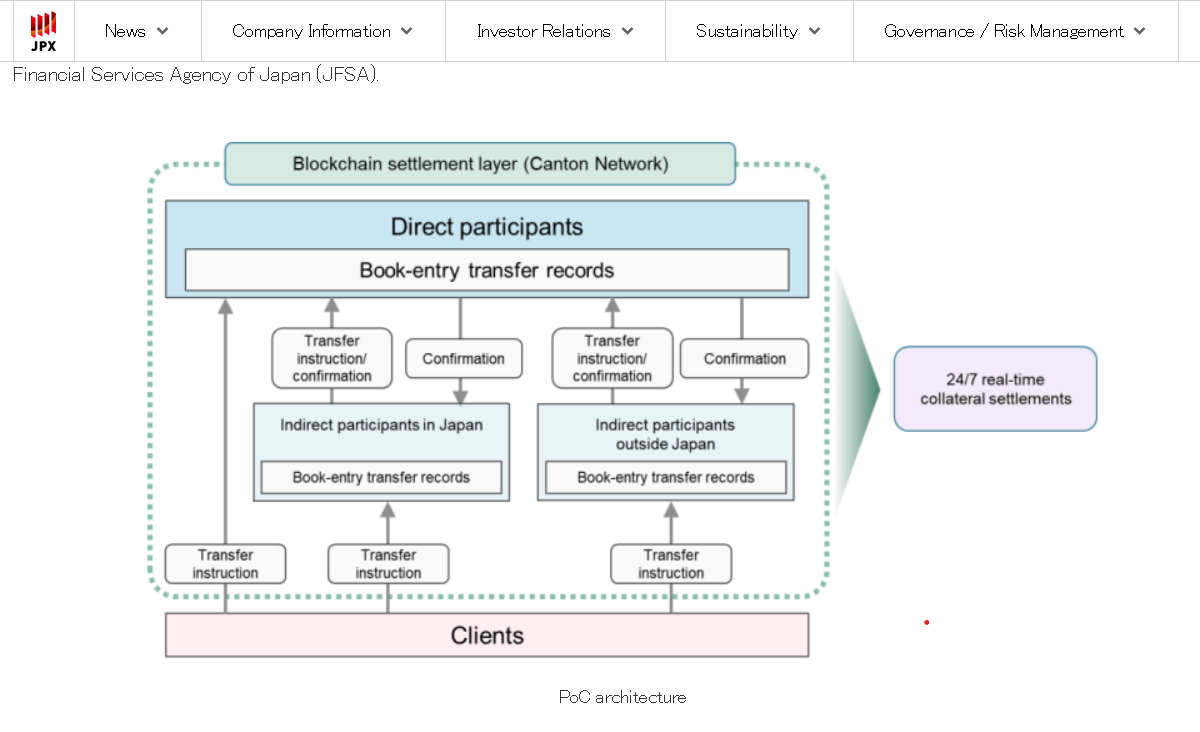
Japan Securities Clearing Corporation (JSCC), part of Japan Exchange Group (JPX), said Monday it will launch a proof of concept with Mizuho Financial Group, Nomura Holdings and Digital Asset to test the use of Japanese government bonds as digital collateral on the Canton Network.
The project will examine whether Japanese Government Bonds (JGBs) can be transferred and managed onchain while maintaining the legal status of the bonds under the Book-Entry Transfer Act and the Financial Instruments and Exchange Act.
The trial will also test whether integrating existing systems with Canton’s blockchain infrastructure can support more sophisticated, real-time collateral transactions on a 24/7 basis, including in cross-border use cases.
Japan’s Financial Services Agency selected the initiative in February for support under its Payment Innovation Project, which is part of the FinTech PoC Hub, the announcement states.
The trial puts one of the world’s biggest sovereign bond markets into the live debate over whether collateral can move more efficiently across digital market infrastructure without breaking existing legal and supervisory frameworks.

The companies said the trial comes as the use of digital assets accelerates in the United States and other markets, with momentum also building in Japan, and that the outcome is expected to inform discussions on how JGBs might be used in digital collateral processes, though no commercial rollout has been specified.
Related: Japan approves bill to classify crypto as financial instruments
Canton expands government bond tests
An earlier Canton pilot in December 2025 saw tokenized US Treasuries reused as collateral in real time between major dealers and market participants, including Bank of America and Société Générale.
Those tests highlighted the potential to reuse high-grade government securities onchain across multiple participants, and the new JGB trial extends that approach to Japan’s government bond market.
Separately, in February, the United Kingdom’s government appointed HSBC’s Orion platform to host issuance for its Digital Gilt Instrument pilot in the Bank of England’s Digital Securities Sandbox as it explores distributed ledger technology for sovereign debt.
Cointelegraph reached out to JSCC and Digital Asset for comment, but had not received a response by publication.
Magazine: Should users be allowed to bet on war and death in prediction markets?


Sentient’s suspected team wallet just moved 687 million SENT — around $11.52 million and 9.49% of supply — into a fresh address, putting AI-token treasury risk back in focus.
Summary
- Suspected Sentient team multisig moves 687m SENT, or 9.49% of circulating supply
- Transfer worth about $11.52m raises fresh questions over token supply overhang
- Move follows months of volatile SENT trading as AI-linked tokens stay in focus
A suspected Sentient (SENT) team multi-signature wallet has transferred 687 million SENT, worth around $11.52 million, into a new address, on-chain data from Arkham Intelligence shows.
According to Arkham’s monitoring dashboard, the funds moved from address 0x5b54…9C0f to 0xF9D7…262A roughly 20 minutes before the alert was published, marking one of the largest single shifts in SENT supply since the token’s launch.
Data from CoinMarketCap indicates that the 687 million SENT represents about 9.49% of the token’s 7.23 billion circulating supply, underscoring how concentrated holdings in team-linked wallets remain.
At current prices near $0.017 per SENT, the transfer’s implied value aligns with Arkham’s roughly $11.52 million estimate, although SENT has traded as high as $0.0231 in recent weeks amid renewed interest in AI-related tokens.
Arkham describes its platform as “a comprehensive blockchain intelligence platform designed to make understanding blockchain activity easier for its users,” a toolset that has increasingly been used by traders to track large team and whale movements across tokens.
The firm has previously flagged activity in long-dormant Bitcoin wallets moving more than $250 million in BTC, showing how similar alerts can precede shifts in market sentiment when large holders reposition.
For SENT holders, the key question is whether the 687 million tokens have been repositioned for custody, internal restructuring or eventual distribution, since any sizable redeposit to exchanges could increase perceived sell pressure.
SENT’s circulating supply of 7.23 billion sits against a total supply of 34.35 billion, leaving significant headroom for future unlocks or transfers from team and treasury wallets, a dynamic that has been a recurring risk factor across the AI-token sector.
Recent coverage on crypto.news of Arkham-tracked whale moves, including a dormant Bitcoin whale moving $250 million in BTC and activity around Satoshi-linked addresses, has shown how on-chain forensics can front-run major flows in both blue-chip and niche assets.
As Arkham notes in a broader guide to blockchain intelligence, on-chain monitoring is now a core part of trading, compliance and even law enforcement workflows, and large internal transfers like today’s Sentient move will likely remain under close watch from market participants.
Key points:
-
Buyers aggressively bought into the dip in Bitcoin, indicating positive sentiment. That increases the possibility of a rally to $84,000.
-
Several major altcoins have pulled back to their support levels, signaling that the bears remain sellers on rallies.
Bitcoin (BTC) corrected over the weekend but is finding buyers at lower levels, indicating a positive sentiment. According to SoSoValue data, US spot BTC exchange-traded funds recorded $996 million in inflows last week, the best weekly performance since early January.
The cryptocurrency recovery may be at risk if the US and Iran do not reach a deal before the two-week ceasefire ends on Wednesday, or if the ceasefire is not extended. Trading resource Mosaic Asset Company said in its newsletter that “intensifying hostilities could unwind the bullish action over the past few weeks.”

However, the short-term uncertainty could not stop Michael Saylor’s Strategy from adding more BTC to its portfolio. The BTC treasury company purchased 34,164 BTC between April 13 and April 19 for $2.54 billion, according to an 8-K filing with the US Securities and Exchange Commission on Monday. That boosted Strategy’s holdings to 815,061 BTC acquired for $61.56 billion.
Could buyers resume the relief rally in BTC and the major altcoins? Let’s analyze the charts of the top 10 cryptocurrencies to find out.
S&P 500 Index price prediction
The S&P 500 Index (SPX) rallied sharply last week, rising to a new all-time high of 7,147 on Friday.

The sharp upward move propelled the relative strength index (RSI) into overbought territory, suggesting the index is at risk of a minor consolidation or pullback in the short term. The first support on the downside is at the breakout level of 7,002, followed by the 20-day exponential moving average (6,828). If the price rebounds off the 20-day EMA, it signals that the uptrend remains intact.
Sellers have an uphill task ahead of them. They will have to swiftly yank the price below the moving averages to signal a comeback.
US Dollar Index price prediction
The US Dollar Index (DXY) turned down sharply from the 20-day EMA (98.73) on April 13 and dropped to the 97.74 support on Friday.

The index is attempting to initiate a relief rally but is expected to encounter selling pressure at the 20-day EMA. If the price again turns down from the 20-day EMA, the possibility of a break below the 97.74 level increases. That may sink the price to the 96.21 support.
The index is likely to remain inside the 95.55 to 100.54 range for a while longer. The next trending move is expected to begin on a close above the 100.54 resistance or below the 95.55 support.
Bitcoin price prediction
BTC has bounced off the 20-day EMA ($72,832), suggesting the bulls are seeing dips as buying opportunities.

The bears are unlikely to give up easily and will attempt to halt the recovery in the $76,000 to $78,333 zone. If the BTC price turns down from the overhead zone and breaks below the moving averages, it suggests that the market has rejected the breakout.
On the other hand, a break and close above the overhead resistance zone signals the resumption of the up move. The BTC/USD pair may then skyrocket to $84,000 and eventually to the pattern target of $92,000.
Ether price prediction
Buyers tried to push Ether (ETH) above the $2,415 level on Saturday, but the bears held their ground. That started a pullback to the 20-day EMA ($2,252).

Buyers will have to fiercely defend the 20-day EMA and secure a close above the $2,415 level to signal the resumption of the relief rally. If they do that, the ETH/USDT pair may march to the $2,800 level.
Sellers are likely to have other plans. They will attempt to push the ETH price below the moving averages, keeping the pair within the $1,916 to $2,415 range for some time.
BNB price prediction
BNB (BNB) continues to oscillate between $570 and $687, signaling a balance between supply and demand.

The flattish moving averages and the RSI near the midpoint do not signal an advantage either to the bulls or the bears. If the BNB price breaks above $650, the next target is likely $687.
Instead, if the price breaks below the 20-day EMA, the BNB/USDT pair may plunge toward the range’s support at $570. The next trending move is expected to begin on a close above $687 or below $570.
XRP price prediction
XRP (XRP) has been consolidating between the $1.27 support and the $1.61 resistance for several days.

The flattish moving averages and the RSI just above the midpoint suggest that the range-bound action may extend for a few more days. Buyers will have to achieve a close above the downtrend line to signal a potential trend change. The XRP price may then surge to $2.
On the downside, a break and close below the $1.27 level signals that the bears are back in the driver’s seat. There is support at the $1.11 level, but that may be broken. The XRP/USDT pair may then tumble toward the support line of the descending channel pattern.
Solana price prediction
Solana (SOL) fell below its moving averages on Sunday, suggesting that higher levels are attracting sellers.

The flattish moving averages and the RSI near the midpoint indicate that the range-bound action may continue for a while. If the price remains below the moving averages, bears will attempt to push the SOL/USDT pair toward the $76 support.
Buyers will have to push the SOL price above the $90 level to open the door to a rally toward the $98 resistance. A close above the $98 level suggests the start of a sustained recovery to the $117 level.
Related: Bitcoin daily gains near 3% as stocks ignore US-Iran war threat, oil drops
Dogecoin price prediction
Dogecoin (DOGE) turned down from the $0.10 psychological level on Friday and has fallen to the moving averages.

The flat moving averages and the RSI near the midpoint do not give either buyers or sellers a clear advantage. If the DOGE price breaks below the moving averages, the $0.09 support may be tested. A break below the $0.09 level may start the next leg of the downward move to $0.08 and subsequently to $0.06.
Buyers will have to push the price above the $0.10 level and maintain it to signal strength. The DOGE/USDT pair may then climb toward the $0.12 resistance level, where bears are expected to step in.
Hyperliquid price prediction
Hyperliquid (HYPE) fell back below the breakout level of $43.76 after staying above it for several days.

The bulls are attempting to halt the pullback at the 20-day EMA ($41.03), but the bears continue to exert pressure. If the 20-day EMA gives way, the HYPE/USDT pair may plummet toward the 50-day SMA ($38.09) and then toward $34.45.
On the contrary, a bounce off the 20-day EMA suggests that the lower levels continue to attract buyers. The bulls will then attempt to drive the HYPE price above the $45.77 level again. If they succeed, the pair may skyrocket to the $50-$51.43 zone.
Cardano price prediction
Cardano (ADA) rose above the 50-day SMA ($0.26) on Friday, but the bulls could not sustain the higher levels.

The ADA/USDT pair turned lower on Saturday, falling below the $0.25 level. Sellers will attempt to strengthen their position by driving the ADA price below $0.23. If they manage to do that, the pair may resume its downtrend to $0.22 and later to the support line of the descending channel pattern.
Buyers will have to push the price above the downtrend line and maintain it there to signal a potential short-term trend change. The pair may then rise to $0.32, then to $0.37.
This article does not contain investment advice or recommendations. Every investment and trading move involves risk, and readers should conduct their own research when making a decision. While we strive to provide accurate and timely information, Cointelegraph does not guarantee the accuracy, completeness, or reliability of any information in this article. This article may contain forward-looking statements that are subject to risks and uncertainties. Cointelegraph will not be liable for any loss or damage arising from your reliance on this information.

TLDR
- Strategy purchased 34,164 BTC for about $2.54 billion at an average price of $74,395 per coin.
- MSTR stock fell more than 2.5% in pre-market trading after the announcement.
- The company now holds 815,061 BTC acquired for about $61.56 billion.
- Strategy funded the purchase through preferred and common stock sales.
- Michael Saylor said the company achieved a 9.5% BTC yield year-to-date in 2026.
Strategy expanded its Bitcoin holdings with a $2.54 billion purchase, yet MSTR stock fell in pre-market trading. The company disclosed that it acquired 34,164 BTC at an average price of $74,395 per coin. However, shares declined more than 2.5%, even as the firm increased its treasury reserve.
Bitcoin Purchase Expands Corporate Treasury
Strategy confirmed in a Form 8-K filing with the U.S. Securities and Exchange Commission that it completed the acquisition last week. The company funded the transaction through capital raised from its at-the-market equity programs. As a result, Strategy increased its total Bitcoin holdings to 815,061 BTC.
Michael Saylor announced the purchase on X and stated that the company achieved a 9.5% BTC yield year-to-date in 2026. He said Strategy acquired its total holdings for about $61.56 billion at an average price of $75,527 per Bitcoin. Therefore, the company’s cost basis stands close to current Bitcoin prices in the mid-$75,000 range.
Strategy reported that it raised $2,542.3 million during the reporting period. It generated $2,176.3 million in net proceeds from selling 21,795,389 shares of STRC preferred stock. It also secured $366.0 million from issuing 2,165,000 shares of Class A common stock.
The company stated that it still holds $19,463.0 million in remaining STRC issuance capacity. It also listed $26,729.7 million available under common stock offerings. Consequently, Strategy retains room to pursue further Bitcoin acquisitions using equity markets.
MSTR Stock Reacts to Funding Structure
MSTR stock declined more than 2.5% in pre-market trading following the disclosure. The drop occurred despite the company expanding its Bitcoin reserve by over 34,000 BTC in one week. Market participants assessed the impact of ongoing share issuance on existing shareholders.
Peter Schiff criticized the financing approach and said the model could lead to continued shareholder dilution. He pointed to preferred shares carrying an 11.5% yield as part of the capital structure. He stated that Strategy “is moving toward more expensive forms of capital.”
Strategy’s dashboard showed a BTC reserve value of $58,756 million based on internal metrics. The company reported Bitcoin per share at 205,812 sats and an mNAV ratio of 1.28. It also listed $8,254 million in debt and a net leverage ratio of 10%.
The company disclosed annual dividend obligations of $1,237 million tied to preferred stock. It reported 47.5 years of dividend coverage based on its current Bitcoin holdings. The latest filing confirmed that capital markets remain the primary funding source for ongoing Bitcoin purchases.
Since Paul Atkins was sworn in as chair of the US Securities and Exchange Commission (SEC) on April 21, 2025, the agency has significantly changed its position on regulation and enforcement related to digital assets, marking a shift from the leadership of former chair Gary Gensler during the Biden administration.
During his 2024 presidential campaign, Donald Trump made removing Gensler one of his promises to the crypto industry, along with creating a national Bitcoin (BTC) stockpile and opposing the issuance of a US central bank digital currency.
His November 2024 election win led to Gensler’s resignation in January 2025 and the appointment of SEC commissioner Mark Uyeda as acting chair of the financial regulator until the Senate could confirm Atkins as Trump’s pick to lead the agency.

Even before the Senate voted to confirm Atkins, the SEC was already signaling a change in crypto regulation and enforcement under Trump. Uyeda oversaw the creation of an SEC crypto task force headed by Commissioner Hester Peirce and the agency began to drop civil enforcement actions and investigations into crypto companies, starting with Coinbase in February.
The first 12 months of Atkins’ chairmanship has seen the SEC push policies and approaches to regulation widely viewed as favorable to the crypto and blockchain industry.
In addition to wrapping up enforcement actions, the regulator has approved multiple exchange-traded funds tied to various crypto assets, signed a memorandum of understanding with the Commodity Futures Trading Commission (CFTC) over coordination on digital asset regulation and issued an interpretative notice on not treating most cryptocurrencies as securities under federal law.
Related: One year after Gary Gensler’s exit, SEC’s crypto playbook looks very different
“A year goes by quickly, but we’ve made huge progress, I think,” said Atkins in a Monday CNBC interview. “I promised a new day at the SEC when I came aboard, and we have. We’ve pivoted from the old practice of regulation through enforcement and the opaqueness of the agency, as, for example, with crypto.”

SEC chair faces scrutiny from Democratic lawmakers
While many in the crypto industry have lauded Atkins’ approach to digital assets since taking office, Congressional Democrats have criticized the SEC and chair for potential conflicts of interest following dropped investigations and enforcement actions against companies tied to Trump and his family.
Last week, Massachusetts Senator Elizabeth Warren accused the SEC chair of misleading Congress in his testimony before a House committee in February. Warren said in an April 15 letter that the SEC’s own data from the 2025 fiscal year showed the agency had fewer enforcement actions than at any point in the previous 10 years.
Magazine: Adam Back says current demand is ‘almost’ enough to send Bitcoin to $1M

Early Threats Recovery Plan
The first phase focuses on recovery actions in case of the failure of classical cryptography. Engineers will introduce a comprehensive migration trajectory, which will require users to transfer funds to quantum-secure accounts. Moreover, the strategy will guarantee that user assets are not exposed in case of a transition event caused by compromised keys. Ripple engineers are exploring zero-knowledge proof systems that prove ownership of existing accounts without disclosing any private keys. As a result, the network will be able to promote safe migrations and safeguard sensitive information. The XRP Ledger already has building blocks that facilitate this approach such as seed-based key generation.
The second step is concerned with testing the algorithms suggested by the National Institute of Standards and Technology. In addition to in-house testing, Ripple has collaborated with Project Eleven to build hybrid signing systems that fuse existing and post-quantum techniques. The next stage will involve developers starting to incorporate new signature systems with the existing elliptic curve techniques. Additionally, developer networks will begin to be tested to enable applications to be modified. Ripple will also analyse encryption tools that uphold privacy and compliance to tokenized assets.
The final stage involves a full transition toward post-quantum cryptography within the XRP Ledger ecosystem. Ripple therefore intends to implement protocol changes that will facilitate the adoption of new signature systems on a large scale. This move will transition the network from testing into full deployment in line with the stated timeline. The XRP Ledger already includes features to enable long-term resilience against quantum risks. Notably, key rotation enables users to refresh private keys without changing accounts, and deterministic generation of keys enables security upgrades to be controlled. These functionalities will provide a foundation for future upgrades as quantum technology advances.

Is Private Credit About To Crash The Global Economy?

15 bungalows to be built near Strait Lane, Stainton
Facebook Messenger Instability Frustrates Users as Outages, Web Shutdown and Backend Changes Pile Up in 2026


-

 NewsBeat6 days ago
Trump and Pope Leo: Behind their disagreement over Iran war
-

 Fashion3 days ago
Weekend Open Thread: Theodora Dress
-

 Crypto World7 days ago
SEC Signals Exemption for Crypto Interfaces From Broker Registration
-

 News Videos6 days ago
Secure crypto trading starts with an FIU-registered
-

 Sports3 days ago
NWFL Suspends Two Players Over Post-Match Clash in Ado-Ekiti
-

 Crypto World7 days ago
SEC Proposes Certain Crypto Interfaces Don’t Need to Register as Brokers
-

 Business1 day ago
Powerball Result April 18, 2026: No Jackpot Winner in Powerball Draw: $75 Million Rolls Over
-

 Crypto World3 days ago
Russia Pushes Bill to Criminalize Unregistered Crypto Services
-

 Politics3 days ago
Palestine barred from entering Canada for FIFA Congress
-
 Business4 days ago
Creo Medical agree sale of its manufacturing operation
-

 Politics1 day ago
Zack Polanski demands ‘council homes not luxury flats for foreign investors’
-
 Entertainment7 days ago
Brand New Day’ Footage Reveals the Devastating Impact of ‘Now Way Home’
-

 Crypto World3 days ago
Russia Introduces Bill To Criminalize Unregistered Crypto Services
-

 Tech2 days ago
Auto Enthusiast Scores Running Tesla Model 3 for Two Grand and Turns It Into Bare-Bones Go-Kart
-
 Entertainment7 days ago
Karol G’s ‘Ultra Raunchy’ Coachella Set Gave ‘Satanic Vibes’
-

 Tech6 days ago
Microsoft adds Windows protections for malicious Remote Desktop files
-

 Tech5 days ago
‘Avatar: Aang, The Last Airbender’ Leaked Online. Some Fans Say Paramount Deserves the Fallout
-

 Entertainment7 days ago
How Babylon 5 Turned Brief Side Story Into Emotional Masterpiece
-

 Tech7 days ago
What was the first ransomware attack to demand payment in Bitcoin?
-

 Business7 days ago
Intuitive Machines Stock Climbs 2.4% as $180M NASA Lunar Contract and $900M Revenue Outlook Fuel Momentum
You must be logged in to post a comment Login