

Crypto World
S&P 500 Index CFDs: Market Access and Trading Structure

The S&P 500 Index tracks the performance of 500 large US companies and is widely used as a benchmark for equity markets. Market participants typically gain exposure through instruments such as CFDs, futures, or ETFs. CFD trading enables positioning on both rising and falling price movements without ownership of the underlying assets. This article covers how the index is structured, what moves the S&P 500, and how traders commonly approach S&P 500 CFDs in practice.
What Is the S&P 500 Index?
The S&P 500 Index is a stock market index that tracks 500 of the largest publicly traded companies in the United States. It covers approximately 80% of available US market capitalisation and serves as a benchmark for the performance of US equities.
S&P Dow Jones Indices manages the index and selects constituents through a committee. Companies must meet criteria including a minimum market capitalisation of $22.7 billion, adequate liquidity, and sector representation. The index is rebalanced quarterly in March, June, September, and December, and constituent changes can happen at any time.
The S&P 500 uses a float-adjusted market-cap weighting system. Each company’s influence on the index depends on the total market value of its publicly available shares. Larger companies carry more weight than smaller ones. As of early 2026, the top 10 constituents, including NVIDIA, Apple, Microsoft, and Amazon, accounted for over 37% of the entire index.
That concentration matters for traders. When a stock like NVIDIA, weighted at over 7%, moves by 2% in a session, it shifts the index far more than a smaller constituent moving by the same amount. Traders watching the S&P 500 often pay close attention to these heavily weighted names, as their price action can drive the direction of the index on any given day.
How Is the S&P 500 Calculated and Why Does Weighting Matter?
The S&P 500 weights each company by its float-adjusted market capitalisation, meaning only shares available for public trading count towards a company’s influence on the index. A company with a larger public float and higher share price carries more weight than a smaller one.
To calculate the index value, the combined float-adjusted market caps of all 500 companies are added together and divided by a number called the divisor. The divisor is adjusted whenever structural changes occur, such as stock splits, spin-offs, or constituent swaps, so that these events do not create artificial jumps in the index level. It keeps the index continuous over time.
This structure also creates a built-in momentum effect. As a company’s price rises, its weighting in the index increases automatically, giving it even more influence over the index’s direction. The reverse happens during selloffs. That’s why recent extended rallies in a handful of large-cap technology stocks have pulled the S&P 500’s sector balance and intraday price action heavily towards big tech names.
What Moves the S&P 500 Index?
Federal Reserve policy, macroeconomic data, corporate earnings, and geopolitical developments are the main drivers of S&P 500 price movements.
Interest rate decisions from the Federal Reserve tend to have the most direct impact. Lower rates reduce borrowing costs for companies and make equities more attractive relative to bonds. Higher rates do the opposite. Even the tone of a Fed statement or press conference can shift sentiment within minutes.
Inflation data, particularly the Consumer Price Index (CPI), influences the market because it shapes expectations about future rate moves. Labour market reports carry similar weight. A stronger-than-expected Nonfarm Payrolls (NFP) print can push the index lower if traders interpret it as a reason for the Fed to keep rates elevated.
Corporate earnings round out the fundamental picture. During earnings season, which occurs four times a year, results from heavily weighted companies like Apple, Microsoft, and NVIDIA can move the index on their own. Sector leadership also shifts over time. In recent years, technology stocks have driven much of the index’s direction, but rotations into financials, energy, or healthcare occur as economic conditions change.
Geopolitical risk, including trade policy shifts and military conflicts, adds another layer of volatility. They affect bond yields and the US dollar. Rising 10-year Treasury yields compete with equities for capital, while a stronger dollar pressures the earnings of S&P 500 companies that generate a large part of their revenue internationally.
Releases traders commonly watch include:
- Federal Reserve interest rate decisions and meeting minutes
- CPI (inflation)
- Nonfarm Payrolls (first Friday of each month, 8:30 am ET)
- Quarterly earnings from top-weighted constituents
S&P 500 Trading Instruments: CFDs, Futures, ETFs
Market participants typically access the S&P 500 through three main instruments: contracts for difference (CFDs), futures, and exchange-traded funds (ETFs). Each works differently in terms of capital requirements, costs, and flexibility.
S&P 500 futures are standardised, exchange-traded contracts that provide exposure to the forward value of the S&P 500, with central clearing and high institutional liquidity. Each contract has predefined specifications, including contract size, tick value, and fixed expiry dates, after which positions must be rolled or settled – a distinct feature of S&P 500 futures vs CFDs and ETFs.
Pricing is determined directly on regulated exchanges and reflects real-time expectations of market participants, with margin requirements set by the exchange rather than a broker. As a result, they are typically used for hedging, macro positioning, and short-term trading around key data release.
S&P 500 ETFs are exchange-traded funds that aim to replicate the performance of the S&P 500 by holding a basket of its constituent stocks, offering direct, unleveraged exposure to the underlying market. Unlike derivatives, ETFs are traded on stock exchanges in the same way as individual shares, with pricing driven by net asset value and market demand, and without features such as overnight financing charges or contract specifications like expiry.
If you’re wondering, “Can you short the S&P 500 with ETFs?”, it is possible to gain short exposure through inverse ETFs and leverage can be embedded in certain products. However, standard S&P 500 ETFs are typically used for longer-term positioning, portfolio diversification, and capital allocation rather than short-term, margin-based trading. However, you don’t have to invest in ETFs, you can trade CFDs on index or ETF.
CFDs are derivative contracts that track the price of the underlying asset without requiring ownership of them. Traders can take both long and short positions, meaning they can take advantage of rising or falling prices. CFDs typically offer leverage, which means a smaller initial capital controls a larger position. There is no fixed expiry date, though overnight funding costs (swaps) may apply when positions are held past the daily close.
At FXOpen, you can trade CFDs on the S&P 500 (US SPX 500 mini) and other global indices from the US, Europe, and Asia with zero commission* and ETF CFDs, including SPDR S&P 500 ETF Trust (SPY), with tight spreads* and low commissions*. All trading instruments are available through the TickTrader trading platform.
CFD and ETF trading differ in several ways, particularly around leverage and short-selling access.
S&P 500 CFD Trading Process
Trading the S&P 500 via CFDs typically follows a structured workflow. Below is a common approach used by some traders when exploring how to trade S&P 500 CFDs.
1. Choosing between a cash index CFD or a futures-based CFD.
The cash-style CFD typically offers tighter spreads and closer tracking to the spot level of the S&P 500, but incurs daily overnight funding costs when positions are held beyond the trading day.
In contrast, a futures-based CFD reflects the price of the underlying futures contract, where the cost of carry (interest rates and expected dividends) is already embedded in the price. As a result, it does not involve daily funding charges, but has a fixed expiry date and may require rollover into the next contract for longer-term positions.
Futures on the S&P 500, such as E-mini contracts, are typically cash-settled at expiry, meaning no physical delivery of underlying shares takes place.
2. Defining a directional bias using technical or fundamental analysis.
Traders commonly form a view on the index direction before engaging with S&P 500 trading, guided by chart-based analysis, such as support and resistance levels, or a fundamental view based on upcoming earnings or central bank policy.
3. Marking upcoming event risk on the calendar.
Fed decisions, CPI releases, NFP prints, and major earnings dates can all trigger sharp moves. Many traders note these dates in advance and adjust their approach accordingly, either by reducing position size or waiting until after the release.
4. Setting an entry level, stop-loss, and target before placing the trade.
Pre-defining these levels is a common practice in CFD trading. Stop-loss and take-profit levels are typically based on technical levels or a fixed risk-to-reward ratio.
5. Sizing the position relative to account equity and stop distance.
Position sizing determines how much capital is at risk. Some traders risk a fixed percentage of the trading account per trade, often between 1% and 3%.
6. Monitoring overnight funding costs, spreads, and margin requirements.
Holding S&P 500 CFD positions overnight may incur a swap charge. Spreads can also widen during low-liquidity periods, such as the daily maintenance break or ahead of major data releases. Traders typically keep margin usage in check to avoid margin calls during volatile moves.
S&P 500 Trading Conditions and Risk Considerations
S&P 500 CFD trading concentrates around the US cash session and key data releases, while leverage, gap risk, and overnight funding costs are the main risk factors traders typically account for.
Market Sessions and Liquidity Patterns
The New York session runs from 9:30 am to 4:00 pm ET, this is when trading volume and liquidity peak. The first 30 minutes after the open and the final 30 minutes before the close tend to produce the sharpest price moves, as institutional order flow concentrates at these times.
Outside the standard session, S&P 500 CFDs are available to trade for nearly 24 hours on weekdays, tracking the underlying futures market. Liquidity thins during the overnight period, particularly between the US close and the Asian open. Spreads often widen during these quieter hours.
The European-US overlap, roughly 8:00 am to 11:30 am ET, typically brings a second wave of activity as London-based participants trade alongside New York. US macroeconomic releases at 8:30 am ET, including NFP and CPI, frequently trigger volatility before the market even opens.
Risk Factors in S&P 500 CFD Trading
Leverage is the most prominent risk in US 500 CFD trading. While it reduces the capital needed to take a position, it also amplifies losses at the same rate it amplifies gains. A small adverse move in the index can result in a loss larger than the initial margin if risk controls are not in place.
Stop-loss orders are used by traders as a risk management tool, but they do not guarantee execution at the specified price during fast-moving markets. Gaps, where the price jumps past a specified stop level between sessions, can occur after major news events or over weekends.
Overnight funding costs accumulate on positions held past the daily close. These are calculated based on the position direction and prevailing interest rates, typically resulting in a charge for long positions, while short positions may receive a credit, depending on market conditions and broker pricing.
Comparison of the S&P 500, Nasdaq 100, and Dow Jones
The S&P 500, Nasdaq 100, and Dow Jones Industrial Average differ primarily in composition, weighting methodology, and sector exposure, making each index reflect a distinct segment of the US equity market and respond differently to macroeconomic and earnings-driven developments.
The Nasdaq 100 tracks 100 of the largest non-financial companies listed on the Nasdaq exchange. Its heavy concentration in technology stocks, which make up more than half the index, means it tends to move more aggressively during tech-driven rallies and selloffs.
The Dow Jones Industrial Average takes a more concentrated approach, comprising just 30 large, established US companies, often viewed as industry leadersю It is less diversified than broader indices and tends to reflect the performance of a select group of mature, globally recognised corporations rather than the wider US equity market.
The S&P 500 sits between the two in terms of breadth and sector balance. With 500 constituents across all 11 GICS sectors, it offers the widest representation of the US economy among the three.
S&P 500 vs Nasdaq 100 vs Dow Jones
Each index responds differently to the same catalyst. A Fed rate cut, for example, tends to have a larger impact on the Nasdaq 100 because growth and technology stocks are more sensitive to interest rate changes. The DJIA, with its tilt towards mature, dividend-paying companies, typically reacts less sharply. The S&P 500 falls somewhere in between, given its broader mix.
The Bottom Line
The S&P 500 gives traders broad exposure to the US equity market through a single instrument. CFDs offer a way to take positions on both rising and falling prices, with leverage and near 24-hour access on weekdays. Understanding what drives the index, how weighting affects price action, and how sessions influence liquidity can support your market analysis.
Wondering how to trade the S&P 500 index via CFDs alongside forex, commodities, and share CFDs? You may consider opening an FXOpen account and gain exposure to US SPX 500 mini (the FXOpen version of S&P 500 E-mini futures) with zero commission* and SPDR S&P 500 ETF Trust (SPY) with tight spreads*.
FAQs
What Is the S&P 500 Index?
The S&P 500 is a stock market index that tracks 500 large US companies across all major sectors. It covers approximately 80% of available US market capitalisation and uses float-adjusted market-cap weighting, meaning larger companies have more influence on the index’s value.
Can You Trade the S&P 500 With CFDs?
Yes. CFDs allow traders to speculate on S&P 500 price movements without owning the underlying shares. Positions can be taken on both rising and falling prices, and leverage reduces the capital required. At FXOpen, you can trade the US SPX 500 mini (SPXm) index and SPDR S&P 500 ETF Trust (SPY) CFDs with low commissions* and tight spreads*.
What Factors Influence S&P 500 Price Movements?
Federal Reserve interest rate decisions, inflation data, labour market reports (NFP), GDP figures, and corporate earnings are the primary drivers. Bond yields, US dollar strength, and geopolitical events such as trade policy changes also affect sentiment and index direction.
When Is S&P 500 Market Activity Typically Highest?
Liquidity peaks during the US cash session from 9:30 am to 4:00 pm ET. The first and last 30 minutes of that session tend to see the sharpest price moves. Macroeconomic releases at 8:30 am ET may also generate high volatility.
What Is the Difference Between Trading the S&P 500 and Investing in It?
Trading the SPX 500 online typically involves short-term positioning around price movements, often using leveraged instruments like CFDs or futures. Investing usually means buying and holding ETFs such as SPY or VOO over longer periods to gain exposure to the index’s long-term performance.
Can Positions on the S&P 500 Be Taken in Both Directions?
Yes. CFDs and futures allow traders to go long if they expect the index to rise or go short if they expect it to fall. ETFs are primarily used for long positions, though some inverse ETFs exist for short exposure.
*Additional fees may apply.
This article represents the opinion of the Companies operating under the FXOpen brand only. It is not to be construed as an offer, solicitation, or recommendation with respect to products and services provided by the Companies operating under the FXOpen brand, nor is it to be considered financial advice.


Payward, the parent company of crypto exchange Kraken, is working with asset manager Franklin Templeton to expand the use of tokenized financial products for institutional investors.
The companies said Tuesday they will develop a range of blockchain-based investment offerings, including tokenized yield products, tokenized equities and custody services tied to digital assets.
The move comes as large financial firms explore testing tokenized versions of conventional assets. BlackRock, Fidelity and JPMorgan have all expanded blockchain-related financial products over the past two years, particularly tokenized Treasuries and money market funds.
Tokenization refers to representing traditional financial assets such as stocks, bonds or money market funds on blockchain networks, where they can be traded and settled digitally. Supporters argue the approach can reduce settlement times, expand market access and allow assets to move more easily between financial platforms.
The collaboration joins two firms that have taken different routes into tokenized finance. Franklin Templeton has spent years building blockchain-based investment products. Payward has focused on crypto trading infrastructure through Kraken and its xStocks tokenized equities platform, which the company says has processed more than $30 billion in trading volume since starting up in 2025.
The firms plan to explore actively managed tokenized investment products that could trade onchain and become available to institutional investors and, in some jurisdictions, retail Kraken users.
Kraken also plans to integrate BENJI, Franklin Templeton’s suite of tokenized money market funds, into its platform. The funds could serve as collateral or cash management tools for institutional trading clients seeking blockchain-based alternatives to traditional treasury operations.
Analysts view tokenized Treasury funds as one of the fastest-growing sectors in digital assets because they offer yields tied to government securities while operating on blockchain rails. In practice, that can allow institutions to move collateral around the clock instead of waiting for banking hours or multiday settlement periods.
Read more: Kraken parent Payward seeks fresh funding at $20 billion valuation ahead of planned IPO


Blockchain analytics firm Elliptic said it raised $120 million in fresh funding from investors including Nasdaq Ventures and Deutsche Bank as financial institutions ramp up spending on crypto compliance and security infrastructure.
The fundraising round, led by growth equity firm One Peak, values the London-based company at $610 million, according to a Tuesday press release. The British Business Bank also participated.
The investment comes as crypto markets face a wave of security breaches and exploits that have exposed weaknesses in both decentralized finance (DeFi) protocols and centralized platforms. Hackers have stolen nearly $3 billion in crypto assets since the beginning of 2025 through smart contract exploits, phishing attacks and cross-chain bridge breaches, and regulators are pushing exchanges and banks to tighten anti-money laundering controls.
As a result, blockchain analytics firms have become critical infrastructure providers for institutions entering the digital asset industry. Elliptic’s software tracks crypto transactions across dozens of blockchains and flags wallets linked to sanctions, fraud, ransomware or illicit finance.
Banks, exchanges and government agencies use these tools to monitor transactions and comply with financial crime rules. The company said two-thirds of global crypto trading volume flows through exchanges that already use its services.
Demand for those systems has accelerated alongside the growth of stablecoins and tokenized assets, which are increasingly moving into mainstream finance. Stablecoins accounted for roughly $33 trillion in transactions last year, according to the company.
Large financial firms are also exploring tokenized securities and blockchain-based settlement systems, raising the stakes for compliance providers that can monitor activity across public blockchains in real time. At the same time, artificial intelligence (AI) tools are making attacks cheaper and faster, forcing a rethink of how crypto systems stay secure.
Elliptic said the new funding will be used to expand its AI-driven monitoring and risk analysis tools as institutional adoption of digital assets grows.
“One of the things that we will be accelerating with the funding is our agentic product roadmap,” CEO Simone Maini told CoinDesk. “What that means is building and launching agents that sit on top of Elliptic’s dataset to be able to automate a lot of what is otherwise highly manual, repetitive tasks performed by compliance analysts.
“That means those that that those precious resources can be redeployed to deep diving and investigating financial crime where they need to,” she said.


BlackRock has filed for a new tokenized fund structure with the SEC, selecting Securitize infrastructure for the second time after BUIDL’s $2.3B success.
Crypto World
The battle for the digital euro is heating up as central bankers clash over how to take on Tether


France’s central bank deputy governor called Tuesday for the “mobilization of all relevant European players, public and private,” to develop tokenized money.
Beau’s comments are in stark contrast with European Central Bank (ECB) President Christine Lagarde’s recent speech in which she said that “the case for promoting euro-denominated stablecoins is far weaker than it appears.”
While Lagarde described the $310 billion privately-issued stablecoin market, currently dominated by Tether’s USDT and Circle’s USDC, as instruments that “risk amplifying the very vulnerabilities we are trying to overcome,” Beau told CoinDesk that private sector solutions are necessary for the region’s economic development.
The different views, however, reveal a growing concern in Europe over the “digital dollarization.” With a stablecoin sector projected to rise to the trillions of dollars in the coming years, a lack of euro-pegged currencies could force European capital into dollar-backed assets, potentially eroding the euro’s global influence and monetary sovereignty.
“To ensure a sound development of tokenized finance in Europe, its payment and settlement asset pillar should be in euro and build on the solid foundation of our current two-tier monetary system,” Beau said in an interview with CoinDesk.
The central banker outlined a “triple objective” for the region, which requires the European Union (EU) to adapt central bank money services, develop “pan-European solutions in tokenized private money issued by regulated financial institutions,” and strengthen the bloc’s Markets in Crypto-Assets Regulation (MiCA).
Beau’s stance aligns with Qivalis
Beau’s stance aligns with Qivalis, a group of 12 major European banks, including ING, BBVA, and BNP Paribas, which plans to launch a private digital euro later this year.
Qivalis CEO Jan-Oliver Sell recently told CoinDesk that without a liquid onchain euro, “the only alternative is the U.S. dollar,” which he described as a “risk to Europe’s financial and digital sovereignty.”
Lagarde agrees with the need for digital asset alternatives to dollar-pegged stablecoins, warning that USDT and USDC pose “financial stability risks” for Europe and could “transmit stress to the underlying asset markets during periods of turmoil.”
However, while Beau advocates for immediate private-sector mobilization to capture market share, Lagarde favors a central bank digital euro, which in previous statements she suggested would be ready by 2029.
Beau noted that the Eurosystem is already moving to provide native settlement options. “A first deliverable will become available by the end of this year, with the opening of our wholesale central bank money service in tokenized form,” he said, referencing projects such as Pontes.
The opposing views between Lagarde and Beau come as U.S. dollar-pegged tokens account for 98% of the stablecoin market.
While Lagarde argues that stablecoins, “do not confer the unconditional finality that central money does,” Beau maintains that public and private efforts “should complement and support each other” to ensure the euro remains a viable settlement instrument in an increasingly tokenized global economy.
Crypto World
Ripple Price Analysis: XRP Retakes Crucial Resistance, Is the Breakout Finally Starting?
XRP is trading at $1.45 as the second week of May is underway, and for the first time in several months, the technical picture carries a genuine sense of compression and potential energy.
A symmetrical triangle that has been forming since February is now at its apex, with the price breaking above the upper boundary and the RSI climbing to above 50. The broader market’s momentum provides a backdrop that XRP has not had the luxury of in most prior setups this cycle.
Ripple Price Analysis: The USDT Pair
Since February, XRP has been carving out a symmetrical triangle on the daily chart, formed by a series of lower highs and higher lows converging into an increasingly tight range. The upper boundary sits around $1.43 and has been broken to the upside over the weekend.
The higher boundary of the large descending channel and the 100-day moving average (located around the $1.40 mark) have both been broken as well. With the RSI recovering and building momentum above 50, almost all signals point to a potential surge in the coming weeks.
A daily close above the $1.50 psychological level would confirm the bullish technical development and open the path toward the next significant zone at $1.80, where the 200-day moving average is also located. On the contrary, a rejection and drop back below $1.40 would invalidate the pattern entirely and put the $1.20 February low back in immediate focus.

The BTC Pair
The XRP/BTC pair has also staged a meaningful recovery from the deeply oversold extreme reached in early May, when the RSI touched approximately 25. From the lows near 1730–1740 sats, the market has bounced back to 1800 sats, now testing the horizontal resistance zone formed by the February low. The RSI has also recovered to the 45–50 range, confirming the oversold relief bounce, while also demonstrating a clear bullish divergence.
The 1800 sats resistance zone is the first real test of this bounce. A clean breakout and close above it would open the path toward the 2000 sats area, where the 100-day moving average is also located at the moment. That, in turn, remains the minimum threshold required to suggest XRP is beginning to recover ground against Bitcoin rather than simply bouncing from an extreme.
Still, the broader downtrend on this pair is intact, as both the 100-day and 200-day moving averages continue to decline well above the price, and until one of them is reclaimed, any BTC-relative gains remain corrective rather than structural.

The post Ripple Price Analysis: XRP Retakes Crucial Resistance, Is the Breakout Finally Starting? appeared first on CryptoPotato.


Shopping giant eBay has rejected video game retailer GameStop’s ambitious $56 billion takeover offer, leaving the latter to decide whether it wants to walk away, raise the bid or take the fight directly to shareholders.
EBay’s board called the half-cash, half-stock offer “neither credible nor attractive” on Tuesday, per Reuters, citing doubts around financing and arguing the company is better positioned under its current management. The rejection was widely expected. EBay has traded well below GameStop’s $125-per-share bid since the offer surfaced, a sign investors were not convinced the deal could close.
That puts GameStop’s bitcoin position back in the conversation, as CoinDesk reported earlier this month.
The cultish firm holds roughly $368 million worth of bitcoin exposure via a covered-call options strategy. It shifted nearly all of its 4,709 BTC to institutional brokerage Coinbase Prime, as a filing showed in March, turning the position into a receivable rather than directly held bitcoin.
GameStop’s offer was built around $9.4 billion of cash and liquid investments, plus up to $20 billion in debt financing from TD Bank. But that financing is contingent on the combined company maintaining an investment-grade rating, and Moody’s has already warned the deal would be credit negative for eBay. Raising the offer or going hostile would likely make the financing math more challenging.
Cohen has previously framed the eBay deal as “way more compelling than bitcoin,” leaving open the question of whether GameStop’s BTC position could be unwound if more cash is needed.
Selling it would not fund the deal by itself, but it is one of the few discretionary assets GameStop can point to as it tries to convince investors the bid is real.
The market remains skeptical, however. EBay shares slipped about 1% to $107 before the bell Tuesday, still far below the offer price, while GameStop fell 4%.
The deal previously drew pushback from parts of GameStop’s own investor base.
Michael Burry, the investor made famous by The Big Short, sold his stake after the bid and warned that buying eBay could saddle GameStop with debt and dilute shareholders.
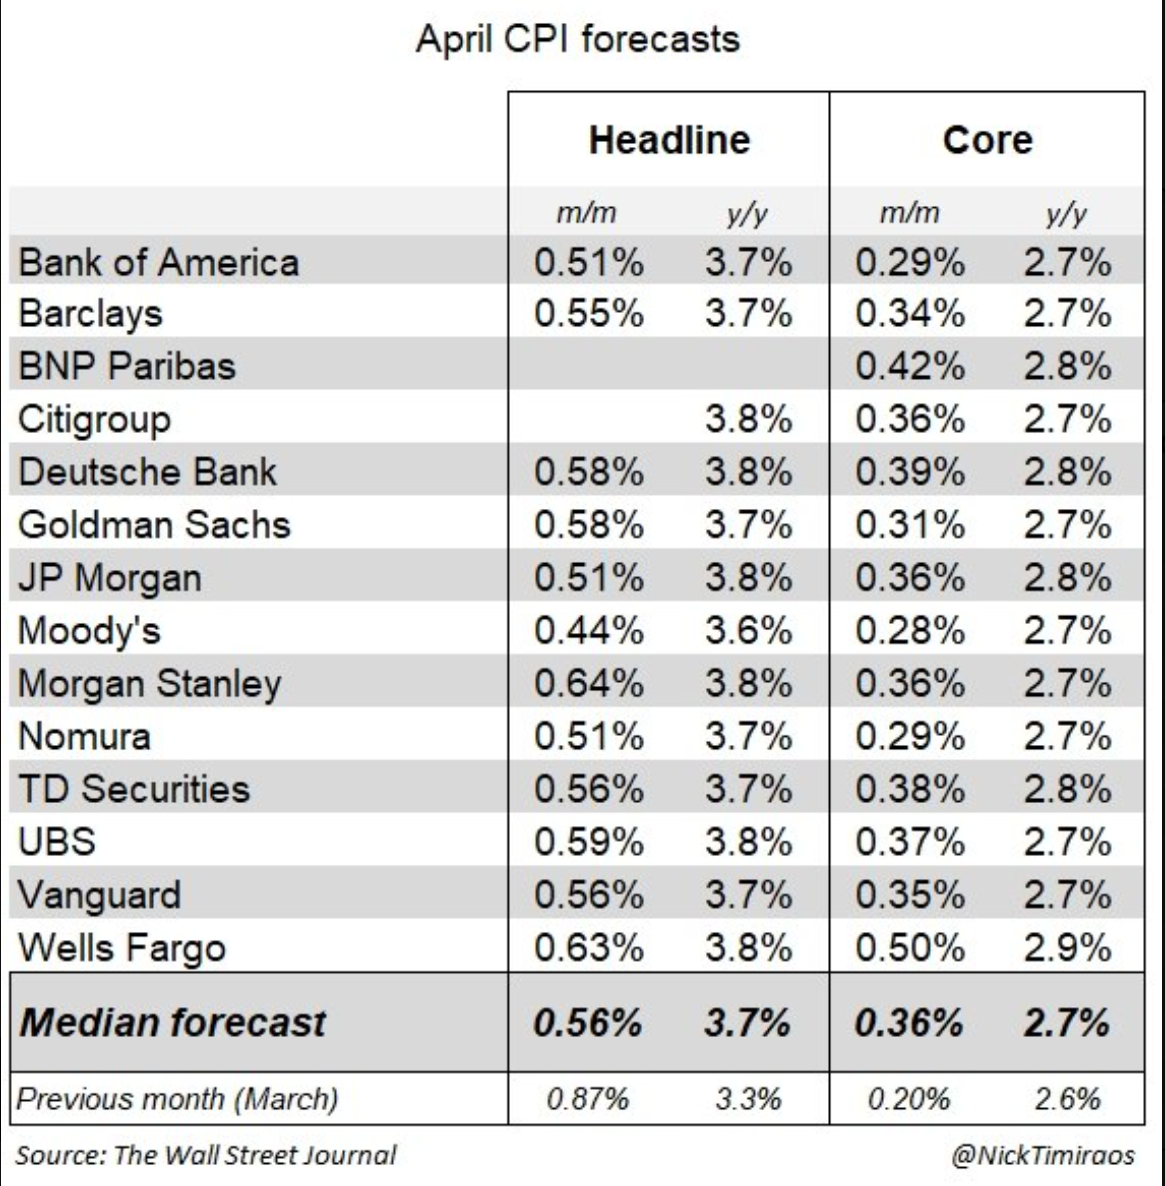
U.S. inflation accelerated more than expected in April, rattling crypto markets and reinforcing fears that the Federal Reserve may keep interest rates higher for longer.
Bitcoin and other risk assets turned volatile after headline CPI rose to 3.8% year-over-year, above Wall Street expectations of 3.7%, while core inflation also came in hotter than forecast.
Inflation Comes in Hotter Than Expected
The latest U.S. Consumer Price Index report showed inflation pressures remain stubborn despite months of cooling hopes from investors.
April CPI rose 3.8% year-over-year, beating consensus estimates of 3.7%. Core CPI, which excludes food and energy prices, climbed 2.8% year-over-year versus expectations of 2.7%.
Markets were already bracing for a strong inflation print after analysts warned that rising gasoline prices, geopolitical tensions, and persistent shelter costs could push the numbers higher.
Several major Wall Street banks, including JPMorgan, Deutsche Bank, and UBS, had projected elevated readings ahead of the release.

The hotter-than-expected report immediately raised concerns that the Federal Reserve could delay interest rate cuts deeper into 2026.
Before the data release, investors wagered a 97.6% change the Fed would hold rates steady at its June meeting. The latest inflation data is likely to reinforce that stance.

Bitcoin and Risk Assets Face Pressure
Crypto traders entered the CPI release cautiously, with many expecting sharp volatility around the data.
Bitcoin swung higher after the report as Treasury yields also climbed, as inflation and Fed tightening expectations rise, increasing required bond yields.

Risk-sensitive assets, including technology stocks and cryptocurrencies, often struggle when inflation remains elevated because higher interest rates tighten financial conditions and reduce liquidity appetite.
“This month’s CPI release looks like a problem for risk assets, but not yet a disaster…the likely reaction will be higher yields, a stronger dollar, increasing pressure on the tech sector, and more volatility in crypto. Bitcoin can hold up better than smaller peers if ETF demand stays strong, but a clean breakout seems unlikely to me, as real yields and the dollar are both working against it,” Arthur Azizov, Founder at B2BROKER Group and B2BINPAY told BeInCrypto.
In this setup, Azizov expects sideways movement with increased volatility in the $80,000 to $85,000 range.
“There is enough inflation pressure to keep risk appetite in check, but not enough to price in a full new tightening cycle,” he added.
Analysts on X had widely warned that a “hot” CPI print could trigger a risk-off reaction across markets. Popular macro accounts pointed specifically to energy inflation and sticky shelter costs as the biggest upside risks.
Why Core Inflation Matters
While energy prices contributed to the rise in headline inflation, investors are closely watching core CPI for signs of broader price persistence across the economy.
The increase to 2.8% in core inflation suggests underlying price pressures remain difficult to tame, complicating the Fed’s path toward rate cuts.
Persistent inflation could keep bond yields elevated and strengthen the U.S. dollar, both of which historically create headwinds for Bitcoin and speculative assets.
What’s Next for Crypto Markets?
Investors will now turn attention to upcoming Producer Price Index data, Federal Reserve commentary, and bond market reactions for clues about the next policy move.
For crypto markets, the key question is whether Bitcoin can maintain support above $80,000 despite fading hopes for rapid monetary easing.
If inflation continues surprising to the upside, traders may prepare for prolonged volatility across digital assets and equities alike.
The post Hot CPI Print Shakes Fed Cut Bets as Inflation Tops Forecasts appeared first on BeInCrypto.

Key takeaways
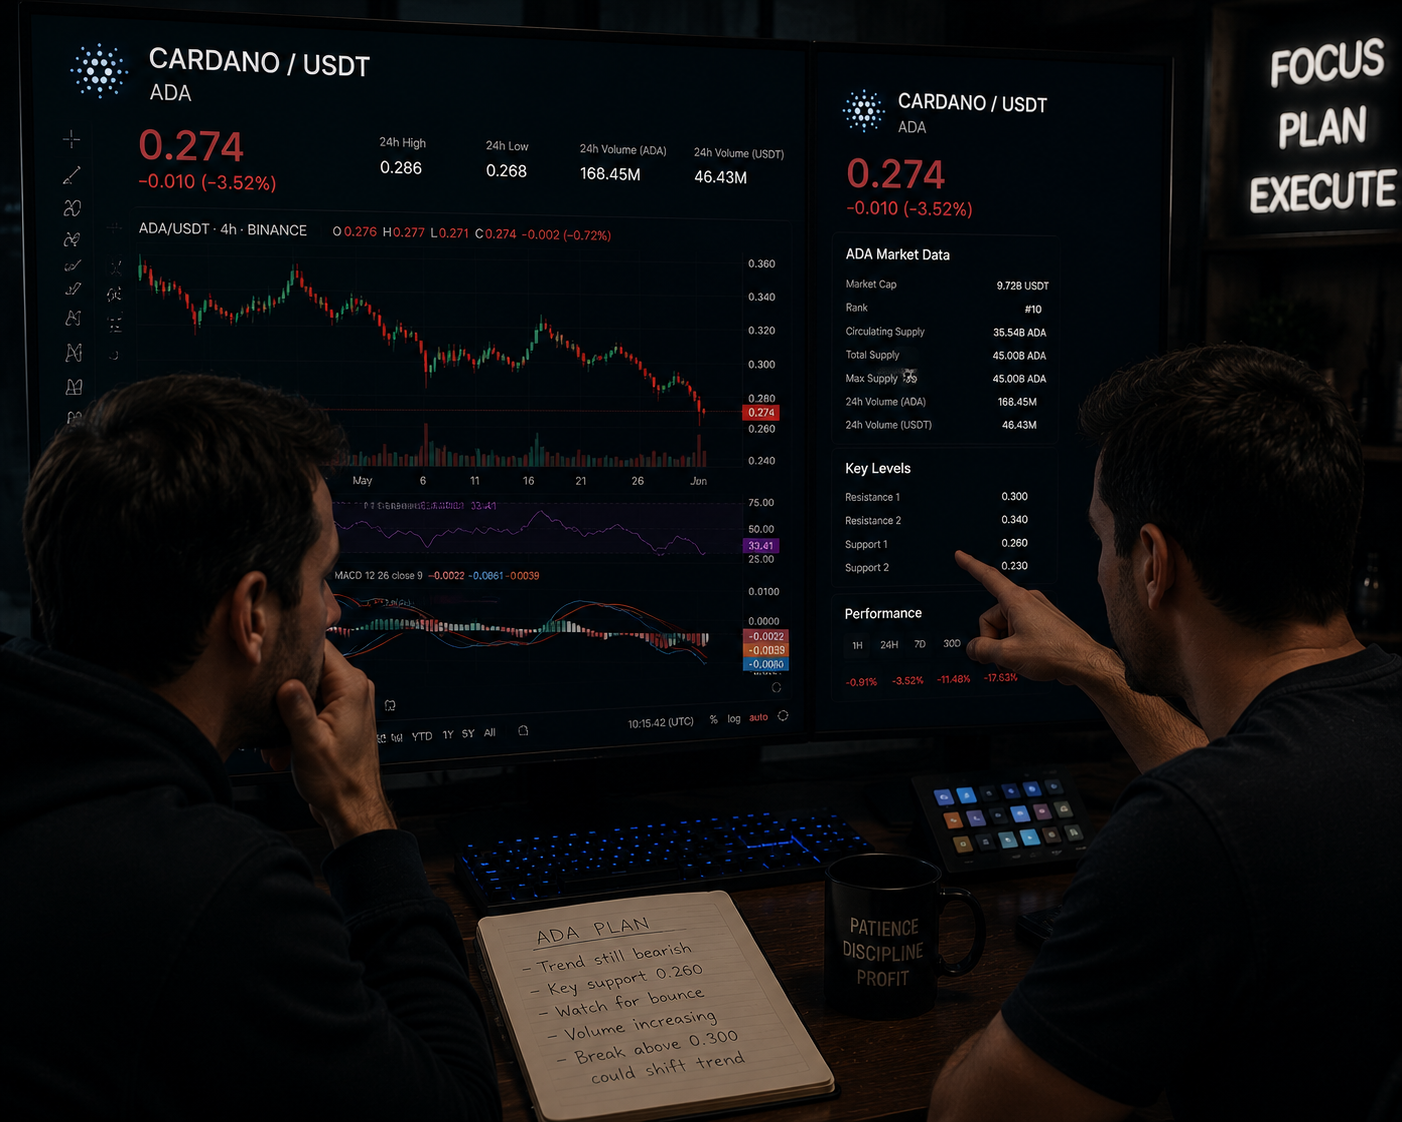
- Cardano (ADA) faces losses below $0.2800 after Sunday’s 4% recovery was capped by the 100-day EMA.
- Negative funding rates and a shift in futures market sentiment signal a bearish outlook.
Cardano futures market turns bearish as sentiment shifts
ADA is dpwn 2% in the last 24 hours and could record further losses in the near term. Cardano’s futures market sentiment is shifting to a bearish stance amid a pullback in the spot price this week.
According to CoinGlass data, the ADA futures Open Interest (OI) rose by over 4% in 24 hours, reaching $596.40 million, indicating a buildup of positions as traders prepare for a potential sharp move.
However, the negative funding rate of -0.0018% suggests that fewer traders are willing to take long positions on ADA, pointing to a bearish outlook.
Additionally, the long-to-short ratio stands at 0.7212, showing that active short positions significantly outnumber long positions, further reinforcing the bearish sentiment.
Technical outlook: ADA faces resistance at the 100-day EMA
The ADA/USD 4-hour chart remains bearish and efficient. At the time of writing, Cardano is trading around $0.2743, maintaining a capped tone below the 100-day EMA at $0.2870.
While ADA is holding above the 50-day EMA at $0.2603, the technical structure remains cautious, suggesting that the broader bearish trend could continue if support fails to hold.
The Moving Average Convergence Divergence (MACD) is inching closer to the signal line, with the positive histogram bars contracting. Meanwhile, the Relative Strength Index (RSI) has slipped to 59, indicating that bullish momentum is weakening after an overextended move.
If the rally resumes, immediate resistance is seen at the 100-day EMA near $0.2870, with the longer-term 200-day EMA around $0.3696 acting as the next significant barrier.

However, if the bearish trend persists, the 50-day EMA at $0.2603 offers the first notable layer of support.
A daily candle close below this level could signify that the latest rebound is fading and the broader bearish bias is reasserting itself.
Wells Fargo reported larger positions in Ether exchange-traded funds in the first quarter while reshuffling its Bitcoin ETF holdings across several products, according to its latest Securities and Exchange Commission filing.
The bank said it raised its holdings in Ether (ETH) ETFs, including BlackRock’s iShares Ethereum Trust ETF (ETHA) and the Bitwise Ethereum ETF (ETHW), according to its latest Form 13F filing released on Monday.
ETHA rose 63.5% from about 672,600 shares in Q4 2025 to roughly 1.1 million shares in Q1 2026, while ETHW increased by 37% from about 186,800 to more than 257,000 shares, showing a broad-based increase across Ether-linked funds.
Bitcoin (BTC) ETF exposure, by contrast, showed a more mixed pattern: positions in the iShares Bitcoin Trust ETF (IBIT) were slightly reduced, while Bitwise Bitcoin ETF Trust (BITB) and Grayscale Bitcoin Mini Trust ETF (BTC) holdings increased by roughly 24% and 41%, respectively.
The filing suggests Wells Fargo reported larger Ether ETF positions at quarter-end, even as its Bitcoin ETF exposure was more mixed.
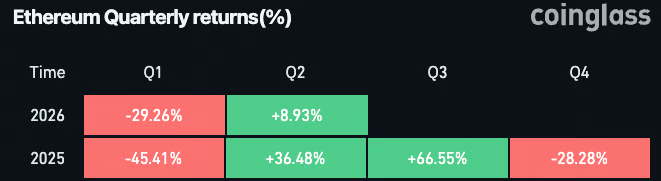
Accumulation amid ETH price dip
Wells Fargo’s Ether ETF accumulation came during a period of weakening spot prices. According to CoinGlass data, Ethereum posted two consecutive quarterly declines, falling around 28% in Q4 2025 and 29% in Q1 2026.
Over the same period, spot Ether ETFs saw sustained outflows, totaling roughly $769 million across three straight months of withdrawals.

Ethereum quarterly price performance data, 2025–2026. Source: CoinGlass
Despite the broader downturn, Wells Fargo held around $21.5 million in Ether ETFs in Q1 2026, with ETHA as the largest position at $17.6 million.
Bitcoin dominates holdings, equity rotations favor Strategy over Galaxy
Bitcoin ETFs remain the dominant crypto ETF exposure in Wells Fargo’s portfolio, with IBIT making up the bulk of the exposure at roughly $250 million.
In equities, Wells Fargo made a more pronounced shift in crypto-linked holdings. The bank significantly reduced its stake in Michael Novogratz’s Galaxy Digital (GLXY), cutting its position from about 2.5 million shares in Q4 2025 to roughly 78,600 shares in Q1 2026, a decline of nearly 97% and an estimated $54.7 million reduction in exposure.
Related: Galaxy Digital posts $216M Q1 loss as crypto market slides 20%
On the other hand, Wells Fargo significantly increased exposure to Michael Saylor’s Strategy, the world’s largest public Bitcoin holder.
The bank raised its stake from about 322,700 shares in Q4 2025 to roughly 726,000 shares in Q1 2026, a gain of around 403,000 shares, or 125%, and an estimated $41.6 million increase in exposure.
Magazine: Strategy reveals why they would sell BTC, Trump Media posts loss: Hodler’s Digest, May 3 – 9


U.S. inflation data came in hotter than expected on Wednesday, reinforcing expectations that the Federal Reserve will keep interest rates steady at 350-375bps not only at its June 17 meeting, but also likely through the end of the year.
The Consumer Price Index (CPI) year-over-year rose 3.8% in April, according to a report from the Bureau of Labor Statistics. Economists’ forecasts had been for a rise of 3.7% following March’s 3.3% increase.
On a month-over-month basis, CPI rose 0.6%, above expectations of 0.3% and up from March’s 0.2%.
Core CPI, which excludes food and energy costs, rose 0.4% in April versus forecasts of 0.2% and March’s 0.3%. Year-over-year core CPI was higher by 2.8% versus forecasts of 2.7% and March’s 2.6%.
Under pressure this morning, bitcoin traded at $80,700 following the report, down 1.2% over the past 24 hours.
U.S. stock index futures were down across the board, and the 10-year treasury yield came in higher at 4.44%. WTI crude oil is posing a threat to the markets, and is higher by 3% on the day at $101.
Ahead of the CPI data, markets were pricing in a 98% probability that the Federal Reserve would leave interest rates unchanged at its March meeting, according to the CME Fed Watch tool.
Kevin Warsh is set to be confirmed as the next Federal Reserve Chair this week, as he is expected to take over from Jerome Powell on May 15.

AST SpaceMobile: The Market Is Wrong Again (NASDAQ:ASTS)

Kraken parent Payward, Franklin Templeton plan onchain investment products

A Tried And Tested List Of The 15 Best Face Sunscreens For Sensitive Skin
Manchester United reach agreement with Casemiro over contract clause amid transfer speculation

US brings back mandatory military draft registration

Steven Gerrard disagrees with Gary Neville over ‘shock’ Chelsea and Arsenal claim | Football


-
 Crypto World4 days ago
HarrisX Poll Found 52% of Registered Voters Support the CLARITY Act
-

 Fashion4 days ago
Weekend Open Thread: Marianne Dress
-

 Crypto World5 days ago
Upbit adds B3 Korean won pair as Base token gains Korea access
-
 NewsBeat5 days ago
NCP car park operator enters administration putting 340 UK sites at risk of closure
-

 Fashion20 hours ago
Coffee Break: Travel Steam Iron
-

 Fashion1 day ago
What to Know Before Buying a Curling Wand or Curling Iron
-

 Tech2 days ago
Auto Enthusiast Carves Functional Two-Stroke Engine from Solid Metal
-

 Politics16 hours ago
What to expect when you’re expecting a budget
-

 Politics3 days ago
Politics Home Article | Starmer Enters The Danger Zone
-
 Business3 days ago
Ignore market noise, India’s long-term story intact, say D-Street bulls Ramesh Damani and Sunil Singhania
-

 Tech1 day ago
GM Agrees To Pay $12.75 Million To Settle California Lawsuit Over Misuse Of Customers’ Driving Data
-

 Crypto World6 days ago
BlackRock CEO Larry Fink Discusses a New Asset Class
-

 Entertainment5 days ago
Sarah Paulson Called Out For Met Gala ‘Hypocrisy’
-
 Sports6 days ago
NBA playoff winners and losers: Austin Reaves is not loving Lakers vs. Thunder matchup, but Chet Holmgren is
-

 Entertainment6 days ago
Bold and Beautiful Early Spoilers May 11-15: Steffy Revolted & Liam Overjoyed!
-

 Entertainment5 days ago
General Hospital: Ric & Ava Bombshell – Ric’s Massive Secret Exposed!
-

 Crypto World5 days ago
Robinhood says Wall Street is building onchain
-

 Politics5 days ago
Simon Cowell Says He Was ‘Horrible’ To Susan Boyle During BGT Audition
-

 Sports5 days ago
UEFA Champions League final schedule, teams, venue, live time and streaming | Football News
-

 Tech6 days ago
Apple and Samsung are dominating smartphone sales so thoroughly that only one other company makes the top 10
You must be logged in to post a comment Login