

Crypto World
Strategy Sells $467M in MSTR Shares, Bitcoin Stack Steady

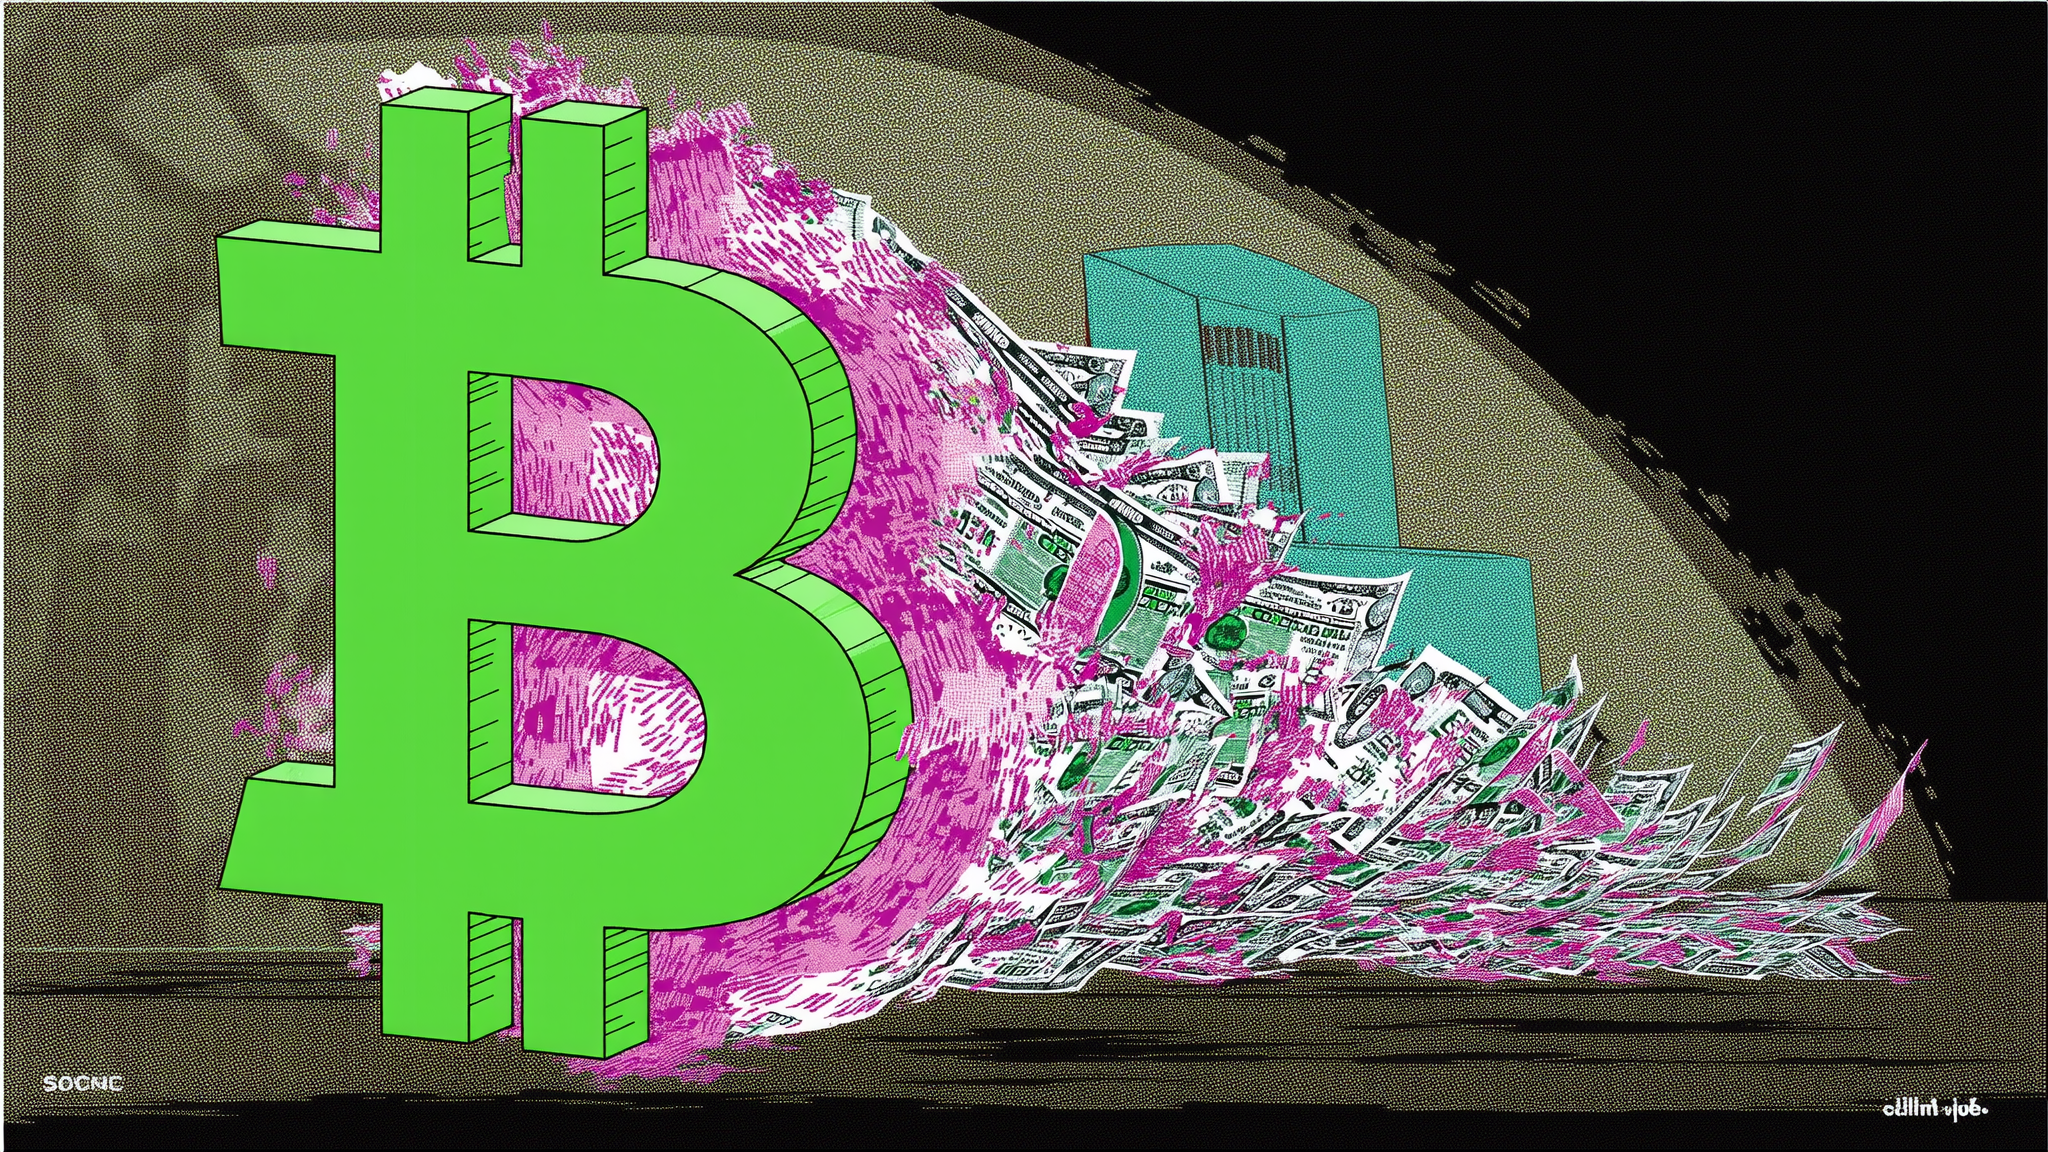
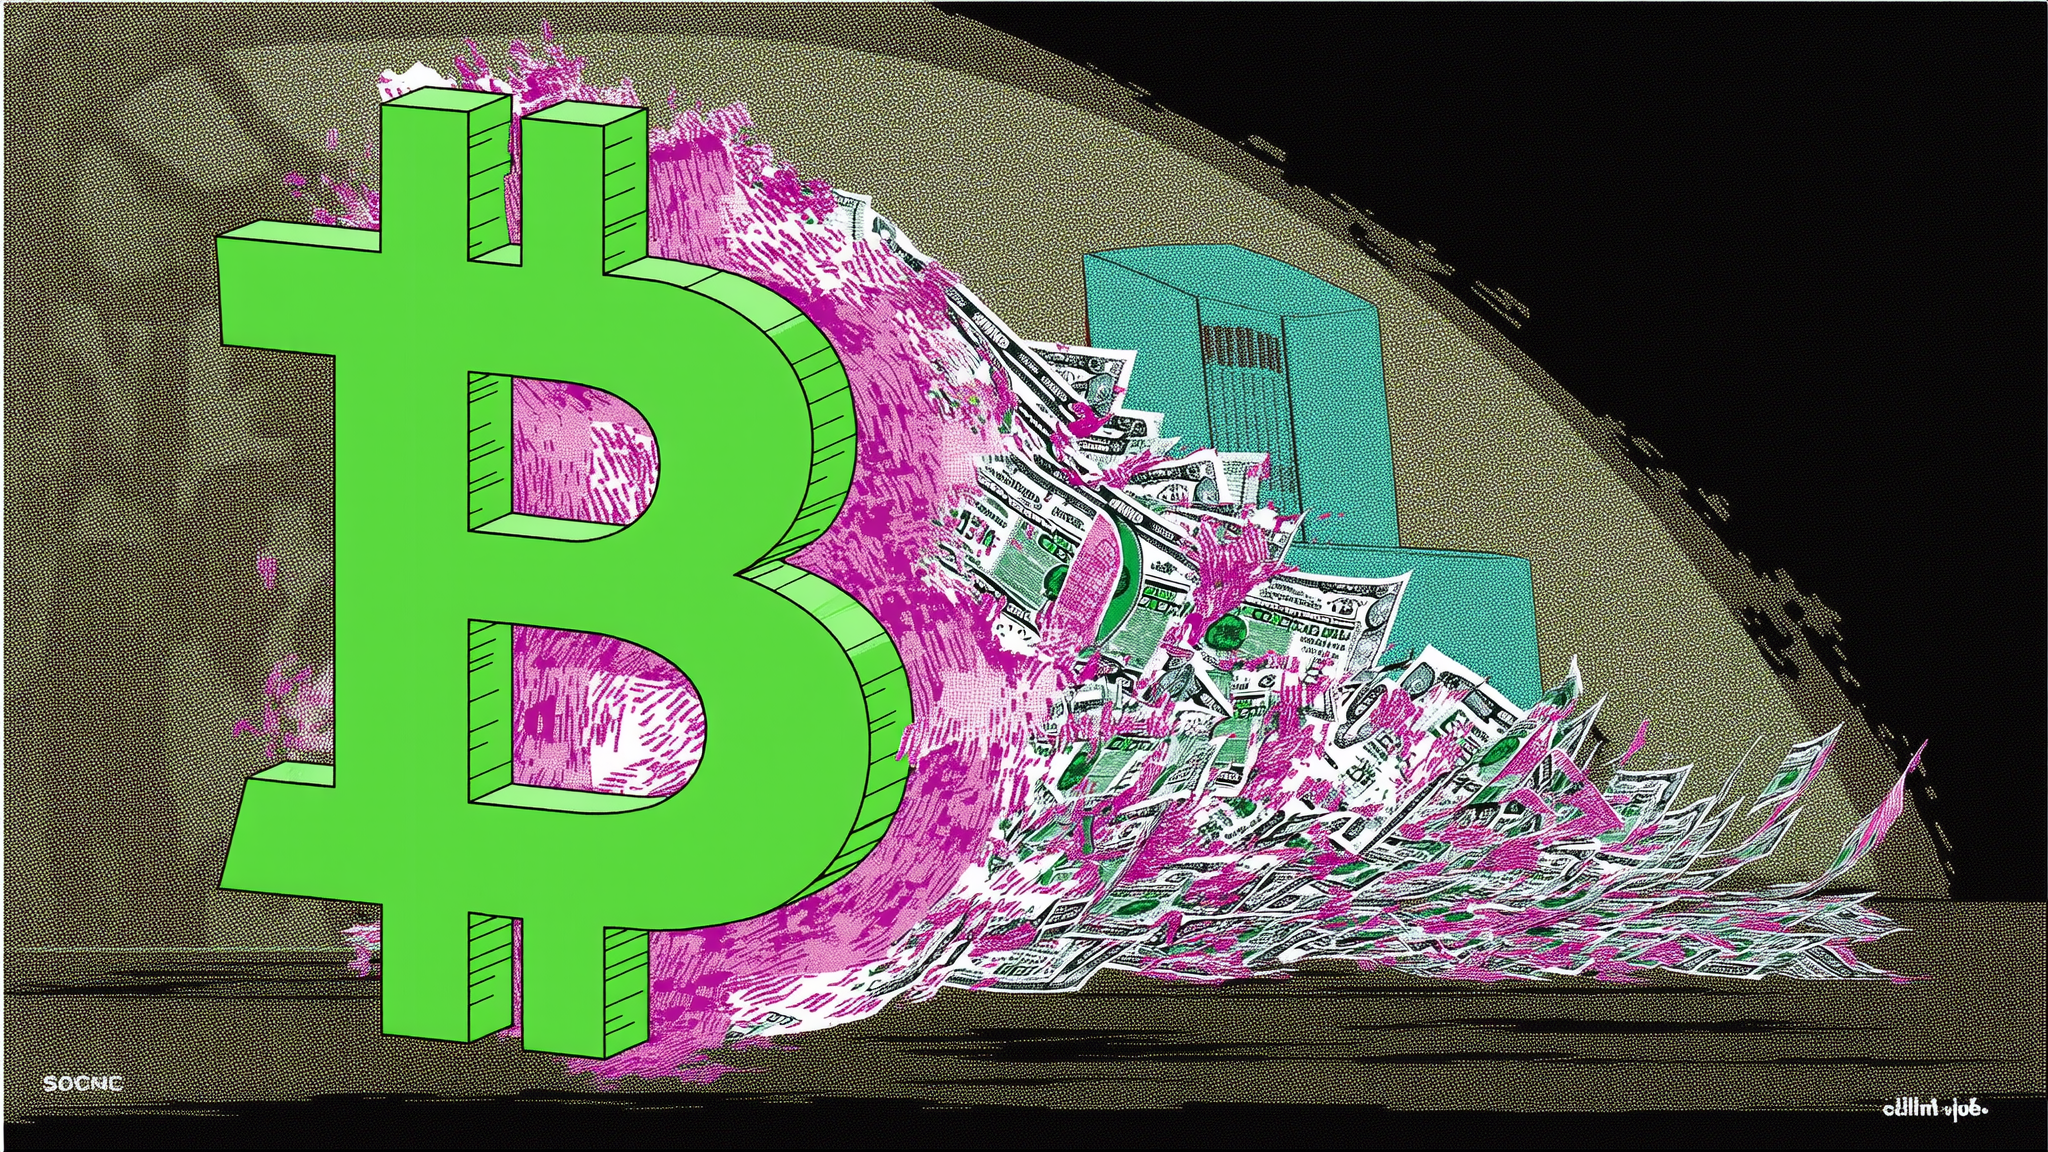
Strategy sold $466.7 million worth of MSTR common stock between July 6 and July 12, 2026, lifting its USD reserve to $3 billion while leaving its bitcoin holdings unchanged at 843,775 BTC, according to a Form 8-K the company filed with the SEC on July 13. The company sold roughly 4.82 million… Read the full story at The Defiant

Crypto World
BlackRock, Coinbase, Strategy pledge $15 million to prepare Bitcoin for quantum threats


A total of nine companies have formed a consortium pledging a combined $15 million over three years to support Bitcoin security research and open-source development.
Companies in the newly formed Bitcoin Security Consortium include major crypto market participants including BlackRock, Coinbase, Strategy, Anchorage Digital, ARK Invest, Block, Blockstream, Fidelity Digital Assets and Galaxy.
The group will focus partly on preparing Bitcoin for advances in quantum computing and will publish material tracking the state of Bitcoin security work for investors and the public.
The $15 million will not be held or allocated by the consortium, but instead member will choose which developers, researchers or organizations it funds. The group said it will not direct Bitcoin development or take positions on proposed protocol changes.
“Bitcoin Core developers do incredibly important work,” BlackRock digital assets head Robert Mitchnick said, adding that the group would make additional funding available for Bitcoin’s long-term security.
The announcement did not disclose individual contributions, initial recipients or how much of the funding represents new commitments.
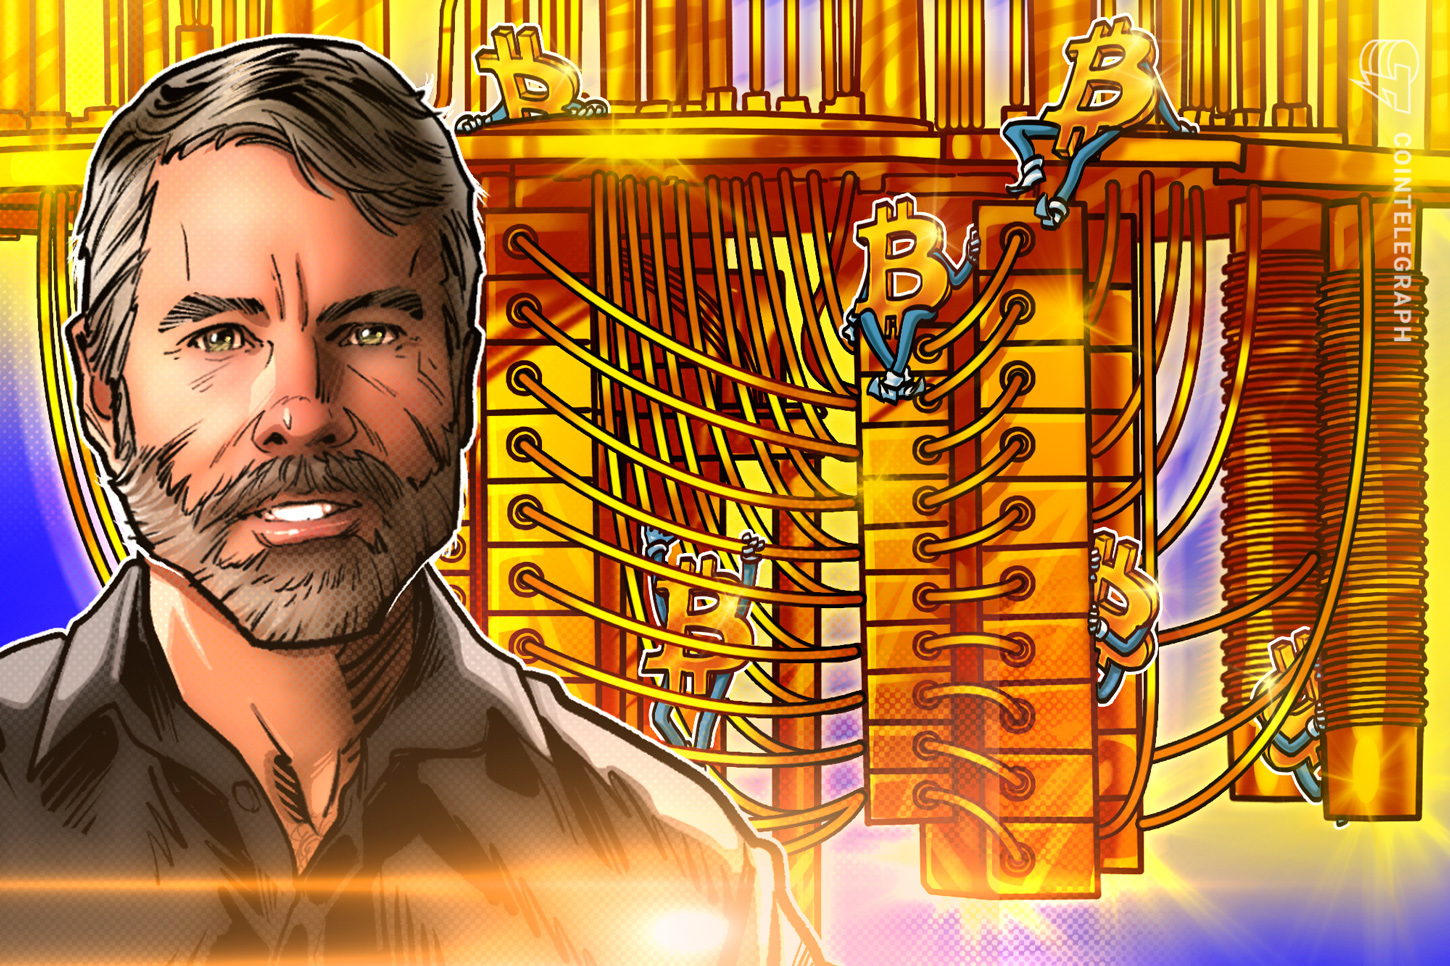
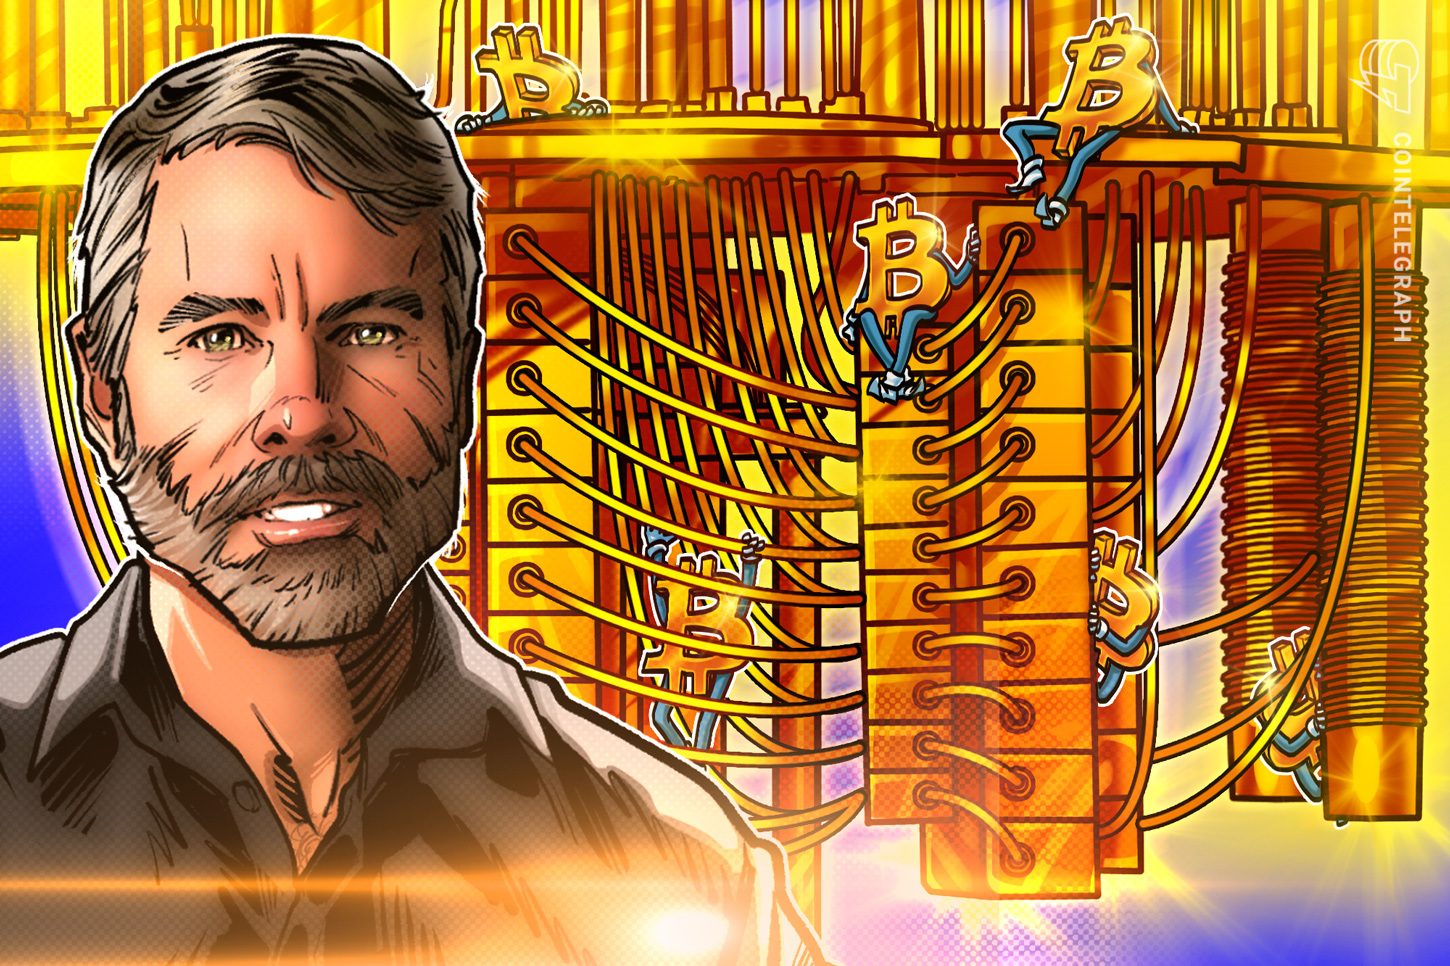
Michael Saylor’s Strategy announced the launch of the Bitcoin Security Consortium, a group of financial institutions and Bitcoin companies supporting the long-term quantum security of the Bitcoin network.
The consortium pledged an aggregate $15 million over the next three years to support developers securing the Bitcoin network against the threat of a quantum computing breakthrough, Strategy announced in a Thursday press release.
Other founding members include Anchorage Digital, ARK Invest, BlackRock, Block, Blockstream, Coinbase, Fidelity Digital Assets and Galaxy. The consortium’s day-to-day work will be coordinated by Mike Schmidt, who serves in a volunteer capacity and is the executive director of Brink, a non-profit that supports Bitcoin open-source developers.
On Wednesday, Galaxy Digital pledged up to $5 million in grants for developers working on Bitcoin’s quantum security and elected a council of quantum-advisory experts to research quantum-resistant migration solutions.
Bitcoin’s quantum security is a growing concern in the community, though the timeline of a quantum breakthrough remains hotly debated. In November 2025, Blockstream CEO Adam Back said that Bitcoin faces no meaningful quantum threat for at least the next 20 to 40 years.
In contrast, an April report from investment manager Bernstein said that Bitcoin has about three to five years to prepare for a post-quantum security upgrade.
BlackRock’s global head of digital assets, Robert Mitchnick, said that Bitcoin core developers do “incredibly important work” and that the asset management company was pleased to make “significant additional funding available to support Bitcoin’s long-term security needs.”
Magazine: Bitcoin’s quantum upgrade path: What BIP-360 changes and what it does not

The European Union agreed on Thursday to its 21st sanctions package against Russia. EU persons are now barred from transacting with 11 unnamed crypto operators and 94 banks and financial institutions.
While names of the 11 crypto platforms have been withheld, the EU has revealed that they mostly operate in Belarus and Nigeria, acting as conduits to funnel money between Russia and countries blocked from doing business with it.
Previously, Brussels was limited to sanctioning individual firms. It now has the power to bar crypto services from an entire nation or jurisdiction if it is viewed as a hub for laundering Russian financial transactions, an unprecedented development in the battle against sanctions evasion.
Stablecoins and The Garantex Trail
This package is the latest in a series of moves to tighten the net on crypto services tied to the ruble. Earlier this year, the A7A5 stablecoin, which acted as a bridge between sanctioned exchanges Garantex and Grinex, was designated, followed by the RUBx token and digital ruble.
The UK moved in parallel, sanctioning the HTX (formerly Huobi) exchange in May over alleged ties to A7 and Garantex. A Global Ledger report found HTX had processed around $21 billion in ‘high-risk’ crypto transactions over the last 5 years, with almost $8 billion of it tied to Russian actors and darknet markets.
Broad Scope: Banks, Oil And The Shadow Fleet
The package designates 94 financial institutions, including 32 banks and the Moscow stock exchange, freezing their EU-held assets and banning transactions with them. It also targets vessels in Russia’s shadow fleet for the first time.
I welcome the agreement on the 21st sanctions package against Russia.
At a time when Ukraine has built military momentum, our sanctions continue to weaken the economic foundations of Russia’s war effort.
We’re adding 32 more Russian banks to our transaction ban list.
As well…
— Ursula von der Leyen (@vonderleyen) July 23, 2026
European Commission President Ursula von der Leyen confirmed a freeze on oil cap prices at $44.10 a barrel ‘so that the Russian war machine does not benefit from market shocks,’ adding that Brussels also plans on banning Russian combatants from entering the EU.
The post EU Hits Russia With Toughest Crypto Crackdown Yet appeared first on CryptoPotato.

An ongoing hacking spree has claimed another three victims in the past 24 hours, with a total of over $35 million lost.
Verus bridge has lost over $7.5 million, just two months after being hit by a similar hack which claimed $11 million. Proceeds of the May exploit were partially returned following a 25% bounty offer.
Now, AFX is offering a 30% bounty in response to losing $24 million USDC from its Arbitrum bridge.
In an increasingly bleak landscape for legitimate security researchers, such generous offers are, at best, insulting, and, at worst, may even tempt those with such skills to the dark side.
Read more: Across, Allbridge, TeleSwap lost $5.7M to bridge hacks in past week
Verus bridge hacked again
Following the return of 75% of the funds lost in May’s hack, the assets were sent from the recovery address back into the Verus bridge just 14 days ago.
In the early hours of Thursday, a wide range of assets (tBTC, ETH, USDC, scrvUSD, MKR, USDT and EURC) totaling $7.5 million were withdrawn from the bridge in a single transaction.
According to blockchain auditor SlowMist, both exploits share a root cause of “flawed cross-chain import validation,” though with slightly different attack vectors.
This time it looks much less likely that Verus will see the money again, however. The attacker has since deposited a total of 3,916 ETH (over $6.6 million) to Tornado Cash.
Read more: Bridge hacks back in vogue as Verus exploit brings 2026 total to $329M
AFX’s USDC bridge drained of $24M
Late on Wednesday, AFX’s USDC custody bridge on Arbitrum was drained of over $24 million. Security firm BlockSec believes this to be a “malicious use of authorized validator keys,” which were used to sign “the bridge’s 5-of-7 validator quorum.”
Responding to the incident, AFX stated it had suspended bridge operations and is “investigating the root cause.”
It reassured users that its “AFX trading infrastructure, mainnet, and the Arbitrum network itself have not been compromised.”
AFX has also offered a 30% bounty, worth $7.2 million, for the return of the remaining funds, “as a white hat bounty.” Security expert Taylor Monahan, again, questions the wisdom of such a move.
Read more: More oracle exploits as Ostium loses over $20M
Another audit firm, Peckshield, notes that the exploiter has since swapped the funds for over 12,000 ETH, worth approximately $24 million. Funds remain in the attacker’s address on Ethereum.
Since the beginning of last week, bridge exploits have claimed at least $40 million.
BSquared staking contract emptied
Finally, BTC-for-AI-agents project BSquared was hacked for almost $4 million due to “unauthorized access to the staking contract’s upgrade authority.”
The team has promised affected B2 stakers will be fully compensated, and is offering the standard 10% bounty.
Read more: Supra patched oracle on 11 other chains before $9M Hedera exploit
The contract was drained of $3.86 million worth of B2 tokens on BNB Chain. According to blockchain investigator Specter, which flagged the theft, the tokens were swapped to WBNB, bridged to Ethereum and moved to privacy protocol Zcash.
They claim that the privileged role has been active for over a year, which may point to an inside job.
Got a tip? Send us an email securely via Protos Leaks. For more informed news and investigations, follow us on X, Bluesky, and Google News, or subscribe to our YouTube channel.

XRP price climbed from around $1.11 to $1.14 during the past week, briefly testing resistance near $1.16 before easing back despite its bullish prediction. The move looked constructive, but buyers are now facing a key ceiling. A decisive break above recent highs could open the door toward $1.32. Otherwise, the rally risks fading as short-term traders lock in profits.
The latest advance follows nine consecutive weeks of net inflows into XRP investment products, totaling about $17.2 million. However, the pace of fresh inflows has slowed. The most recent weekly figure fell to roughly $12 million, suggesting institutional demand remains positive but is no longer accelerating.

Price can lead fund flows for a while, yet that relationship becomes less reliable when inflows begin to cool. As a result, traders chasing strength should watch whether demand catches up. If it does not, momentum could fade even if the technical picture still appears healthy.
Meanwhile, the CLARITY Act and the U.S. regulatory outlook remain important catalysts for XRP. Clearer rules could strengthen institutional conviction and support another leg higher. On the other hand, delays or weaker-than-expected progress may encourage investors to stay cautious despite the recent price recovery.
Discover: The Best Token Presales
XRP Price Prediction: Push to $1.65? Or is the Handle Getting Too Long?
XRP is working through a potential cup-and-handle pattern that has been developing since early July. However, the neckline now sits closer to the $1.16 to $1.17 area. The recent consolidation since July 21 still resembles the handle, provided buyers defend the current support. Meanwhile, lighter selling volume during the pullback suggests profit-taking rather than aggressive distribution.
Support is clustered around $1.12 to $1.13, where recent lows have attracted buyers. A stronger floor sits near $1.05 if selling pressure increases. On the upside, immediate resistance stands between $1.16 and $1.18, followed by $1.32. A breakout above that level could expose the next resistance near $1.46.
The earlier breakout from the $1.14 area came with a noticeable jump in trading volume. That move established a benchmark for meaningful market participation. As a result, traders will likely watch for another volume spike before treating any breakout as sustainable.
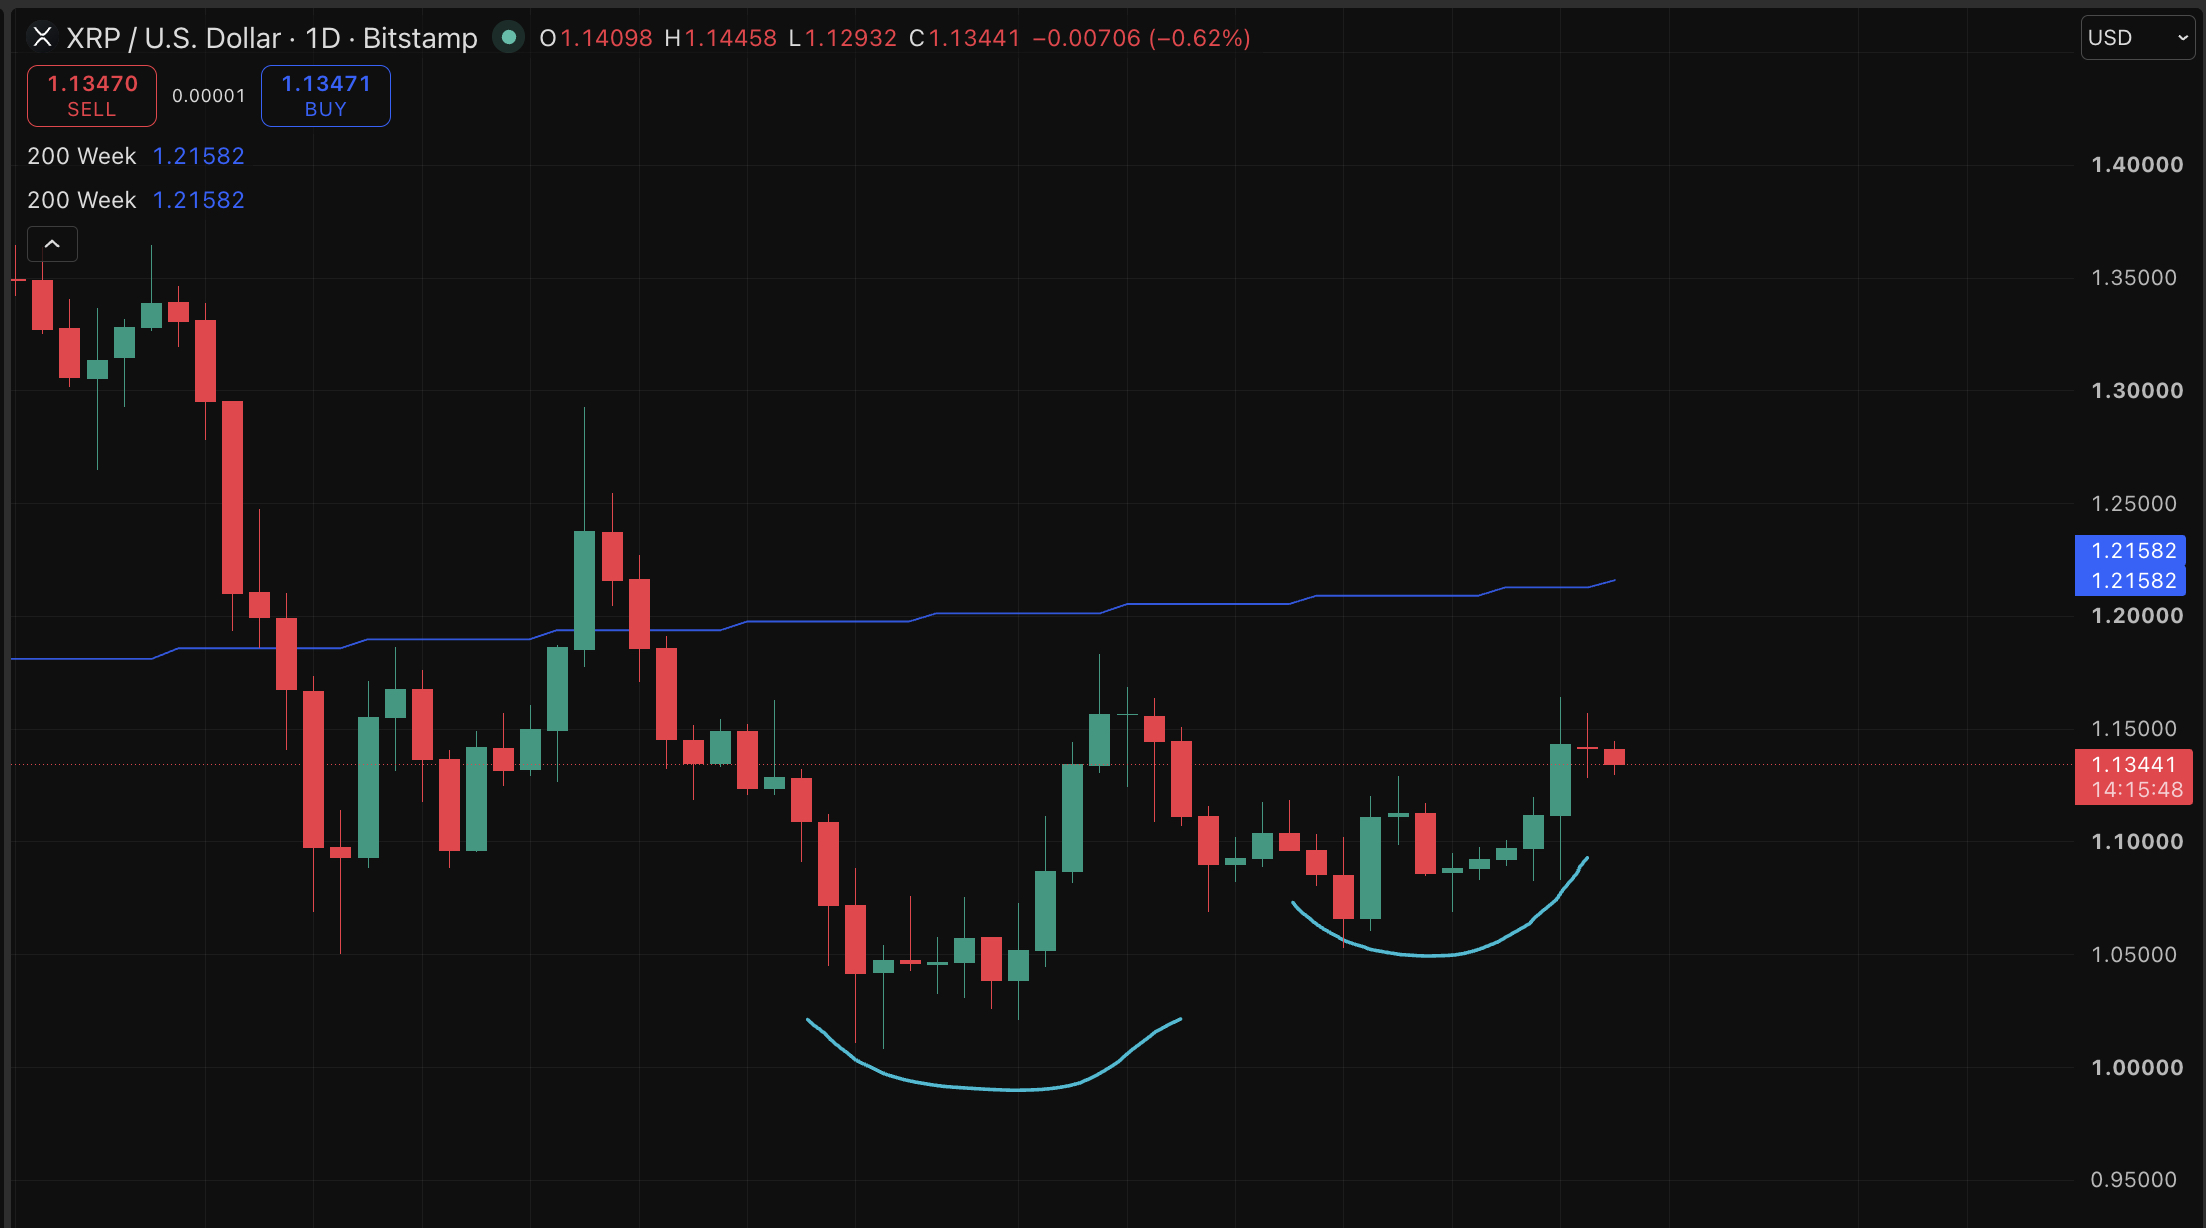
The bullish case calls for XRP to reclaim and hold above $1.18 on a daily close. If buying momentum strengthens, the price could revisit $1.32 before testing $1.46. The base case keeps XRP trading between $1.12 and $1.18 as traders wait for fresh regulatory or macro catalysts.
The bearish prediction emerges if XRP price closes below $1.12 on rising volume. That would weaken the handle setup and increase the risk of a move toward $1.05. MVRV data also adds an interesting twist. Negative 30 day and 365 day MVRV readings suggest many holders remain underwater, a condition some contrarian investors see as an opportunity rather than a warning.
Trade XRP on Bybit and Get a Chance to Win Our $1,000 USDT Airdrop
LiquidChain Eyes Early-Stage Entry as XRP Tests Resistance Ceiling
XRP at $1.50 is a different bet than XRP at $1.10. The asymmetry has compressed. That’s exactly when traders with a higher risk appetite start looking at earlier-stage setups where the entry price hasn’t already priced in the narrative. ETF inflow dynamics benefiting established assets don’t always filter down to infrastructure plays at presale prices, which is partly the point.
The next generation of infrastructure won't stand alone. — LiquidChain (@getliquidchain) July 21, 2026
It'll connect everything around it.  ⟁https://t.co/vqvBcdSQYC pic.twitter.com/mWc9fGndPd
LiquidChain ($LIQUID) is a Layer 3 infrastructure project positioning itself as a unified execution environment that merges Bitcoin, Ethereum, and Solana liquidity into a single settlement layer.
The architecture powers Unified Liquidity Layer, Single-Step Execution, Verifiable Settlement, and Deploy-Once Architecture, which targets the fragmentation problem that makes multi-chain DeFi operationally expensive. Current presale price is $0.01482. Total raised stands at $915K.
DYOR applies harder here than on a liquid mid-cap. For traders who’ve done the work, the LiquidChain presale details are worth reviewing directly.
Discover: The Best Crypto to Diversify Your Portfolio
The post XRP Price Breaks Resistance, But ETF Flows Warn Bulls appeared first on Cryptonews.

Dogecoin is trading under $0.073, moving little over the past 24 hours after another quiet session. Even so, the meme coin remains under pressure from last week’s pullback. Still, TD Sequential buy signals have appeared consecutively on the weekly chart, a setup that analyst Ali Martinez says has often preceded strong rallies.
The pattern has caught traders’ attention because consecutive weekly buy signals are rare. Martinez noted this type of cluster has historically come before major directional moves. Whale activity and derivatives data also remain mixed. Open interest has eased slightly, while spot taker CVD briefly favored buyers before that momentum faded.
Elon Musk liking a DOGE-related memecoin post created fresh headlines, but little changed on the chart. Price barely reacted, leaving technicals as the main focus. For now, traders appear more interested in whether the weekly signal confirms than in social media-driven speculation.
Meanwhile, the wider crypto market has offered little support. Bitcoin failed to hold above $66,500, keeping risk appetite in check across major altcoins. Dogecoin also remains below the $0.088 area, which previously acted as an important support level. Until that zone is reclaimed, bulls still have work to do.
Discover: The Best Token Presales
Can Dogecoin Price Break $0.075 Resistance This Week?
Dogecoin is consolidating in a tight range near $0.073 after several quiet sessions. Short-term forecasts still point to limited movement, with the price expected to remain inside a narrow band through this week. Even if buyers regain control, the projected upside remains modest unless trading volume picks up.
Support sits around $0.0722, followed by $0.0712 and the stronger floor near $0.0705. Meanwhile, resistance stands at $0.0740, $0.0746, and $0.0757. Those levels could slow any recovery before DOGE challenges the $0.088 area that previously acted as key support.

Technical indicators still lean cautiously. The 50-day moving average continues to slope lower, reflecting the recent downtrend. Even so, the weekly TD Sequential buy signal remains active, giving bulls a reason to watch for a reversal instead of chasing momentum too early.
The bullish case is straightforward. Dogecoin needs to defend $0.0705, attract stronger volume, and close the week above $0.0754. That could open the door toward $0.0793. Otherwise, the base case remains sideways trading between $0.0705 and $0.0755, while a break below support would leave sellers firmly in control.
Trade Memecoins like DOGE on Bybit and Get a Chance to Win Our $1,000 USDT Airdrop
Maxi Doge Eyes Early-Stage Upside as DOGE Tests Critical Resistance
DOGE at $0.074 with a $1 billion OI overhang is a trade, not a position. The asymmetry that existed at lower prices has compressed. Even a successful squeeze to $0.076 represents roughly 4% upside from here, meaningful on leverage, limited in spot. Traders looking for a larger risk-reward multiple are scanning earlier on the curve.
Maxi Doge ($MAXI) is an ERC-20 meme token built around a trading community thesis: the 240-lb canine juggernaut persona embodies 1000x leverage culture, and the project channels that into structured community mechanics.
The presale has raised closer to $5 million at a current price of just $0.000283, with a dynamic staking APY live for holders. Differentiating features include holder-only trading competitions with leaderboard rewards, a Maxi Fund treasury allocated to liquidity and partnerships, and meme-first marketing that leans into gym-bro culture without apology.
Research Maxi Doge before the next stage reprices.
Discover: The Best Crypto to Diversify Your Portfolio
The post Dogecoin Flashes Heavy Buy Signals, Price Yet to Move appeared first on Cryptonews.
Ethereum price has remained trapped below $2,000 as rising oil prices, renewed interest-rate concerns and BitMEX’s planned shutdown have tempered bullish sentiment despite continued spot ETF inflows.
Summary
- Ethereum price remains below $2,000 as higher oil prices revive Federal Reserve rate-hike concerns.
- Spot ETF inflows and positive capital flows continue to support ETH above $1,900.
- A break above $1,955 could target $2,030, while losing $1,860 would weaken the recovery.
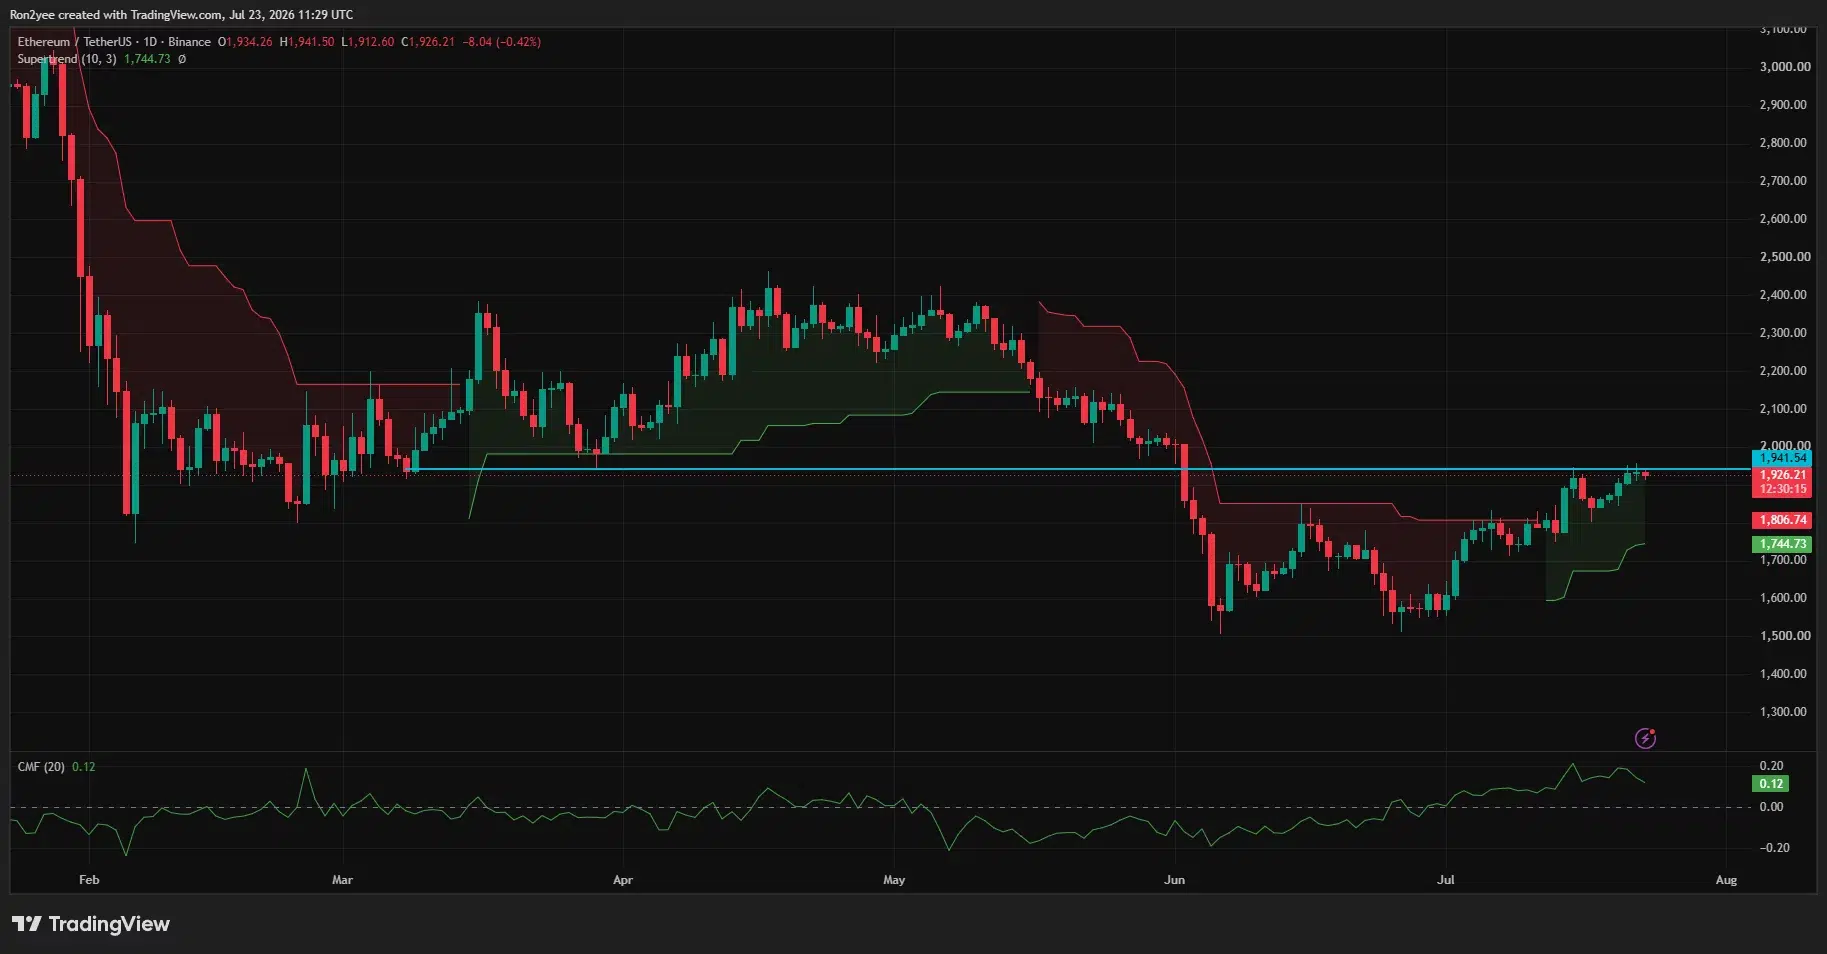
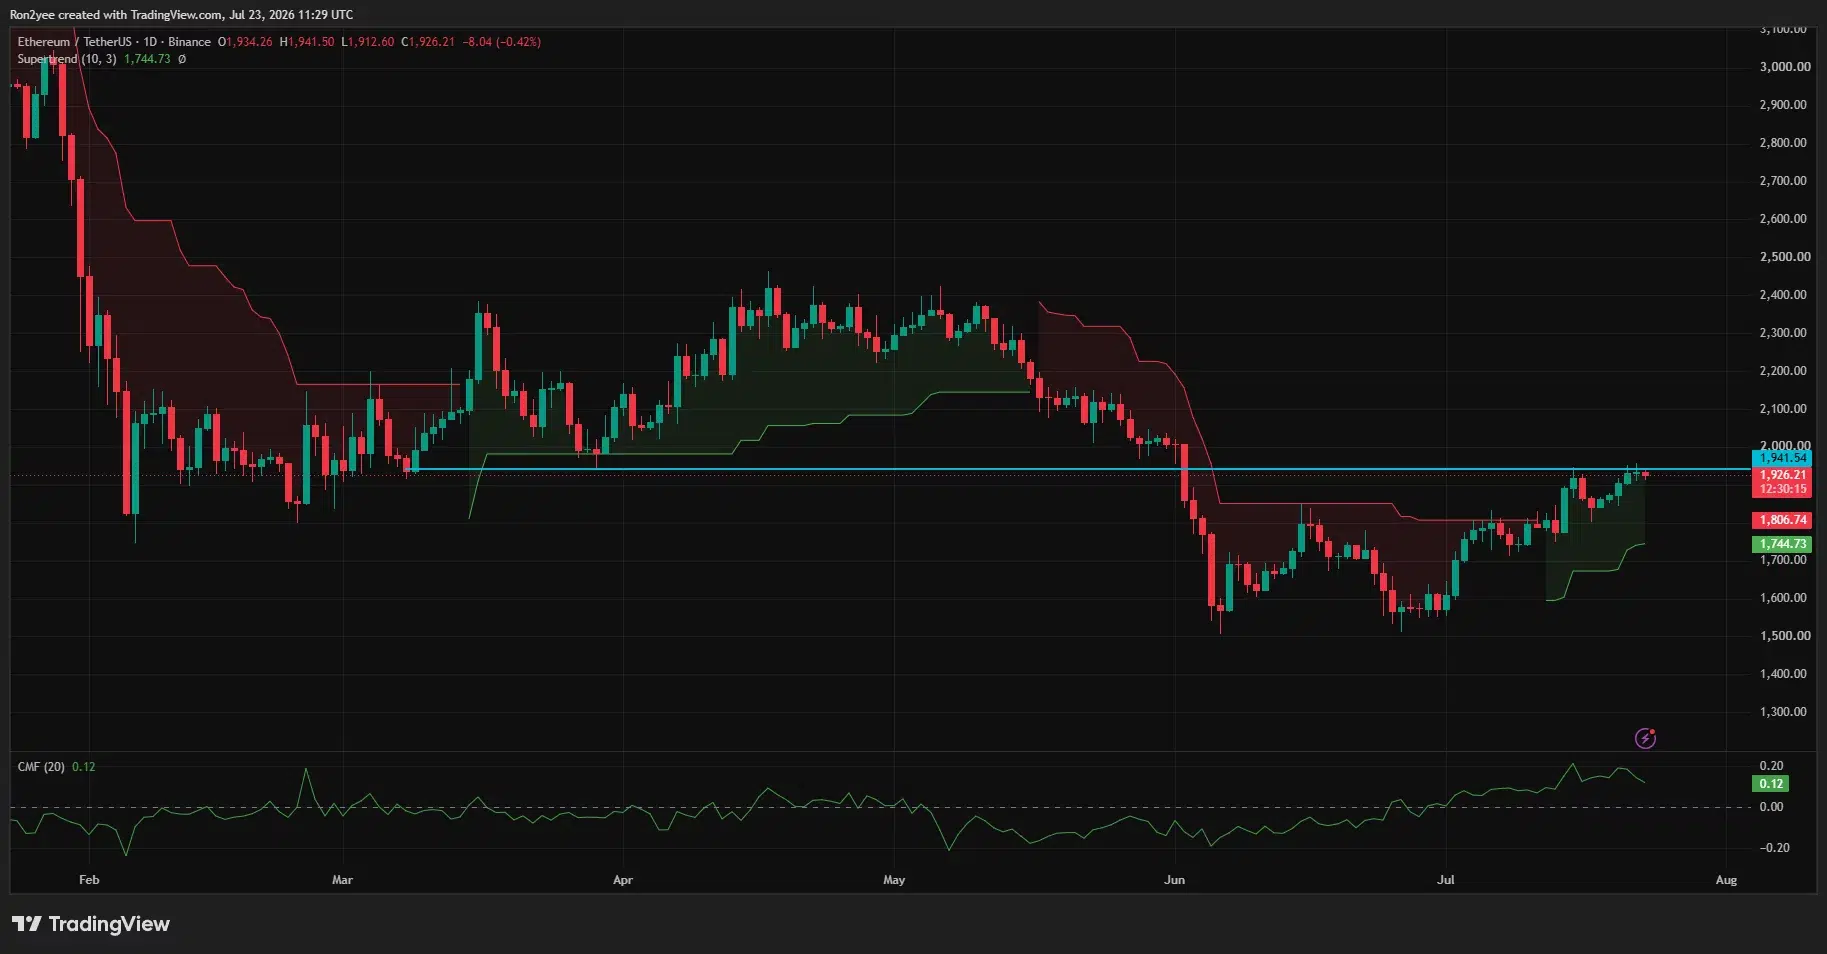
According to data from crypto.news, Ethereum (ETH) price traded near $1,927 on July 23 after reaching an intraday high of $1,941. The token has recovered more than 27% from its June low near $1,514, but repeated failures around $1,955 have kept the psychological $2,000 level beyond buyers’ reach.
Oil supplied the latest macro pressure as Middle East tensions pushed crude prices higher for a fifth consecutive session. West Texas Intermediate rose above $90 a barrel after attacks by Iran-aligned Houthis on Saudi oil tankers raised concerns about regional supplies. Higher energy costs could feed inflation and reduce the Federal Reserve’s room to keep monetary policy unchanged.
Rate traders have already adjusted their positions. The probability of a September Fed hike rose to 79% from 68% per data from the CME FedWatch tool. Expectations for the July meeting remain centered on no change, but another oil-led inflation increase could lift Treasury yields and pressure risk assets such as Ethereum.
U.S. equities also weakened after Alphabet raised its 2026 capital-spending forecast to between $195 billion and $205 billion. The company recorded negative free cash flow of $5.9 billion as quarterly expenditure doubled to $44.9 billion, while its shares fell in premarket trading.
A retreat across technology stocks could limit speculative demand in crypto markets because both sectors remain sensitive to interest-rate expectations.
ETF demand has kept Ethereum above its rising support structure
Institutional flows have provided a counterweight to the macro uncertainty. U.S. spot Ethereum ETFs recorded $72.64 million in net inflows on July 22, according to SoSoValue. BlackRock’s iShares Ethereum Trust accounted for $53.47 million, showing that regulated products continued to attract capital even as ETH struggled below $2,000.
BitMEX added a separate source of uncertainty after announcing that it would cease operations on Sept. 23 following a strategic review by parent company HDR Global Trading. The exchange told customers to close positions and withdraw funds before the deadline. BitMEX helped popularize perpetual swaps and has served more than 2 million professional and institutional traders since its 2014 launch.
Position transfers and forced closures at BitMEX could temporarily reduce liquidity or move leverage to rival exchanges. However, the announcement does not mean Ethereum’s global perpetual market will close, because Binance, Bybit, OKX and other venues operate larger derivatives businesses.
Ethereum’s daily chart remains constructive above the Supertrend support at $1,744.73. The indicator has stayed green during the July advance, while the Chaikin Money Flow reading of 0.12 shows that buying volume has exceeded selling volume over the indicator’s measurement period. Price must still close above the nearby $1,941–$1,955 ceiling before the daily structure opens a route toward $2,000.
According to analyst Ted Pillows, spot-market demand has protected the recovery’s main support zone.
“Spot demand is strong and the key support zone hasn’t been lost. IMO, Ethereum could begin its next move up in a few days.”
Pillows placed $2,030 as the first major upside barrier, followed by $2,179 and a heavier supply zone near $2,400. His chart also identified support between roughly $1,834 and $1,897, with lower demand areas around $1,730 and $1,540.
The 4-hour chart shows ETH compressing beneath $1,955.40 while holding an ascending trendline drawn from the June 26 low. Buyers have also defended the 78.6% Fibonacci retracement at $1,860.86, leaving the sequence of higher lows intact. A 4-hour close above $1,955 would clear the recovery high and place $2,000–$2,030 within reach.
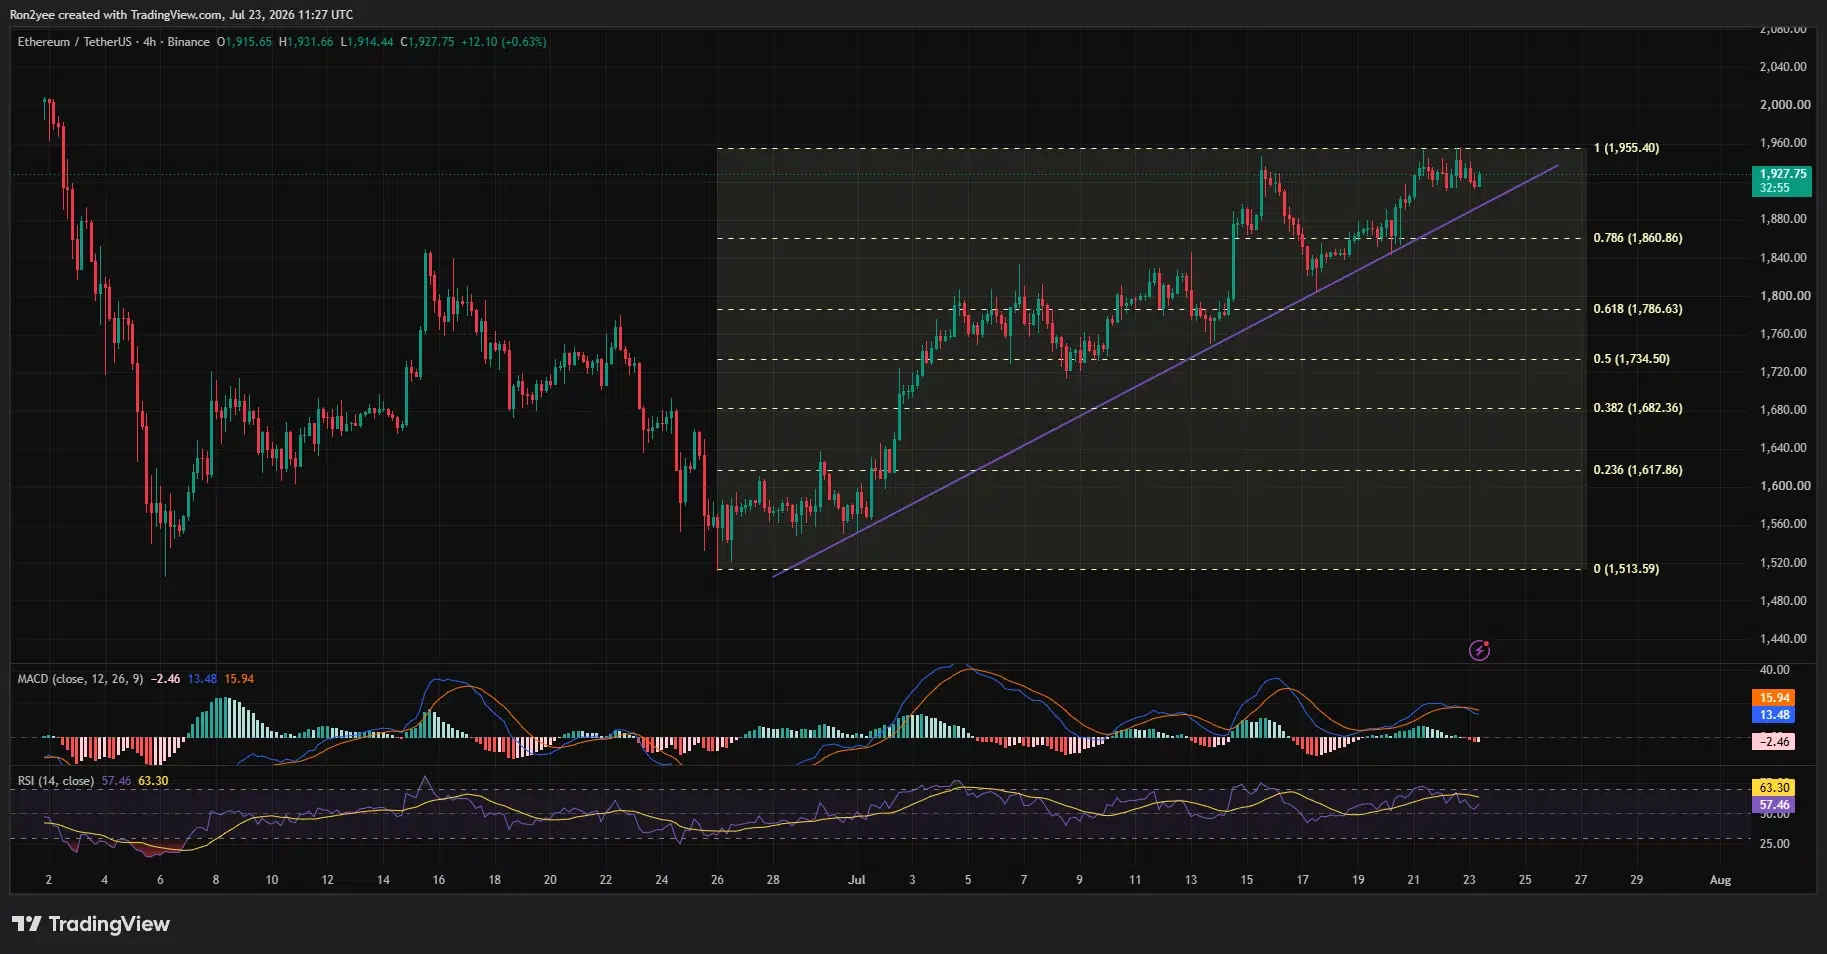
Momentum has weakened before that test. The 4-hour Relative Strength Index has fallen to 57.46 from its recent highs and sits below its signal average of 63.30. MACD has also registered a bearish crossover, with the MACD line at 13.48 beneath the 15.94 signal line and the histogram at minus 2.46. Neither indicator confirms a trend reversal, but both show that buyers have lost speed near resistance.
Break below $1,860 would invalidate the immediate breakout setup
CoinGlass’s three-day liquidation heatmap places the largest nearby short-liquidation concentration around $1,958–$1,965. A move through that band could force bearish positions to close and accelerate a test of $2,000. The strongest downside liquidity sits near $1,895–$1,905, with another dense pocket around $1,875.
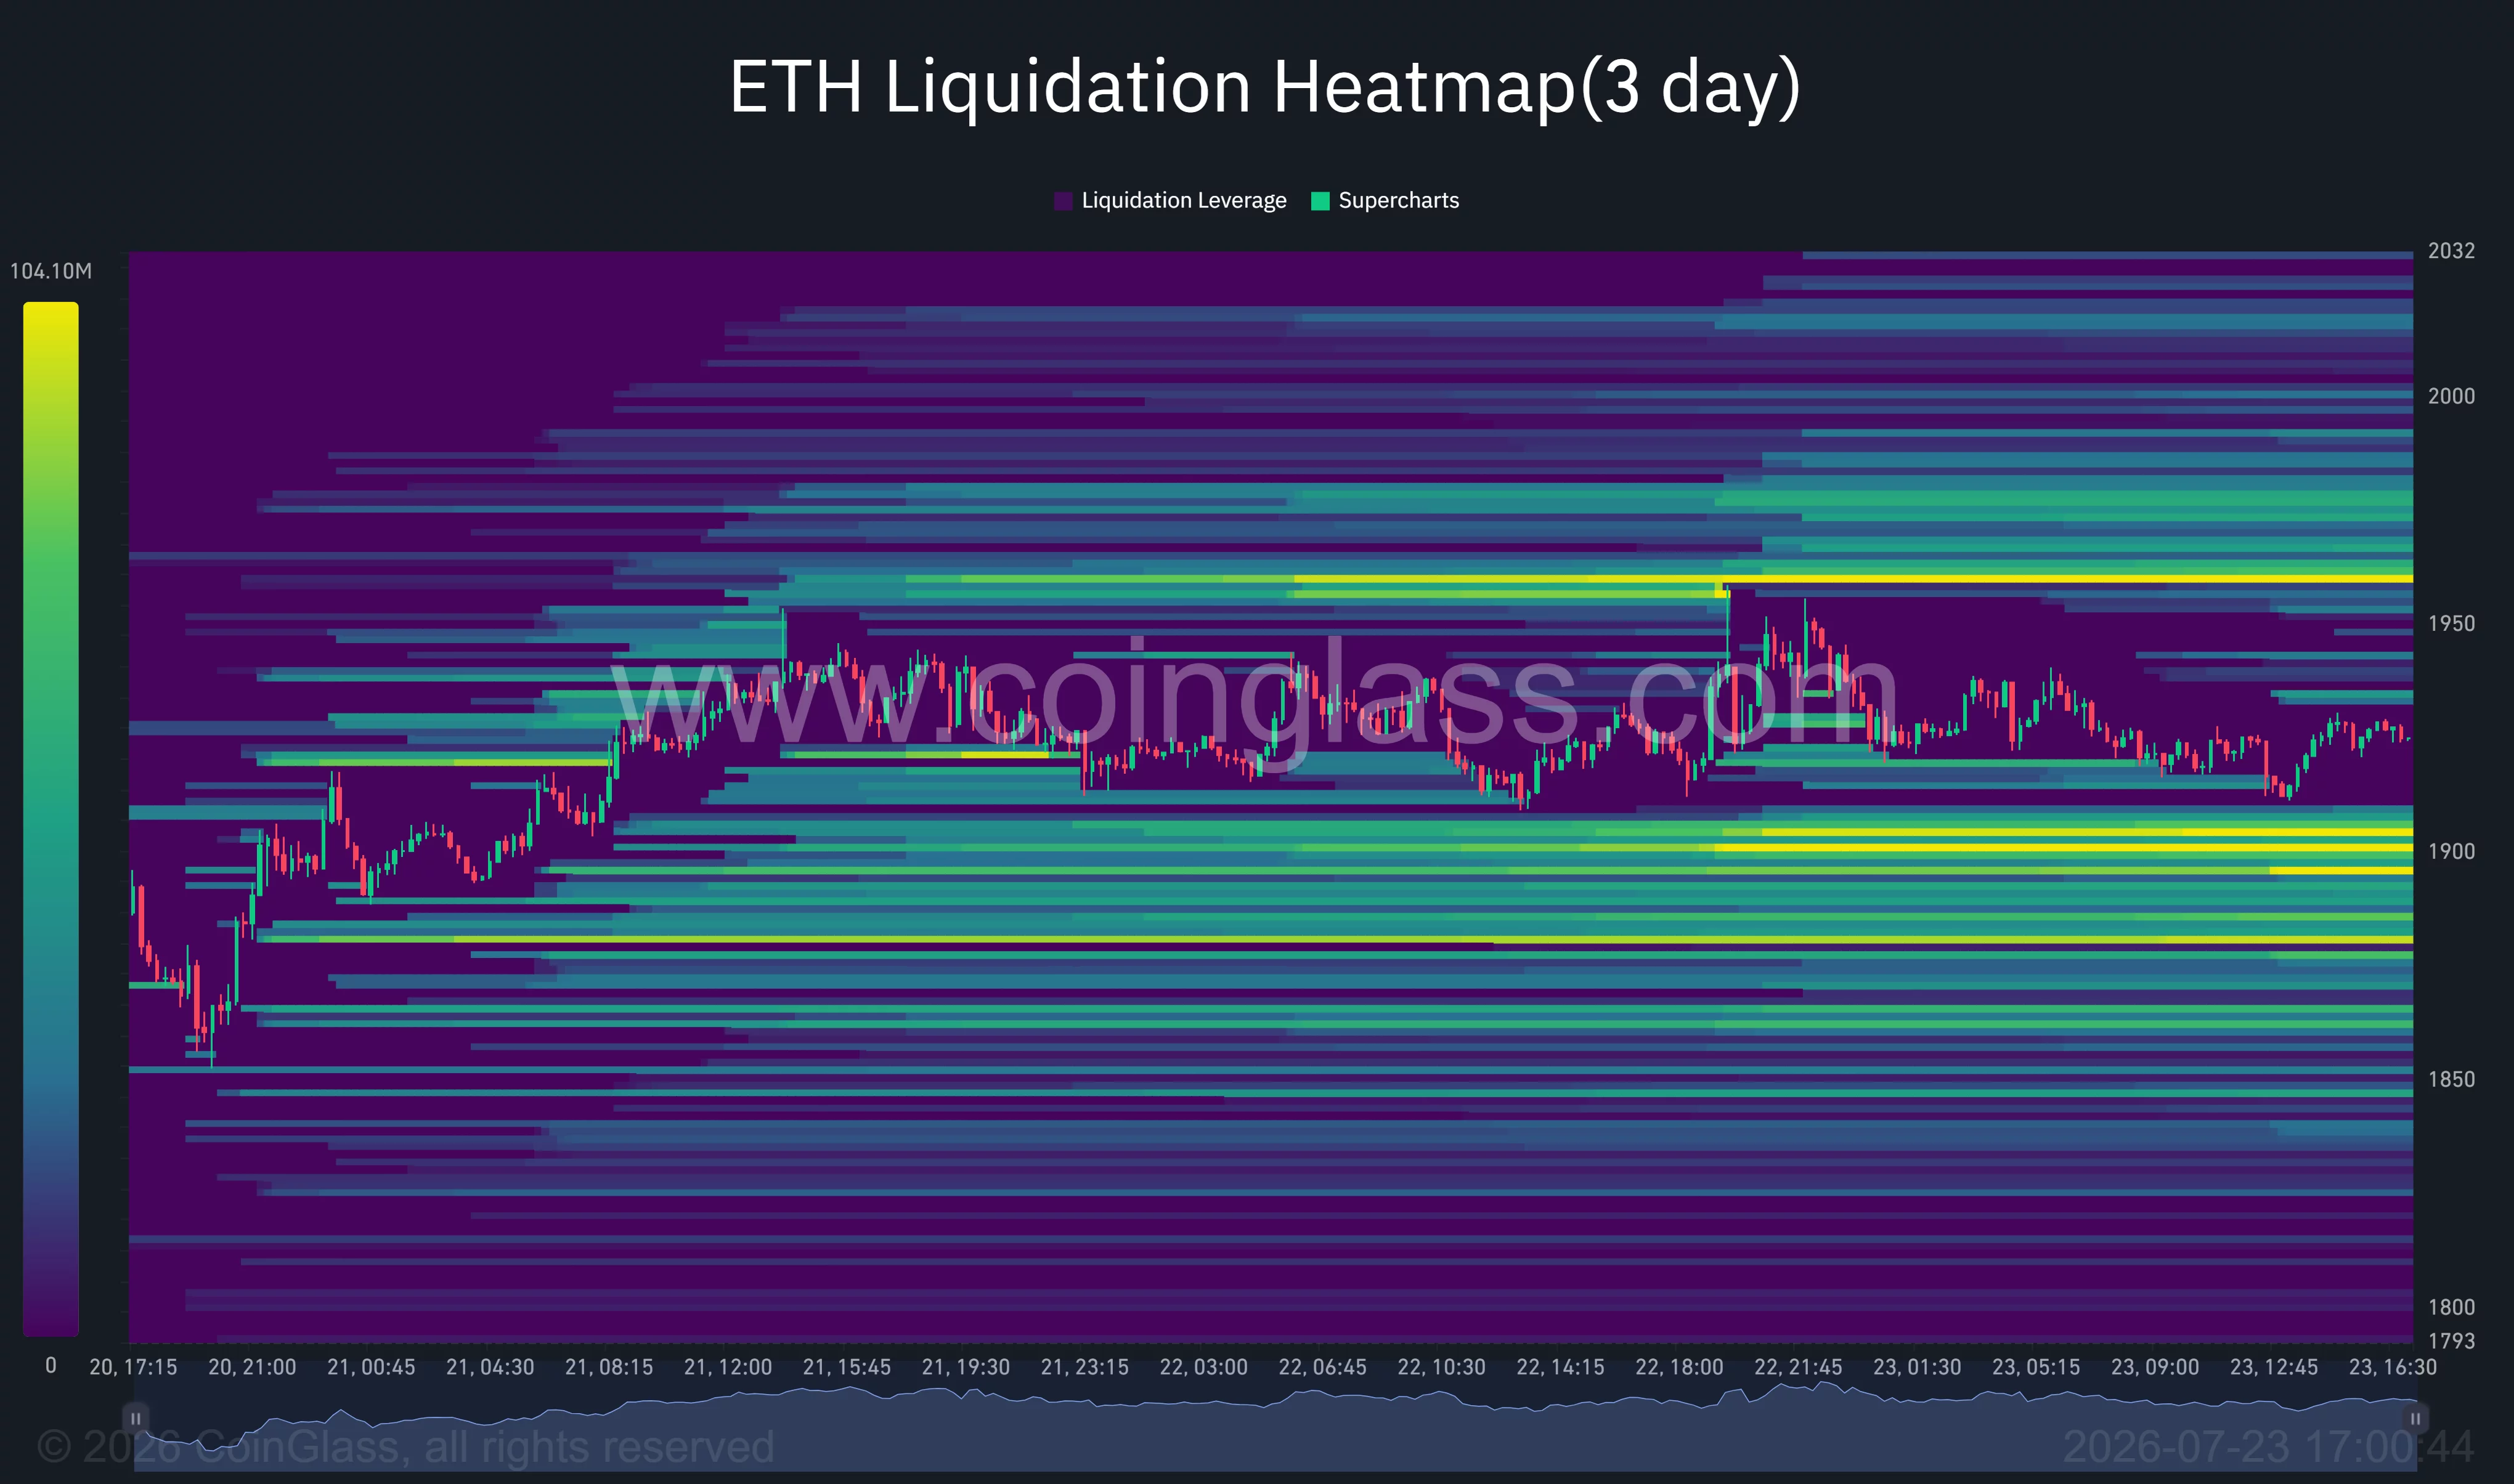
Failure to hold the rising 4-hour trendline would expose the $1,860 Fibonacci level first. A close below that support would weaken the higher-low structure and raise the risk of a decline toward $1,786.63, followed by daily Supertrend support near $1,745. Losses below $1,745 would invalidate the current recovery thesis and reopen $1,682.
Oil supply disruptions, a higher September rate-hike probability, and forced position reductions before BitMEX closes remain the main external risks. Ethereum needs sustained spot volume above $1,955 to confirm a breakout; without it, liquidity around $1,900 may continue to pull price back into the established range.
Disclosure: This article does not represent investment advice. The content and materials featured on this page are for educational purposes only.


Key takeaways
- XRP continues to trade below its 50-day EMA, keeping the short-term trend bearish.
- Momentum indicators are improving, with the MACD turning more positive and the RSI rising to around 55.
- A break above $1.15 could strengthen the recovery, while failure to do so may trigger another pullback.
Ripple’s native token, XRP, remained under pressure on Thursday, extending its corrective phase as it traded below the 50-day Exponential Moving Average (EMA).
Although the cryptocurrency has rebounded from recent lows, buyers continue to face strong resistance that has limited the recovery.
The current technical setup suggests that while bullish momentum is gradually improving, XRP has yet to confirm a sustained trend reversal.
50-Day EMA continues to cap upside
XRP is currently trading below the 50-day EMA at $1.1458, while remaining well beneath the 200-day EMA at $1.4425.
These moving averages continue to act as significant resistance levels, preventing the token from building stronger upward momentum.
Recent price action indicates that buyers have successfully defended lower support zones, but rallies have repeatedly stalled before reclaiming key technical levels.
Despite the broader corrective trend, technical indicators suggest that buying pressure is slowly returning.
The Moving Average Convergence Divergence (MACD) remains on an upward trajectory, with both the MACD line and signal line advancing while the histogram continues expanding into positive territory. This indicates that bullish momentum is strengthening.
Meanwhile, the Relative Strength Index (RSI) has climbed to approximately 55, placing it above the neutral 50 level. The reading suggests buyers are gradually regaining control without the market entering overbought conditions.
Together, these indicators point to improving market sentiment, although confirmation of a sustained recovery will require a breakout above key resistance.
Key Resistance Levels
The first major obstacle for XRP is the 50-day EMA at $1.1458. Just above that sits the 50% Fibonacci retracement level of the recent decline from $1.2935 to $1.0092, located around $1.1514.
A decisive move above this resistance zone would improve the short-term outlook and could encourage additional buying interest.
If XRP fails to break higher, traders will likely monitor several important support areas:
- 38.2% Fibonacci retracement: $1.1178
- Broken ascending trendline: Around $1.0937
- 23.6% Fibonacci retracement: $1.0763
- Recent swing low: $1.0092
Holding above these support levels would help preserve the current recovery structure, while a break below them could expose XRP to further downside.

XRP remains in a cautious recovery phase, supported by improving momentum indicators but constrained by significant technical resistance.
A successful breakout above the $1.1458–$1.1514 resistance zone would provide the first meaningful signal that bulls are regaining control. Until then, the token is likely to remain in a consolidation phase, with traders watching whether support around $1.12 can withstand renewed selling pressure.
Bitcoin price has fallen 1.4% from an intraday high of $66,300 to $65,368 as rising oil prices, renewed U.S.-Iran tensions, and regulatory uncertainty have pushed traders toward a more defensive stance.
Summary
- Bitcoin price has retested $65,000 as rising oil prices and geopolitical tensions pressure risk assets.
- ETF inflows support demand, but 4-hour momentum has weakened below the $66,800 resistance.
- Losing $65,000 could expose liquidity near $64,500 before the $63,170 moving-average support.
The decline erased part of Bitcoin’s recent recovery and brought the $65,000 support level back into focus. Selling accelerated after BTC failed to hold above $66,000, while the Fear and Greed Index remained in neutral territory as traders weighed institutional inflows against fresh macroeconomic risks.
Political uncertainty added to the pressure after Senate Democrats objected to parts of the latest Digital Asset Market Clarity Act proposal. Polymarket traders had lowered the probability of the bill becoming law in 2026 to about 37% earlier this week as ethics rules and investor protections remained unresolved.
At the same time, BitMEX announced that it would close its derivatives exchange on Sept. 23 following a strategic review by parent company HDR Global Trading. The platform stopped accepting new registrations and asked customers to close positions and withdraw their assets before operations end.
Institutional flows have provided some support during the pullback. U.S. spot Bitcoin exchange-traded funds recorded $69 million in net inflows on July 22, their seventh consecutive positive session, according to SoSoValue data. The seven-day streak brought combined inflows to about $1 billion, although July’s additions remained below the $6.9 billion withdrawn in May and June.
Oil and geopolitical risks are testing demand at $65,000
West Texas Intermediate crude climbed nearly 4% to around $90 a barrel on July 23, extending its advance for a fifth session. Brent rose close to $99 as attacks on Saudi oil tankers and threats against regional energy infrastructure raised fears of supply disruptions.
The UK Maritime Trade Operations agency reported that a tanker caught fire after it was struck southwest of Al Shuqaiq. Yemen’s Houthi rebels later claimed attacks on two Saudi tankers, saying the vessels had violated their maritime blockade.
President Donald Trump also warned that Washington would strike an Iranian bridge or power plant each time Tehran attacked a vessel in the Strait of Hormuz. Iranian authorities responded with threats against U.S.-linked infrastructure and energy assets across the region if Washington carried out those attacks.
Higher energy costs could keep U.S. inflation elevated and limit the Federal Reserve’s room to lower interest rates. Treasury yields may rise if traders expect tighter policy for longer, a development that could hurt demand for Bitcoin and other assets that do not offer a fixed yield.
Technology stocks have supplied another risk factor as investors assess Alphabet’s increased spending on artificial intelligence infrastructure. Weakness across high-growth equities often spills into Bitcoin because both markets attract investors who are sensitive to interest rates and changes in liquidity.
Bitcoin retains its rising channel while momentum weakens
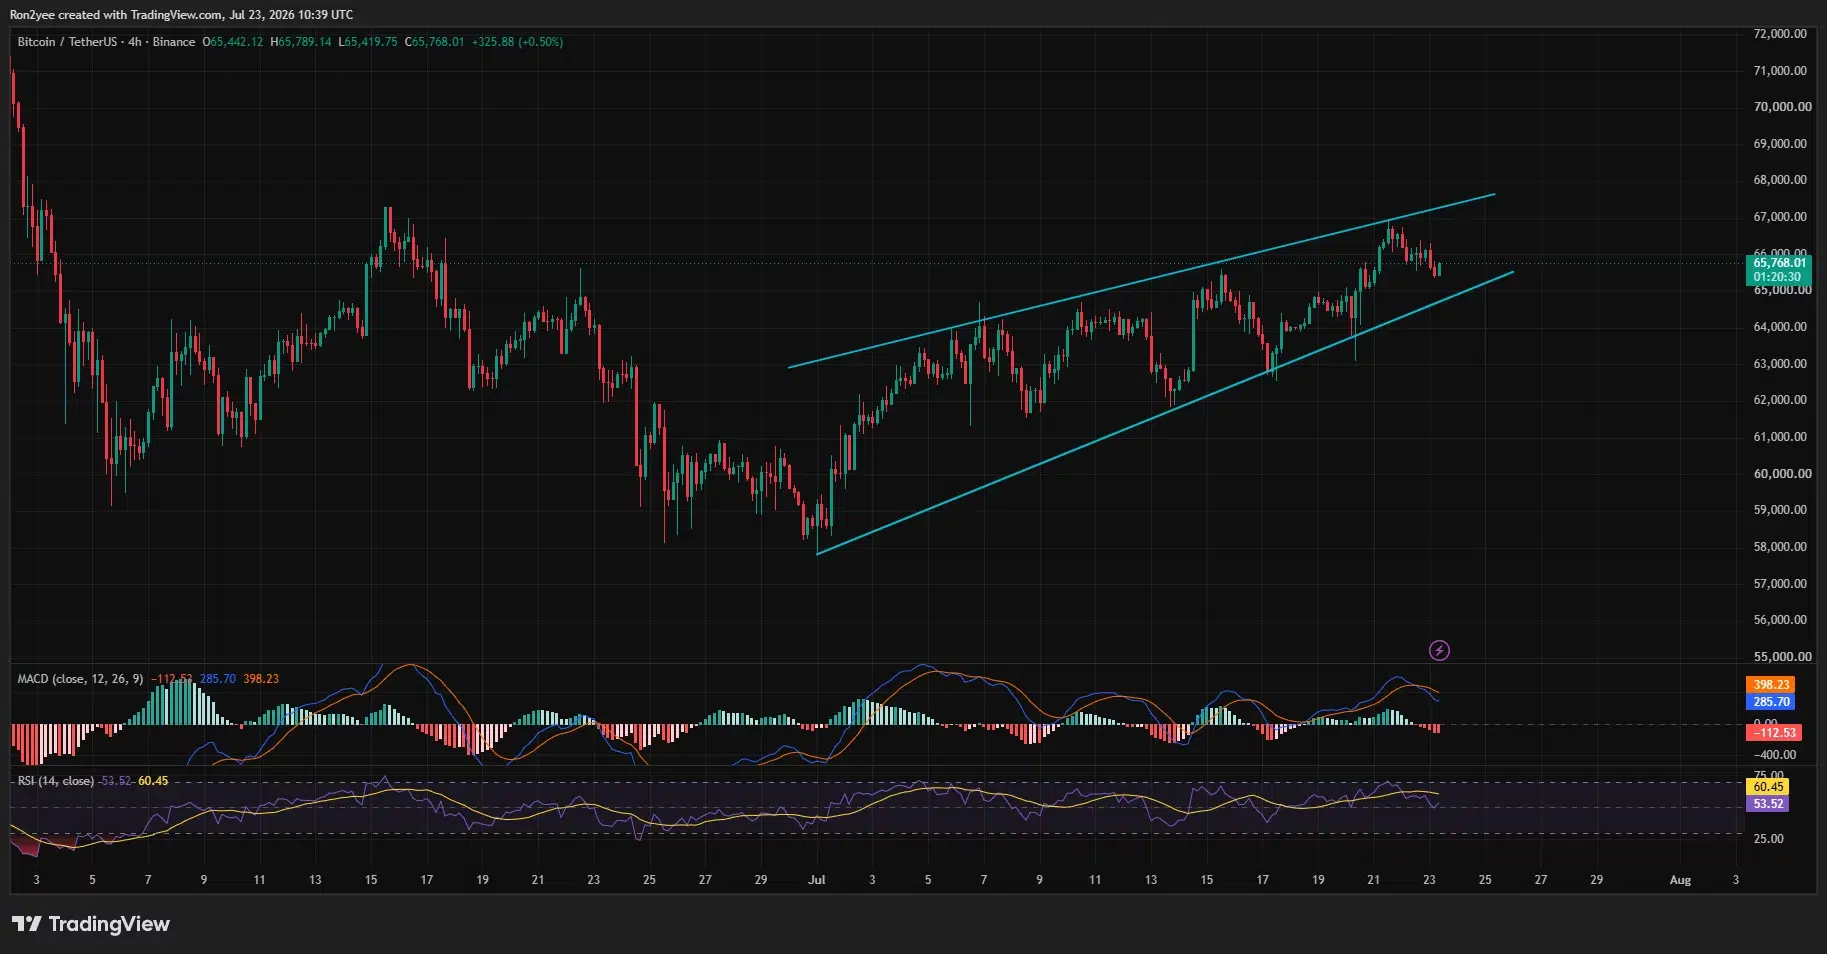
Bitcoin’s 4-hour chart shows that price remains inside an ascending channel that began near $57,800 in early July. The lower trendline now runs through the $65,000–$65,400 area, making the current retest important for the short-term recovery.
A successful defense could allow BTC to revisit $66,800, where the latest rally stalled, followed by the channel ceiling near $67,500. The three-day liquidation heatmap shows concentrated short-liquidation between $66,500 and $67,300, with another large cluster near $68,100.
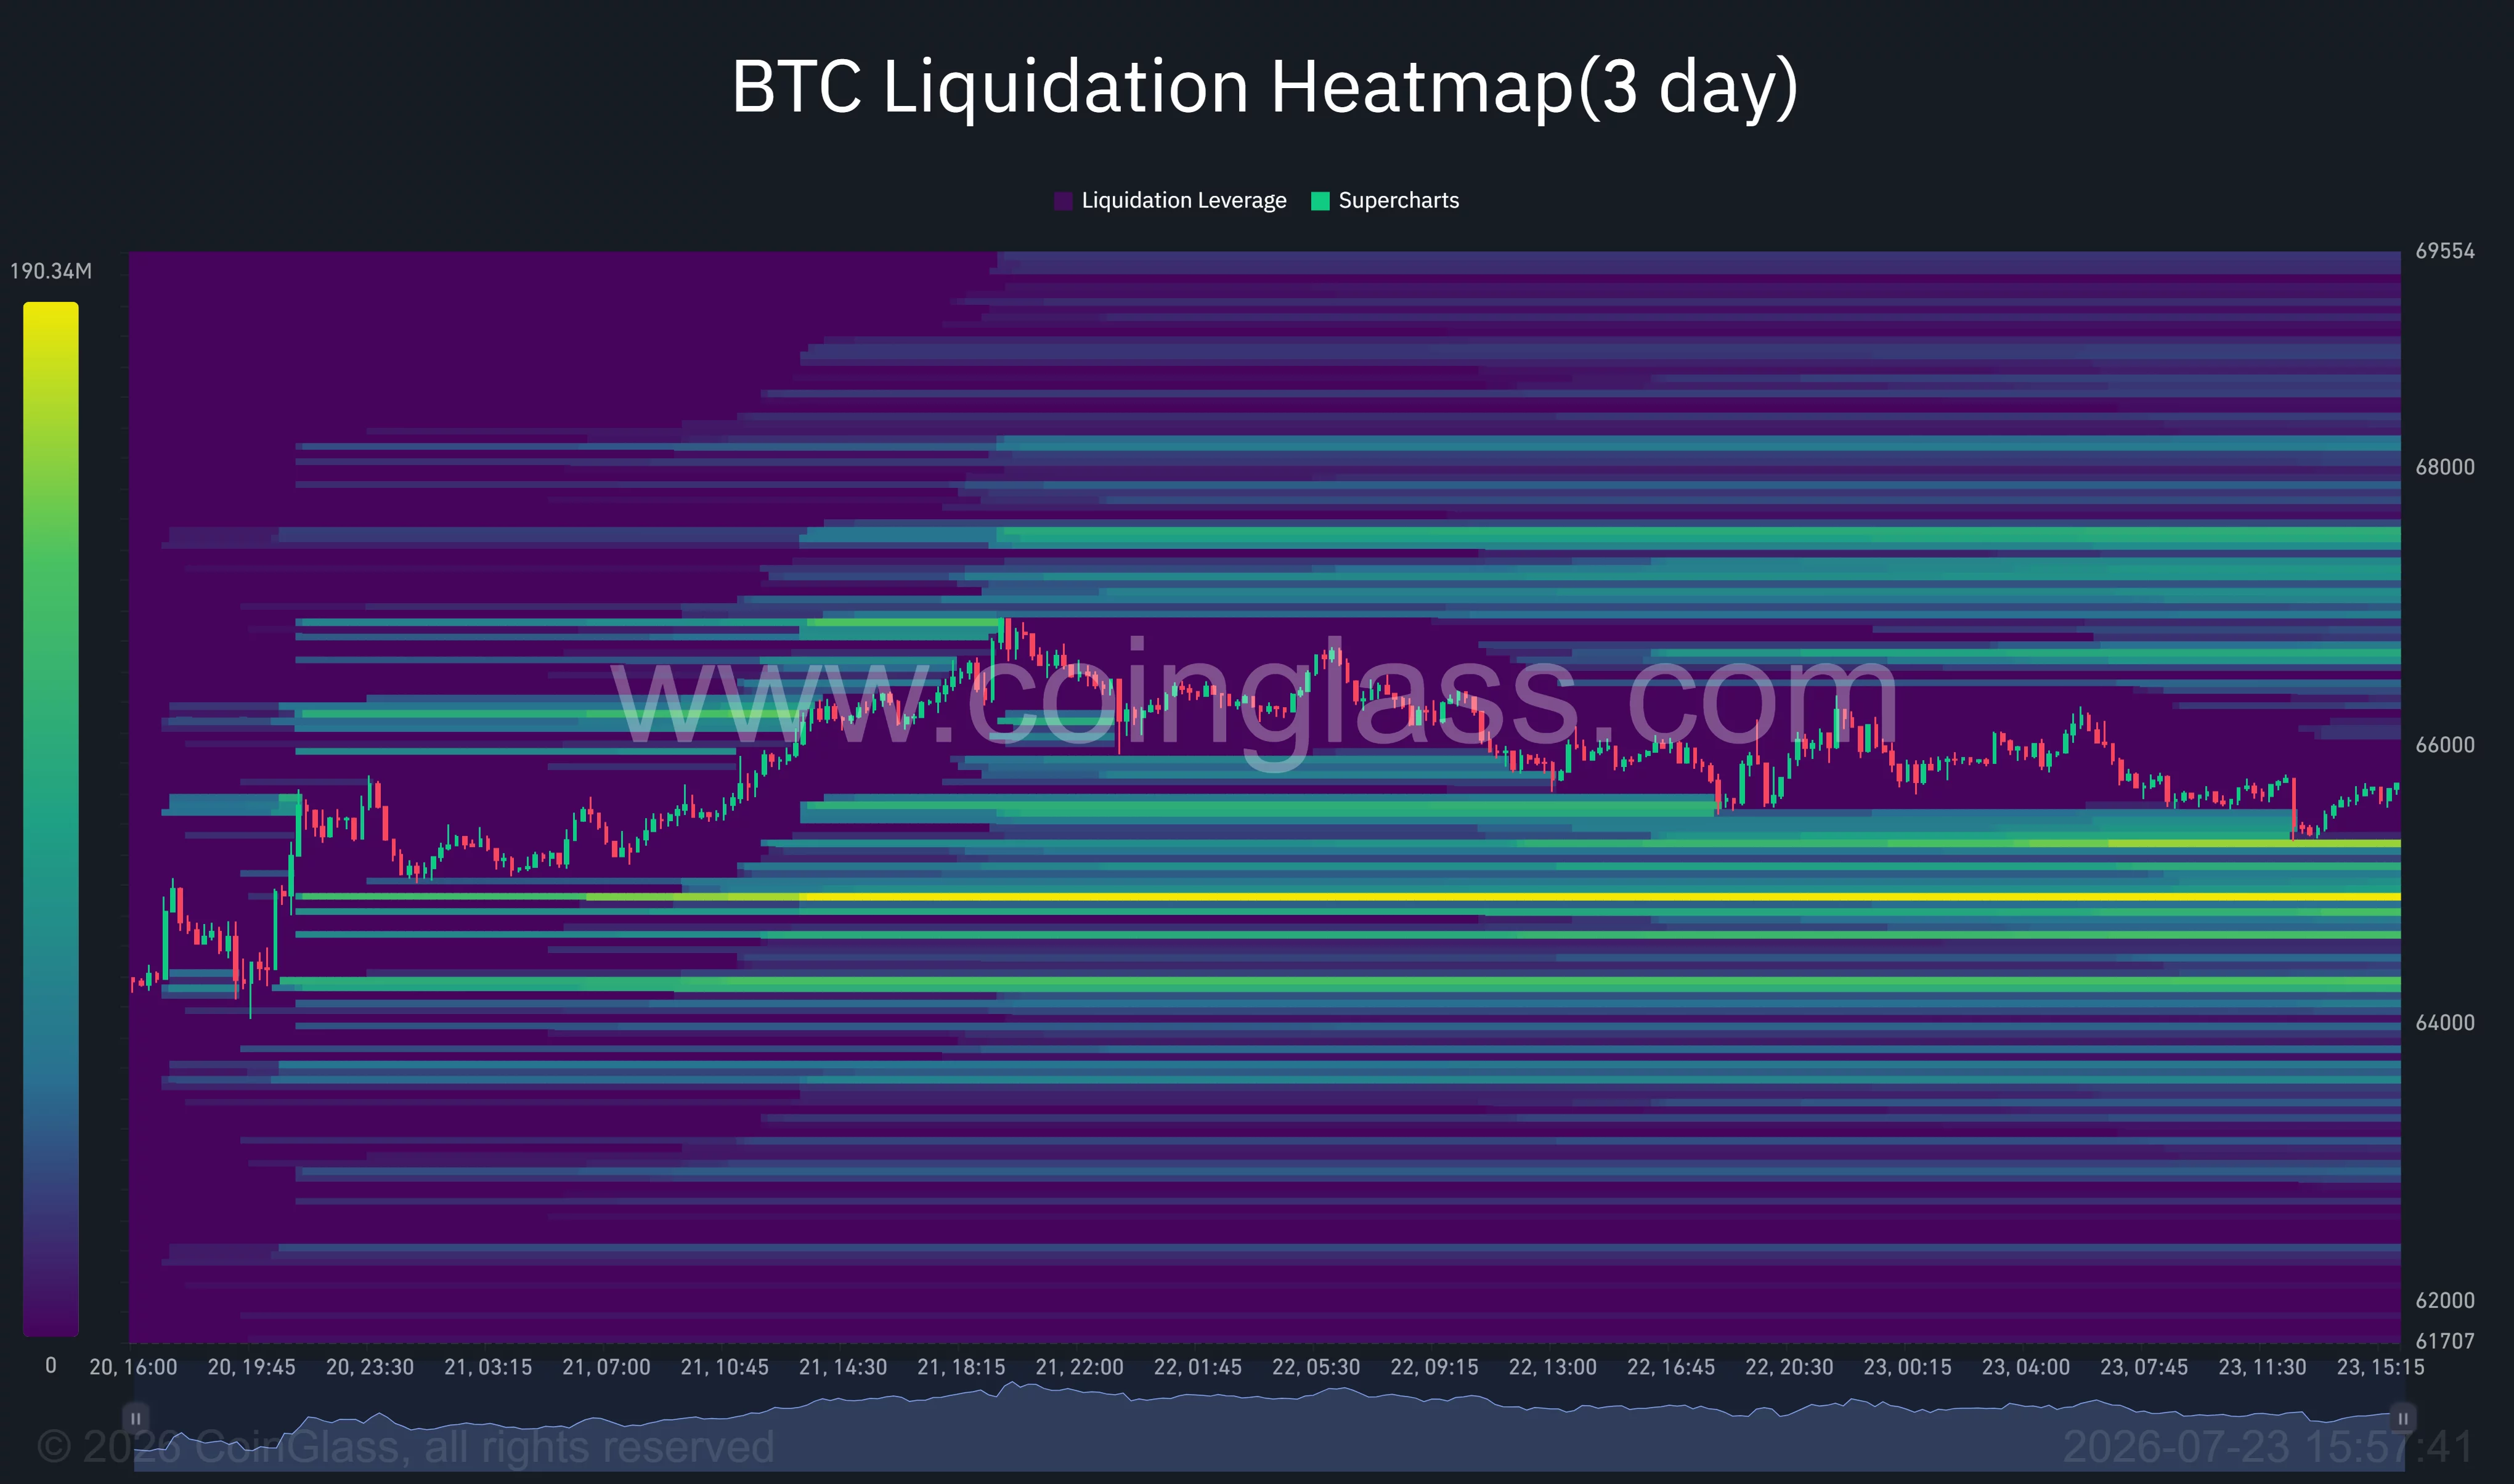
Commenting on the setup, crypto trader Ted Pillows noted that Bitcoin could advance toward $67,500–$68,000 as long as $65,000 holds.
“BTC is having a correction but still holding above the $65,000 level. As long as this holds, Bitcoin could rally towards $67,500–$68,000 soon.”
Analyst Lennaert Snyder offered a more cautious view after retaining a short position from the $67,000 region. Snyder identified a possible long entry only after a sweep below $65,000 and kept $68,100 as an upside target that would require confirmation.
Momentum has weakened on the 4-hour chart. The MACD line has dropped to 285.70, below the signal line at 398.23, while the histogram has moved to minus 112.53. The relative strength index has fallen to 53.52 from above 60, leaving momentum positive but no longer strong enough to confirm an immediate breakout.
On the daily chart, Bitcoin trades above the 20-day simple moving average at $64,232 and the 50-day average at $63,171. Those levels support the recovery structure, but BTC remains below the 100-day and 200-day averages at $70,044 and $72,602, respectively.
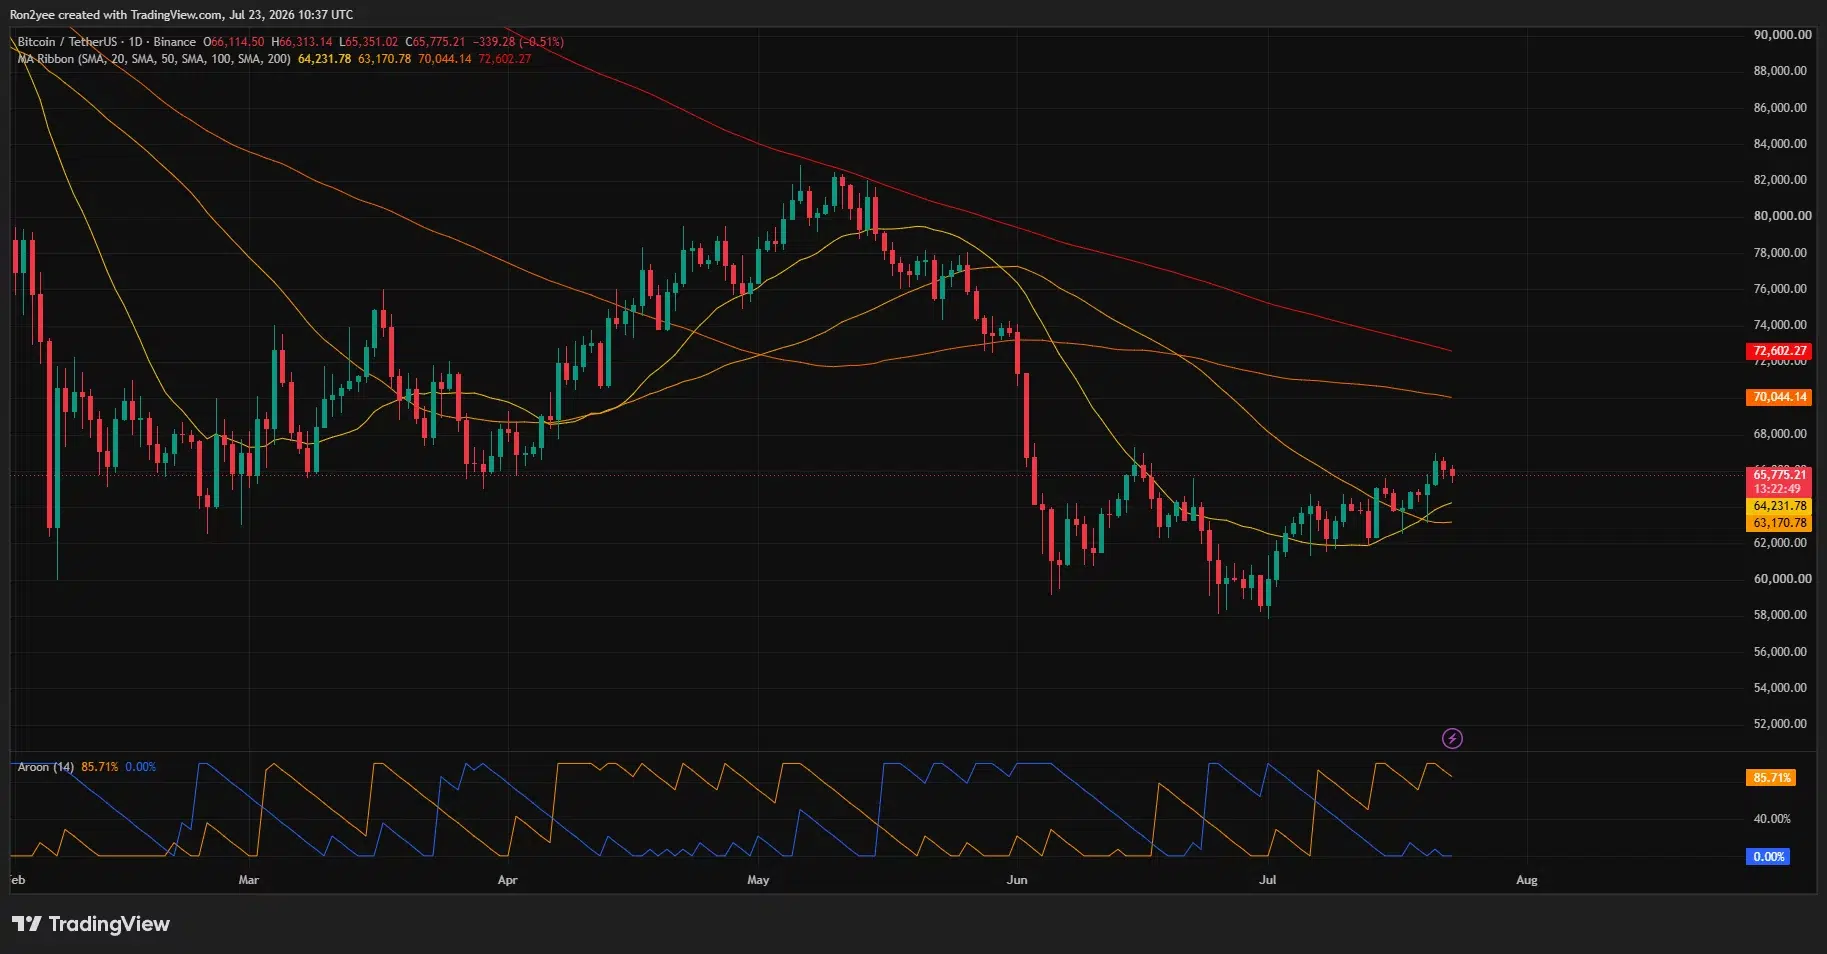
The daily Aroon Down reading has climbed to 85.71%, while Aroon Up has dropped to zero, which gives sellers control despite the recent rebound. A daily close above $66,800 would weaken that bearish reading and open a path toward $68,000 and the 100-day average.
Downside risk would increase if Bitcoin closes below the channel floor and loses $65,000. The heatmap places leveraged-long liquidity around $64,800, $64,500 and $64,000, while the moving averages create another support band between $63,170 and $64,230.
A break below $63,170 would invalidate the short-term recovery and expose $61,500, followed by the late-June floor near $59,000. Further oil gains, higher Treasury yields, or another escalation involving Iran could speed up that move even if ETF inflows remain positive.
Disclosure: This article does not represent investment advice. The content and materials featured on this page are for educational purposes only.
Crypto World
WEEX Launches USDGO Flexible Staking With Industry-Leading APR, Expanding Its Full-Suite Staking Product
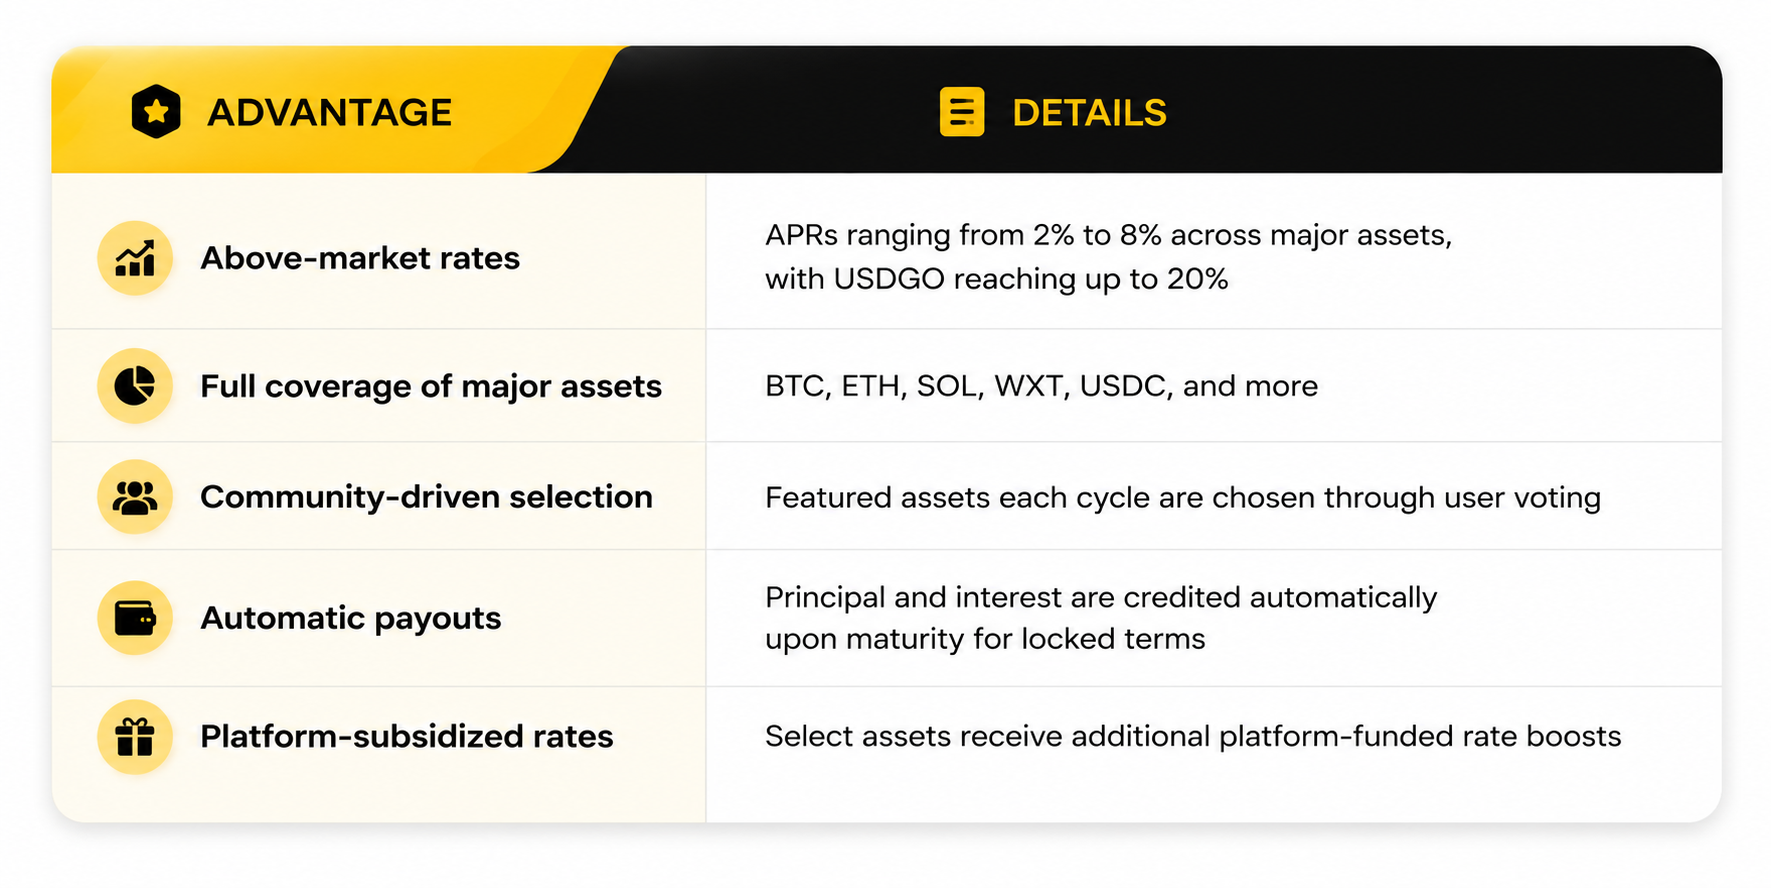
WEEX today announced the launch of flexible staking for USDGO, offering tiered annual percentage rates (APR) of up to 20% — among the highest rates currently available for the asset across major platforms.
USDGO Staking Tiers:
- 0–200 USDGO: 20% APR
- 200+ USDGO: 12% APR
USDGO staking is now live on WEEX with flexible terms, allowing users to subscribe and redeem at any time: https://www.weex.com/staking
What Is WEEX Staking?
Staking is WEEX’s yield product, giving users a way to earn on assets they already hold — whether they choose flexible terms for full liquidity or lock in a fixed period for a higher APR. The product supports major assets including BTC, ETH, SOL, WXT, and USDC and more, with featured assets each cycle selected through a mix of community voting and platform curation.
Core Product Advantages:

How the Rates Compare
Beyond USDGO, WEEX’s staking rates are structured to stay competitive across the board:

Who WEEX Staking Is Built For
WEEX designed its staking product around five common user profiles:
- Long-term holders of BTC, ETH, or SOL who aren’t looking to sell in the short term and want their holdings to generate yield while they wait
- WXT holders, who receive enhanced rates as platform token holders
- Stablecoin users seeking steady, predictable returns through USDC
- Yield-focused users willing to lock assets for a defined term in exchange for a higher APR
- Project teams looking to encourage long-term token holding among their community
Why This Matters
Staking has become a core expectation for exchange users who want their idle assets working for them, not just sitting in a wallet. With the USDGO launch, WEEX is signaling a broader commitment to offering some of the most competitive yield products in the market — backed by flexible terms, transparent payouts, and rates that scale in favor of everyday users rather than only the largest holders.
USDGO staking is live now. Explore the full range of WEEX staking products at https://www.weex.com/staking.
Disclaimer: Staking involves risk, including potential loss of principal. APRs are estimated and subject to change based on market conditions. This content is for informational purposes only and does not constitute financial or investment advice. Please review the terms of each product carefully before participating.
About WEEX
Founded in 2018, WEEX has developed into a global crypto exchange with over 6.2 million users across more than 150 countries. The platform emphasizes security, liquidity, and usability, providing over 1,200 spot trading pairs and offering up to 400x leverage in crypto futures trading. In addition to the traditional spot and derivatives markets, WEEX is expanding rapidly in the AI era delivering real time AI news, empowering users with AI trading tools, and exploring innovative trade to earn models that make intelligent trading more accessible to everyone. Its 1,000 BTC Protection Fund further strengthens asset safety and transparency, while features such as copy trading and advanced trading tools allow users to follow professional traders and experience a more efficient, intelligent trading journey.
Follow WEEX on social media
X | Instagram | Tiktok | Youtube | Discord | Telegram
The post WEEX Launches USDGO Flexible Staking With Industry-Leading APR, Expanding Its Full-Suite Staking Product appeared first on BeInCrypto.

How to Make Money with YouTube Shorts in 2026 (Full Guide)

Secret Service agent suspected of JD Vance leak put on leave: report

Rita Saffioti, Alannah MacTiernan summoned to attend defamation trial


-
 NewsBeat7 days ago
London Mayor Sadiq Khan handed a peerage by Keir Starmer alongside 15 other Labour figures… just days before the PM leaves No10
-

 Fashion6 days ago
Weekend Open Thread – Corporette.com
-

 Politics5 days ago
The House | The City of London can help the new chancellor deliver growth in every postcode
-
 Crypto World5 days ago
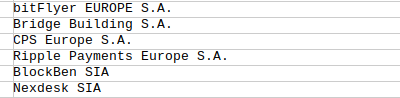
Ripple Payments Joins MiCA With 14 Firms, Does It Mean Anything For XRP?
-
 Crypto World6 days ago
Two July Windows Left: The CLARITY Act’s Senate Fight and What Failure Means
-

 Politics4 days ago
Democrats look to World Cup watch parties to register thousands of voters
-

 Crypto World6 days ago
Ripple wins EU-wide access as ESMA adds it to MiCA register
-

 Crypto World2 days ago
Grayscale Files For Worldcoin ETF, WLD Registers Sharp Rise
-

 NewsBeat3 days ago
Unregistered fitter used Gas Safe logo on business flyers
-
 Tech3 days ago
Sail Virtually Aboard The “Itanic” With IA-64 Emulator
-

 Crypto World7 days ago
Injective Submits SEC Transfer-Agent Registration to Onchain Ownership Records
-
 Tech2 days ago
Turtle Beach Command Series KB7 review: a nifty screen-equipped gaming keyboard
-

 NewsBeat6 days ago
Registration is now open for March for Men with Kev 2026
-
 Business1 day ago
New Jersey voter registration controversy explained: How 6,600 noncitizens got on the rolls, and what happens next
-
 Crypto World7 days ago
Claude Fable 5 Slips to Second in AI Coding Leaderboard
-

 News Videos6 days ago
Money | Class 12 Economics | CBSE Board Exam 2026-27
-

 Business6 days ago
Banco Bilbao Vizcaya Argentaria, S.A. (BBVA) Discusses Global Macro Environment and Economic Outlook for Core Markets Transcript
-

 Crypto World5 days ago
Kaspersky exposes OkoBot’s 20-module crypto wallet attack
-

 News Videos4 days ago
Big Money Is Entering XRP
-

 Business6 days ago
Airlines warn Sunshine Protection Act could disrupt flight scheduling
You must be logged in to post a comment Login