
Crypto World
Taiwan stablecoin regulations could take effect in Q1 2027



Taiwan’s Financial Supervisory Commission has said nine supporting regulations for its new Virtual Asset Service Act, including detailed stablecoin rules, could be formally introduced as early as the first quarter of 2027.
Summary
- Taiwan’s FSC is preparing nine regulations under the Virtual Asset Service Act, including rules covering stablecoins.
- The regulations could be formally published and implemented as early as the first quarter of 2027.
- Taiwanese financial firms are assessing stablecoins for cross border payments, custody, tokenization and other digital asset services.
- Industry executives see stablecoins and blockchain as potential infrastructure for payments and financing across Taiwan’s semiconductor supply chain.
Financial Supervisory Commission Chairman Peng Jinlong said at the FinTechOn 2026 and Asia FinTech Alliance Summit in Taipei on Sept. 2 that global discussions around virtual assets and stablecoins have moved from whether they should be developed to how they should be properly regulated.
Taiwan’s legislature passed the Virtual Asset Service Act in its third reading on June 30, establishing a licensing framework for crypto businesses and rules governing stablecoin issuance.
The FSC is now working on nine subsidiary regulations needed to implement the legislation, Peng said. Stablecoin requirements will form part of that package, with the regulator targeting the first quarter of next year for their publication and implementation.
Taiwan stablecoin rules move toward implementation
Once the new law and supporting regulations take effect, Peng expects Taiwan’s virtual asset and stablecoin sector to enter a new stage under formal supervision.
The Virtual Asset Service Act requires crypto businesses to obtain FSC approval before operating and covers exchanges, trading platforms, transfer providers, custodians, underwriters and lending businesses. Existing companies registered under Taiwan’s previous anti-money laundering regime have been given a transition period to move into the licensing system.
Stablecoin issuers face a separate approval process involving both the FSC and Taiwan’s central bank. Issuers will be required to maintain full reserve backing, place reserve assets in trust and comply with audit and disclosure requirements.
Crypto.news previously reported in July that the legislation moved Taiwan away from a system largely based on AML registration toward supervision covering operations, customer protection, cybersecurity, market conduct and financial reporting.
The framework developed from an FSC draft released in March 2025, which set out proposed licensing standards for virtual asset businesses and requirements for stablecoin issuers. Earlier proposals contemplated allowing banks to issue New Taiwan dollar-pegged stablecoins subject to regulatory approval.
Peng said rapid development in artificial intelligence and blockchain technology is pushing Taiwan and other financial markets toward a model in which traditional finance, digital finance and blockchain-based finance operate alongside one another.
Taiwan has taken a similar regulatory approach to AI. The FSC has published six core principles and related guidelines for financial institutions using artificial intelligence and plans to expand work involving AI-based fraud prevention and financial data applications while keeping risks under control.
Stablecoins emerge as an option for semiconductor payments
The discussion around stablecoins is extending into Taiwan’s semiconductor supply chain, where companies process large volumes of international payments, trade financing and corporate treasury transactions.
Taiwan Semiconductor Industry Association executive director Lu Chaoqun said AI is driving rapid expansion in the global semiconductor business. Global semiconductor annual revenue approached $800 billion in 2025 and could exceed $1.5 trillion this year, according to Lu.
He projected the industry could challenge $2 trillion in annual revenue within the next two to three years and potentially reach approximately $3 trillion by 2035. Taiwan’s semiconductor industry cluster, meanwhile, is moving toward a scale of $1 trillion.
Taiwanese manufacturers assemble and ship roughly 90% of the world’s AI servers and account for around 76% of global semiconductor foundry revenue, Lu said. Components and finished goods move across borders every day, creating payment, financing and corporate capital management requirements alongside physical supply chains.
Factories and logistics networks can operate around the clock, while international payments remain constrained by banking hours, time zones and settlement procedures.
Lu said stablecoins, blockchain technology and financial technology have consequently become urgent infrastructure for supply-chain companies handling cross-border payments, trade financing and treasury management. He argued that financial institutions should work as partners to AI, semiconductor and technology companies instead of limiting their role to providing financial services.
Programmable payments could connect supply chains
Taiwan FinTech Association Chairwoman Wang Li-ling said advances in AI, blockchain, stablecoins and programmable payments are bringing goods, information and money flows closer together within global supply chains.
Under such systems, AI could forecast demand while logistics systems adjust automatically, blockchain networks verify transactions and documents, and programmable payment systems release funds when agreed conditions have been met.
For stablecoins, Wang said the important part is not the “coin” but whether trust can be established behind the “stable” component.
She said stablecoins could make liquidity management more efficient for multinational businesses, shorten settlement periods for importers and exporters, and potentially lower payment costs for small and medium-sized businesses in emerging markets participating in international supply chains.
Cross-border use would require regulation extending beyond individual jurisdictions, Wang said. Reserve management, redemption, technology and regulatory standards would need sufficient cross-border trust, while the increased use of AI in decisions involving goods, capital allocation and supplier risk would raise questions involving data quality, cybersecurity, privacy, model governance and responsibility.
Taiwan has been tightening the infrastructure surrounding crypto transfers as the licensing system takes shape. In August, the FSC proposed expanded Travel Rule requirements for domestic virtual asset transfers, including additional identification requirements for transactions above NT$30,000.
The regulator intends to extend the framework to transfers between Taiwanese and overseas virtual asset service providers by the end of 2027.
Financial institutions assess stablecoin opportunities
Cathay Financial Holdings senior executive vice president Sun Chih-te said digital assets and stablecoins have moved from an area once treated as peripheral by traditional financial institutions toward a new area of financial development.
Large financial institutions can no longer remain outside the sector, he said, though mainstream adoption still faces issues involving market scale, regulation and customer experience.
Cathay is evaluating opportunities involving stablecoins, digital asset custody, cross-border payments and tokenization, according to Sun. The financial group wants to examine potential expansion into digital asset lending and trading while studying applications across insurance, asset management, wealth management and securities businesses.
Cross-border payments are among the applications Cathay considers most capable of reaching scale in the immediate future. The company is evaluating the role it could play within such an ecosystem and which partners could participate.
Taiwan had been considering a banking role in stablecoin issuance well before passage of the Virtual Asset Service Act. An earlier FSC proposal envisioned locally issued stablecoins pegged to the New Taiwan dollar, with issuers subject to regulatory approval and oversight involving the central bank.
Sun said regulatory requirements need to be clear and fair while providing room for innovation alongside anti-money laundering, know-your-customer, security and compliance obligations. Restricting development to the safest possible areas, he said, could leave projects stuck at the proof-of-concept stage.
Stablecoin-based cross-border payments would require a degree of regulatory coordination between markets so different systems can work together, according to Sun.
Customer experience will ultimately determine whether digital asset products move beyond trials, he said. Stablecoins and other digital asset services would need to deliver improvements in actual use, not simply offer faster, cheaper or more efficient transactions in theory.
“Getting to 90% is not enough,” Sun said, arguing that the final 10% can determine whether an innovation remains a concept or becomes a solution adopted by the mainstream market.
Asia FinTech Alliance Chairwoman Tsai Yu-ling said the organization now connects 16 Asian markets and is working to help participating economies share experience and develop common solutions. Its newly launched AFA Awards will support fintech companies seeking expansion across those markets, giving selected businesses what Tsai described as a faster route into the alliance’s 16-market network.

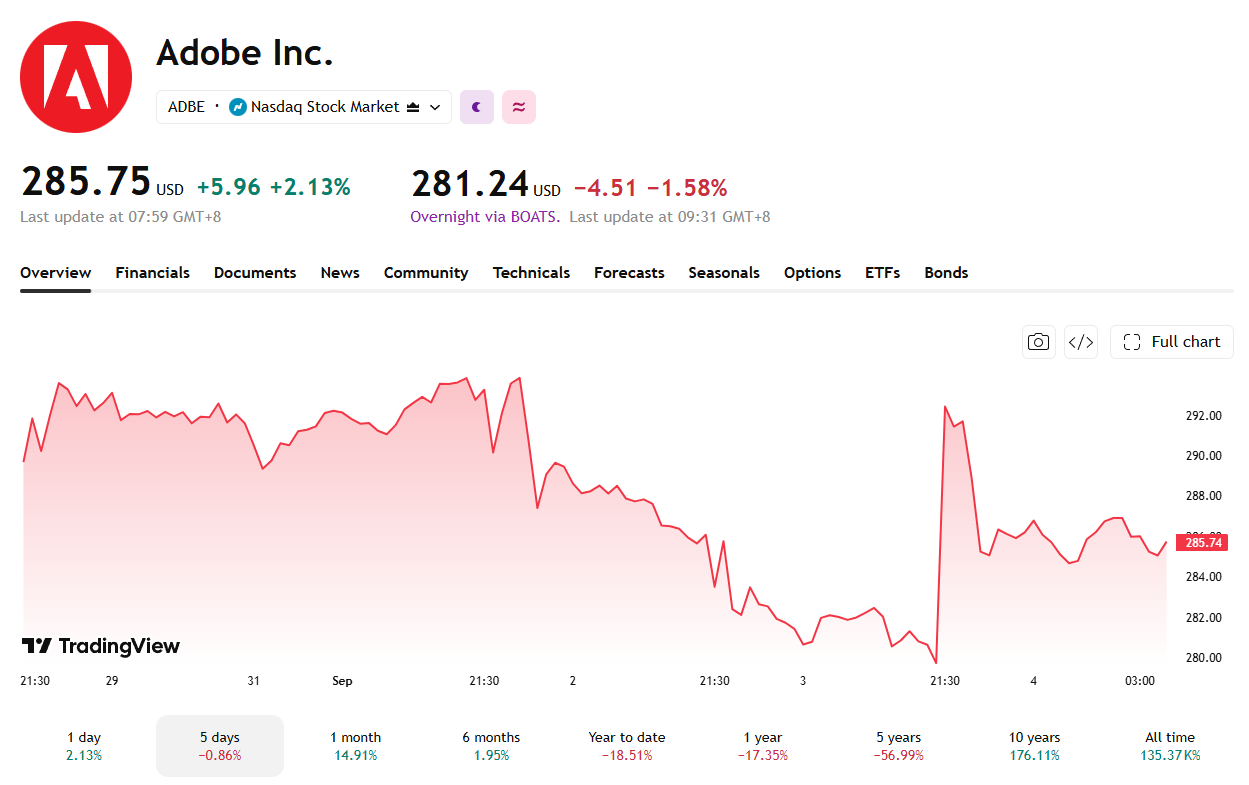
Adobe (ADBE) named Anil Chakravarthy as its next president and CEO on Thursday. He replaces Shantanu Narayen, who is stepping down after 18 years as AI concerns weigh on Adobe’s stock.
Narayen will become executive chair and support Chakravarthy through the handover, which takes effect Dec. 1. Chakravarthy will also join Adobe’s board at that time.
The Leadership Handoff
Chakravarthy most recently led Adobe’s customer experience orchestration unit and its worldwide field operations. He joined Adobe nearly seven years ago after serving as chief executive of Informatica, an enterprise data management company. That company had partnered with Adobe under Narayen.
“Adobe’s opportunity ahead is limitless with our track record in creating new market categories and world-class products. Anil is an experienced transformational leader who leads with values, integrity and a deep knowledge of our business.”
Shantanu Narayen, Adobe’s outgoing CEO, in a statement
“A lot of the reason I came was the opportunity to work with him and work with the leadership team at Adobe.”
Anil Chakravarthy, Adobe’s incoming CEO, in a 2021 interview with CNBC
In contrast, David Wadhwani announced he will leave Adobe after leading its creativity and productivity business for nearly five years.
Observers once viewed him as a top CEO contender for his role in Adobe’s bid to acquire design firm Figma. Regulators forced the companies to scrap that deal in 2023.
Why Adobe Stock Keeps Falling
The CEO change comes as Adobe shares remain under pressure. The stock fell 25% in 2024 and another 21% in 2025, and it is down 18% so far in 2026. Shares slipped roughly 2% in extended trading following Thursday’s announcement.

Meanwhile, the decline mirrors a wider retreat among software stocks slumping on AI fears. Investors worry generative AI tools could erode demand for subscription software.
Software peers have faced similar pressure as free or low-cost AI tools threaten legacy subscription models.
However, whether Chakravarthy can reverse the trend depends on Adobe’s own AI tools. He will need to show they can outpace cheaper rivals starting in December.
The post Adobe Names Anil Chakravarthy CEO But AI Fears Are Impacting the Stock appeared first on BeInCrypto.


Adam Aron said AMC has no connection to Robinhood’s tokenized shares, reviving questions around how stocks are brought onchain.


Meta CEO Mark Zuckerberg and Senator Bernie Sanders staked out opposite ends of US AI regulation on Thursday. Zuckerberg called a national regulator flawed, while Sanders moved to ban advanced AI.
Those two positions now bracket the fight in Washington. One camp wants industry to police itself while the other wants the government to stop building.
Zuckerberg Says AI Regulation Would Hand China the Lead
Trump called Zuckerberg the week of August 17, POLITICO reported Thursday. Zuckerberg opposed a proposed watchdog modeled on the Financial Industry Regulatory Authority (FINRA).
FINRA polices US brokerages and is funded by the firms it oversees. The AI version would test frontier models for risk before release. Google DeepMind chief Demis Hassabis popularized the idea in July.
Zuckerberg had already argued that superintelligence should reach everyone rather than a few labs.
“Any policy that slows American model releases … could add significant risk to American leadership while letting foreign models race ahead,” Zuckerberg said in August.
Sanders Sets the Bar at Human Level
Sanders and Representative Greg Casar announced the Ban Artificial Superintelligence Act on Thursday. It would outlaw systems that match or exceed human cognitive performance.
That bar sits lower than the name suggests. Matching human performance would trigger the ban.
The bill would also freeze advanced AI work until a new federal regulator writes rules. Violators face up to 20 years in prison.
Sanders has pressed Congress on AI before without moving legislation.
“The future of humanity cannot be left in the hands of a handful of Big Tech oligarchs,” Sanders said in a statement.
Zuckerberg did not kill the proposal. Officials are still weighing the FINRA-style body against a voluntary industry group. Adviser David Sacks favors the lighter option and has dismissed AI safety fears as storytelling.
Both camps now accept some kind of referee. The fight is over whether anyone stops building while it gets built.
The post AI Regulation Showdown: Zuckerberg Wants Speed, Sanders Calls for a Pause appeared first on BeInCrypto.
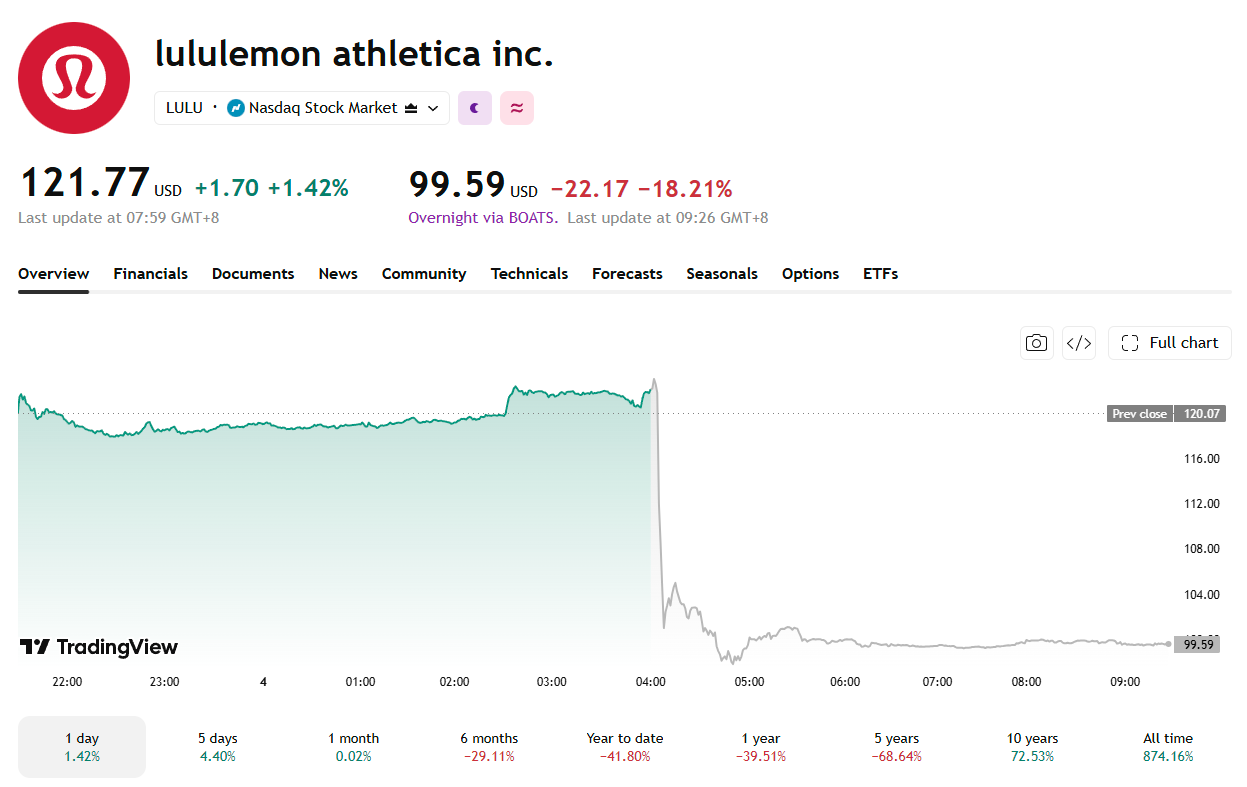
Nasdaq-listed Lululemon Athletica (LULU) stock dropped 18% in after-hours trading on September 3. Shares fell to under $100 after the company’s third guidance cut of 2026 overshadowed a profit beat.
The decline pushed shares to their lowest level in roughly eight years, below the 52-week low. LULU now trades about 80% under its all-time high of $511.29, set in December 2023.
Lululemon’s Third Guidance Cut of the Year
Lululemon has trimmed its full-year outlook three times since March. Each cut followed a quarter that beat earnings estimates but missed on sales.

March guidance called for $11.35 billion to $11.50 billion in revenue. June guidance was cut to $11.00 billion to $11.15 billion. September guidance now stands at $10.35 billion to $10.50 billion.
Second-quarter revenue fell 4% year over year to $2.42 billion, missing forecasts. Comparable sales dropped 10% globally and 12% in North America.
Lululemon Under Pressure
The repeated cuts have coincided with a turbulent year for the brand. Founder Chip Wilson waged a proxy fight against the board, and former chief executive Calvin McDonald departed in January.
In May, a Great Wall of China event featured a drum mistaken for a Japanese instrument, sparking backlash. Rivals Alo Yoga and Vuori have continued to take share in North America.
Interim co-chief executive and chief financial officer Meghan Frank pointed to reputational damage as a factor behind the latest slowdown.
“We faced negative commentary in the media and social channels, which impacted traffic and softer than planned response to some new product launches.”
(Meghan Frank, interim co-CEO and CFO, Lululemon Athletica)
Incoming chief executive Heidi O’Neill starts next week and inherits a turnaround plan that has yet to show results. Lululemon guided third-quarter revenue down 10% to 11% year over year.
The post Lululemon Stock Drops 18% to 8-Year Low After Third Guidance Cut appeared first on BeInCrypto.
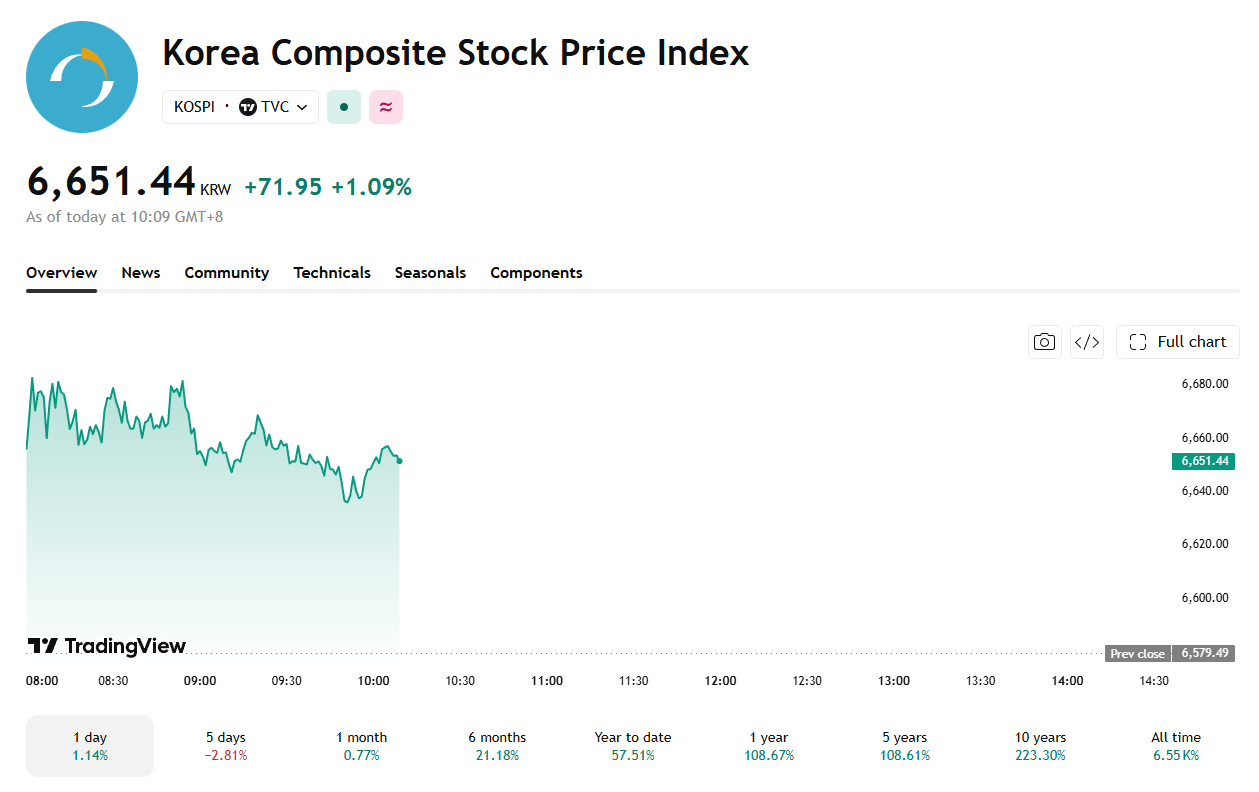
South Korea’s Kospi jumped 1.14 percent at Friday’s open. The rally tracked a broad Wall Street advance after Fed Governor Christopher Waller signaled a rate hold this month.
The benchmark index rose 74.88 points to 6,650. It extended a rebound after a sharp slide earlier this week tied to Middle East tensions.
Waller Comments Cool Rate Hike Worries
Waller made the remarks Thursday, saying he would be inclined to support a hold. He backed keeping rates in the current 3.5 percent to 3.75 percent range at the Fed’s Sept. 15-16 meeting.
Treasury yields eased on the remarks, feeding into falling rate hike odds tracked on prediction markets this week.
Japan’s Nikkei 225 and Hong Kong’s Hang Seng also opened higher. South Korea’s small-cap Kosdaq index advanced even more sharply.

Thursday’s rally set the tone across US markets. The Dow Jones Industrial Average gained 1.18 percent. It was the index’s best day since Aug. 4.
The S&P 500 added 1.06 percent, while the Nasdaq Composite rose 1.4 percent. All three indexes are on pace for a positive week.
Jobs Report Looms as Next Catalyst
Traders are now watching Friday’s August nonfarm payrolls report, the same data point that has repeatedly moved risk assets after recent monthly releases.
Economists polled by Dow Jones expect 53,000 jobs added. That compares with a loss of 23,000 jobs in July. Unemployment is expected to hold at 4.1 percent.
José Torres, senior economist at Interactive Brokers, said labor weakness should push the Fed toward easier policy.
Ongoing decreases in employment should be enough for the central bank to start considering the labor side of its mandate when prescribing policy.
— José Torres, Interactive Brokers, CNBC
Torres is also watching next week’s inflation reports. He flagged the consumer price index and producer price index.
The session rounded out a broadly positive day across the region. Friday’s jobs data could reinforce the dovish case or revive rate hike concerns. Either way, it will help set the tone heading into the Fed’s September meeting.
The post Kospi Jumps, Following Wall Street, as Fed's Waller Signals Rate Hold appeared first on BeInCrypto.
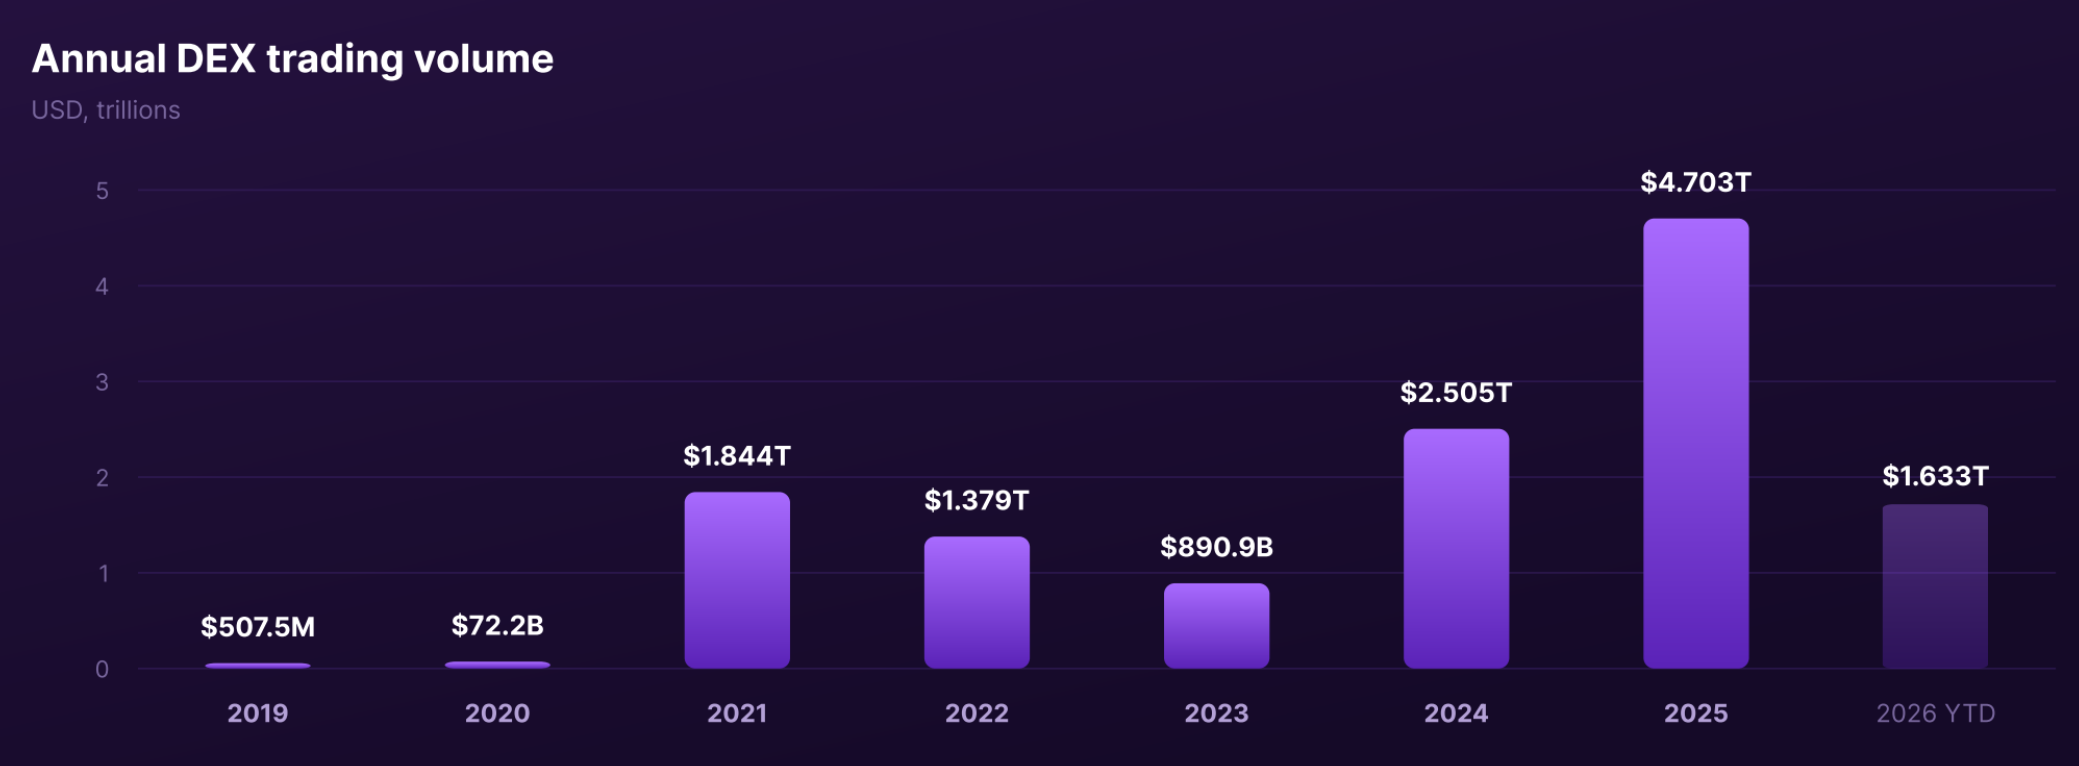
The crypto industry today is almost unrecognizable from 7 years ago, both in size and scale. Just for decentralized exchanges (DEX), trading volume grew roughly 9,260x from 2019 to a record $4.7 trillion in 2025. In 2026, however, activity moderated to $1.63 trillion year-to-date.
It’s not down to one chain or sector. Liquidity is now distributed across more blockchains, venue types, protocols, and execution environments, without one clearly replacing the others.
SwapSpace recently published its State of Crypto Swaps 2026 report, which shows the massive extent of this growth. One of the clearest findings comes from its own platform data. Over 90.12% of its users interacted with more than one blockchain network in 2026.
At the same time, survey respondents did not identify DEXs, CEXs, or aggregators as universally offering the best rates.
The findings clearly show that the market today offers more execution options, and no single venue, network, or liquidity source dominates every transaction.

90% of SwapSpace Users Are Multichain
SwapSpace is a crypto exchange aggregator that lets users compare rates across different swap services and exchange different crypto through a single interface. So, the platform has a notable vantage point of how users today interact across different chains.
Among SwapSpace users, multichain activity is not marginal. Between 2022 and 2026, the share of users interacting with more than one network ranged from 72.50% to 93.66%.
It reached its lowest point at 72.50% in 2024, before rising to 90.12% in 2026. Even at the low point of the observed period, nearly three-quarters of users interacted with more than one blockchain.
These figures provide a platform-level view of how users operate in a market where assets and liquidity are spread across multiple networks.
The broader DEX market shows a similar redistribution of activity. According to DeFiLlama data cited in the SwapSpace report, Ethereum accounted for 46.2% of global DEX volume in 2021, while BNB Chain represented another 39.6%.
By 2025, Ethereum’s share was 19.3% and BNB Chain’s 15.3%, while Solana accounted for 33.3% and other chains collectively represented 32.1%.

SwapSpace’s internal activity data shows a similar lack of a permanent leader. Ethereum led platform activity from 2020 through 2024, Solana moved into first place in 2025, and BNB Chain led in 2026.
Taken together, the data shows that multichain activity is taking place in a market where liquidity leadership continues to shift between ecosystems.

Fragmentation Does Not Stop at the Blockchain Level
The multichain picture captures only one layer of fragmentation. Liquidity is also distributed within individual blockchain ecosystems. The report cites DeFiLlama tracking of around 1,950 protocols on Ethereum, more than 1,200 on BNB Chain, and more than 1,000 each on Arbitrum and Base.
Those protocols can contain different pools, assets, and execution mechanisms. A user operating on Ethereum, for example, is not necessarily accessing one unified liquidity environment.
That creates two layers of complexity: liquidity is distributed between blockchain ecosystems and again between protocols and pools within them.
The distinction matters because the number of possible execution paths can expand even without adding another network. A transaction may involve not only choosing a chain, but also navigating several potential sources of liquidity within that chain.
In that sense, describing the market as simply “multichain” understates how fragmented the execution layer itself has become.
DEX Growth Has Produced a Hybrid Market
DEX trading has grown sharply, but it has not replaced centralized exchanges.
After reaching a record $4.7 trillion in 2025, DEX activity remains significant in 2026, even as the broader crypto market has cooled. Centralized exchanges still handle most spot trading, while DEXs are gaining ground in areas such as perpetual futures.
The result is a more hybrid market. Traders now move between centralized and decentralized venues depending on liquidity, asset availability, transaction size, and market conditions. Crypto trading is becoming more fragmented rather than shifting toward one dominant model.
Best Rate Still Matters — But It Is Not the Only Variable
Price remains central to how users evaluate swaps. Based on the report’s latent class analysis, SwapSpace estimates that 61.86% of survey respondents valued best rate, compared with 52.51% for multichain access and 39.91% for support for rare tokens.
The differences become clearer across user segments. Among crypto-native power users, 97% valued multichain access, 91% best rate, and 87% rare-token support. Traders and business users placed the greatest emphasis on best rate at 88%, while 61% valued multichain access and 52% rare-token support. Mainstream generalists were more balanced, with 76% valuing both best rate and multichain access.

The figures suggest that price remains important, but users can evaluate a transaction through several variables at once. The quoted rate may matter alongside access to a particular network or asset.
The same ambiguity appears when respondents are asked which venue type offers the best rates in their experience. Answers were distributed across DEXs, CEXs, aggregators, and “depends on the situation,” with no single category emerging as an overwhelming choice.
SwapSpace’s provider data adds another layer of context. Among users who completed at least two exchanges, 70% selected a different liquidity provider for their next transaction, while 30% returned to the same one.
The findings suggest that “best” can be transaction-specific rather than a permanent property of one venue or provider.
Swaps are Serving More Than Trading
The survey also shows that crypto swaps take place in different contexts.
Receiving funds and personal payments were the most common reported crypto use cases among respondents, followed by short-term and long-term trading, while business payments ranked lower.
When respondents were asked which additional platform capabilities they valued, payments for goods and services ranked highest, followed by cashback and automatic swaps. Fiat withdrawal, Telegram functionality, and lending and borrowing ranked lower.
Transaction triggers were similarly varied. Sudden price movements and portfolio rebalancing were the leading triggers for swaps, while news and emergency needs also appeared and influencer signals ranked last.
These findings mean that the same exchange infrastructure can support different objectives, from responding to price movements and managing a portfolio to receiving funds or making payments.
That also means execution requirements are not necessarily identical across transactions. A trader reacting to a sudden market move may prioritize different conditions from someone exchanging assets as part of a payment.

Intent-Based Execution Moves Complexity Behind the Interface
One emerging response to this fragmented environment is intent-based execution.
Instead of choosing an exchange, blockchain, or trading route, users simply state what they want to achieve. Competing systems then find a way to complete the trade.
Platforms such as UniswapX, 1inch Fusion, and NEAR Intents already use versions of this model. As crypto liquidity spreads across more venues and networks, this approach could make trading easier by moving routing decisions into the background.
The market can stay fragmented while the user experience becomes much simpler. But that means more of the complexity has to be handled behind the scenes.
How platforms handle that complexity may differ. Intent-based execution is one approach, but not the only one. Ultimately, what matters is whether users can access the networks and liquidity they need without having to navigate the underlying complexity themselves.
The post DEX Volume Exploded Over 9,000x. Now Crypto Has a New Problem appeared first on BeInCrypto.


U.S. Treasury Secretary Scott Bessent has said digital assets, airlines and the maritime industry could face new measures as the Trump administration prepares to increase economic pressure on Iran.
Summary
- Scott Bessent said digital assets, airlines and the maritime industry could face new U.S. measures targeting Iran.
- The Treasury secretary warned governments and businesses against providing economic support to Tehran.
- More sanctions against Iranian banks could come this week, while airline leasing companies are another possible target.
- The U.S. has already frozen or seized hundreds of millions of dollars in Iran linked cryptocurrency and sanctioned exchanges and wallets tied to Tehran.
Reuters reported Wednesday that Bessent identified the three areas as possible targets while Washington considers further action against Tehran, with Iranian banks and companies involved in aircraft leasing potentially facing new restrictions as well.
The comments came as the administration seeks to cut Iran off from companies and countries that continue to provide economic support. Asked about Russia’s backing for Tehran during an interview with Fox News following this week’s G20 gathering in North Carolina, Bessent warned governments and businesses against maintaining ties with Iran.
“My message to everyone is stay away. We all want this conflict to end, and the fastest way for the conflict to end is for no one to provide any support to this regime,” Bessent told Fox & Friends.
The warning followed Russian President Vladimir Putin’s expression of support for Iran a day earlier. Bessent did not limit the administration’s message to Moscow, saying U.S. officials were speaking with parties that continued to support Tehran.
“We are having very fulsome talks with anyone supporting the regime,” he said.
Digital assets could face further Iran sanctions
Bessent did not identify particular cryptocurrencies, exchanges, wallets or other digital asset businesses that could be targeted in the next round of measures.
Washington, however, has already expanded its authority to pursue Iran-linked cryptocurrency activity. On Aug. 24, the Treasury Department launched Operation Economic Outcast, covering digital assets alongside technology, gold, aviation, shipping and other financial channels used by Iran.
Under the measures, the Office of Foreign Assets Control was given authority to sanction people operating in Iran’s digital asset sector, including actors based outside the country. Treasury said at the time that Iran had used cryptocurrency to move funds connected to the government and the Islamic Revolutionary Guard Corps.
A subsequent sanctions package targeted nearly 60 entities, individuals and vessels across Iran-linked oil, nuclear, cyber and missile networks. Treasury accused Russian national Yuri Obukhov of processing more than $100 million in cryptocurrency linked to Iranian oil sales since 2023.
The department said Obukhov worked with an IRGC-linked network that converted proceeds from oil sales into digital assets. Foreign financial institutions facilitating significant transactions for sanctioned parties could face restrictions on their access to U.S. correspondent accounts under the measures.
Crypto.news previously reported in June that Treasury had sanctioned four Iranian exchanges, including Nobitex, Wallex, Bitpin and Ramzinex, as part of an earlier enforcement campaign. Nobitex CEO Seyed Ali Khoee and chairman Amir Hossein Rad were included in the sanctions.
Treasury accused the exchanges of providing sanctioned Iranian entities with access to cryptocurrency markets. Blockchain analytics firm Chainalysis has estimated that Nobitex handles roughly half of Iran’s crypto trading activity.
U.S. has frozen Iran-linked crypto assets
Digital assets have become a recurring part of Washington’s financial actions against Tehran this year.
In July, U.S. authorities froze more than $130 million in cryptocurrency held in wallets linked to Iran’s central bank. Four Tron wallets holding roughly $131 million in USDT were frozen as part of the action.
Bessent said at the time that Treasury remained committed to disrupting Iran’s use of digital assets. The July action followed a much larger freeze in April involving wallets tied to the IRGC.
Tether froze $344 million in USDT across two Tron addresses at the direction of U.S. authorities after OFAC targeted the wallets. One held roughly $213 million in USDT, while the other contained approximately $131 million.
By late July, Bessent said the amount of cryptocurrency seized or frozen from Iranian sources since the conflict began was approaching $1 billion.
The enforcement campaign has extended beyond wallets and domestic Iranian trading platforms. Treasury has targeted intermediaries and companies that it says help Tehran move funds outside conventional banking channels.
Iran’s use of cryptocurrency has drawn particular attention from U.S. authorities because digital assets have been incorporated into several state-linked payment channels. Iranian military export arrangements have permitted settlement through digital currencies, while maritime transactions have come under scrutiny as Washington targets revenue connected to the Strait of Hormuz.
Maritime networks remain under Treasury scrutiny
In July, Treasury sanctioned two Iranian maritime firms after accusing them of supporting an IRGC-linked system used to collect revenue from vessels traveling through the Strait of Hormuz.
OFAC designated HormuzSafe Marine Services Authority and Persian Gulf Marine Insurance Company. Treasury alleged HormuzSafe accepted Bitcoin as part of a payment structure intended to bypass financial restrictions.
Eight shipping companies and eight vessels were targeted in the same action over alleged involvement in transporting Iranian petroleum.
Treasury did not publish Bitcoin wallet addresses, transaction hashes or cryptocurrency payment totals when announcing those designations.
Shipping has remained a major part of U.S. sanctions enforcement because Iranian oil exports depend on networks of vessels, insurers, intermediaries and overseas buyers. Bessent’s latest comments leave the maritime sector among the areas Washington could target again as the administration seeks to restrict Iran’s remaining international financial connections.
Airlines and Iranian banks could face new measures
Aircraft-related businesses have emerged as another possible focus of the next sanctions package.
Bessent said Tuesday that airline leasing companies could be targeted, potentially extending the administration’s actions to businesses involved in providing aircraft or related services to Iran.
More sanctions against Iranian banks could arrive this week, according to the Treasury secretary. He did not identify the financial institutions being considered or provide a timetable for the measures.
The administration’s warning now covers companies and governments dealing with Tehran as Washington seeks to deter third parties from providing economic support. Bessent’s remarks came after the G20 gathering in North Carolina and followed Putin’s public support for Iran.
While questioned specifically about Russia, Bessent framed the warning as applying to any party maintaining support for Tehran.
“My message to everyone is stay away,” he said.
Cronos validators erased 10,000 blocks to reverse the Tectonic exploit, saving $69 million in frozen assets while sparking a fierce debate about whether a blockchain that can be rewound on command deserves to call itself one.
Summary
- Cronos validators halted block production on Aug. 30, rolled back more than 10,000 blocks and restored the chain to its pre-exploit state, erasing roughly two hours of transaction history for every user on the network.
- The Tectonic attacker pumped TONIC 100x in 20 minutes using roughly $600,000, supplied 364.6 trillion inflated tokens as collateral and borrowed approximately $75 million from the lending protocol.
- Only about $6 million escaped to Ethereum before the halt; the remaining $69 million sat frozen at Cronos addresses until the rollback wiped the attack transactions from the canonical chain.
- Tectonic’s total value locked collapsed from $121.7 million to roughly $3 million, a 97.5% decline, within 48 hours of the exploit.
- RedStone’s co-founder said the oracle reported accurately and blamed Tectonic’s collateral controls, calling the attack preventable with a single parameter: a borrow cap tied to executable liquidity.
Cronos did something on Aug. 30 that most blockchains claim they cannot do and would never do. Its validators coordinated an emergency halt, agreed to discard more than 10,000 blocks of canonical history and restarted the chain from a snapshot taken before a lending protocol called Tectonic lost $75 million to a collateral manipulation attack. The stolen funds, minus roughly $6 million that had already crossed to Ethereum, simply ceased to exist on the restarted chain.
The response worked. It contained the damage. It probably saved depositors from losing everything they had in Tectonic.
And it raised a question that the industry has avoided answering since Ethereum’s DAO fork in 2016: if a small group of validators can rewrite a chain’s history to reverse theft, what exactly separates that chain from a database with extra steps? The answer matters more now than it did in 2016, because the industry has spent the intervening decade telling institutions, regulators and retail users that blockchains offer something traditional financial infrastructure does not: transactions that cannot be reversed by any single authority. Cronos proved that claim does not apply universally.
How Tectonic lost $75 million in 20 minutes
The attack followed a pattern so well-documented that DeFi security researchers have a name for it: a Mango-style pump-and-borrow.
Tectonic, the largest lending protocol on Cronos with roughly $121.7 million in total value locked and $82.7 million in active loans, allowed users to post TONIC, its governance token, as collateral. TONIC had a 20% collateral factor, meaning users could borrow assets worth up to one fifth of their posted collateral’s reported value. That parameter assumed TONIC’s reported price reflected something close to its actual liquidation value. It did not.
The attacker spent an estimated $600,000 buying TONIC across thin Cronos markets, pushing the token’s price roughly 100 times higher within about 20 minutes. The attacker then supplied 364.6 trillion TONIC to Tectonic at the inflated valuation, creating a reported collateral position worth approximately $375 million. Against that phantom collateral, the attacker borrowed roughly $75 million in liquid assets from other depositors.
The numbers tell the story cleanly. A $600,000 investment turned into a $75 million withdrawal. The return on capital was roughly 12,400%. The collateral backing the loan could not have been sold for a fraction of its reported value without crashing the price back to where it started. Tectonic’s lending markets had been drained using their own pricing assumptions.
Before the exploit, Tectonic held nearly half of all capital deposited across Cronos’s DeFi applications. Within 48 hours, its TVL collapsed from $121.7 million to roughly $3 million. The protocol that was supposed to anchor Cronos’s DeFi ecosystem had become its most expensive liability.
The halt: validators pull the emergency brake
Cronos validators detected the exploit within minutes and made a decision that no truly decentralized network could make quickly: they stopped producing blocks.
The halt froze everything. Not just Tectonic. Every transfer, every smart contract interaction, every bridge transaction across the entire Cronos network went dead. Users who had nothing to do with Tectonic could not move their funds. Bridges connecting Cronos to Ethereum and other chains stopped processing. RPC providers serving applications built on Cronos went dark.
The timing mattered enormously. By the time validators shut down block production, the attacker had managed to bridge approximately $6 million to Ethereum, where Cronos validators have no authority. The remaining $69 million sat at identified Cronos addresses, frozen but technically still in the attacker’s control on the halted chain.
Kris Marszalek, the CEO of Crypto.com, posted that the exchange and app continued operating normally and that “all funds are safe.” That statement referred specifically to assets held through Crypto.com’s centralized services, not to funds deposited in Tectonic. The distinction matters. Crypto.com and Cronos are closely associated, but Tectonic operates as a separate decentralized application. A failure in one does not necessarily compromise the other, and Marszalek’s assurance covered only the centralized side.
The rollback: erasing 10,000 blocks of everyone’s history
Instead of restarting from the halted state and hoping to freeze the attacker’s addresses through governance or technical intervention, Cronos validators chose the nuclear option. They restored the chain to a snapshot taken before the exploit, rolled back more than 10,000 blocks and resumed block production from block 90,896,189.
The attack transactions ceased to exist on the canonical chain. So did every other transaction that occurred during those erased blocks. Legitimate trades, token transfers, contract deployments, and any other activity that happened to overlap with the roughly two-hour window were gone.
Cronos described the halt as a “validator-consensus emergency action” to protect users. The chain’s postmortem, promised but not yet published, should explain the exact process validators used to agree on the restoration point. What we know is that the decision was made quickly, executed by a small validator set, and reversed the canonical history of a public blockchain.
Tatum, an infrastructure provider serving developers on Cronos, had to replay all chain data from block 90,896,188 to bring its systems back in sync. Other RPC providers, explorers, and bridges needed similar resets. The rollback did not just affect the attacker. It forced every service connected to Cronos to reconcile a new version of reality.
Why the oracle was not the problem
The instinct after a price-manipulation exploit is to blame the oracle. RedStone co-founder Marcin Kazmierczak rejected that framing in a statement to crypto.news.
“The oracle was not wrong. It accurately reported the price of TONIC on the pool it was reading from at that moment,” Kazmierczak said.
The distinction matters. An oracle that reports the current market price of a token is doing its job, even if that price has been artificially inflated. The failure sits with the protocol that accepts the reported price as safe for lending without checking whether the token could actually be sold at that valuation.
Kazmierczak identified the missing safeguard: borrow caps tied to executable liquidity. Such a cap limits borrowing based on how much of the collateral could realistically be sold without crashing its price. Even if TONIC’s reported value spiked 100x, a properly set borrow cap would have restricted borrowing to what the market could absorb.
“Reporting a price and validating that a price is safe to lend against are two different jobs, and Tectonic’s design conflated them,” he said.
He dismissed the idea that a longer time-weighted average price window would have prevented the attack. A 100-fold price increase in 20 minutes, he argued, is not a volatility event that smoothing will fix. It is a signal that the asset should never have been collateral at any meaningful size.
This attack is not new. That is the problem.
The playbook the Tectonic attacker used is nearly identical to the one Avraham Eisenberg executed against Mango Markets in October 2022, draining more than $100 million by inflating the thinly traded MNGO governance token and borrowing liquid assets against it. A Manhattan jury convicted Eisenberg of commodities fraud, commodities manipulation and wire fraud. A federal judge later vacated the convictions over venue problems and insufficient evidence on the wire fraud count.
The Eisenberg case is relevant beyond the technical parallels. His legal defense argued that the protocol’s rules allowed what he did, that the smart contracts functioned as designed and that exploiting a design flaw is not the same as committing fraud. The jury disagreed, but the vacated convictions left the legal status of this attack vector unresolved. Anyone replicating the playbook today operates in genuine legal ambiguity, which may partly explain why the attacks keep happening.
Three days before the Tectonic exploit, an attacker drained $8.7 million from Moonwell on Base using the exact same technique against the illiquid MAMO token. Moonwell responded by dropping borrow caps to 1 wei across its Base Core Markets, effectively shutting down new lending. The fix was available before the attack. The protocol chose not to implement it until the damage was done.
Moola Market on Celo lost funds through the same pattern in October 2022, the same month as Mango Markets. Four years later, the attack still works because the economic incentive to list governance tokens as collateral outweighs the perceived risk. Protocol teams benefit from higher TVL numbers. Governance token holders benefit from increased utility. The cost of weak collateral parameters stays hidden until someone tests whether the market can absorb a sudden liquidation of the posted tokens. It cannot. It never can. The liquidity that would need to exist to make these tokens safe as collateral at their listed collateral factors simply does not exist for low-cap governance tokens.
Cosmos EVM chains were told to halt after a separate security incident on Aug. 25. KiiChain reported 148.3 million KII drained through 18 attacks. MANTRA stopped its network days earlier while investigating another incident. Three chain halts in one week. The frequency alone should concern anyone who treats finality as a property their blockchain actually has.
The DAO fork comparison and why it does not quite fit
Ethereum’s 2016 DAO fork is the obvious precedent. An attacker exploited a reentrancy vulnerability to drain roughly $60 million (at the time) from The DAO, and the Ethereum community voted to hard fork, creating a new chain that reversed the theft and an original chain (Ethereum Classic) that preserved the canonical history.
The comparison is instructive but the differences matter more than the similarities.
The DAO fork took weeks of public debate. CoinDesk, Reddit, and Bitcointalk threads ran thousands of comments. Miners voted with their hashrate. The community fractured, producing Ethereum Classic as a permanent monument to the principle that code is law. The process was painful enough that Ethereum has treated immutability as near-sacred ever since. The Ronin bridge lost $625 million in 2022. The Wormhole bridge lost $320 million the same year. Nobody seriously proposed rolling back Ethereum for either.
Cronos accomplished something similar in hours with a handful of validators. No community vote. No weeks of debate. No chain split. No fork preserving the original history for those who disagreed. The validators agreed, rolled back, and moved on. The speed is the problem, because a rollback that requires broad community consensus and weeks of deliberation is a last resort, while a rollback that a small validator set can execute within hours is an administrative tool. And administrative tools get used.
The validator concentration explains the speed. Because the Cronos chain is maintained by a relatively small number of validators, many of which are controlled by or closely associated with Crypto.com, coordinating a halt and rollback requires agreement from far fewer independent parties than it would on Ethereum, Bitcoin, or any chain with a large and diverse validator or miner set. This is not a bug in the response to the Tectonic exploit. It is the structural condition that made the response possible.
As one critic framed it: if $75 million warrants a rollback, what about $50 million? $10 million? And beyond hacking attacks, what other kinds of events would be enough for validators to press the reload button? The absence of a published governance framework for when rollbacks are appropriate means the answer is whatever the validator set decides at the time. That is not decentralized governance. That is discretion, and discretion without rules is just power.
Who lost money in the erased blocks
The rollback contained the exploit. It also erased legitimate activity.
Every user who executed a transaction on Cronos during the roughly two-hour window between the exploit and the halt had their activity reversed. Trades on decentralized exchanges were undone. Token transfers between wallets were nullified. Smart contract interactions that had nothing to do with Tectonic were wiped from the canonical chain as collateral damage of the state restoration.
Cronos has not published data on how many non-exploit transactions were lost. The 10,000-plus erased blocks represent roughly two hours of network activity at Cronos’s normal throughput. For a chain that had recorded more than 100 million transactions since launch and supported over 500 developers, even two hours represents a meaningful volume of legitimate operations.
The asymmetry is striking. Tectonic depositors who lost funds to the exploit got their balances restored to pre-attack levels. But anyone who completed a legitimate trade, deposit, or withdrawal during the erased window had their transaction voided without compensation or even acknowledgment.
This creates a strange incentive. If you are robbed on Cronos, validators might rewrite history to make you whole. If your legitimate transaction happens to fall within the blast radius of someone else’s hack, you lose it. The rollback optimizes for one kind of harm and creates another.
No validator set has explained how they weigh these competing interests. The Cronos postmortem should address it. Whether it will is another question.
What the rollback means for builders on Cronos
Developers building applications on Cronos now face a design constraint that did not exist before Aug. 30: any state their application creates can be retroactively erased by validator consensus.
For a simple token swap, the consequences are annoying but manageable. The user can resubmit. For applications that interact with external systems, the implications are more serious. A payment processor that confirms a Cronos transaction and ships a product has no recourse if the transaction later gets rolled back. An oracle that pushes data to Cronos and triggers actions on other chains based on confirmation cannot un-trigger those actions.
The problem compounds for protocols that span multiple chains. If a user deposits on Cronos and that deposit triggers a mint on another chain, a Cronos rollback removes the deposit but not the mint. The cross-chain state becomes inconsistent, and reconciliation falls on the protocol team, not the validators who ordered the rollback.
Tatum’s response illustrates the infrastructure cost. The company had to replay all chain data from the restored block to bring its APIs back in sync. Every indexer, subgraph, and data service that tracks Cronos faced the same resync burden. For infrastructure providers operating across dozens of chains, supporting a chain that might roll back at any time adds operational cost that chains with credible finality do not impose.
The Trump Media and Crypto.com CRO treasury venture, which was terminated on Aug. 7, had proposed using Cronos for tokenized assets. Had that deal survived to the Tectonic exploit, the rollback would have erased tokenized equity positions. That scenario alone should give any real-world asset tokenization project pause before choosing a chain where validators can rewrite history.
The $6 million that proves the limit
The $6 million the attacker bridged to Ethereum before the halt survived the rollback. It sits on a chain that Cronos validators cannot touch.
This is the physical constraint that every rollback faces. A blockchain’s authority ends at its own boundaries. Once value crosses to another chain, the receiving chain’s consensus rules apply. Ethereum’s validators did not agree to Cronos’s rollback and have no obligation to honor it. The attacker’s Ethereum balances are final in a way their Cronos balances turned out not to be.
The gap matters for anyone building cross-chain applications on Cronos or similar networks. If a chain can be rolled back, any value that has not left the chain before the halt is at risk of being erased. Bridges become the escape hatch, and speed of bridging becomes a security property that protocol designers did not plan for.
The attacker knew this. The first thing the stolen funds did was move toward Ethereum. The roughly two-hour window between the exploit and the halt was a race between the attacker’s bridging speed and the validators’ coordination speed. The validators won most of it. But $6 million is not nothing.
What to watch
- Cronos postmortem publication. The validator set promised a full accounting of the exploit, the halt decision, the rollback process and the restart. Until that document appears, the community cannot evaluate whether adequate safeguards existed or whether the rollback followed any defined governance process.
- Tectonic’s TVL and depositor treatment. TVL collapsed from $121.7 million to $3 million. Whether depositors receive compensation, a recovery plan, or nothing will signal how Cronos handles protocol failures within its ecosystem.
- CRO price behavior after the rollback. A validator set that can rewrite history should trade at a governance discount relative to chains where that is not possible. Whether CRO reflects that discount will show how the market prices immutability risk.
- Other chains adopting the rollback playbook. MANTRA, Ontology and the Cosmos EVM chains all halted recently. If any of them use Cronos as a precedent for state rollbacks, the practice could normalize across smaller chains.
- Borrow cap adoption across DeFi lending protocols. RedStone’s Kazmierczak identified the fix. Whether protocols implement it, or continue listing low-liquidity governance tokens without borrow caps, will determine how often this exact attack recurs.
What happened to Cronos on Aug. 30?
Cronos validators halted block production after an attacker exploited Tectonic, the chain’s largest lending protocol, for approximately $75 million. Validators then rolled back more than 10,000 blocks, restoring the chain to its state before the exploit and erasing the attack transactions from the canonical chain history.
How did the Tectonic attacker steal $75 million?
The attacker spent roughly $600,000 to pump TONIC, Tectonic’s governance token, approximately 100x in 20 minutes. The attacker then supplied 364.6 trillion inflated TONIC as collateral and borrowed $75 million in liquid assets from other depositors. The attack exploited Tectonic’s 20% collateral factor on a token with almost no real liquidity.
Did the Cronos rollback recover all stolen funds?
No. Approximately $6 million had already been bridged to Ethereum before validators halted block production. Those funds exist on Ethereum, where Cronos validators have no authority. The remaining $69 million was effectively erased when validators restored the chain to its pre-exploit state.
Is Cronos the first blockchain to roll back after a hack?
No. Ethereum’s 2016 DAO fork is the most prominent precedent, reversing roughly $60 million in stolen funds. The key difference is that Ethereum’s fork took weeks of debate and a community vote, while Cronos accomplished its rollback in hours with a small validator set and no public vote.
What is a Mango-style pump-and-borrow attack?
Named after the 2022 Mango Markets exploit, this attack inflates a thinly traded governance token, supplies it as collateral on a lending protocol and borrows liquid assets against the inflated valuation. The borrowed assets are real and liquid; the collateral is not. Tectonic and Moonwell were both hit by this pattern within three days of each other in August 2026.
Could the Tectonic exploit have been prevented?
RedStone co-founder Marcin Kazmierczak said yes. A borrow cap tied to executable liquidity would have limited how much could be borrowed against TONIC regardless of its reported price. The oracle reported the correct market price. The protocol’s failure was accepting that price as safe for lending without checking whether the token could be sold at that valuation.
What does the Cronos rollback mean for other blockchains?
Three separate blockchains halted within one week in late August 2026: Cronos, the Cosmos EVM chains and MANTRA. If Cronos’s rollback is treated as a successful response, smaller chains with concentrated validator sets may adopt the same approach, potentially normalizing state reversals as a security tool.
Should I keep funds on Cronos?
This is educational analysis, not investment advice. The rollback showed that Cronos validators can and will alter the chain’s history to contain damage. Whether that makes the network safer or less trustworthy depends on whether you value the ability to reverse theft more than you value transaction finality. Assets bridged to other chains before a halt are not subject to Cronos rollbacks.
Disclaimer: This article is for informational purposes only and does not constitute investment or financial advice. All figures cited were accurate as of Sept. 2, 2026. The information presented here reflects publicly available data and attributed statements. Readers should conduct their own research before making any financial decisions.
CME FedWatch odds for a September rate hike have surged past 66% after Fed Chair Kevin Warsh’s hawkish Jackson Hole speech and oil prices driven above $90 by the Iran conflict. Bitcoin is holding $78,000 after a 25% August rally, but the structural question remains unanswered: does ETF demand change what a rate hike does to crypto, or does it just delay the pain?
Summary
- CME FedWatch pricing shows a 66% probability of a 25 basis point rate hike at the September 15-16 FOMC meeting, up from 35% before Fed Chair Kevin Warsh’s Jackson Hole address.
- Barclays now forecasts two rate hikes in 2026, in September and December, reversing its earlier hold call and raising the terminal rate outlook.
- Bitcoin gained 25% in August, its best month since November 2024, while spot Bitcoin ETFs pulled in $3.52 billion in net inflows across 16 of 21 trading days.
- The federal funds rate sits at 3.50% to 3.75% after three cuts in 2025; a September hike would be the first increase since July 2023, ending the longest pause since before the pandemic tightening.
- Brent crude surged above $91 per barrel after renewed U.S.-Iran strikes near the Strait of Hormuz, with the PCE inflation index running at 3.7% over 12 months and 4.1% over six, well above the 2% target.
Bitcoin just had its best August since 2017. It gained 25%, spot ETFs attracted $3.52 billion, and the price reclaimed $78,000 from a May low near $63,000. By any normal measure, the trend is up.
The problem is that normal stopped applying when the Fed’s new chair told Jackson Hole that inflation was “concerning” and the market immediately repriced September from a hold to a probable hike. Oil is above $90 because Iran is not a hypothetical risk anymore. Inflation is running at nearly double the target. And the instrument the Fed uses to fight inflation, higher interest rates, has historically been the single most reliable killer of crypto rallies.
The last time the Fed hiked aggressively, Bitcoin fell 77%. This time is supposed to be different because ETFs exist. Whether that is true depends on what exactly is buying bitcoin and whether it will keep buying when yields rise.
What the Fed is looking at
The numbers that will sit in front of the FOMC on September 15 are not ambiguous.
The Personal Consumption Expenditures price index, the Fed’s preferred inflation gauge, is running at 3.7% over 12 months and 4.1% over six months. Both are roughly double the 2% target. Core PCE, which strips out food and energy, is more contained but still elevated. The direction is wrong.
Energy is the proximate cause. Brent crude hit $91.25 per barrel on Sept. 1 after renewed fighting between the U.S. and Iran near the Strait of Hormuz revived fears about shipping through the world’s most important oil chokepoint. WTI reached $86.36. Gasoline prices have followed. Inflation hit 4.2% in May, a three-year high driven by a 23.5% surge in energy costs.
The July jobs report briefly pushed hike odds down to about 30% after a significant miss in non-farm payrolls. But Warsh’s Jackson Hole speech on Aug. 28 overrode that signal. He called the inflation picture “concerning,” cited the PCE readings explicitly, and made clear that the Fed was prepared to act. Markets repriced within hours.
Fed Governor Michael Barr then reinforced the message, saying he backed a “decisive” increase if inflation failed to ease. Polymarket traders pushed hike probability to 72% after his statement. The CME’s FedWatch tool, which reflects actual fed funds futures positioning, settled at 66%.
The market is not guessing. It is pricing the hike as a base case.
BNP Paribas went further, revising its forecast to project three rate hikes starting in December 2026 that would effectively reverse the three cuts delivered during 2025. If that path materializes, the federal funds rate would return to 4.25% to 4.50% by mid-2027, the same level that produced the deepest bitcoin drawdown in the asset’s history.
Even one hike changes the narrative. The market spent most of 2025 and early 2026 expecting rate cuts. The shift from “when does the Fed cut” to “how many times does the Fed hike” is a regime change in expectations, and regime changes produce larger price moves than individual rate decisions.
The transmission: rates up, risk assets down
The mechanics of how a rate hike reaches crypto are straightforward, even if the market sometimes pretends otherwise.
When the Fed raises the federal funds rate, the risk-free return on Treasury bills and money market funds increases. Every asset in the economy is priced relative to that benchmark. A higher risk-free rate means that risky assets need to offer a higher expected return to justify their volatility, or their prices fall until the implied return rises to meet the new bar.
In 2022, the Fed raised rates from 0.25% to 4.50%, the fastest tightening cycle in four decades. Bitcoin fell 77%, from roughly $48,000 in March to $15,500 by November. The S&P 500 fell 25%. The Nasdaq fell 33%. Bitcoin was not a hedge against inflation. It was not a hedge against anything. It was the most rate-sensitive large-cap asset in the market.
The correlation between Bitcoin and the Nasdaq reached historic highs during that cycle, demolishing the “uncorrelated asset” thesis that had been a pillar of institutional bitcoin allocation models. Bitcoin tracked risk appetite, and rate hikes destroyed risk appetite.
A single 25 basis point hike from 3.50% to 3.75% is not the same as 425 basis points in nine months. The magnitude matters. But the direction is what markets price first, and the direction here is unmistakable: the cost of capital is going up, not down. Every asset on the planet gets repriced when that direction reverses, and bitcoin’s history shows it reprices harder than most.
Why this time is supposed to be different
The bull case for bitcoin surviving a rate hike rests on one structural change: spot ETFs.
U.S. spot Bitcoin ETFs launched in January 2024 and have since accumulated over $99 billion in net assets. In August 2026 alone, they pulled in $3.52 billion, their strongest month of the year. The funds recorded net inflows on 16 of 21 trading days, including nine consecutive positive sessions from Aug. 17 through 27. The number of large-scale asset managers holding Bitcoin ETF positions has increased by 150% over the past year.
The argument is that ETF flows represent a new kind of buyer: institutional allocators running model portfolios where bitcoin has a 1% to 5% weighting. These buyers do not trade on macro fear. They rebalance on a schedule. When bitcoin falls, their allocation drops below target and they buy automatically. When bitcoin rises, they trim. The buying is mechanical, and it creates a structural bid that did not exist during the 2022 wipeout.
August’s data supports this reading. Bitcoin rallied 25% while oil surged, Iran tensions escalated, and hike odds doubled. The old playbook said bitcoin should have sold off. Instead, ETF inflows accelerated. Institutional demand appeared to absorb the selling pressure that geopolitics and macro fear would normally create. The counterargument is simpler: the hike has not happened yet.
The case that ETF demand breaks under a hike
ETF inflows are not unconditional. They respond to the same forces as every other investment flow, just with a lag.
In the first half of 2026, bitcoin ETFs experienced cumulative net outflows of $5.29 billion as the price fell from $94,000 in January to $63,000 in May. The institutional bid did not prevent the drawdown. It participated in it. Citadel Securities warned that the Fed could resume hikes as early as September, adding direct pressure on risk assets including bitcoin.
If the Fed hikes on September 16, the immediate effect is a stronger dollar, higher Treasury yields, and a repricing of risk premiums across every asset class. Model portfolios that include bitcoin as a risk asset would see their expected return threshold rise. Some allocators would reduce exposure. Others would pause new inflows until the rate trajectory becomes clearer.
The August rally makes the math worse, not better. Bitcoin at $78,000 after a 25% run offers less upside than bitcoin at $63,000. A rate hike at the top of a momentum-driven rally is the setup that produces the sharpest corrections, because leveraged longs and momentum traders exit simultaneously.
The $3.52 billion in August ETF inflows is impressive. It is also less than 4% of the $99 billion in total net assets. A reversal of sentiment could produce outflows that exceed a single month’s inflows, as happened in February and March 2026 when $2.1 billion left in consecutive weeks.
The composition of ETF buyers matters too. A significant portion of ETF inflows comes from hedge funds running basis trades: buying spot bitcoin through the ETF while shorting CME futures to capture the premium. These positions are rate-sensitive. When Treasury yields rise, the opportunity cost of tying up capital in a basis trade increases. The premium narrows. The trade becomes less attractive, and the positions unwind. This is not panic selling. It is rational reallocation, and it shows up in ETF outflow data without any change in directional conviction about bitcoin’s price.
The 150% increase in large-scale asset managers holding bitcoin ETF positions sounds like unstoppable institutional adoption. But position size matters more than position count. A pension fund with 0.5% allocated to bitcoin will not increase that allocation because bitcoin had a good August. It will rebalance mechanically, and if bitcoin rises enough, it will sell to stay at target weight. The same structural force that creates the floor also creates a ceiling.
The “digital gold” thesis gets another test
Every cycle produces the same claim: bitcoin is digital gold, a hedge against inflation and monetary debasement. Every rate hike cycle tests the claim. It has failed every time so far.
In 2022, inflation ran above 8% and bitcoin fell 77%. Gold fell 3% over the same period. The correlation between bitcoin and gold was negative for most of the tightening cycle. Bitcoin behaved like a tech stock, not a commodity.
In 2026, the test is different because inflation is being driven partly by a shooting war. Oil prices are not rising because of demand. They are rising because supply routes through the Strait of Hormuz are under military threat. Gold has outperformed bitcoin and equities since the conflict began. If bitcoin were truly digital gold, it would be rallying alongside physical gold during a supply-side energy crisis.
It is not. Bitcoin is up 25% in August, but gold is also up 9%, and gold did not fall 40% from its peak first. The risk-adjusted comparison does not favor bitcoin’s store-of-value narrative when the volatility is this much higher.
The honest assessment: bitcoin is a risk asset with an inflation narrative attached to it. When liquidity is abundant and rates are falling, the narrative is easy to sell. When rates rise and liquidity tightens, bitcoin trades like what it functionally is: leveraged exposure to global risk appetite.
What a hike does to altcoins and DeFi
If bitcoin is leveraged exposure to risk appetite, altcoins are leveraged exposure to bitcoin. The amplification runs in both directions.
During the 2022 tightening cycle, Ethereum fell 82%, Solana fell 96%, and the total altcoin market capitalization excluding bitcoin fell roughly 80%. The selloffs were sharper, faster, and more complete than bitcoin’s own 77% decline. Altcoins do not have ETF structural bids. Most do not have model portfolio allocations. They trade on speculation, narrative, and momentum, all of which evaporate when rates rise.
A September hike would hit altcoins harder for a specific reason beyond general risk aversion: many altcoin projects depend on venture capital funding that is priced against the risk-free rate. When Treasury yields rise, the hurdle rate for venture investments rises with them. Capital that might flow into a Series A for a DeFi protocol flows into T-bills instead. The funding pipeline dries up, development slows, and tokens that derive value from ecosystem growth lose the growth.
Ethereum is a partial exception because of its own spot ETF flows. U.S. spot Ethereum ETFs pulled in $697 million in the last week of August, with BlackRock’s ETHA taking 72% of the total. That creates a similar structural bid to bitcoin, though at a much smaller scale. Total Ethereum ETF assets remain a fraction of bitcoin ETF assets, and the institutional allocation to ETH is narrower.
DeFi lending rates would also respond to a hike. On-chain borrowing costs track off-chain rates loosely but persistently. When the risk-free rate rises, DeFi yields need to rise to remain competitive, which means either higher borrowing costs or narrower spreads for liquidity providers. Both outcomes reduce DeFi activity. TVL across major protocols fell roughly 60% during the 2022 cycle and has not fully recovered. Aave’s variable borrow rates already sit above 5% for stablecoins. Another 25 basis points on the federal funds rate would push those rates higher and shrink the pool of borrowers willing to pay them.
The September token unlock calendar adds another layer of pressure. ENA, EIGEN, GUN, and GPS all unlock this week, adding supply to tokens that would face weakened demand in a post-hike environment. SUI is consolidating around $0.70 with its own unlock approaching. Scheduled supply increases during a tightening cycle are the worst-case timing for token holders.
Warsh is not Powell, and that matters
Kevin Warsh replaced Jerome Powell as Fed Chair in February 2026 after being nominated by President Trump in late 2025. The change matters for how markets should interpret the September decision.
Powell was cautious by nature. He telegraphed moves months in advance, agonized publicly over the dual mandate, and showed visible discomfort with surprising markets. His rate hike cycles were preceded by extensive forward guidance.
Warsh is different. His Jackson Hole speech was direct. He cited specific inflation readings, called them “concerning,” and did not offer the customary caveats about waiting for more data. The market repriced September within hours because Warsh meant what he said and everyone knew it.
Warsh’s willingness to move without extended telegraphing means that the September decision could go either way until the last minute. Under Powell, a 66% probability of a hike two weeks before the meeting would have been near certainty. Under Warsh, there is less forward guidance to decode, and the CPI and claims data on September 10-11 could genuinely swing the decision.
For crypto traders, this uncertainty is worse than certainty in either direction. A confirmed hike can be priced. A confirmed hold can be priced. A coin flip two weeks out produces positioning churn, leverage liquidations on both sides, and the kind of choppy price action that rewards nobody.
The FOMC’s updated dot plot, which shows individual member projections for the rate path, will matter as much as the decision itself. If the median dot shifts upward to show two or more hikes expected through mid-2027, the market will price a tightening cycle even if September’s decision is a hold. The dots killed rallies in 2022 and they could do it again.
The two-week window
The FOMC meets on September 15-16. That gives markets exactly two weeks to position.
Two data points will matter more than anything else before the meeting. The August Consumer Price Index, due September 10, will show whether energy-driven inflation has accelerated further. And weekly jobless claims on September 11 will indicate whether the labor market is cooling enough to give the Fed an excuse to wait.
If CPI comes in hot and claims stay low, the hike is nearly certain. If CPI surprises to the downside, the 66% probability could drop back toward a coin flip, and bitcoin would likely rally on the relief.
Key price levels for bitcoin heading into the meeting sit at $75,000 on the downside, where buyers stepped in during July, and $82,000 to $86,000 on the upside, a resistance zone that has rejected rallies twice this year. A confirmed break above $86,000 on a dovish CPI surprise would open the path to $94,000. A post-hike selloff that breaks $75,000 would target the May low near $63,000.
The leverage picture adds risk in both directions. Open interest in bitcoin perpetual futures has climbed throughout August alongside the price rally. Funding rates are positive, meaning longs are paying shorts, which indicates bullish positioning. A rate hike that triggers even a modest correction could cascade through leveraged longs, producing the kind of wick that takes prices well below fair value before recovering. The February 28 Iran airstrikes produced exactly this pattern: bitcoin dropped to $63,000, triggering over $300 million in liquidations, then recovered within days.
The honest answer to whether ETF demand changes the playbook is: partially, but not enough to eliminate drawdown risk. ETFs create a floor. They do not eliminate gravity. And the Fed controls gravity.
What to watch
- August CPI release on September 10. This is the last major inflation reading before the FOMC decision. A print above 4.5% would remove nearly all doubt about a September hike. Below 4% would reopen the debate.
- Weekly jobless claims on September 11. Rising claims would give the Fed cover to hold. Flat or declining claims would support the case for tightening.
- Bitcoin ETF flow data for the first two weeks of September. If inflows continue at August’s pace despite rising hike odds, the structural demand thesis is real. If flows reverse, the August rally was momentum-driven and vulnerable.
- Oil prices and Strait of Hormuz developments. Energy costs are the primary inflation driver. Any de-escalation between the U.S. and Iran would lower oil prices and reduce the urgency of a rate hike. Escalation does the opposite.
- Bitcoin’s reaction to the $82,000-$86,000 resistance zone. Two rejections at this level in 2026 suggest meaningful selling pressure. A third rejection before the FOMC meeting would confirm a range-bound market heading into the decision.
When is the next FOMC meeting?
The Federal Open Market Committee meets on September 15-16, 2026. The rate decision and updated economic projections will be released on Sept. 16 at 2:00 p.m. Eastern, followed by Fed Chair Kevin Warsh’s press conference.
What is the current federal funds rate?
The federal funds rate is 3.50% to 3.75% as of June 17, 2026. The Fed delivered three 25 basis point cuts during 2025, bringing rates down from 4.25% to 4.50%. A September 2026 hike would be the first increase since July 2023.
How likely is a September rate hike?
The CME FedWatch tool shows a 66% probability of a 25 basis point increase. Kalshi prices the hike at 59%. Polymarket traders have pushed odds as high as 72% after Fed Governor Barr backed a “decisive” response to inflation. Barclays now forecasts hikes in both September and December.
How did bitcoin perform during the last rate hike cycle?
Bitcoin fell 77% between March and November 2022 as the Fed raised rates from 0.25% to 4.50%. The correlation between bitcoin and the Nasdaq reached record highs during that period, undermining the thesis that bitcoin acts as an uncorrelated portfolio diversifier.
Do bitcoin ETFs protect against rate hike selloffs?
Not entirely. In the first half of 2026, bitcoin ETFs experienced $5.29 billion in cumulative net outflows as bitcoin fell from $94,000 to $63,000. ETFs create a structural bid through model portfolio rebalancing, but they do not prevent drawdowns when the broader risk environment deteriorates.
Why is oil relevant to the Fed’s rate decision?
Oil prices have surged above $90 per barrel due to the ongoing U.S.-Iran conflict near the Strait of Hormuz. Higher energy costs feed directly into inflation readings, particularly the PCE index that the Fed targets. The PCE is running at 3.7% over 12 months, nearly double the 2% target, driven primarily by energy.
What bitcoin price levels matter heading into the FOMC?
Support sits at $75,000, where buyers defended the price in July. Resistance runs from $82,000 to $86,000, a zone that has rejected rallies twice this year. A break below $75,000 on a post-hike selloff would target the May low near $63,000.
Will a rate hike crash bitcoin?
This is educational analysis, not investment advice. A single 25 basis point hike is unlikely to produce a 2022-style crash, but it could trigger a 10% to 15% correction from current levels if combined with hot CPI data and ETF outflows. The structural change from ETFs provides a partial floor, but history shows that floor is permeable during sustained tightening.
Disclaimer: This article is for informational purposes only and does not constitute investment or financial advice. All figures cited were accurate as of Sept. 2, 2026. The information presented here reflects publicly available data and attributed statements. Readers should conduct their own research before making any financial decisions.


A two-month-old Layer 2 built by a stock brokerage is now processing more daily decentralized exchange volume than chains that have existed for years, and the market is only beginning to pay attention.
Summary
- Robinhood Chain recorded roughly $945 million in daily decentralized exchange volume on Aug. 25, 2026, a new all-time high for the network and nearly double its previous record of $563 million set on July 8.
- The chain, which launched its public mainnet on July 1, has processed more than $47 billion in cumulative DEX volume in under two months, placing it fifth among all chains by 30-day volume at $15 billion.
- Uniswap serves as the dominant trading venue on the chain, and cumulative tokenized stock volume through Uniswap surpassed $1 billion by Aug. 21.
- Total value locked on Robinhood Chain surged from $4 million in June to roughly $1.4 billion by late August, a trajectory that no Ethereum Layer 2 has matched at this stage of its lifecycle.
- The 90-day gas subsidy that covers transaction fees through the end of September 2026 raises a central question: whether volume holds once users start paying for their own trades.
Robinhood Chain processed roughly $945 million in decentralized exchange volume on Aug. 25, 2026. On the same day, the network handled 5.5 million transactions, tokenized stock volume hit a record $85 million, and a leveraged perpetual token product called pTokens went live on Arcus, the dYdX-built DEX backed by Robinhood Crypto. By any standard metric for a new blockchain, the day was historic.
Crypto Twitter, for its part, was busy arguing about memecoins and parsing Federal Reserve minutes. The chain that a publicly traded brokerage had quietly built into one of the most active networks in all of decentralized finance received roughly the same attention as a midcap altcoin listing on a second-tier exchange.
That disconnect between activity and attention says something about how the market prices narratives over infrastructure. Robinhood Chain is not a new token to trade. It does not have a native coin to speculate on. It is not the product of a pseudonymous team or a viral whitepaper. It is a piece of financial plumbing, built by a company that most of crypto still views with suspicion from the GameStop saga, and it is processing more daily volume than networks that raised hundreds of millions of dollars in venture capital.
The question is no longer whether Robinhood Chain can generate activity. It already has. The question is whether the activity is real, whether it lasts, and whether it changes anything about how traditional finance and decentralized finance relate to each other.
How Robinhood built a top-five chain in 56 days
Robinhood Chain is an Ethereum Layer 2 built on Arbitrum Orbit, the chains-as-a-service framework that runs on the Nitro stack. It settles directly to Ethereum and uses Ethereum blobs for data availability. Block times run at 100 milliseconds, faster than Arbitrum One at 250 milliseconds and Monad at 300 milliseconds. The gas token is ETH.
The mainnet went live on July 1 at Robinhood’s “The World is Flat” keynote at the Old Royal Naval College in London. Within eight days, Uniswap swap volume on the chain had reached $500 million. By July 11, the chain was processing 7.6 million daily transactions and had recorded $3.1 billion in DEX volume in its first week alone.
By the end of July, Robinhood Chain had topped Ethereum in 24-hour application revenue. It had briefly surpassed Base in daily active users, logging 324,000 wallets against Base’s 275,000 on July 21. And it had placed itself in the top five chains globally by 30-day DEX volume, sitting behind Solana, BNB Chain, Ethereum, and Base with roughly $15 billion in monthly throughput.
For context, Arbitrum One’s 30-day DEX volume during the same period was roughly one-quarter of that figure. Robinhood Chain, using the same underlying technology, was running four times the volume of the chain it forked from.
The volume breakdown: what is actually trading
The Aug. 25 record was not driven by a single asset class. Three distinct categories of activity converged on the same day.
The first was memecoin speculation. Pons, a token launched through the chain’s launchpad ecosystem, accounted for roughly half of all DEX volume at its peak. CASHCAT, Robinhood Chain’s first breakout memecoin, had previously hit a $156 million market cap before Pons overtook it in late July. On Aug. 30, Pons alone contributed $445 million of the chain’s $874.8 million in volume that day, demonstrating the degree to which a single venue can dominate chain-level metrics.
The second was tokenized equities. Robinhood launched Stock Tokens as a flagship product at mainnet, offering ERC-20 representations of stocks like NVIDIA, Apple, GameStop, and SpaceX that trade around the clock in more than 120 countries. These tokens give holders economic exposure to the underlying stock rather than legal ownership of shares. By Aug. 21, cumulative tokenized stock volume through Uniswap had surpassed $1 billion. A tokenized Nasdaq-100 tracker called QQQB drove 288 percent of July’s tokenized equity volume, suggesting heavy concentration in index products.
The third was leveraged derivatives. Arcus launched pTokens on Aug. 25, wrapping leveraged perpetual accounts into transferable ERC-20 tokens including pBTC3x and pHOOD3x. The platform also began accepting tokenized stock collateral at a 50 percent loan-to-value ratio, creating a direct bridge between equity exposure and leveraged crypto trading that has no equivalent on any other chain.
The timing of the Aug. 25 spike also mattered. Bitcoin had rallied sharply since Aug. 17 on what Bloomberg called a record $2.7 billion wave of short liquidations, the largest since records began in 2021. A White House crypto meeting and a U.S. Treasury move to double long-dated bond buybacks added fuel. Bitcoin reached near $81,500 and Ether gained nearly 29 percent in a single week. That macro tailwind lifted activity across every chain, but Robinhood Chain captured a disproportionate share because its zero-fee environment made it the path of least resistance for traders looking to rotate quickly between assets.
The stablecoin layer underneath the trading activity tells its own story. Stablecoin market capitalization on Robinhood Chain reached $640 million by late August, with USDe from Ethena accounting for the bulk of inflows. Robinhood Earn, a decentralized lending product launched alongside the mainnet, offers an estimated 7 percent yield on USDG, the stablecoin developed in partnership with Paxos. The yield product serves as an anchor for capital that might otherwise leave the chain between trading sessions, giving the ecosystem a retention mechanism that pure trading chains typically lack.
The infrastructure advantage Robinhood brought to the table
Most Layer 2 networks launch with a technical thesis and then spend months or years trying to attract users. Robinhood reversed the sequence. The company brought 27 million funded brokerage accounts, an existing mobile wallet, a compliance infrastructure built over a decade of regulatory engagement, and a brand that, whatever crypto natives think of it, is synonymous with retail trading for an entire generation of investors.
CEO Vlad Tenev framed the ambition in a recent interview: “Crypto is becoming the infrastructure that powers financial markets.” On Aug. 7, he described Robinhood Chain as the fastest-growing chain in history, noting that it reached 100 million cumulative transactions faster than any other network. Bitmine Chairman Tom Lee separately called the launch “one of the biggest crypto success stories” of 2026.
The revenue model also differs from most Layer 2 networks. Under the Arbitrum Expansion Program, 8 percent of chain revenue goes to a treasury controlled by governance token holders and 2 percent funds a developer guild. Robinhood keeps the rest. In July alone, the chain generated roughly $3.6 million in transaction fees, making it the top revenue-producing Layer 2 across the entire Ethereum ecosystem at 38 percent of the estimated $6.3 million in total L2 fees collected that month.
The company’s Q2 2026 earnings, reported on July 29, showed total revenue of $1.31 billion, beating Wall Street estimates. Net income rose 48 percent year over year to $573 million. Robinhood is not a startup hoping its chain will subsidize losses. It is a profitable company with a stock trading above $100 that can afford to invest in chain infrastructure without needing the chain itself to be immediately profitable.
The gas subsidy question
The single most important variable in Robinhood Chain’s near-term trajectory is the 90-day gas fee subsidy that covers all transaction costs through the Robinhood Wallet. The promotional period, which began at mainnet launch on July 1, runs through approximately Sept. 29, 2026.
In mid-August, Robinhood reduced the subsidy threshold from $5 per transaction to $0.50, a 90 percent cut that suggests the company is already tapering the benefit rather than cutting it off all at once. The move signals a gradual transition rather than a cliff.
But the subsidy has clearly inflated activity metrics. When transactions cost nothing, the friction that normally separates casual browsing from actual trading disappears. The 16,000 new tokens created daily at peak memecoin activity in July were possible in part because launching a token was free. The 5.5 million daily transactions on Aug. 25 included activity that would not have occurred at even minimal gas costs.
The precedent from other chains is mixed. Base launched with heavily subsidized gas and retained strong activity after costs normalized, in part because Coinbase’s distribution kept funneling users to the network. Blast, by contrast, saw activity crater after its incentive programs wound down. The question for Robinhood Chain is whether the brokerage’s 27 million accounts provide a durable demand floor that subsidies merely accelerated, or whether the subsidy itself created demand that will not survive its removal.
There is a middle scenario that the binary framing obscures. Volume could fall significantly from the Aug. 25 peak and still leave Robinhood Chain as a top-ten chain by DEX activity. A 60 percent drop from $945 million would still produce roughly $380 million in daily volume, which would place it ahead of most Layer 2 networks even without subsidies. The relevant question is not whether volume declines after the subsidy ends, because it almost certainly will, but whether the floor is high enough to sustain the ecosystem’s economic model.
The corporate chain land grab
Robinhood Chain did not launch into a vacuum. It entered a market where every major financial technology company appears to be building its own chain. Coinbase has Base. Stripe acquired Bridge and is building payment infrastructure on it. Circle launched a new standard for stablecoin interoperability. Robinhood followed with its own Arbitrum-based rollup.
The pattern is clear: consumer fintech companies have concluded that owning the execution layer is more valuable than renting space on someone else’s chain. The economics are straightforward. A chain operator captures sequencer revenue, controls the fee schedule, and can subsidize specific types of activity to drive adoption. A tenant on another chain pays whatever fees the market demands and has no control over the user experience at the infrastructure level.
The comparison to Base is instructive. Base launched in August 2023 and has had three years to build its ecosystem. Its total value locked stands at roughly $5.47 billion as of late August 2026, compared to Robinhood Chain’s roughly $1.4 billion. Base processes more daily transactions on average. But Robinhood Chain closed the gap on several metrics in weeks rather than years, briefly surpassing Base in daily active users and consistently ranking within striking distance on DEX volume.
The difference is maturity versus momentum. Base has accumulated three years of liquidity, developer tooling, and protocol deployments. Robinhood Chain has a brokerage with 27 million accounts and a product, tokenized equities, that no other chain offers at the same scale.
The DEX-to-CEX ratio and what it means
Robinhood Chain’s volume spike arrived during a broader structural shift in crypto trading. In July 2026, decentralized exchanges handled spot volume equal to 24.14 percent of centralized exchange volume, the highest ratio since The Block began tracking the metric in 2019. The ratio has roughly tripled in under three years, rising from below 10 percent for most of 2024 to its current level.
The irony is that the shift is being driven in part by centralized companies. Robinhood, a centralized brokerage, is routing volume through a decentralized exchange layer. Coinbase, a centralized exchange, is doing the same through Base. The line between centralized and decentralized finance is blurring in ways that do not fit neatly into the narratives that either side prefers.
For Robinhood specifically, the chain creates a flywheel that its centralized app cannot replicate. Stock Tokens traded on Uniswap generate fees that flow back to the Robinhood Chain ecosystem. Users who start with tokenized equities discover memecoin trading, lending protocols, and leveraged products. The chain becomes a surface area for financial experimentation that a regulated brokerage app cannot legally offer through its primary interface.
This is the strategic logic that the market has largely missed. Robinhood Chain is not a marketing exercise. It is a mechanism for Robinhood to offer products and services that its regulated brokerage cannot provide directly, while still capturing economic value from the activity.
The concentration risk
The bull case for Robinhood Chain is compelling, but the data also reveals structural vulnerabilities that the headline volume numbers obscure.
On Aug. 30, a single protocol, Pons, generated 51 percent of the chain’s $874.8 million in daily volume. When one venue does half of all throughput, the chain’s activity metrics become a proxy for that venue’s performance rather than a measure of ecosystem health. If Pons loses momentum, the chain’s volume numbers could drop by half overnight without any change to the underlying infrastructure.
The tokenized equity market, while growing, remains concentrated as well. QQQB, a single Nasdaq-100 tracker, drove the majority of July’s tokenized stock volume. A dozen stocks clear at least $500,000 in daily volume, but the breadth of adoption is still narrow relative to the potential market.
Total value locked tells a similar story. Robinhood Chain’s TVL has surged to $1.4 billion, but this remains roughly one-quarter of Base’s $5.47 billion. The chain’s TVL-to-volume ratio is unusually high, meaning it generates more trading activity per dollar locked than most chains. That can be read as capital efficiency or as evidence that volume is being amplified by zero-cost transactions and speculative turnover rather than deep, sticky liquidity.
Stock Tokens also remain unavailable to U.S. residents, which excludes the majority of Robinhood’s 27 million funded accounts from the chain’s flagship product. The addressable market for tokenized equities is currently limited to users outside the United States, a significant constraint on growth.
The reflexive fee structure on Pons adds another layer of fragility. Eighty percent of the protocol’s fees fund automated token buybacks and burns. By Aug. 29, 29 percent of the original one billion token supply had been retired. That mechanism creates a self-reinforcing loop in rising markets: higher volume generates more fees, which fund more burns, which reduce supply, which pushes prices higher, which attracts more volume. In falling markets, the same loop works in reverse. Volume drops, burns slow, the supply compression narrative weakens, and traders move to the next opportunity. Chains built on reflexive tokenomics tend to experience sharp drawdowns when sentiment shifts.
What Robinhood Chain means for Ethereum
Robinhood Chain settles to Ethereum. Every transaction on the chain ultimately posts data to the Ethereum mainnet through blobs. This means that Robinhood Chain’s activity, all $47 billion of it, contributes to Ethereum’s security budget and reinforces the network’s role as a settlement layer.
For Ethereum, the emergence of corporate-backed Layer 2 networks is a double-edged development. On one side, chains like Robinhood and Base bring millions of users into the Ethereum ecosystem who would never interact with the mainnet directly. They generate blob fees, consume blockspace, and create economic gravity around ETH as a gas token.
On the other side, these chains capture most of the value at the execution layer. Robinhood keeps the bulk of sequencer revenue, sharing only 10 percent with the Arbitrum ecosystem. The users on Robinhood Chain may never know or care that Ethereum exists underneath. The settlement layer becomes invisible infrastructure, essential but unrewarded relative to the activity it supports.
This dynamic is already visible in the fee data. Robinhood Chain surpassed both Ethereum and Base in 24-hour application revenue on Aug. 31, recording $2.66 million. The chain built on Ethereum is generating more application-level revenue than Ethereum itself on certain days.
The tension between Layer 2 growth and Layer 1 value capture is not unique to Robinhood Chain, but the scale makes it unusually visible. Ethereum’s blob fee revenue from all Layer 2 networks remains a small fraction of what those networks generate in sequencer revenue. The argument that Layer 2 activity is inherently good for Ethereum depends on the assumption that demand for blob space will eventually drive meaningful fee revenue back to the mainnet. At current utilization levels, that assumption remains unproven. Robinhood Chain’s success makes the question more urgent without answering it.
The September test
The gas subsidy expires at the end of September. Between now and then, several developments will clarify whether Robinhood Chain’s trajectory is sustainable.
Arcus is expanding its leveraged product suite, adding new pToken pairs and increasing collateral types. If leveraged trading generates durable volume independent of the gas subsidy, it would suggest that the chain has found a product-market fit that goes beyond free transactions.
The DTCC is scheduled to launch tokenized securities infrastructure in October, which could either validate or undermine Robinhood’s first-mover advantage in tokenized equities. If institutional players enter the market with competing infrastructure, the value proposition of Stock Tokens may shift.
And Robinhood itself will face a decision about whether to extend, modify, or eliminate the gas subsidy. The company’s financial position gives it the flexibility to continue subsidizing transactions if it believes the long-term economics justify the cost. With $573 million in quarterly net income, a few million dollars in gas subsidies is a rounding error on the income statement.
What to watch
- Daily DEX volume after the gas subsidy expires on Sept. 29: a drop below $200 million would signal that free transactions, not organic demand, drove the majority of activity.
- Tokenized equity volume breadth: whether trading expands beyond QQQB and a handful of large-cap stocks to include a wider range of securities and index products.
- Protocol diversity: whether the chain develops multiple high-volume venues or remains dependent on one or two protocols for the majority of throughput.
- U.S. regulatory clarity on Stock Tokens: any indication that tokenized equities could become available to U.S. residents would dramatically expand the addressable market.
- TVL retention through Q4 2026: whether the $1.4 billion in locked value stays on the chain as incentives taper or migrates to competing networks.
What is Robinhood Chain?
Robinhood Chain is an Ethereum Layer 2 blockchain built on Arbitrum Orbit technology. It launched its public mainnet on July 1, 2026, and uses ETH as its native gas token. The chain settles directly to Ethereum and features 100-millisecond block times. Its flagship products include tokenized Stock Tokens, decentralized exchange trading through Uniswap, and lending through protocols like Morpho.
How much DEX volume does Robinhood Chain process?
On Aug. 25, 2026, Robinhood Chain recorded roughly $945 million in daily decentralized exchange volume, a new all-time high. The chain has processed more than $47 billion in cumulative DEX volume since launching on July 1. Its 30-day volume of approximately $15 billion places it fifth among all blockchain networks, behind Solana, BNB Chain, Ethereum, and Base.
What are Stock Tokens on Robinhood Chain?
Stock Tokens are ERC-20 tokens that track the price of publicly traded equities like NVIDIA, Apple, GameStop, and SpaceX. They give holders economic exposure to the underlying stock rather than legal ownership of shares. Stock Tokens trade around the clock in more than 120 countries through decentralized exchanges like Uniswap on Robinhood Chain. They are currently unavailable to U.S. residents.
Is there a Robinhood Chain token?
No. Robinhood has not issued a native governance or utility token for Robinhood Chain. The network uses ETH for gas fees. While several community-created tokens like CASHCAT and PONS trade on the chain, none of these are officially affiliated with Robinhood.
How does Robinhood Chain compare to Base?
Base, built by Coinbase, launched in August 2023 and has roughly $5.47 billion in total value locked compared to Robinhood Chain’s $1.4 billion. Base processes more daily transactions on average and has a more mature ecosystem of developer tools and protocols. However, Robinhood Chain closed the gap on several metrics within weeks, briefly surpassing Base in daily active users and ranking within striking distance on daily DEX volume.
What is the gas subsidy on Robinhood Chain?
Robinhood covers transaction fees for users trading through the Robinhood Wallet on Robinhood Chain. This 90-day promotional period began at mainnet launch on July 1 and runs through approximately Sept. 29, 2026. In mid-August, Robinhood reduced the subsidy threshold from $5 to $0.50 per transaction, signaling a gradual taper rather than an abrupt cutoff.
Who can use Robinhood Chain?
Robinhood Chain is a permissionless Ethereum Layer 2, meaning anyone with a compatible wallet can interact with it. However, the tokenized Stock Tokens product is available in more than 120 countries but is not available to U.S. residents. Other DeFi products on the chain, including decentralized exchange trading and lending, are accessible to users globally through wallets like Robinhood Wallet, MetaMask, and others.
How does Robinhood make money from the chain?
Robinhood captures sequencer revenue from transactions processed on the chain. Under the Arbitrum Expansion Program, 8 percent of chain revenue goes to a treasury controlled by Arbitrum governance token holders and 2 percent funds a developer guild. Robinhood retains the remaining 90 percent. In July 2026, the chain generated roughly $3.6 million in transaction fees, making it the top revenue-producing Layer 2 in the Ethereum ecosystem.
Disclaimer: This article is for informational purposes only and does not constitute financial advice. Always do your own research before making investment decisions. Information is accurate as of Aug. 31, 2026.

‘The Falklands are our future’: Javier Milei vows to impose sanctions on off-shore drilling as he restates Argentina’s claim to the islands

Costco Next disappears from website seemingly without warning

Adobe Names Anil Chakravarthy CEO But AI Fears Are Impacting the Stock





-

 Fashion6 days ago
Weekend Open Thread: Maeve – Corporette.com
-

 Crypto World1 day ago
CLARITY Act could advance within weeks, Atkins says
-

 Business6 days ago
Onto Innovation Stock: AI’s Next Bottleneck Is Yield (NYSE:ONTO)
-

 Crypto World6 days ago
Bitcoin price tests $82K resistance as Brandt stays long
-
 Tech5 days ago
Hugging Face built a $4.5 billion empire on free AI models. Now Nvidia is buying it for $12.9 billion
-

 Business6 days ago
iPhone 18 Pro Pre-Orders Could Shift to Saturday as Apple Reportedly Avoids September 11 Anniversary
-

 Crypto World2 days ago
Elon Musk Says Grok 4.7 Lands in 10 Days and Will Beat Every Model
-
 Entertainment7 days ago
‘Adults’ Creators Break Down Season 2’s Most Shocking Moments and Tease a Potential Season 3
-

 News Videos5 days ago
Charlie Munger on Robinhood: No one should believe that Robinhood’s trades are free
-

 Tech6 days ago
PaperCut releases second emergency patch for exploited flaws
-
 Crypto World2 days ago
Bitcoin slips below $77.5K as macro pressure offsets ETF inflows
-

 Crypto World23 hours ago
Kalshi seeks CFTC approval for WTI perpetual
-

 Tech5 days ago
Tamagotchi Ring Takes the 30-Year Digital Pet and Places it on Your Finger
-

 Tech5 days ago
As the influencer economy drives retail sales, Seattle startup raises $22M to play matchmaker
-

 News Videos5 days ago
News kii Crypto ugu danbeeyey & Suuqa oo dhaqaaqey
-
 Entertainment4 days ago
Taylor Swift Reportedly ‘Frustrated’ With Travis Kelce After ‘Short’ Honeymoon
-

 Business6 days ago
Apple Confirms September 9 iPhone Launch Event as Tim Cook Prepares to Hand CEO Reins to John Ternus
-
 NewsBeat5 days ago
Trump posts AI video of ‘Lake America’ being protected by an army of bequiffed ‘Donald Ducks’
-
 Business2 days ago
Oil Price Today (September 2): Crude oil nears $97 as war tensions escalate. Will it hit $100 again?
-
 Entertainment6 days ago
Kendall Jenner’s Circle Concerned About Jacob Elordi Romance
You must be logged in to post a comment Login