
Crypto World
The Moon Is the New Data Center: Inside Musk’s Plan to Take AI Off-Planet

TLDR:
- Terafab will produce two chip types; one for Tesla and Optimus, and a space-hardened D3 variant for orbit.
- Solar panels in space run five times more efficiently, making orbital AI cheaper to operate than ground-based systems.
- A lunar electromagnetic mass driver could slash payload launch costs from $1,200 per pound to just dollars in electricity.
- One entity now controls the rockets, chips, robots, and satellites needed to build an off-planet AI supply chain.
Terafab, a semiconductor facility developed by Tesla, SpaceX, and xAI, has officially broken ground. Elon Musk unveiled the project Saturday night at a decommissioned power plant in Austin, Texas.
The facility targets one terawatt of AI compute annually, roughly double the total electricity capacity of the United States.
Around 80% of its chip output is set for space deployment. Musk framed the effort as the start of what he called a galactic civilization.
Terafab’s Chip Strategy and Space-Bound AI Infrastructure
Terafab will produce two distinct types of chips. One type supports Optimus robots and Tesla vehicles. The other, designated D3, is hardened specifically for space.
Most of the facility’s output, roughly 80%, is directed toward orbital deployment. The remainder supports ground-based AI applications and consumer devices.
Musk expects Optimus robot production to reach 10 to 100 times the volume of car manufacturing. That points to billions of chips being produced annually.
The scale makes Terafab central to both commercial and space operations. No existing facility currently targets this combined level of output.
Musk told the Austin audience that solar panels in space operate five times more efficiently than on Earth. Milk Road AI reported this as a central part of its cost argument for orbital AI.
Space also provides uninterrupted sunlight, unlike ground-based installations. Over time, this positions orbital AI as cheaper to run than terrestrial alternatives.
Near-term chip output from Terafab is directed toward a data center under construction in Virginia. That facility serves as the initial hub before full orbital deployment begins.
It connects ground-level production to the broader space strategy. From there, the roadmap extends outward toward the moon.
Lunar Mass Driver and the Road to a Petawatt
Beyond the terawatt lies a petawatt target, one thousand times more powerful. Musk argued that reaching it requires moving manufacturing off-planet.
The moon, with its low gravity and no atmosphere, becomes the logical production site. A lunar base forms the next stage of the infrastructure plan.
Rather than rockets, the plan calls for an electromagnetic mass driver on the lunar surface. This magnetic cannon would launch AI satellites directly into deep space.
A Falcon rocket currently costs around $1,200 per pound of payload. A lunar mass driver could reduce that figure to just dollars per pound in electricity.
Milk Road AI described this as potentially the single biggest reduction in the cost of intelligence in human history, with the caveat that it must first work.
That qualifier is worth noting. No mass driver of this scale has been built or tested. The engineering challenges ahead remain unresolved.
Musk stated his goal to complete the lunar infrastructure within his own lifetime. Terafab has already broken ground, and the D3 chips are currently in design.
The race to place AI infrastructure in space has formally started. One entity now controls the rockets, the robots, the chips, and the satellites required to pursue it.


BNB Chain has told node operators to complete a required software update before the Osaka/Mendel hard fork reaches mainnet on April 28.
Summary
- BNB Chain told node operators to install BSC v1.7.2 before the Osaka/Mendel hard fork launches.
- The April 28 mainnet upgrade follows testnet activation and adds stability, gas limits, and finality.
- BNB Chain said outdated settings and poor binary replacement could cause nodes to lose sync.
The network said operators should move to BSC v1.7.2 and remove outdated settings to keep nodes running normally.
BNB Chain developers said node operators must complete the update before the Osaka/Mendel hard fork goes live on BSC mainnet. The network scheduled the upgrade for April 28 at 2:30 a.m. UTC.
The notice said operators need to replace binaries correctly and clean up old configuration fields. The team said those steps are needed to stop nodes from “losing sync” during the upgrade.
The message places the focus on infrastructure readiness before the hard fork date. It also shows that the update is not optional for operators who want their nodes to stay aligned with the chain.
The deadline comes as BNB Chain moves from testnet preparation to a full mainnet rollout. That shift usually puts more attention on validator and node performance across the network.
The Mendel upgrade adds BEP-652, which brings EIP-7825 into BNB Chain through a protocol-level gas cap for each transaction. The cap is set at 16,777,216 gas.
That change means all nodes will reject transactions above the limit in the same way. BNB Chain said this method is more reliable than the earlier soft cap model that operators could treat differently.
The broader network upgrade includes nine BEPs in total. BNB Chain also said it adopted seven of the 13 Ethereum proposals linked to Fusaka, including six that required a hard fork and one client-side RPC change.
The network did not adopt the other six proposals because of architecture differences. It also added two BNB Chain-specific updates through BEP-657 and BEP-648.
Testnet rollout came before mainnet launch
BNB Chain activated the Osaka/Mendel hard fork on the BSC testnet on March 24 at block 88,379,325. Developers said the test phase improved block construction, transaction handling at scale, network stability, and execution accuracy.
BEP-657 limits when blob transactions can be included based on block number. BEP-648 aims to reduce latency and speed up finality on the network.
The mainnet launch now depends on operators completing the required update on time. The latest alert shows BNB Chain wants nodes fully prepared before the April 28 hard fork begins.
The TRON founder accused the Trump-linked DeFi project of hiding a ‘trap door’ in its token contract.
The long-simmering conflict between TRON founder Justin Sun and World Liberty Financial (WLFI) erupted into an all-out public war on Sunday, with both sides hurling accusations on X.
Sun, who invested $75 million in the DeFi venture affiliated with the Trump family, published a lengthy statement accusing WLFI of embedding a hidden blacklisting function in the WLFI token smart contract, a mechanism he said gives the project “unilateral power to freeze, restrict, and effectively confiscate the property rights of any token holder, without notice, without cause, and without recourse.”
“This is a trap door marketed as an open door,” Sun wrote.
The dispute dates back to September 2025, when WLFI blacklisted a wallet containing more than 500 million of Sun’s WLFI tokens after on-chain analysts flagged transfers routed through HTX, Sun’s crypto exchange.
WLFI responded within hours, dismissing Sun’s allegations and threatening legal action.
“Justin’s favorite move is playing the victim while making baseless allegations to cover up his own misconduct,” the project’s official account posted. “We have the contracts. We have the evidence. We have the truth. See you in court pal.”
Sun fired back minutes later, demanding that whoever was operating the account identify themselves. “As the largest investor in this project, I demand that those responsible come forward by name, instead of hiding in the shadows.”
The feud follows days of scrutiny over WLFI’s treasury operations.
Sun went on to allege that governance votes cited to justify the project’s actions “were not conducted through a fair or transparent process” and that “the outcomes were predetermined.”
He accused the team of extracting fees, implanting backdoor controls, and “treating the crypto community as a personal ATM.”
Sun was careful to separate the WLFI operators from President Trump himself, opening his statement by reaffirming support for Trump and directing criticism at “the bad actors at WLFI.”
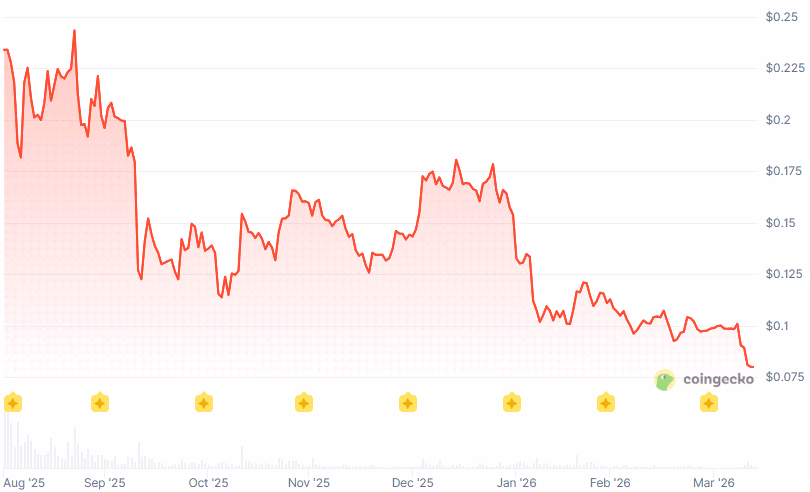
Since the September 2025 blacklist, WLFI has fallen roughly 76% from its all-time high of $0.30 to around $0.079, per CoinGecko, hitting an all-time low just yesterday. The token tanked 18% on its first day of trading and has barely recovered since.

TLDR:
- BlackRock’s combined BTC and ETH holdings dropped from $78.36B to $57.89B in Q1 2026.
- Bitcoin holdings rose by 14,950 BTC despite a $16.24B fall in dollar value over the quarter.
- Ethereum holdings fell 410,750 ETH, reflecting both price weakness and active net distribution.
- Q1 2026 losses of $20.47B were $5.97B lower than the $26.44B decline recorded in Q4 2025.
BlackRock’s crypto portfolio recorded a sharp $20.47 billion decline in Q1 2026, as falling Bitcoin and Ethereum prices weighed heavily on the asset manager’s holdings.
Data from blockchain analytics platform Arkham shows combined BTC and ETH holdings dropped from $78.36 billion to $57.89 billion between January 1 and March 31.
While Bitcoin saw continued accumulation despite the price slump, Ethereum experienced both price-driven losses and reduced holdings, marking a clear shift in institutional positioning as market conditions remained under pressure throughout the quarter.
Bitcoin Accumulated as Ethereum Holdings Contracted
Bitcoin remained the largest component of BlackRock’s crypto allocation throughout Q1 2026. BTC prices fell from $88,341 to $65,982, a 25.31% decline, pushing the dollar value of holdings down by $16.24 billion.
The value dropped from $68.05 billion to $51.81 billion over the quarter. Despite the price weakness, BlackRock continued buying Bitcoin.
Holdings grew from approximately 770,290 BTC to 785,240 BTC, adding 14,950 BTC, or 1.94% growth. This pattern points to opportunistic accumulation rather than retreat from the asset class.
Ethereum told a different story. ETH prices fell 33.12%, from $2,966 to $1,983, while ETH holdings also dropped from 3.47 million to 3.06 million.
That 410,750 ETH reduction pushed Ethereum exposure down from $10.31 billion to $6.08 billion, a $4.23 billion decrease. Unlike Bitcoin, Ethereum saw both price pressure and net distribution during the period.
Q1 2026 Losses Remain Below Q4 2025 Levels
The Q1 2026 decline, though steep, was smaller than the previous quarter’s drawdown. In Q4 2025, BlackRock’s crypto portfolio fell by $26.44 billion, with Bitcoin dropping $20.74 billion and Ethereum falling $5.71 billion.
Quarter-over-quarter, the pace of losses eased by approximately $5.97 billion. The comparison to Q1 2025 shows how much conditions have shifted.
A year earlier, the portfolio declined by only $4.95 billion, with both assets still in accumulation phases. Bitcoin rose by 23,300 BTC, and Ethereum increased by 120,350 ETH during that earlier period.
By Q1 2026, Ethereum had clearly shifted from accumulation to net outflows. Bitcoin accumulation persisted, but falling prices kept overall portfolio value under pressure.
The holdings tracked here reflect client capital flowing through BlackRock’s iShares Bitcoin Trust and iShares Ethereum Trust, not proprietary positions held by the firm.

President Donald Trump said the United States will begin naval action at the Strait of Hormuz, according to a Truth Social post shared Sunday.
Summary
- Trump said the US Navy will begin blockading ships entering or leaving the Strait immediately.
- The post said US forces may interdict vessels accused of paying tolls to Iran.
- Trump linked the planned blockade to Iran tensions and the unresolved dispute over nuclear issues.
The statement said the move followed talks in which “NUCLEAR” remained the main unresolved issue.
Meanwhile, Trump said the United States Navy would start the process of blockading ships trying to enter or leave the Strait of Hormuz. He described the move as an immediate response and said the goal was to stop what he called ”WORLD EXTORTION.”
The post also said the United States would move toward an ”ALL BEING ALLOWED TO GO IN, ALL BEING ALLOWED TO GO OUT” basis at a later stage. Trump said Iran had blocked that outcome by raising fears about mines in the waterway.
Trump said the Navy had been instructed to seek and interdict vessels in international waters that had paid what he called an illegal toll to Iran. He added that any ship paying such a toll would not receive safe passage on the high seas.
The post also said US forces would begin destroying mines that Iran allegedly placed in the strait. Trump presented the planned action as part of a broader effort to stop Iran from using the waterway for pressure during the current crisis.
In addition, Trump used sharp language throughout the post and said any Iranian forces that fired at US or commercial vessels would face direct retaliation. He also wrote that the blockade would begin shortly and said other countries would join the effort.
The statement further claimed Iran’s naval and air capabilities had been degraded and repeated the administration’s view that Tehran’s nuclear program remained the central issue. Trump said Iran wanted money and, more importantly, ”Nuclear.”
Strait of Hormuz remains a key route
The Strait of Hormuz remains one of the world’s most important shipping routes for oil and gas flows. Any military move involving that passage is watched by energy markets, shipping operators, and governments across several regions.
Trump’s post did not include operational details, a timeline for enforcement, or the names of any partner countries expected to join. The statement nevertheless set out a clear position that the United States was prepared to take direct action in and around the strait.


A fake Ledger app on Apple’s Mac App Store cost musician G. Love nearly 6 BTC after he entered his recovery phrase into the malicious software. The stolen Bitcoin was worth more than $424,000.
In an April 11 X post, Garrett Dutton, the singer known as G. Love, explained the loss while he was moving his Ledger setup to a new Apple computer.
Bitcoin Theft Highlights Risks of Fake Wallet Apps
He explained that the incident occurred after he searched the App Store for Ledger Live, downloaded an app that looked authentic, and followed its prompts. The app then asked for his 24-word seed phrase. As soon as he entered it, the attackers drained the Bitcoin.
Dutton said the stolen funds were part of his retirement savings.
“I lost 5.9 BTC all I had for ten years I worked on this f#ck be careful out there,” he stated.
On-chain investigator ZachXBT said the stolen 5.92 BTC were routed through addresses identified as KuCoin deposit addresses.
When asked whether the funds could be recovered, ZachXBT said he did not expect KuCoin to intervene.
Instead, the on-chain investigator accused KuCoin of presenting itself as compliant only when it suited its interests. He also pointed to KuCoin’s loss of its MiCA license in February 2026, just three months after obtaining it, as evidence of deeper compliance problems.
ZachXBT continued, noting that illicit services continue to exploit broker and personal accounts on the platform, with little visible regulatory resistance. He added that the large number of deposit addresses suggested the thieves may have routed the funds through an instant exchange.
Meanwhile, Beau, head of security at Pudgy Penguins, warned crypto users never to enter a hardware wallet seed phrase on an internet-connected device such as a laptop or phone.
He said scammers often distribute fake wallet apps through email, deceptive advertisements, and even physical mail. The security expert added that users should treat any message urging them to download or update wallet software as a scam until they independently verify it.
The post Fake Ledger App on Apple App Store Drains Over $400,000 in Bitcoin appeared first on BeInCrypto.
Nashville, TN, USA, April 10, 2026 — Among the rarest physical artifacts in Bitcoin’s seventeen-year history—an original copy of The Times of London from January 3, 2009, the newspaper whose front-page headline Satoshi Nakamoto embedded into the genesis block—will be offered for public sale at Bitcoin Conference 2026 (https://scarce.city/auctions/satoshi-times), April 27–29 at The Venetian Resort in Las Vegas. The lot anchors the most ambitious exhibition program in the history of the Bitcoin Museum & Art Gallery or BMAG, the arts and culture division of BTC Inc, a Nakamoto Inc. (NASDAQ: NAKA) company.
The B26 gallery spans a 6,000-square-foot space anchored by four curated exhibition walls, several dozen auctions, a live painting performance by legendary street artist Mear One, the debut of BMAG’s artist-in-residence program, and a full slate of editorial and speaking programming. Since its formation, BMAG has facilitated more than 120 BTC in art sales—transacted exclusively in Bitcoin—and the B26 program builds on a record-setting 20.14 BTC in sales at Bitcoin 2025, representing several years of exponential growth for the platform.
“Bitcoin 2026 reflects how far this conference — and the Bitcoin ecosystem itself — has evolved. With tens of thousands of attendees already registered, expanded stages, and a redesigned experience, we’re building an event that meets people wherever they are in their Bitcoin journey while continuing to push the conversation forward globally.” — Justin Doochin, Head of Events at BTC Inc.
Relics of a Revolution anchors the gallery with a thesis rarely tested in Bitcoin culture: that the movement’s most enduring artifacts are not its code or its coins but its acts of public dissent. The wall brings together Mear One’s protest posters—painted during Gulf War and Occupy Wall Street demonstrations—alongside the Mt. Gox protest sign carried by Kolin Burges during his vigil outside Mt. Gox’s Tokyo offices, one of the most striking acts of individual protest in Bitcoin’s history, a framed original of the Satoshi Times newspaper, and the infamous American flag suit worn by Afroman throughout his court appearances and music videos. A companion three-part editorial series in Bitcoin Magazine, authored by Dennis Koch, features Q&A interviews with all three figures. Koch also moderates a live panel, Looking at Bitcoin Art Through a Protest Lens, during the conference. Select works will be offered at auction through the BMAG and Scarce.city.
Rare Pepes Did It First marks the tenth anniversary of the project widely credited as the origin point of crypto-native art and digital collectibles. The exhibition takes its name from crypto artist XCOPY, who famously wrote, “whenever you think you’re first, check if Rare Pepes did it years ago.” The installation features archival memorabilia contextualizing Rare Pepes foundational role in what would become the global NFT movement.
History of Bitcoin presents a large wall display of prints from the project’s large-format collector’s edition by Smashtoshi—a global art and education collective that brings Bitcoin’s story to life through visuals, storytelling, and immersive experiences. The edition brings together 128 artists across 2,140 copies to tell Bitcoin’s history from its cypherpunk roots to global adoption, each pivotal moment reimagined by a different artist and grounded in original research and first-hand accounts. An exquisite Genesis Editions series is available for presale at Bitcoin 2026.
A two-person exhibition pairs BMAG’s inaugural Artist-in-Residence, Ksenia Buridanova, with Pepenardo, whose MEMETIKRON body of work travels from its opening at BMAG’s Nashville museum to Las Vegas. Buridanova’s residency—spanning multiple international conference events in 2026—follows her January debut exhibition Mysteria Memetica in Nashville.
Ahead of Bitcoin 2026, collectors and enthusiasts can enter the MEMETIKRON Bounty for a signed 1/1 Pepenardo drawing, purchase raffle tickets for a custom Bitcoin poker chip set (details for both can be found on https://shop.museum.b.tc/), hunt for Cardsmiths bitcoin redemption cards and exclusive packs from a Lucky Box vending machine—with live-streamed TikTok card-pack openings on-site. Catch artist interviews at BrainSprout’s content creator space inside the art gallery. And for those who think Bitcoin art can’t shred—the Bitcoin Guitar by Tim Ronan, finished in Bitcoin orange with a full-length Satoshi Nakamoto inlay in Katakana, will be offered at a starting bid of 1 BTC.

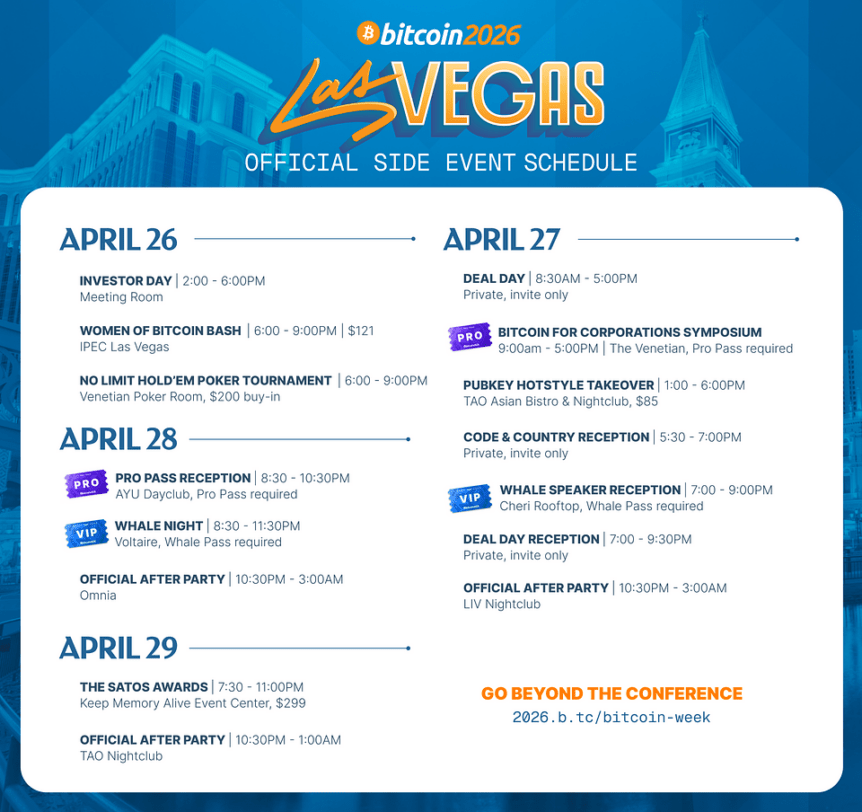
Bitcoin Week: Side Events and Social Programming
Bitcoin Conference 2026 extends well beyond the main conference floor. Bitcoin Week—April 26–29—transforms Las Vegas into a city-wide celebration of Bitcoin culture, finance, and community.
Highlights include:
Women of Bitcoin Bash — April 26, IPEC Las Vegas
No Limit Hold’Em Poker Tournament — April 26, Venetian Poker Room
Bitcoin for Corporations Symposium — April 27, The Venetian (Pro Pass required)
PubKey Hotstyle Takeover — April 27, TAO Asian Bistro & Nightclub
Whale Night — April 28, Voltaire (Whale Pass required)
The Satos Awards — April 29, Keep Memory Alive Event Center
Official After Parties nightly at LIV Nightclub, Omnia, and TAO Nightclub
Full schedule: 2026.b.tc/bitcoin-week
Expanded Cultural Programming
Bitcoin 2026 features a dedicated Culture track—exploring art, media, philosophy, education, and the social movements driven by Bitcoin, showcasing how culture shapes adoption and narrative. With more than 30,000 registered attendees, this year’s conference is the largest in the event’s history and its most culturally ambitious to date.
Preview auction lots on BMAG:
https://shop.museum.b.tc/collections/bitcoin-vegas-26
Preview the Satoshi Times auction on Scarce.city: https://scarce.city/auctions/satoshi-times
Follow updates: @BMAG_HQRelics of Revolution, Part 1 w/ Kolin Burges: https://bitcoinmagazine.com/culture/relics-of-a-revolution-part-i-standing-outside-in-the-cold
For more about BMAG: https://museum.b.tc/
About The Bitcoin Conference
The Bitcoin Conference is a global event series, featuring notable industry speakers, workshops, exhibitions, and entertainment. These events serve as vital platforms for Bitcoin industry leaders, developers, investors, and enthusiasts to gather, network, and exchange ideas. Bitcoin 2026 is being held in Las Vegas in April 2026. Its international events include Bitcoin Hong Kong (August 27–28, 2026), Bitcoin Amsterdam (November 5–6, 2026) and Bitcoin MENA (Abu Dhabi, December 2026).

Concerns around quantum computing and its potential impact on blockchain security have resurfaced, with many networks taking steps to counter future cryptographic threats.
A recent analysis by an XRP Ledger (XRPL) validator suggests that XRP (XRP) may be significantly less exposed to potential quantum computing threats compared to Bitcoin (BTC), largely due to differences in account activity and key exposure.
Quantum Computing and Crypto: Why XRP’s Exposure Is Minimal
Quantum computers pose a theoretical risk to blockchain wallets by potentially deriving private keys from exposed public keys. However, this risk primarily applies to addresses whose public keys have been revealed on-chain, typically when funds are spent.
According to the validator, roughly 300,000 XRP accounts, holding a combined 2.4 billion XRP, have never conducted a transaction. Because their public keys have never been revealed, these accounts are less exposed to potential quantum attacks under current threat models.
The validator also identified two XRP wallets holding around 21 million XRP that have remained dormant for over 5 years while exposing their public keys. This indicates that vulnerable “whale” accounts on the XRP Ledger account for only around 0.03% of the total supply.
“Dormant, vulnerable XRP whales are almost nonexistent. The rest is active and has their public key exposed, but is also reasonable to expect to rotate keys if needed,” the validator wrote. “The XRP Ledger is account-based and allows for signing key rotation, so you can rotate keys that sign on behalf of an account without switching the account. This is obviously not a perfect solution at all, and actual quantum-resistant algorithms will eventually be adopted.”
Follow us on X to get the latest news as it happens
The structural gap between the XRP Ledger and Bitcoin on this issue is significant. According to a recent paper by Google, roughly 6.7 million BTC are currently held in quantum-vulnerable addresses. This is equivalent to nearly 32% of Bitcoin’s total supply.
This figure also includes an estimated 1 million BTC believed to belong to Satoshi Nakamoto. Litecoin (LTC) founder Charlie Lee recently cautioned that Satoshi’s Bitcoin could become a target for potential attackers if quantum capabilities advance.
“The million Bitcoins that Satoshi has. Nobody knows who Satoshi is….Those coins are not well protected. They’re actually less safe than current coins in terms of quantum attacks. If quantum does happen, those will be the first coins that will be kind of broken into,” Lee mentioned to BeInCrypto.
Despite these differences, the validator emphasized that no known quantum computers can currently break blockchain encryption. Additionally, XRP users can leverage escrow mechanisms, offering an added layer of protection.
For now, the findings suggest that while quantum risks warrant monitoring, XRP’s current exposure remains limited, particularly regarding dormant large holders.
Subscribe to our YouTube channel to watch leaders and journalists provide expert insights
The post XRP Gains Edge Over Bitcoin in Quantum Risk Exposure appeared first on BeInCrypto.
Bitcoin’s fifth halving is slated for April 2028, and the mining sector is entering that cycle with far tighter margins than in 2024. A mix of higher input costs, strained energy markets and increasingly explicit regulatory expectations are reshaping how miners operate, finance, and plan for the next supply cut.
During the previous halving in April 2024, Bitcoin traded around $63,000 as block rewards halved from 6.25 BTC to 3.125 BTC. By the 2028 event, miners will contend with even higher costs for energy, equipment and capital, all while a record hashrate and evolving policy regimes pressure balance sheets and strategic choices. Those dynamics have sparked a broader rethink: operators are moving beyond pure Bitcoin production toward energy infrastructure, grid services and multi-use sites designed to generate revenue streams that endure beyond block rewards.
Key takeaways
- The 2028 halving will reduce the block reward to 1.5625 BTC, at a time when input costs and energy prices are elevated relative to 2024.
- Miner balance sheets are tightening as executives pay down debt and deploy capital with greater discipline; notable sales of Bitcoin by major operators underline a shift in risk posture.
- Industry participants are pursuing longer-term power contracts and diversified site operations, signaling a move toward energy and infrastructure plays rather than pure mining plays.
- Regulatory clarity—across custody, banking access and crypto asset markets—appears increasingly central to capital allocation and institutional participation.
- Market dynamics are converging toward operators capable of financing, sustaining power, and monetizing ancillary opportunities such as grid services and heat reuse.
From cycles to infrastructure: a changing mining playbook
Industry executives describe the coming cycle as structurally different from 2024. Juliet Ye, head of communications at Cango, argues the environment for 2028 “looks almost nothing like 2024,” driven by a widening efficiency gap that forces fleet upgrades and longer energy commitments instead of chasing the cheapest tariffs. “There is less room in the middle now,” she said. “Operators with scale and diversification will be fine. Those without will find the next halving very difficult.”
Along similar lines, GoMining CEO Mark Zalan emphasized that capital discipline now matters more than sheer increases in hashrate. In his view, new deployments must clear tougher returns thresholds, reflecting the need to secure reliable energy and durable infrastructure before the next reward cut.
Despite these shifts, some fundamentals remain familiar. Stratum V2 pool DMND’s co-founder and CEO, Alejandro de la Torre, noted that the core dynamics of mining cycles tend to repeat, with peak hotspots reconfiguring and decentralization expanding as mid-sized players form new energy partnerships. The underlying message is that, even as strategies diversify, the market continues to rebalance around how and where power is sourced and monetized.
Balance sheets tightening: pre-halving recalibration
Evidence of a more conservative posture is visible in recent balance-sheet activity. Mara Holdings disclosed the sale of more than 15,000 Bitcoin in March to reduce leverage, while Riot Platforms liquidated over 3,700 BTC in Q1 to deleverage and restructure debt. Cango sold around 2,000 BTC to address its financing needs, and Bitdeer reported its Bitcoin treasury had fallen to zero as of February 20. These moves illustrate a broader recalibration: miners are prioritizing debt reduction, liquidity preservation and readiness to fund longer-duration power or energy projects ahead of the 2028 halving.
That tightening is accompanied by a deeper reexamination of hardware and site economics. Ye pointed to a structural shift toward energy contracts that span multiple regions, arguing that the most successful operators will lock in stable power and build sites capable of multi-use capacity. The early 2028 cycle is shaping up as a test of whether miners can convert heavy capex into durable, non-hash rate income streams.
Beyond blocks: monetizing energy and grid services
The economics of the 2028 cycle appear to reward operators who diversify revenue streams and manage capital with precision. Zalan described a landscape where “capital discipline now matters more than hashrate maximalism,” and where new deployments must deliver returns that justify the upfront costs and ongoing energy spend. The opportunity set expands beyond mining to include services that align with energy markets, such as load-curtailment, grid stabilization and potential heat reuse at multipurpose facilities.
Cango is positioning itself for this broader model. Juliet Ye highlighted an overarching thesis: facilities that can operate as mining hubs while serving AI inference or other high-performance compute tasks will be the ones that endure. “The facilities that will matter in five years are the ones that can do more than one thing,” Ye said, underscoring a trend toward bifurcated usage—hashpower during certain windows and compute workloads during others.
Analysts and operators also point to a broader industry realignment of incentives. In the 2024 cycle, investors rewarded miners largely on their Bitcoin exposure and price performance. As the sector matures, more capital is likely to flow toward operators that can secure long-term power agreements, participate in grid mechanisms and build scalable, multi-use sites that lock in revenue streams beyond the block reward.
Regulation as a material driver of capital decisions
Regulatory regimes are shifting from a cautious overlay to a more formal framework, and that evolution is increasingly embedded in investment theses. In the United States, developments around custody rules and banking access are being watched closely, while Europe’s Markets in Crypto Assets (MiCA) framework continues to shape how institutions approach crypto assets. Asia’s regulatory moves—along with new settlement rails and ETFs in various markets—are contributing to a clearer, more usable environment for capital to flow into mining and associated energy infrastructure.
Proponents argue that better-defined rules can accelerate capital deployment by reducing policy risk. Zalan indicated that the current backdrop is making capital moves faster when the regulatory environment is clear and reliable. He also suggested that the market has not fully priced in the potential for a tighter supply impulse to coincide with a broader Bitcoin ecosystem expansion by 2028.
What readers should watch next
As the 2028 halving draws nearer, investors, builders and miners will be watching several key signals. The ability of operators to lock in durable power arrangements and to monetize non-mining revenue streams will be critical in determining who emerges strongest from the next cycle. Regulatory clarity, particularly around custody and banking access, will likely influence which companies can scale and attract institutional capital. Finally, the balance between debt management and capex for energy infrastructure will shape which players can sustain operations through a period of reduced block rewards.
In the near term, market participants will assess how quickly energy markets adapt to geopolitical shifts and whether new efficiency gains offset rising input costs. The 2028 halving may test a broader, more resilient mining ecosystem—one that’s less about chasing the next subsidy and more about building enduring, multi-use infrastructure that aligns with evolving energy and financial regulation.
Readers should monitor updates on how miners rearrange their portfolios, the pace of energy-contract takeups, and any regulatory clarifications that influence institutional participation. The next few quarters could reveal whether the sector successfully bridges block rewards with real-world assets and services, marking a new era for Bitcoin mining as a tangible, infrastructure-backed industry.
TLDR:
- Altcoins have broken above a multi-year falling wedge on the TOTAL2 chart, signaling a potential trend reversal.
- The MACD indicator is nearing a bullish crossover that closely mirrors the setup seen before the 2020 altcoin rally.
- Tokens including Zcash, LayerZero, Ethena, and Arbitrum posted gains above 10% within a single 24-hour window.
- Over 40% of altcoins were near all-time lows in March, yet open interest has since climbed past $113 billion.
Altcoin season 2026 is showing technical signals not seen since 2020. A multi-year falling wedge breakout on the TOTAL2 chart, combined with a looming MACD bullish crossover, has analysts watching closely.
With several tokens already posting double-digit gains and open interest climbing past $113 billion, the broader altcoin market appears to be building momentum for a potential trend reversal.
Wedge Breakout and MACD Signal Raise Altcoin Hopes
A falling wedge structure has been forming on the TOTAL2 chart since the 2021 market peak. This chart tracks the combined market cap of all altcoins, excluding Bitcoin.
The pattern reflects a prolonged downtrend with steadily weakening selling pressure over several years.
Analyst Mark Chadwick flagged the development in an April 8 post on X, stating that altcoins were “starting to look insane.” He noted that altcoins had broken above the upper boundary of this wedge.
That kind of breakout is generally viewed as a reversal signal among market analysts. Beyond the wedge, Chadwick also pointed to the MACD indicator as a secondary signal worth watching.
The MACD line is moving closer to the signal line, and a crossover to the upside may follow in the coming weeks. “If MACD flips green and confirms the crossover in the coming weeks… Follow the arrow for directions. Higher,” he wrote.
That 2020 MACD crossover marked the start of a broad altcoin rally where many tokens outpaced Bitcoin by wide margins. Crypto Patel separately noted on April 8 that altcoins are bouncing off a long-term trendline stretching back to 2022 lows, adding that “the bottom is in.”
Short-Term Gains Emerge Against a Mixed Market Backdrop
Several altcoins recorded gains above 10% within a 24-hour window earlier this week. Tokens including Zcash, LayerZero, Ethena, and Arbitrum were among those moving higher.
The total crypto market cap rose more than 4%, reaching around $2.5 trillion, while Bitcoin climbed back above $72,000. Open interest across crypto markets rose over 7% to $113 billion, according to CoinGlass.
That increase came alongside rising liquidations, pointing to growing speculative activity in the market. However, conditions remain uneven across the broader altcoin space.
Data from late March showed more than 40% of tokens trading near all-time lows, a deeper drawdown than in the prior bear market. Analyst Ash Crypto noted that ALT/BTC charts are showing multiple green MACD bars for the first time in years.
They stopped short of calling a full altcoin cycle underway, stating that Bitcoin dominance and broader liquidity conditions still need to shift before that call can be confirmed.


European banks and corporates are moving from research to rollout in the stablecoin market.
Summary
- European banks and corporates are now choosing stablecoin partners instead of only studying the market opportunity.
- MiCA gave firms one rulebook, helping stablecoin projects move faster from planning to execution stages.
- Corporate treasury demand is pushing stablecoin use for payments, settlement, and cross-border fund movement today.
New comments from industry executives show that firms are now choosing partners and preparing live use cases under MiCA rules.
Lamine Brahimi, co-founder and managing partner at Taurus, said stablecoin talks in Europe have changed over the past 18 months. Earlier discussions focused on education, risk, and compliance, but firms are now moving with board approval and launch plans.
He told Cointelegraph MiCA helped speed up that shift by replacing separate national rules with one framework across the region. Brahimi said some of Europe’s toughest financial institutions now see digital assets and stablecoins as part of the current banking stack, not something outside it.
Corporate treasury demand shapes use cases
Corporate treasury teams are driving much of the new stablecoin demand in Europe. Companies want faster fund movement, lower payment costs, and access to settlement outside normal banking hours.
Brahimi said the shift now comes from direct client needs rather than long-range planning. He said that when clients ask for better settlement and smoother cross-border transfers, the discussion becomes more immediate and practical.
Several European institutions have already moved ahead with stablecoin plans. ClearBank Europe said it became the first Dutch credit institution approved under MiCA to operate as a crypto asset service provider.
Other groups are also building new products. A consortium that includes ING, UniCredit, CaixaBank, and BBVA is working on Qivalis, a euro stablecoin project for regulated onchain payments and settlement, while other banks are preparing Swiss-franc and euro stablecoin offerings for 2026.
Data shows stronger business interest
Konstantin Vasilenko, co-founder and chief business development officer at Paybis, said the platform recorded sharp growth in EU stablecoin use. Between October 2025 and March 2026, USDC volume in the EU rose about 109%, while its share of stablecoin activity increased from about 13% to 32%.
He also said buy volume stayed about five to six times above sell volume during that period. Average stablecoin transactions were also larger than typical Bitcoin or Ether trades, which he said points to working capital, settlement use, and more deliberate business flows.
Mum swaps ‘trackies and trainers’ to take Mrs Galaxy title

U.S. Navy to Halt Ships Paying Tehran Tolls

BNB Chain warns of mandatory update before April 28 fork


![Young Thug - Money On Money (feat. Future) [Official Video]](https://wordupnews.com/wp-content/uploads/2026/04/1776012320_maxresdefault-80x80.jpg)


-

 Business7 days ago
Three Gulf funds agree to back Paramount’s $81 billion takeover of Warner, WSJ reports
-

 Politics2 days ago
US brings back mandatory military draft registration
-

 Fashion2 days ago
Weekend Open Thread: Veronica Beard
-

 Tech5 days ago
How Long Can You Drive With Expired Registration? What Florida Law Says
-

 Fashion6 days ago
Massimo Dutti Offers Inspiration for Your Summer Mood Board
-
 Sports2 days ago
Man United discover Nico Schlotterbeck transfer fee as defender reaches Dortmund agreement
-

 Crypto World3 days ago
Canary Capital Files SEC Registration for PEPE ETF
-

 Fashion5 days ago
Let’s Discuss: DEI in 2026
-

 Business2 days ago
Tesla Model Y Tops China Auto Sales in March 2026 With 39,827 Registrations, Beating Cheaper EVs and Gas Cars
-

 Crypto World4 days ago
Bitcoin recovers as US and Iran Agree a Ceasefire Deal
-

 Politics2 days ago
Malcolm In The Middle OG Turned Down ‘Buckets Of Money’ To Appear In Reboot
-

 Business2 days ago
OpenAI Halts Stargate UK Data Centre Project Over Energy Costs and Copyright Row
-

 Politics2 hours ago
World Cup exit makes Italy enter crisis mode
-

 Business1 day ago
Ireland Fuel Protests Enter Day 5 as Blockades Spark Shortages and Government Prepares Support Package
-

 Tech6 days ago
Italian court says Netflix must refund customers up to $576 over price hikes
-

 Tech6 days ago
Gamer Restores the Original PlayStation Portal From Two Decades Ago
-

 Tech6 days ago
Haier is betting big that your next TV purchase will be one of these
-

 Tech6 days ago
The Xiaomi 17 Ultra has some impressive add-ons that make snapping photos really fun
-

 Tech6 days ago
Samsung just gave up on its own Messages app
-

 Tech6 days ago
Save $130 on the Samsung Galaxy Watch 8 Classic: rotating bezel, sleep coaching, and running coach for $369
You must be logged in to post a comment Login