
Crypto World
The Top 5 for Developers

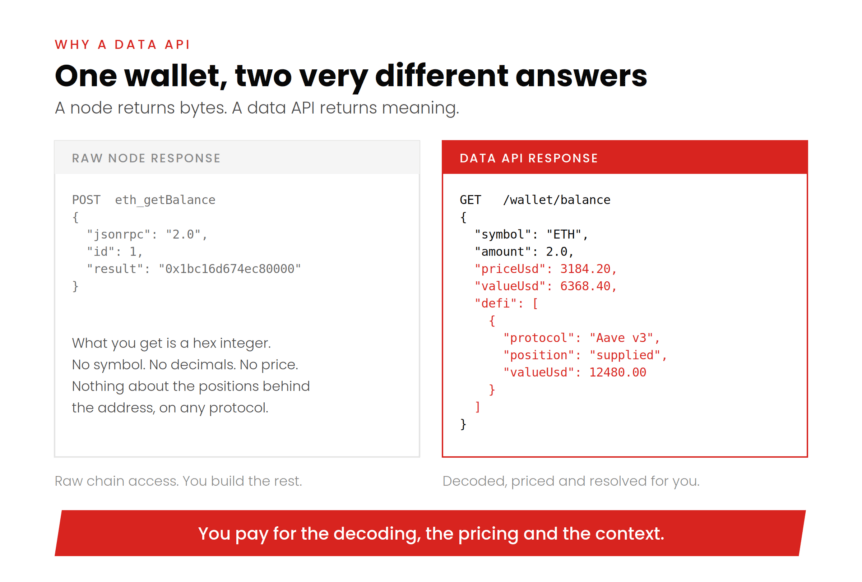
Every crypto app needs data. Very few need the same data.
A portfolio tracker asks what an address holds. A DeFi dashboard asks what a protocol holds. A trading terminal asks what a token trades at right now. Those are three different products.
Picking by brand name is how teams end up paying twice. Picking by question is how they stop.
This guide covers five crypto data APIs. Each one answers a different question well. CoinStats Crypto API leads on wallet, market and DeFi data. DefiLlama covers protocol economics. Codex handles real-time DEX and prediction market data. Glassnode measures the network. Blockscout returns the raw record, decoded.
Our guide to choosing the right crypto API also covers swaps and nodes. This one stays in the data lane.
Not All Crypto Data Is the Same Data
Five kinds of question sit behind the word “data”. Each has its own providers.
Portfolio data answers questions about an address. Balances, positions and value, already priced.
Protocol data answers questions about a protocol. Total value locked, fees, revenue and yields.
Market data answers what something trades at. Prices, candles, liquidity and holder flows.
Network data answers what participants are doing together. Supply distribution, cost basis and exchange flows.
Record data answers what actually happened. Decoded transactions, event logs and verified contract code.
A node gives you none of this. It gives you bytes. This primer on how a blockchain API works explains the gap.
1. CoinStats API (Best Overall)
One API for Markets, Wallets, DeFi and Portfolio Data
CoinStats Crypto API is a unified data layer for developers. It combines market data, wallet data, DeFi positions and portfolio analytics. Token security screening sits in the same schema. Coverage spans 100,000+ coins, 200+ exchanges and 120+ blockchains.
Wallet endpoints return balances and transactions across Ethereum, Solana, EVM chains and Bitcoin. Bitcoin support includes extended public keys (xpub, ypub, zpub). DeFi positions resolve per wallet across 10,000+ protocols. That covers staking, lending and liquidity tied to one address.
Token risk checks flag honeypots, hidden fees, blacklists and unrenounced ownership. Those checks run on EVM chains.
CoinStats API also ships an MCP Server for AI agents. It exposes wallet, DeFi and portfolio data to LLMs. Agents in Claude, Cursor and VS Code query it directly. That portfolio layer is the real differentiator. This best crypto API guide breaks down the endpoints.
Pros
- Market, wallet, DeFi, portfolio and token security in one API
- 120+ blockchains and 100,000+ coins under one key
- Per-wallet DeFi resolution across 10,000+ protocols
- Bitcoin xpub, ypub and zpub support
- Native MCP Server for AI and LLM workflows
- Free tier with credit-based pricing
Cons
- Read-only data layer, so no transaction submission
- REST-first, with no streaming for live event data
Best Use Cases
- Multi-chain portfolio trackers
- DeFi dashboards across staking, lending and LP
- Crypto tax and accounting tools
- AI agents that query data through MCP
- Wallet explorers and embedded widgets
Pricing
Pricing is credit-based with a free tier at signup. Paid plans start at $49 per month. Credits scale with endpoint complexity.
Best suited for: most data-driven builds, from portfolio trackers to AI agents.
Limitation: CoinStats API is a data layer, not a node provider. To broadcast transactions, pair it with RPC infrastructure.
2. DefiLlama
Free Protocol Economics Across Thousands of Protocols
DefiLlama tracks the economics of DeFi itself. It publishes total value locked, fees, revenue, yields and stablecoin supply. Coverage runs across hundreds of chains and thousands of protocols. The methodology is open source, so anyone can audit a number.
The open plan is genuinely free and needs no key. It returns TVL, revenue and fee data plus token prices. Most TVL figures quoted elsewhere trace back to it.
A developer API plan runs $300 per month. It allows 1,000 requests per minute and 1 million calls monthly. Extra calls cost $0.60 per thousand after that. A separate $49 Pro plan covers dashboards rather than API access.
DefiLlama also ships an MCP server plus installable agent skills. Each agent query costs one credit from the same API pool.
Best suited for: yield tools, DeFi dashboards and protocol research.
Limitation: DefiLlama works at protocol level, not wallet level. For per-address positions, pair it with CoinStats API.
3. Codex
Real-Time DEX Data and Prediction Markets in One Schema
Codex is an enriched blockchain data API with two pillars. Do not confuse it with the coding tool of the same name. The first pillar is tokens: real-time prices, OHLCV charts, holder analytics and balances. The second is prediction markets across Polymarket and Kalshi, now at record volume.
Odds, volume, trending events and order books share a single schema. Coverage reaches 70M+ tokens, 700M+ wallets and 80+ networks.
Access runs on GraphQL with WebSocket subscriptions and webhooks. Data freshness sits near one second. TradingView, Coinbase, Uniswap and pump.fun all build on it. A TypeScript SDK, an MCP server and agentic payments cover AI workflows.
The free tier allows 10,000 requests per month with full query access. Growth plans start at $350 per month.
Best suited for: trading terminals, token discovery and prediction market apps.
Limitation: Codex reads onchain markets, not exchange balances or DeFi positions. Pair it with a portfolio layer.
4. Glassnode
Network-Level Metrics for Research Teams
Glassnode measures what a whole network is doing. Its catalogue covers supply distribution, cost basis, profitability and exchange flows. Entity-adjusted metrics strip out transfers between wallets with one owner. That single correction changes most raw onchain numbers.
Coverage spans 1,500+ assets and onchain data from 11 blockchains. The Advanced plan costs $49 per month. It includes 300+ metrics at daily resolution plus API Light access. Professional adds longer history, 10-minute resolution and a credit-based API add-on.
Glassnode ships an MCP server, a CLI and an Excel add-in. Agents can also pay per call in USDC on Base. Metric calls cost five cents with no account required.
Point-in-time metrics never get revised, which keeps backtests honest. That pay-per-call route is new, and it suits research agents well.
Best suited for: research desks, market dashboards and macro-style analysis.
Limitation: Glassnode has no free plan and reads networks, not wallets.
5. Blockscout
Open-Source Explorer Data With a Real Free Tier
Blockscout is the open-source block explorer, exposed as an API. It returns decoded transactions, balances, event logs and verified contract ABIs. One key covers 120+ chains on every plan, free included. Endpoints follow the Etherscan V2 shape, so migrating is mostly a URL swap.
The free plan gives 100,000 credits per day at five requests per second. Builder costs $49 per month for 100 million credits. Pro costs $199 per month at 30 requests per second. Most standard calls spend 20 credits each. Keys come from the developer portal with no card required.
An MCP server runs on the same backend, alongside installable agent skills. The explorer stays open source, so any chain can self-host it. Teams debugging contracts get the same data their users see. Response headers return remaining credits on every call.
Best suited for: wallets, debugging tools and contract-level analytics.
Limitation: Blockscout returns chain records, not aggregated market data.
Side-by-Side Comparison
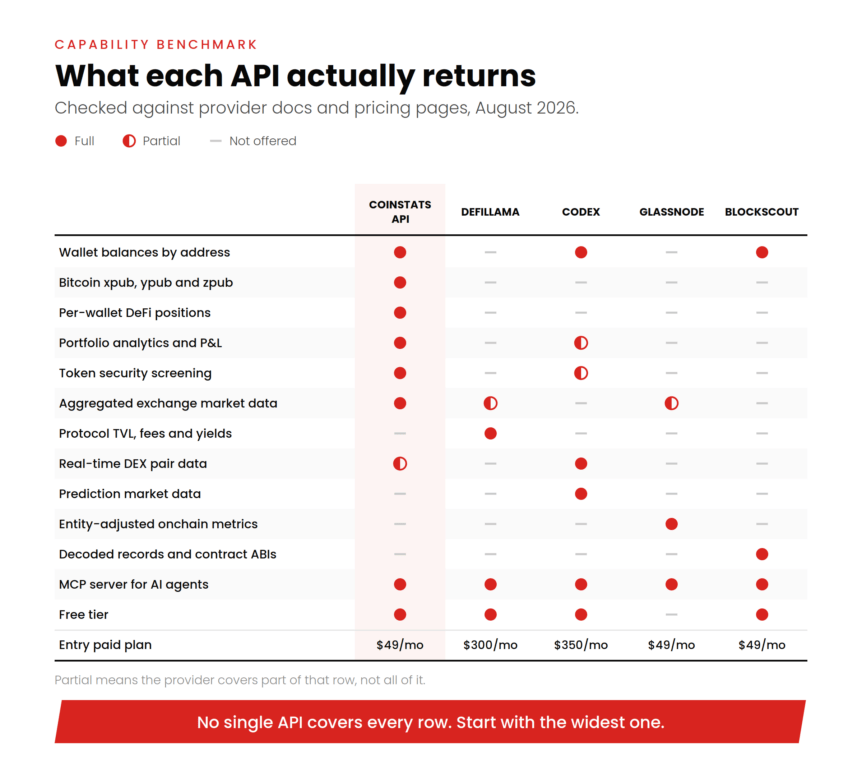
| CoinStats API | DefiLlama | Codex | Glassnode | Blockscout | |
| Primary layer | Market, wallet, DeFi and portfolio | Protocol economics | Real-time DEX and prediction markets | Network metrics | Explorer records |
| Core question | What does this wallet hold? | What is locked in this protocol? | What is this token worth now? | What is the network doing? | What happened in this transaction? |
| Coverage | 100,000+ coins, 120+ chains | Hundreds of chains | 70M+ tokens, 80+ networks | 1,500+ assets, 11 chains | 120+ chains |
| Wallet data | Yes, with DeFi and P&L | No | Balances only | No | Balances and history |
| AI / MCP | Native MCP Server | MCP server and skills | MCP and agent payments | MCP, CLI and pay-per-call | MCP and agent skills |
| Free tier | Yes, credit-based | Yes, open API | Yes, 10,000 calls | No | Yes, 100,000 credits daily |
| Entry paid plan | $49/mo | $300/mo | $350/mo | $49/mo | $49/mo |
| Best for | Most data-driven builds | DeFi research | Trading and discovery | Market research | Contract-level work |
What You Can Build
Portfolio trackers and wallet apps. CoinStats API returns holdings, prices and DeFi positions in one call.
Yield and treasury dashboards. DefiLlama supplies pool APYs, protocol fees and stablecoin supply.
Trading terminals and token screeners. Codex streams live pair data across 80+ networks.
Prediction market products. Codex normalises Polymarket and Kalshi into one schema.
Research and market reports. Glassnode supplies cost basis, supply and flow metrics.
Contract debuggers and audit tools. Blockscout decodes transactions and serves verified ABIs.
AI financial assistants. Every provider here now ships an MCP server for agents.
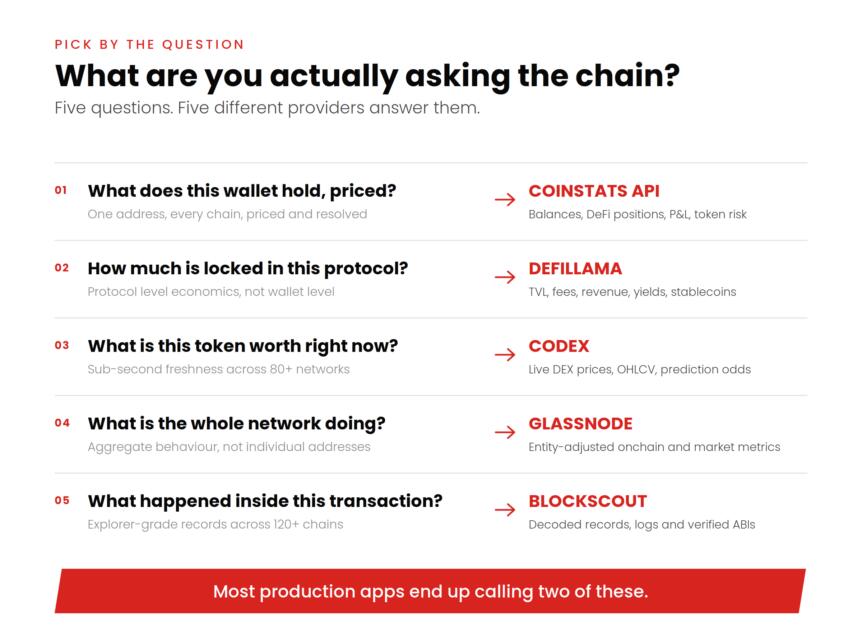
One Provider or Several?
Most production teams do not run on a single API. They layer by question.
Start with CoinStats API for wallet, market, DeFi and portfolio data. Add DefiLlama when you need protocol economics behind those positions. Add Codex when live DEX pricing or prediction markets matter. Layer in Glassnode when the question turns to whole-network behaviour. Reach for Blockscout when you need the decoded record itself.
Two providers cover most products. Three is common at scale. Developers publish their own comparisons too. This hands-on developer comparison is worth a read.
Wrapping Up
There is no single best crypto data API. There is only the right answer to your question.
CoinStats API is the broadest starting point for application data. It suits most crypto use cases, from trackers to AI agents. DefiLlama owns protocol economics and stays free. Codex owns real-time DEX and prediction market data. Glassnode owns network-level research. Blockscout owns the decoded record.
Four of the five start free. Test the free tiers with real calls before you commit.


L3Harris stock retreated early Monday after the defense contractor abruptly parted ways with CEO Christopher Kubasik due to conduct violations. L3Harris (LHX), maker of aircraft components and weapons systems, on Monday said it departed ways with Christopher Kubasik, chairman and CEO, effective immediately. The defense contractor said Kubasik engaged in “conduct that was not consistent with the values of the…
Copyright ©2026 Investor’s Business Daily, LLC. All rights reserved. 87990cbe856818d5eddac44c7b1cdeb8
In Bitcoin news today, Ross Gerber, CEO of Gerber Kawasaki Wealth and Investment Management, argued this week that gold remains easier to use for everyday transactions than Bitcoin, reviving a long-running debate over the asset’s real-world utility.
The comments arrived alongside a sharper attack on Michael Saylor’s Strategy Inc. (NASDAQ: MSTR), which Gerber warned could “nuke” Bitcoin if its leveraged accumulation model unwinds, according to a note shared with Benzinga.
Gerber’s utility argument centers on a simple observation: gold can be exchanged in far more physical settings worldwide than Bitcoin, even after years of industry claims about the cryptocurrency’s payment potential.
Trader Scott Melker pushed back on that framing, arguing that crypto-linked Visa and Mastercard cards already allow holders to spend Bitcoin at nearly any point of sale that accepts plastic.
That distinction matters for anyone tracking Bitcoin payments adoption, since card-rail spending routes through a custodian converting BTC to fiat at the point of sale rather than merchants accepting Bitcoin directly on-chain.
Bitcoin News: Saylor’s Leverage Model Draws Fire

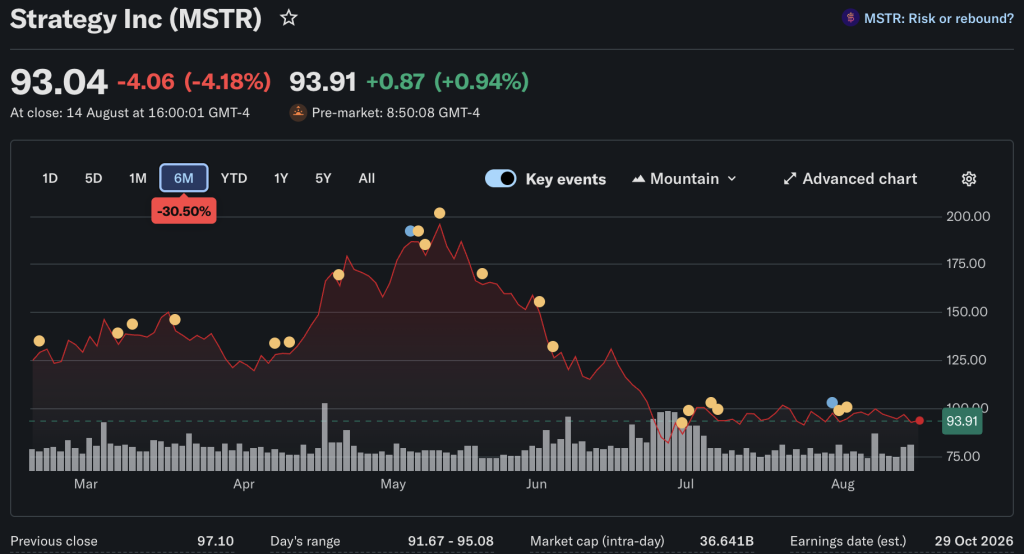
Gerber’s more pointed criticism targets Strategy’s approach of selling equity to fund Bitcoin purchases. He questioned why an investor would accept diluted exposure at a premium to the underlying asset, a dynamic visible in Strategy’s stock, which trades at roughly 1.61x its Bitcoin holdings.
“The fact they can sell stock at some inflated valuation to then buy Bitcoin is crazy bad math for the investor. Why would you buy $100 of Bitcoin for $200?”
Gerber said Bitcoin’s periodic hard corrections could force Strategy into selling if its debt-funded structure comes under pressure, calling that scenario the mechanism that could “nuke” the cryptocurrency.
Strategy has countered that its shift toward perpetual preferred stock, which carries no maturity date, insulates the company from forced liquidations even in an 80% drawdown.
The company held 629,376 BTC worth more than $72Bn as of its latest disclosure, after adding 430 BTC for roughly $51.4M, yet its stock has lagged Bitcoin’s own price performance over the same stretch.
Discover: Everyone’s Got a Take. Get Free $25 to Actually Trade Yours
Bitcoin Miners Betting Big on AI
Former Bitcoin miner @RiotPlatforms just locked a ~$9B, 20-year lease with @AnthropicAI for 191 MW of AI capacity in Texas.
More and more miners are following the profits towards AI infra; meanwhile, mining hashrate is down 21% from 2025 highs…pic.twitter.com/Fyr0iQxcLa
—
𝕄 𝕁
(@skizdidlyidler) August 16, 2026
In other Bitcoin news, Gerber also questioned whether Bitcoin’s network foundation is weakening as major miners redirect infrastructure toward artificial intelligence and high-performance computing.
That trend is documented rather than speculative: several listed miners have already converted mining capacity into AI hosting contracts, a shift detailed in coverage of Riot Platforms’ recent AI leasing arrangement.
Core Scientific, for example, has been converting a 300-megawatt Texas facility, once used for Bitcoin mining, into an AI data center campus, with colocation revenue now outpacing its digital-asset self-mining revenue.
CoinShares projections cited in coverage of the trend suggest mining revenue could fall from roughly 85% of total revenue in early 2025 to under 20% by the end of 2026 for miners with significant AI contracts, according to crypto.news.
That reallocation of capital doesn’t signal the disappearance of Bitcoin mining, but it does mean the economics increasingly favor AI hosting over pure hash-rate production, a tension that supports part of Gerber’s broader skepticism without proving his claim that Bitcoin mining AI conversions have permanently capped the network’s upside.
Trade Bitcoin on Bybit and Get a Chance to Win Our $1,000 USDT Airdrop
The post Gerber Warns Strategy’s Bitcoin Leverage Could Trigger a Selloff appeared first on Cryptonews.


Private payment systems on Ethereum can already hide information using cryptographic proofs, but getting those transactions onto the blockchain still takes extra infrastructure, and some designs route users through relayers, outside services that submit the transaction on their behalf.
Frame Transactions is one of 66 proposals on the table for Hegotá, expected to follow this year’s Glamsterdam release and ship in 2027, and developers will now consider what they can realistically build, test and release on time.
Two accompanying proposals handle what breaks when many people transact privately through the same account. Keyed Nonces, or EIP-8250, would let transactions use separate counters instead of queueing behind a single one, so a delayed transaction no longer holds up everything behind it.
Separately, EIP-8272 would let a transaction prove itself against a recent cryptographic record without depending on information that might change while it waits.
Together, the three would remove some of the outside infrastructure privacy applications currently need.
Ethereum itself would not become private, however. Sending ETH between two normal addresses would stay as visible as it is today. The hiding is still done by the applications, which would simply need less outside machinery to do it.
Frame Transactions is not guaranteed to ship. While it has been marked as considered for Hegotá, that falls short of approval, to progress.
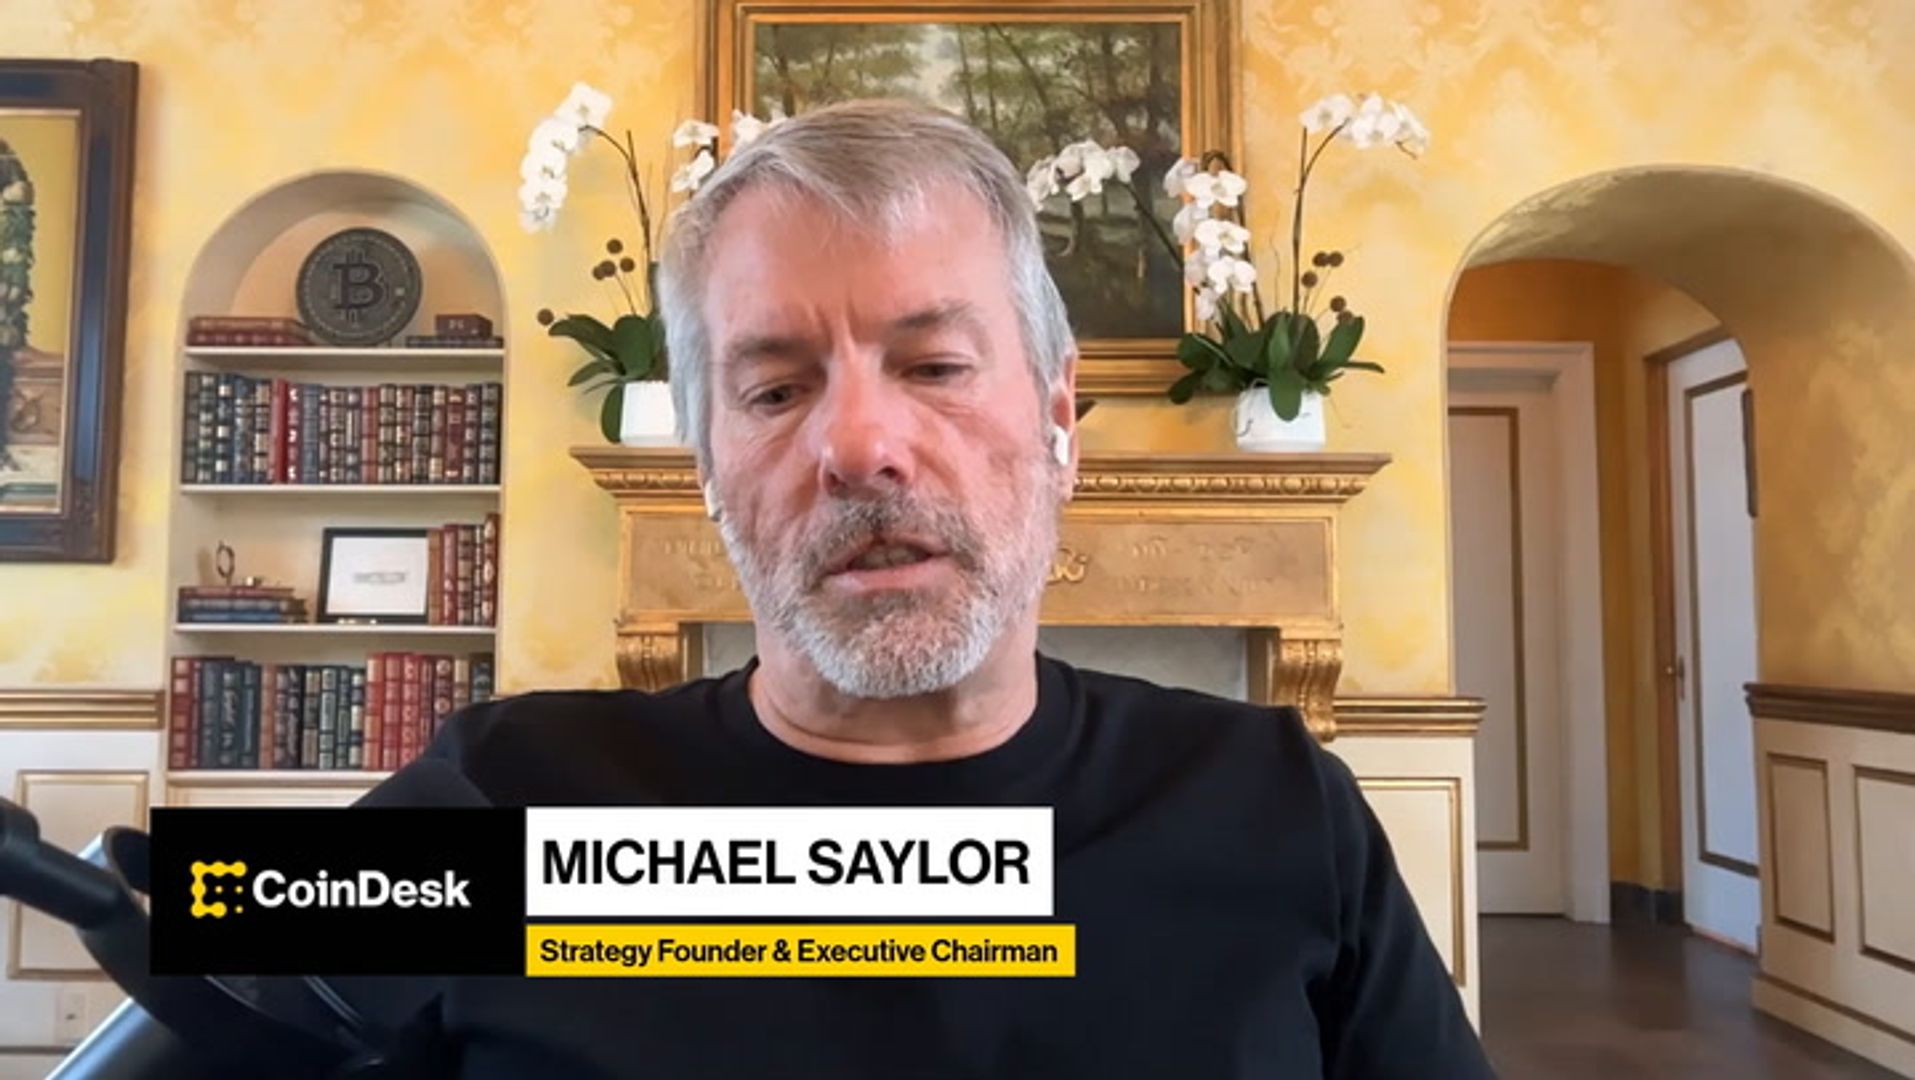
Bitcoin treasury firm Strategy (MSTR) raised $333.7 million last week through the sale of 3.46 million shares of common stock, according to a Monday filing.
The company did not buy or sell any bitcoin during the week ended Aug. 16, leaving its bitcoin reserve unchanged at 840,447 BTC. The holdings were acquired for $63.36 billion at an average price of $75,385 per bitcoin, including fees and expenses.
Strategy used $132.2 million of the stock-sale proceeds to repurchase 1,388,720 shares of its variable-rate preferred stock, STRC. It allocated another $52.4 million to STRC dividends and added approximately $150 million, to its U.S. dollar reserve.
The reserve increased to $4.80 billion as of Aug. 16, extending Strategy’s USD duration to 2.8 years. It is intended to support dividend payments on the company’s preferred stock and interest payments on its outstanding debt.
Following the latest transactions, Strategy has $653 million remaining under its preferred-stock repurchase program and $1 billion available under its MSTR common-stock repurchase program.
MSTR shares rose 1.3% in premarket trading, while bitcoin gained more than 1% over the past 24 hours to trade near $63,500.
Crypto World
Bitway (BTW) Continues to Steal the Show as Bitcoin (BTC) Holds Above $63K: Market Watch
Bitcoin’s dull price movements over the weekend sort of extended as the new business week started, but the asset has managed to decisively reclaim the $63,000 level as of now.
RAIN, ZEC, and HYPE have emerged as today’s top performers from the larger-cap alts, while ETH has neared $1,900 once again.
BTC Above $63K
Bitcoin stood tall at the beginning of the previous business week when it traded comfortably at $65,000 and even tried to break out even higher. However, it was quickly stopped at $65,400 and slipped to $63,800. The bears appeared to be in control for most of the week.
After a couple of failed rebound attempts, both of which were halted at $64,400, BTC went south once again. This time, it dipped to $62,800. Another bounce-off followed, but the bears kept a tight control of the market and drove bitcoin south to a 10-day low on Friday at $62,500.
The cryptocurrency finally reacted positively and jumped by a grand almost immediately. It failed to continue recovering, though, and calmed at $63,000, where it spent the entire weekend without any moves in either direction.
It dipped to $62,600 on Monday morning before it pumped by $1,000 to $63,600. Although it was stopped there, it still trades above $63,000 as of press time.
Its market cap has returned to $1.270 trillion on CG, while its dominance over the alts stands below 57%.

BTW Keeps Pumping
While even most of the mid- and lower-cap alts have remained sideways lately, Bitway (BTW) has stolen the show once again. The asset is up by 16% daily, 80% weekly, and a whopping 460% since this time last month. It currently trades close to $0.35, and it has become the 69th-largest cryptocurrency by market cap.
The most substantial gainers from the larger-cap alts have produced a lot more modest increases. ZEC and RAIN are up by around 4%, while HYPE has jumped by 3% to $59. ETH is close to $1,900, while XRP continues its battle with the key $1.00 level.
The cumulative market cap of all crypto assets has added less than $20 billion daily and remains below $2.250 trillion on CG.

The post Bitway (BTW) Continues to Steal the Show as Bitcoin (BTC) Holds Above $63K: Market Watch appeared first on CryptoPotato.
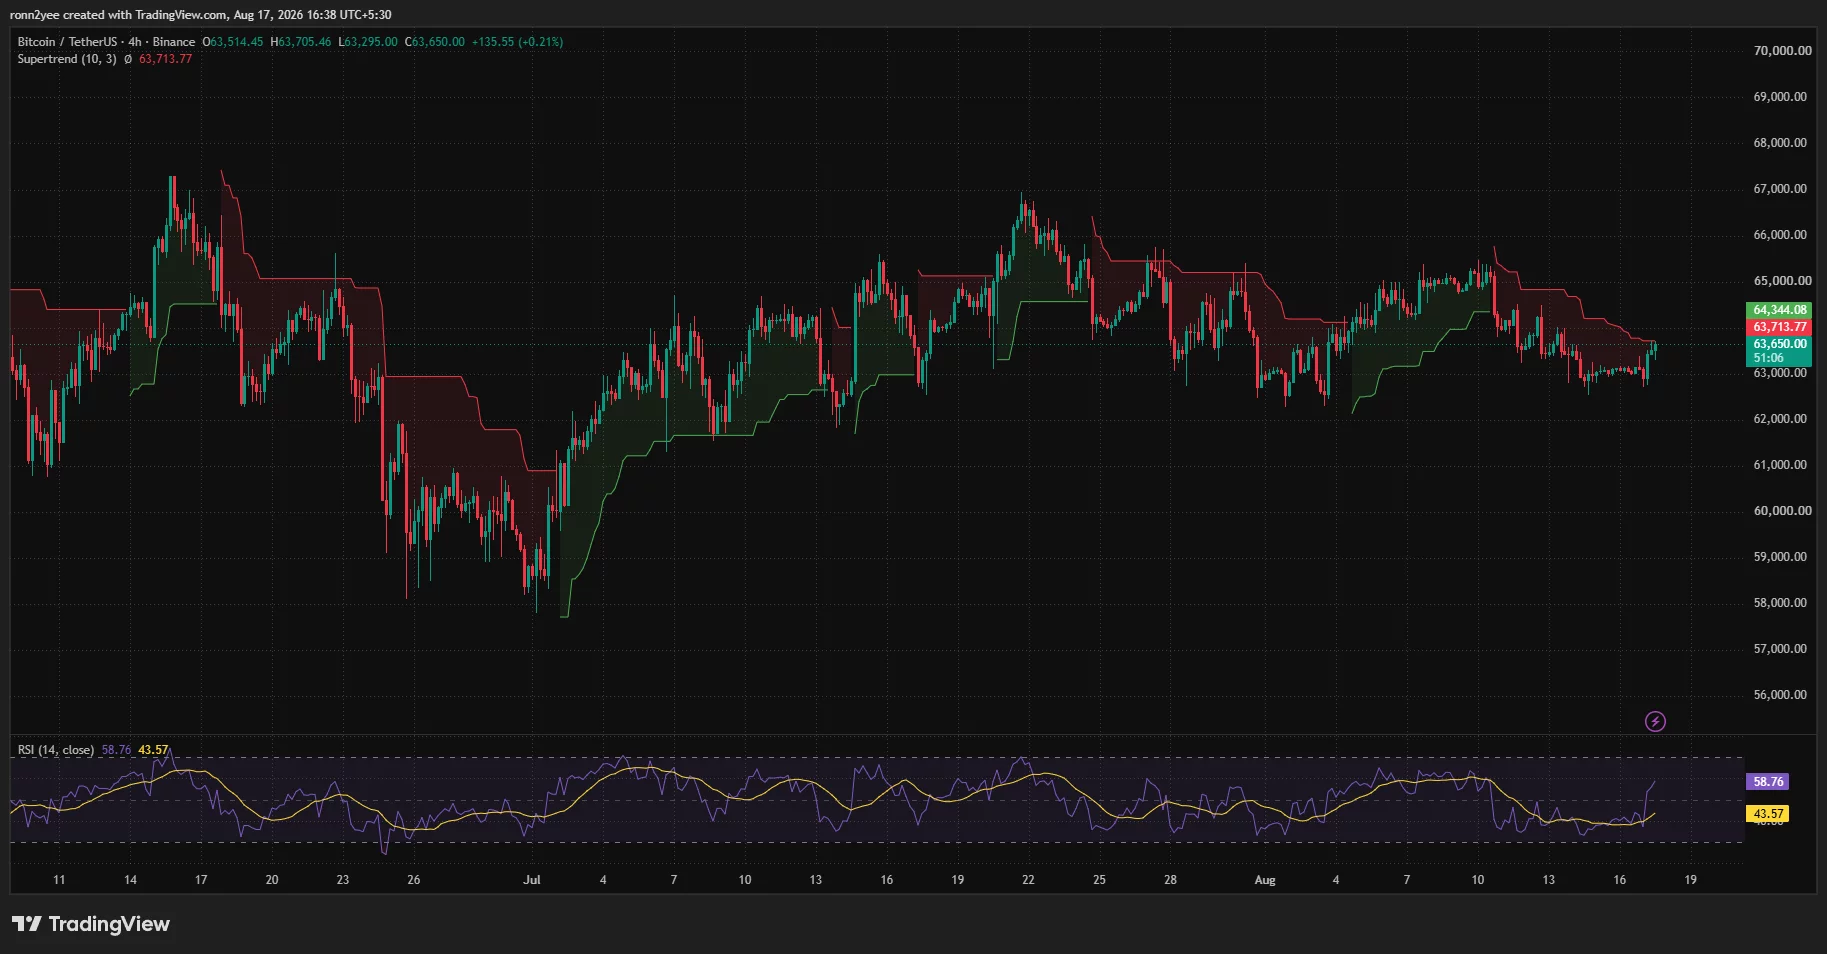
Bitcoin price recovered from the $62,700 area as buyers defended a key support zone, but ETF outflows, weak trend signals, and heavy overhead liquidity continue to limit the rebound.
Summary
- Bitcoin price rose 1.2% to about $63,650 after finding buyers near $62,700.
- The 4-hour RSI climbed to 58.76, showing an improvement in short-term momentum.
- Nearly $390 million left US spot Bitcoin ETFs during the previous trading week.
- Liquidity clusters near $64,100 and $64,800 could shape Bitcoin’s next move.
Bitcoin price action today
According to data from crypto.news, Bitcoin (BTC) price traded near $63,650 on Aug. 17, up about 1.2% on the day after recovering from an intraday low of $62,751.
The move followed several unsuccessful attempts by sellers to push BTC below the $62,500–$62,700 region. Bitcoin had fallen from above $65,000 earlier in August, leaving the market vulnerable to a deeper correction before buyers returned near monthly support.
BTC reached an intraday high of $63,717 during the recovery. The bounce also moved the price above the $63,166 level, which marks the 78.6% Fibonacci retracement of the advance from $57,803 to $82,864.
Holding above that retracement level keeps Bitcoin inside the range formed after its June sell-off. However, the daily chart shows that BTC has not yet reversed the wider decline from its May peak.
The recovery coincided with modest gains in US equity futures. Nasdaq 100 futures rose as technology shares led a broader risk-asset rebound, while lower expectations for another aggressive Federal Reserve rate increase supported demand for Bitcoin.
The dollar fell to a 10-day low as Treasury yields eased. A weaker dollar can support assets priced in dollars, although elevated bond yields remain a source of competition for capital.
What is driving Bitcoin’s rebound?
Bitcoin’s immediate recovery came from buying pressure around $62,500 rather than a clear improvement in institutional demand. The level has acted as support several times since late July, encouraging short-term traders to buy after the latest decline.
The 4-hour chart shows that momentum improved as BTC moved back toward $63,700. The relative strength index rose to 58.76 from near 40, while its signal average remained lower at 43.57.
An RSI reading above 50 indicates that short-term buying momentum has overtaken selling momentum. Bitcoin still needs to hold the recovery through several 4-hour closes because previous rebounds in August stalled between $64,500 and $65,500.
The Supertrend indicator also shows that the reversal remains incomplete. BTC was trading slightly below the indicator’s resistance line near $63,714 at the time of the chart, while another important level stood near $64,344.
A sustained move above both levels would give buyers more control and place the early-August highs back in view. Rejection near the same area would leave Bitcoin exposed to another test of $63,000.
US ETF outflows keep Bitcoin bulls cautious
The rebound has developed despite continued withdrawals from US spot Bitcoin exchange-traded funds. According to SoSoValue data, the products recorded $389.71 million in combined net outflows between Aug. 10 and Aug. 14.
Investors withdrew $144.67 million on Monday, followed by further outflows of $61.16 million on Wednesday, $131.13 million on Thursday, and $57.63 million on Friday.
The weekly withdrawals followed the funds’ strongest inflow week since April, suggesting that US institutional demand has not yet established a steady recovery. Continued redemptions could make it harder for Bitcoin to sustain a move above $65,000.
US regulatory expectations have also weakened. Polymarket traders assigned the CLARITY Act a roughly 20% chance of becoming law in 2026 on Aug. 17, down from above 80% earlier in the year.
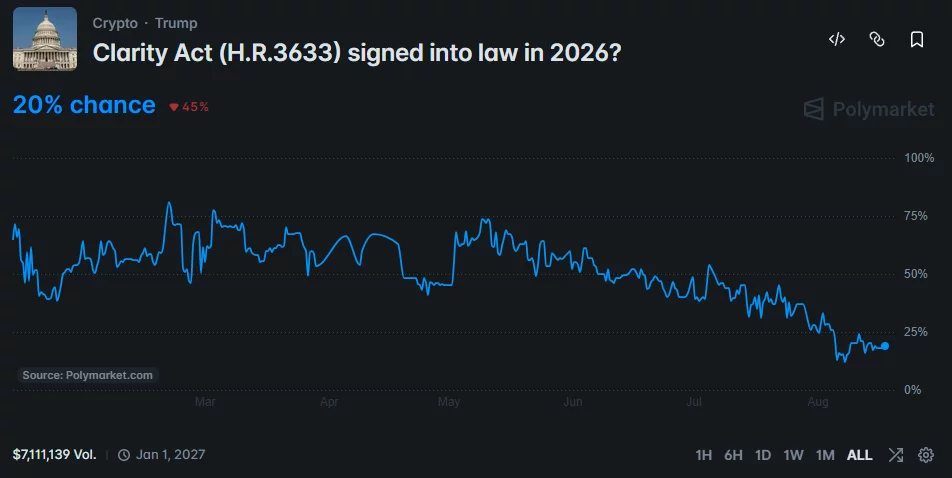
The decline followed the Senate’s failure to advance the crypto market structure legislation before its recess. Lower passage odds do not directly determine Bitcoin’s price, but they reflect fading expectations that US lawmakers will provide clear rules for crypto markets this year.
Bitcoin liquidation map points to $64,000 battle
CoinGlass’s one-week liquidation heatmap shows large concentrations of leveraged positions above Bitcoin’s current price.
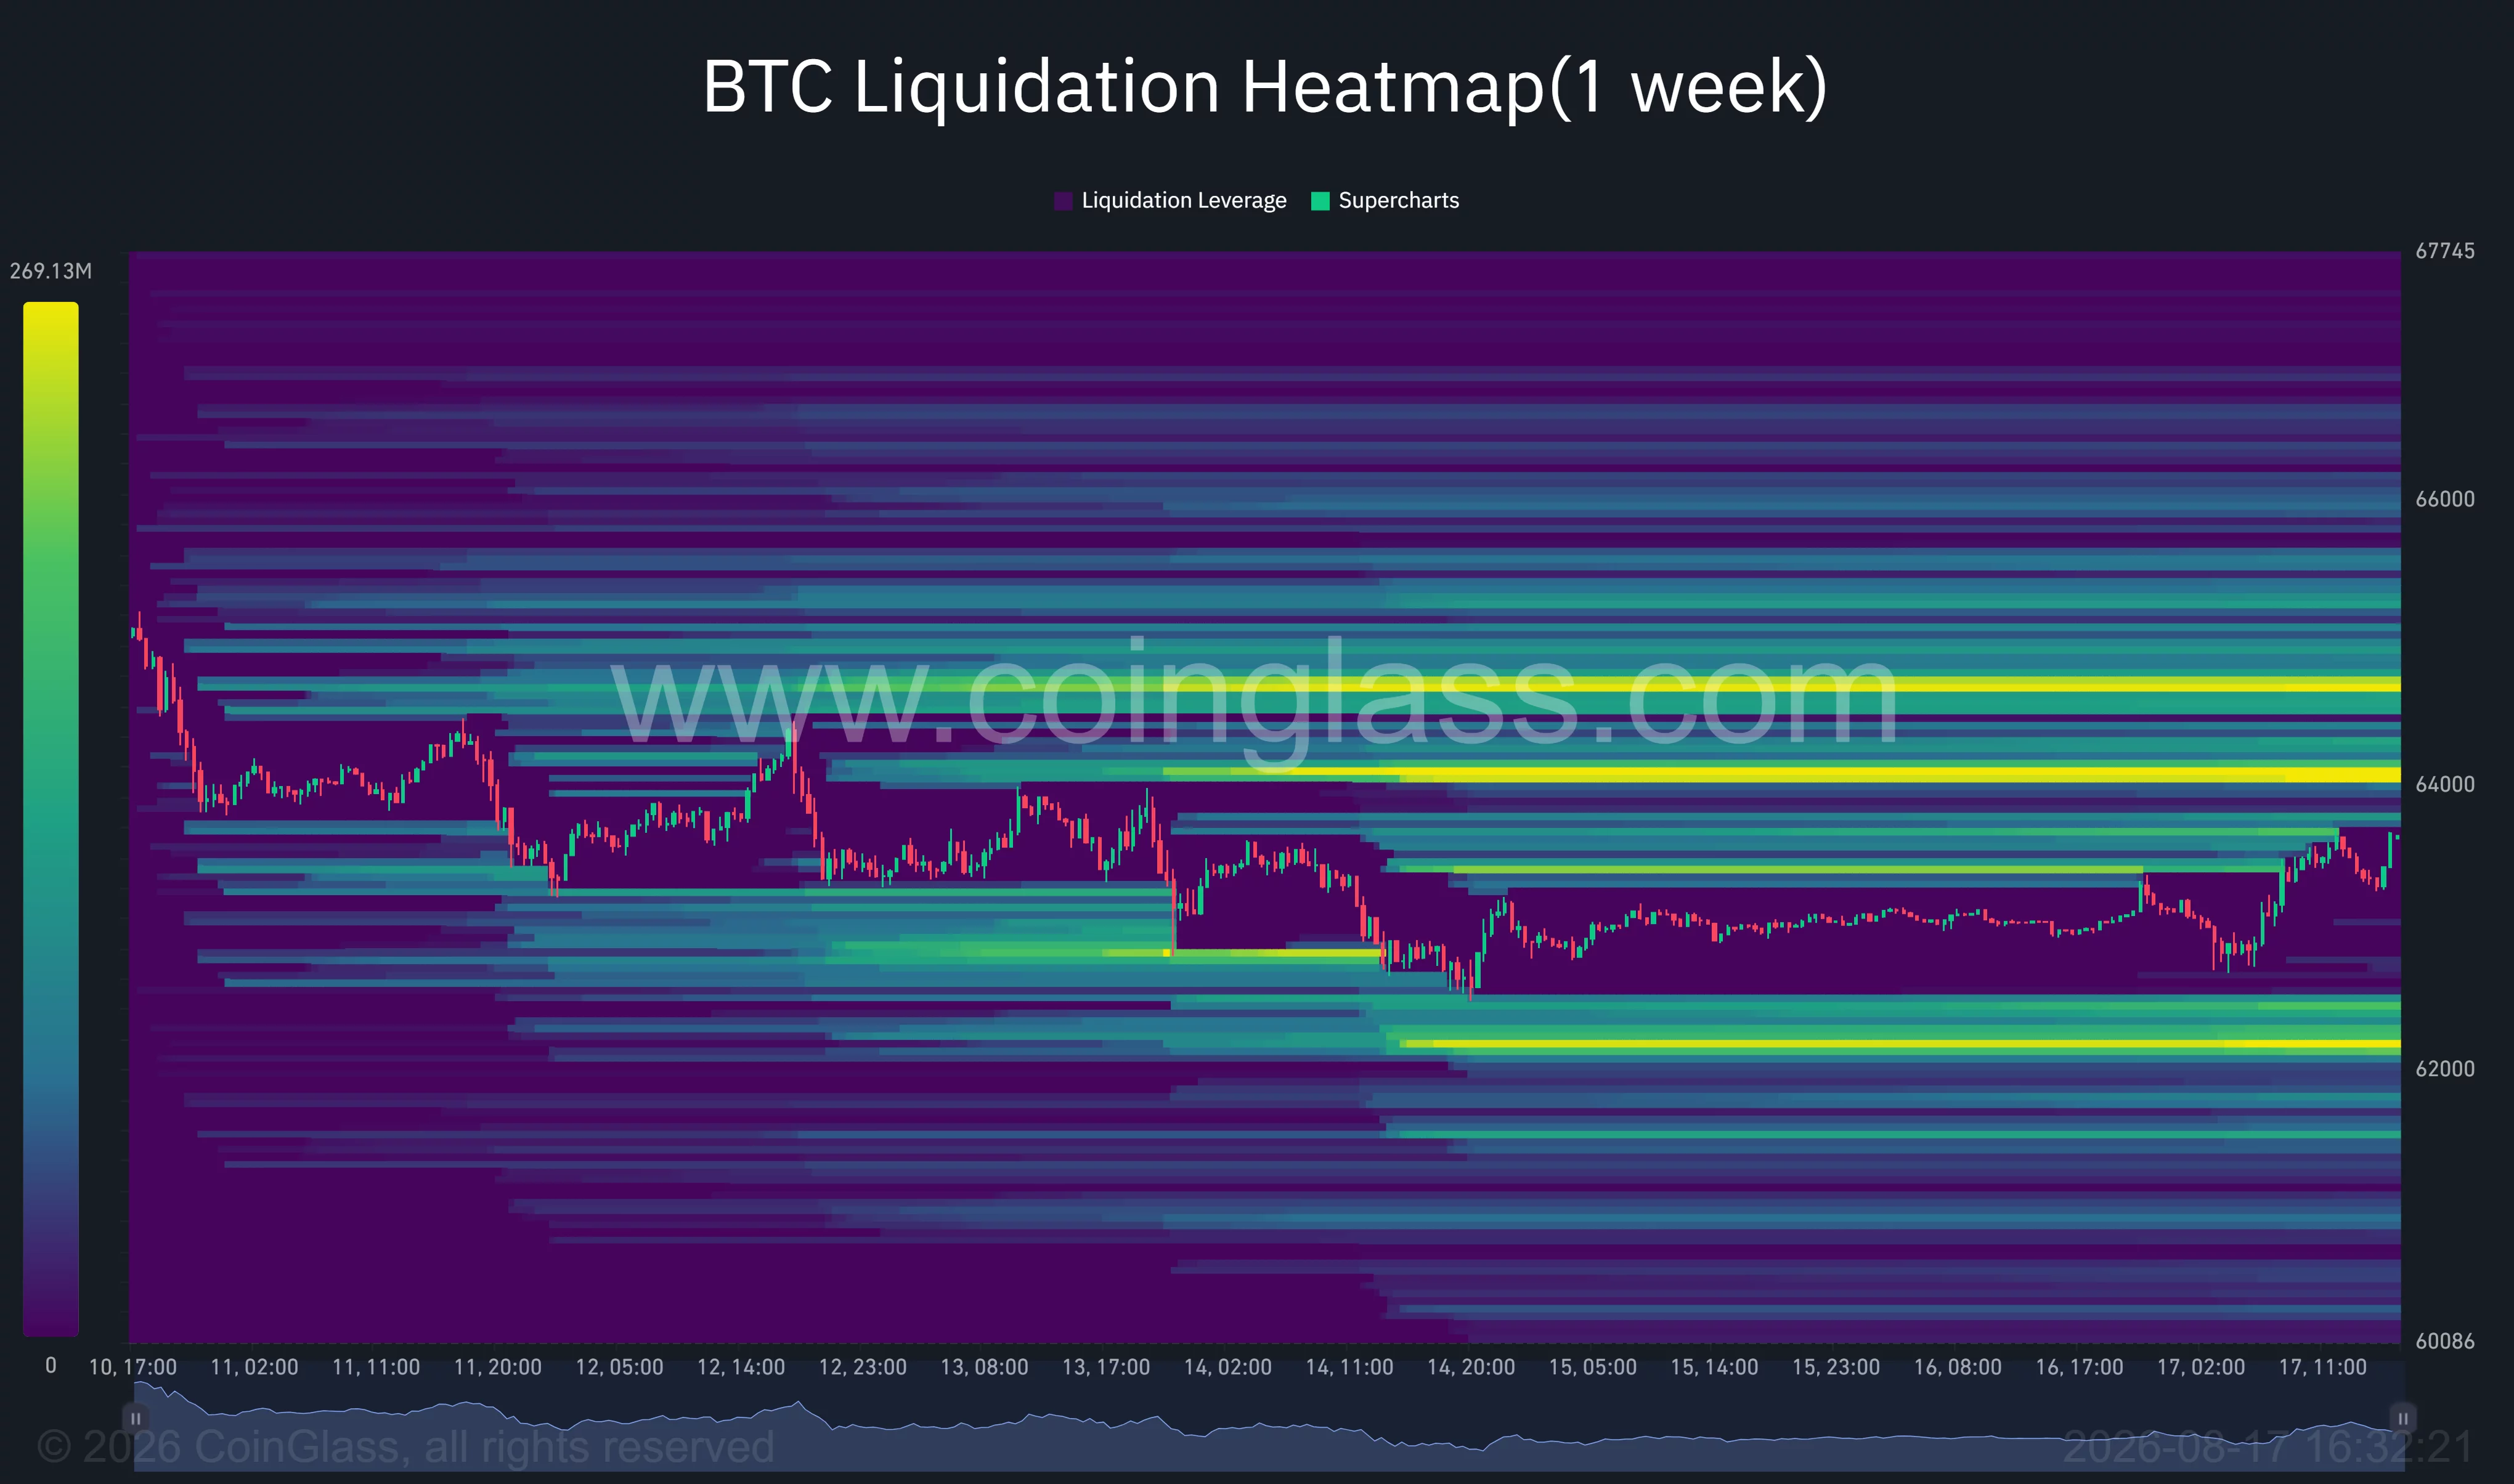
The nearest major liquidity band sits around $64,000–$64,200. A brighter and larger cluster appears between approximately $64,700 and $64,900, while additional positions are concentrated above $65,000.
Price often moves toward areas with heavy liquidity because those levels contain stop orders and liquidation points. If Bitcoin clears $64,200, forced closures of short positions could accelerate the move toward $64,800 and then $65,500.
The heatmap also shows a large downside cluster near $62,200–$62,300. Failure to hold $62,700 could therefore pull the market toward that liquidity before buyers get another opportunity to defend the broader range.
Lower liquidity also appears around $61,500, with the daily swing low near $57,800 remaining the larger bearish reference point.
The wide separation between major liquidation zones means BTC could experience sharp price swings even if the overall daily range remains unchanged.
Bitcoin must reclaim $65,500 to change the trend
Analyst Ted Pillows said Bitcoin had held above $62,000 but needed to break $65,500 to develop stronger bullish momentum.
“Bitcoin held above the $62,000 level and is now bouncing back,” Pillows wrote on X.
He identified $61,900 as the main downside threshold and said a loss of that level could expose the $59,000–$60,000 region.
The daily chart supports a cautious outlook. The Aroon Down reading stood at 42.86%, while Aroon Up was at 0%, showing that the market had not recently established a meaningful new high. Bear Bull Power also remained negative at -834.98, indicating that sellers retained an advantage on the wider timeframe despite the daily gain.
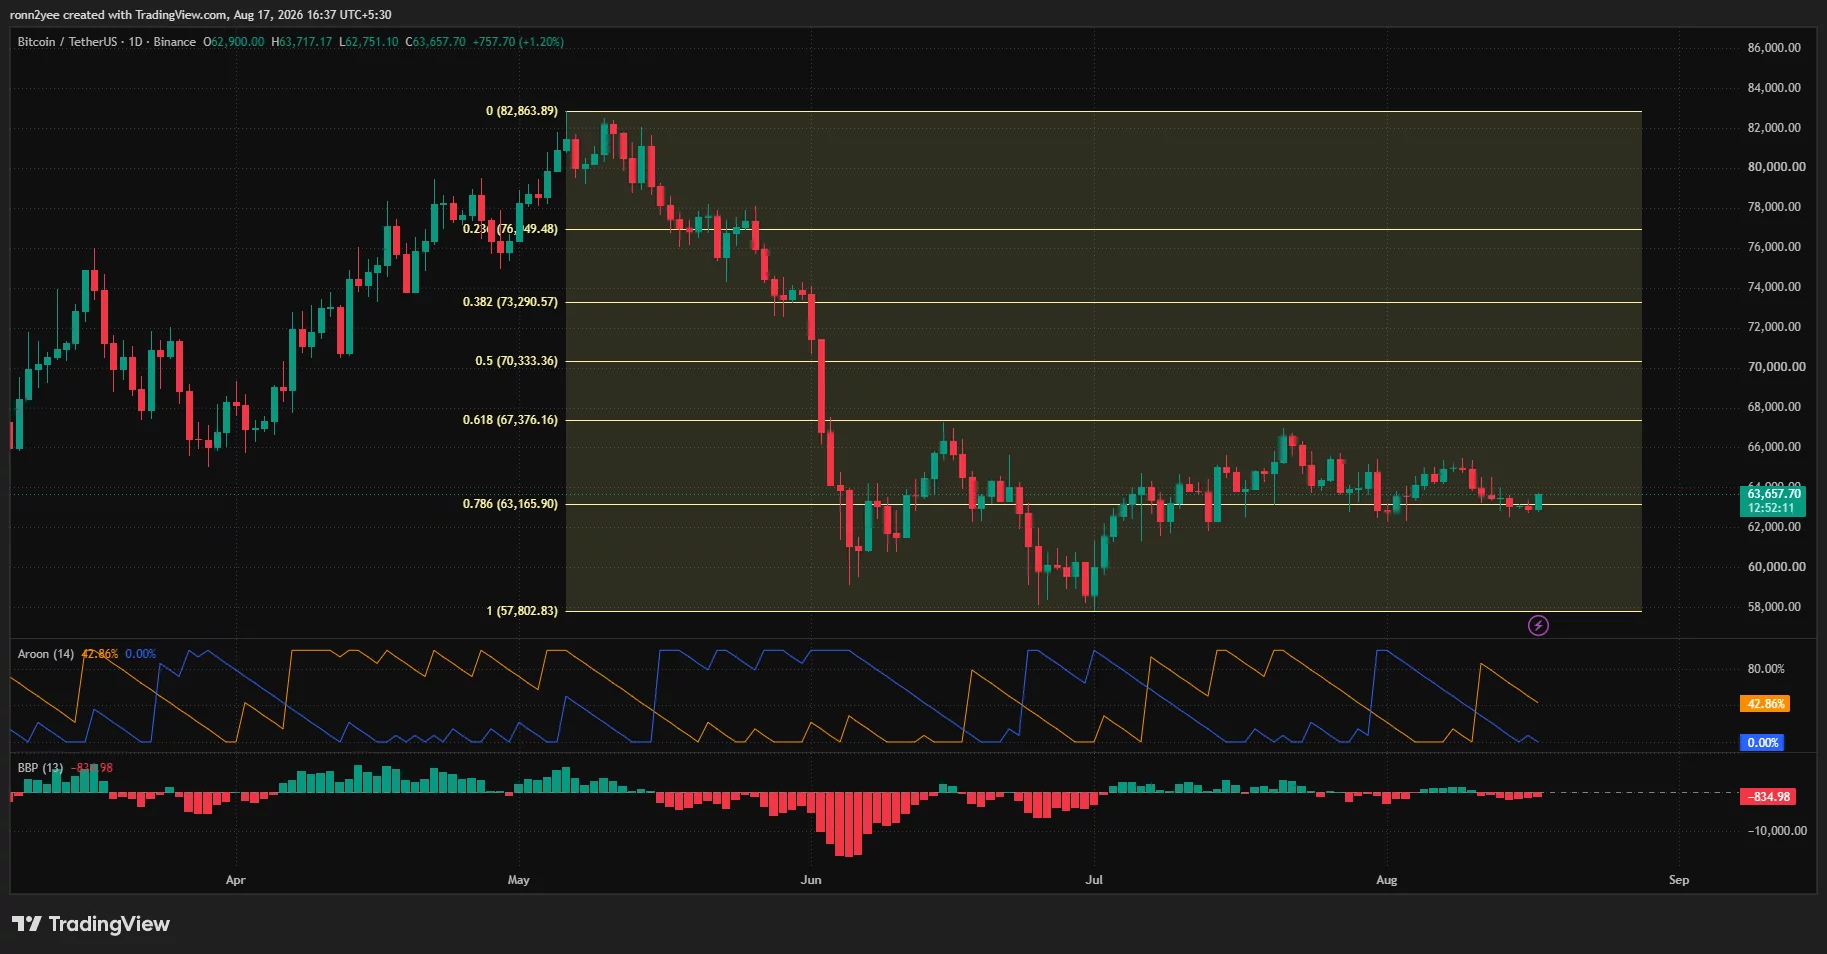
For the bullish case, Bitcoin must first close above $63,700 and $64,344. A break through the liquidation clusters near $64,800 would then allow buyers to challenge $65,500, followed by the June resistance around $67,376.
A daily close above $67,376 would mark a stronger change in market structure and open a possible move toward the 50% Fibonacci level at $70,333.
The bearish case begins with another rejection below $64,000. A drop through $63,166 would weaken the latest recovery, while losses below $62,200 and $61,900 could trigger liquidations toward $60,000.
Geopolitical and energy-market risks may add to that volatility. Notably, Brent crude rose above $89 as US-Iran negotiations remained stalled and shipping through the Strait of Hormuz slowed.
Only five commodity vessels crossed the strait on Saturday, compared with 31 during the previous weekend. Higher oil prices could renew inflation concerns and keep US interest rates elevated, limiting the amount of capital available for risk assets.
Bitcoin’s rebound has therefore protected the $62,500 floor, but the move remains a recovery inside a broader range. A break above $65,500 would strengthen the bullish case, while a loss of $61,900 would shift attention back to $59,000–$60,000.
Disclosure: This article does not represent investment advice. The content and materials featured on this page are for educational purposes only.
[PRESS RELEASE – Kingstown, Saint Vincent and the Grenadines, August 17th, 2026]
BITmarkets has published a new study, Crypto and Elite Athletes: More Than Just a Sponsorship, exploring what happened when crypto’s rapid rise met the world of elite sport. From NFT collections and fan tokens to equity deals and salaries converted into bitcoin, the study looks behind the headlines at how some of the biggest names in sport became involved with digital assets.
Following its recent analysis of football clubs and competitions, BITmarkets has now shifted the focus from teams to individual athletes across football, basketball, American football, baseball and tennis. Rather than simply asking who signed the biggest deal, the study compares how the partnerships worked, what each athlete brought to them and how the market changed after 2022.
Which Athletes Made the Top 10?
The ranking brings together Cristiano Ronaldo, Lionel Messi, Tom Brady, Stephen Curry, Shohei Ohtani, Serena Williams, Naomi Osaka, Trevor Lawrence and Shaquille O’Neal, together with Klay Thompson and Andre Iguodala. The familiar names, however, are only the start of the story. The full chart shows how differently the deals were built, from multi-year ambassador roles and NFT projects to venture investments, equity stakes and payments converted into crypto assets.
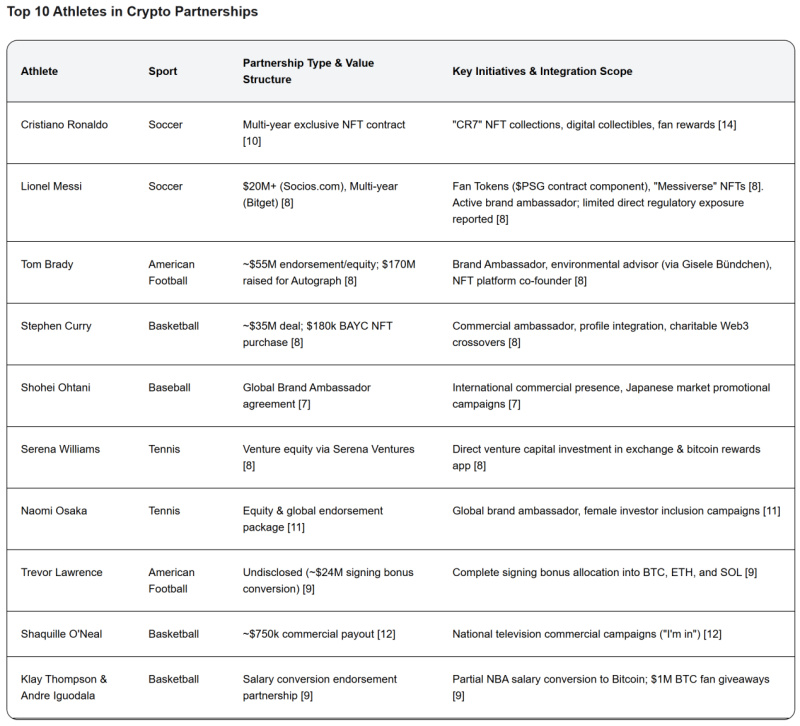
How Big Did Crypto Sponsorship Become?
BITmarkets notes that global crypto sports sponsorship spending exceeded $742 million in 2022 across 230 active contracts. In the NBA, crypto moved from the 43rd-largest corporate sponsorship category to the second-largest within a single season, generating an estimated $100 million to $150 million in annual team and league revenue.
Those figures help explain why athlete deals quickly became more ambitious than standard advertising contracts. Some ambassadors received equity or tokens alongside promotional fees, while others chose direct exposure to crypto through payment conversions. The study traces examples ranging from Russell Okung converting half of his NFL salary into bitcoin to partnerships in which Klay Thompson and Andre Iguodala converted parts of their salaries and supported bitcoin giveaways for fans.
From Hype to a More Cautious Model
The market disruption of 2022 changed that picture. High-profile corporate failures and tighter regulatory scrutiny reduced the appetite for sweeping promotional campaigns. In their place came a more selective model focused on compliant financial infrastructure, clearer disclosure and practical uses for the technology.
That change may be the study’s most revealing finding. Digital collectibles and fan tokens are increasingly being linked to tangible benefits such as physical rewards, stadium privileges and voting rights. The story is therefore not simply one of crypto sponsorships disappearing after the boom. It is one of the market learning what these partnerships need to offer if they are to last.
The complete study shows how every deal in the Top 10 was structured, which partnerships went beyond a traditional endorsement and how the market’s legal and regulatory reckoning changed the playbook. The full chart and supporting sources are available on the BITmarkets website.
About BITmarkets
BITmarkets is a cryptocurrency exchange that offers 24/7 support. Traders can engage in trading over 200 cryptocurrencies, as well as gain access to daily market updates and diverse educational materials. Security is a top priority at BITmarkets, with 99.9% of client funds held in cold storage. BITmarkets continues to reshape the way digital assets are used by both retail and institutional clients, focusing on making cryptocurrency more accessible, straightforward and better connected to the broader financial world. Users can learn more about BITmarkets’ license and regulatory framework, and for general information, visit www.bitmarkets.com or the exchange’s listing on CoinMarketCap.com.
The company values the trust placed in the BITmarkets brand. Users are advised to remain cautious of fraudulent websites, communications or social platforms impersonating BITmarkets or using similar branding, such as its name or logo. URLs should be verified and interactions should take place only through official channels. BITmarkets will never request sensitive information via unofficial or unsolicited messages. If in doubt, users can contact the company through the official support desk.
Crypto assets are unregulated, decentralised and highly volatile assets that entail substantial risks, and investors may lose all invested capital. Past or current performance, including unrealized gains, does not guarantee future results.
The post BITmarkets Publishes New Study Ranking the Top 10 Athletes in Crypto Partnerships appeared first on CryptoPotato.

The top holders of SpaceX stock are a who’s who of tech giants and big name investors. A series of filings show that Alphabet, Nvidia and Peter Thiel own huge stakes in SpaceX — as does, of course, CEO Elon Musk. Musk is the largest shareholder of SpaceX, controlling roughly 6.42 billion shares or 48.8% of the company, according to…
Copyright ©2026 Investor’s Business Daily, LLC. All rights reserved. 87990cbe856818d5eddac44c7b1cdeb8
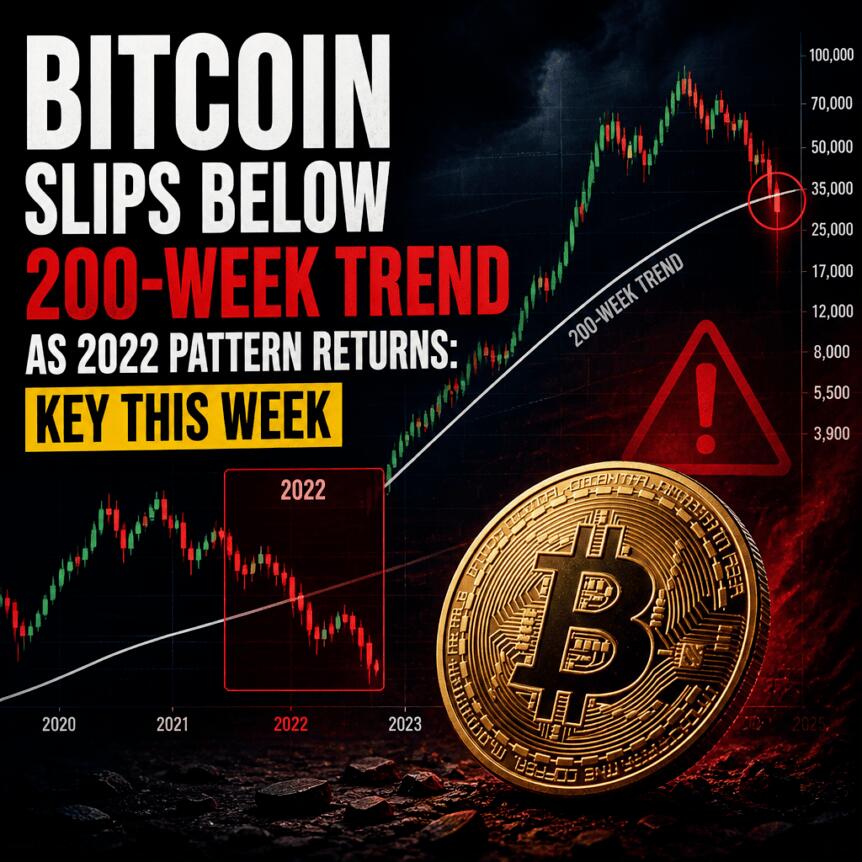
Bitcoin is starting the new week around $63,000, but the market’s technical outlook remains weighed down by history: traders are watching for confirmation of a weekly breakdown after last week’s close slipped below Bitcoin’s long-term 200-week moving average (SMA).
At the same time, macro catalysts are building. Federal Reserve minutes from the July meeting are due this week, and Japan’s second-quarter GDP release underscored risks to global liquidity even as U.S. equities hit fresh highs—an unusual backdrop that some on-chain and sentiment analysts say is leaving Bitcoin sidelined.
Key takeaways
- Bitcoin traded in a roughly $57,700 to $67,300 range, and last week’s close fell below the 200-week SMA near $64,216.
- Options pricing suggests close to a 70% chance the Federal Reserve holds rates at the September meeting, following softer inflation signals earlier.
- Japan Q2 GDP came in below expectations, adding to concerns about “global tightening” and potential knock-on effects for risk assets.
- Glassnode highlights a sentiment mismatch: consumer confidence is near decade lows while U.S. stocks reach record territory.
- CryptoQuant points to growing whale-driven exchange inflows, which are reversing some of the prior trend of BTC moving off exchanges.
Weekly close below the 200-week SMA reignites bear-market parallels
After last Sunday’s weekly close, Bitcoin saw a modest rebound, posting local highs near $63,655 on Bitstamp. However, TradingView data suggests the broader week is beginning with price action still trapped inside a narrow consolidation band, with neither bulls nor bears able to establish a decisive move.
Analyst Benjamin Cowen emphasized that BTC/USD has returned below the 200-week SMA. In earlier reporting from Cointelegraph, the 200-week line was described as a defining feature of the 2022 bear market—acting as resistance after Bitcoin capitulated below it in August before entering a long bottoming phase.
“What is interesting is how in both summer 2022/2026, Bitcoin capitulated below the 200W SMA, then bounced, then gave it up in mid-August,” Cowen wrote on X.
Traders are also watching specific levels. Rekt Capital said Bitcoin failed to reach his targeted weekly-close level of $63,220, which he argues keeps the door open for additional downside. In his view, a rejection from that zone would confirm a breakdown and potentially push price lower within the existing approximate $58,000 to $66,000 range.
“A rejection from $63,220 would fully confirm the breakdown and send price lower within the current ~$58,000-$66,000 Range,” Rekt Capital wrote on X.
Fed minutes and odds of a hold: markets shift from hawkishness to pause
This week’s macro focus centers on the release of preliminary Purchasing Managers’ Index (PMI) readings for manufacturing and services, alongside the July Federal Reserve minutes expected on Wednesday.
Recent inflation data has been influential in shaping expectations. Cointelegraph previously noted that last week’s CPI and PPI releases pointed to a softer-than-expected inflation trajectory, prompting traders to reconsider the likelihood of additional rate hikes.
According to CME Group’s FedWatch Tool, markets are currently pricing in nearly a 70% probability that the Fed will hold rates at the 3.50%–3.75% range for the September meeting. That compares with roughly 42% odds a month earlier.
Analysis from Mosaic Asset Company—citing CPI coming in at 3.4% year-on-year—argues that moderating inflation helps prevent the policy outlook from turning overly hawkish, even though inflation remains far above the Fed’s 2% target. The report also points to how the Fed’s prior meeting ended with policy dissent, and it notes that the split was the largest since 1970.
Separately, Bloomberg quoted Cleveland Fed President Beth Hammack discussing the risk that returning inflation to 2% could take years—raising questions about whether public patience would be sufficient if progress toward the target is slow. The point matters for Bitcoin because extended tight or uncertain policy expectations can quickly change the liquidity backdrop that crypto tends to trade against.
What to watch next: the tone of the July minutes—especially any discussion around dissent—may determine whether near-term rate expectations drift further toward “hold” or reprice back toward “hikes.”
Japan’s GDP miss adds liquidity stress even as U.S. equities rally
Risk-asset traders are also monitoring Japan after Q2 GDP data missed expectations. The release showed quarterly and annual growth of 0.3% and 1.1%, respectively—below forecasts of 0.5% and 2.0%.
The data arrives as markets look for the Bank of Japan to potentially begin raising rates from current levels around 1.0% in September, a shift tied to surging bond yields and a weakening yen. Cointelegraph previously reported that Japan and the U.S. conducted a rare joint intervention in yen markets after JPY/USD hit multi-decade lows.
Beyond growth, the GDP print included a notable weakness: the first decline in private consumption in eight quarters. Oxford Economics’ Japan lead economist Norihiro Yamaguchi told CNBC that the boost to consumption from policy measures is already fading and that inflation pressures could increase in the second half as costs filter through—potentially deteriorating purchasing power.
For Bitcoin, the indirect channel is financial conditions. CryptoQuant contributor Axel Adler Jr. warned that while the situation is not yet a clear “sell risk assets” signal, the market is approaching a critical threshold. In a post on X, he highlighted a combination of conditions that could tighten global financial conditions: Japan’s government bond yields rising further (notably above 3%), additional BOJ rate hikes, a stronger yen, and rising U.S. Treasury yields. He added that if these factors align, normalization of Japan’s rates could end up pressuring both stocks and Bitcoin.
What to watch next: whether Japan’s yield and yen dynamics stay contained or accelerate—because traders often treat FX and sovereign yields as leading indicators of cross-asset liquidity.
Sentiment and ETF flows: Bitcoin risks being left out of the “capital rotation”
While macro uncertainty builds, some analysts argue the bigger issue may be positioning. Glassnode, in its “The Week Onchain” newsletter, described a divergence between Bitcoin and equities: U.S. consumer confidence remains among the weakest readings of the past decade, even as the stock market has reached an all-time high and stays near those levels.
Glassnode said the contradiction looks less puzzling once the driver is identified: households anticipating higher living costs and a softer economy may be reallocating away from cash and into assets, with equities absorbing much of that flow. The firm also pointed out that the S&P 500 reached all-time highs and that the University of Michigan’s consumer sentiment survey is expected to decline further in August.
According to Glassnode, Bitcoin is not participating in that same rotation. A key sign would be whether institutional inflows return to U.S. spot Bitcoin ETFs in a sustained way.
Cointelegraph’s article cites that last week spot Bitcoin ETFs saw net outflows of $267.2 million, based on data from Farside Investors. It also notes that only one out of five trading days ended with net inflows, totaling just $7.8 million.
What to watch next: whether outflows extend or reverse. Sustained inflows would directly challenge the idea that Bitcoin is being ignored by the same sentiment-driven capital that is supporting equities.
Exchange reserve shifts: whale inflows boost liquidity available to trade
On-chain supply dynamics are adding another layer of pressure. CryptoQuant analysis argues that whale activity is increasing exchange inflows and contributing to a reversal in BTC leaving exchanges—an important nuance because exchange balances can affect how much BTC is available for trading or hedging.
The report highlights that Binance’s whale ratio reached 0.71 on Aug. 10, the highest since early March. CryptoQuant also said Binance’s BTC reserves totaled 674,332 BTC on Sunday, up 2.57% month-to-date and at their highest level since November 2025.
“Exchange deposits do not necessarily mean immediate selling, but they increase the amount of BTC available for trading or hedging,” CryptoQuant commented.
The broader context matters: Cointelegraph previously reported that exchange activity had been skewed toward derivatives as Bitcoin has traded in a tight range since early June. In that earlier coverage, Binance futures volume was noted as significantly larger than spot volume in early August, reinforcing the idea that the market’s “tight range” behavior may be fueled as much by leverage and hedging as by spot demand.
For traders and long-term investors, the next signals are likely to come from three directions: the Fed minutes’ implications for policy expectations, whether Japan’s rates and yen continue to tighten financial conditions, and whether ETF flows and exchange-reserve trends move in a way that either reconnects Bitcoin to broader risk appetite—or further isolates it.

Many S&P 500 investors don’t pay much attention to the number of letters in their stocks’ symbols. But maybe they should. S&P 500 stocks with four-letter ticker symbols are trouncing those of all other lengths this year, says an Investor’s Business Daily analysis of data from S&P Global Market Intelligence. They’re up an average of 21.8% this year. That tops…
Copyright ©2026 Investor’s Business Daily, LLC. All rights reserved. 87990cbe856818d5eddac44c7b1cdeb8

Natural language robot cues, Apple Intelligence limits, & Mophie review

Is a 1% Financial Advisor Fee Really Worth It?

Child Benefit warning as parents face August 31 deadline


-

 Fashion3 days ago
Weekend Open Thread: Ann Taylor
-
 NewsBeat6 days ago
Communication cards help banking customers access services or report scams
-
 Business6 days ago
Oil Price Today (August 11): Crude oil rises to $88 after Trump’s compensation demand dents Hormuz opening. Here’s why
-

 Crypto World6 days ago
Revolut wins French banking licence, creates second EU banking hub
-
 Sports4 days ago
This U.S. Amateur is a glimpse into golf’s future in more ways than you think
-
 Crypto World7 days ago
Why Did Nvidia Stock Fall on Monday Despite a $500 Billion Wall Street AI Deal?
-

 Sports2 days ago
Birmingham 2026: Day 6 Timetable for Irish Athletes
-
 NewsBeat2 days ago
Myanmar says over 300,000 Rohingya refugees verified for repatriation as exodus enters ninth year
-

 Politics2 days ago
SEQ Code: The Three Letter Boarding Pass Code That Could Give You The Worst Seat
-
 Entertainment5 days ago
Keke Palmer Subtly Hints At Sean Evans Drama With Cryptic Post
-
 Crypto World7 days ago
Grayscale quietly drops Cardano, Polkadot and Hedera ETF plans
-

 Fashion7 days ago
Can You Wear Double Cloth Gauze Clothing To Your Office?
-
 Entertainment6 days ago
57 Years Later, the Best Sitcom Ever Made Still Deserves a Reboot
-

 Fashion6 days ago
Coffee Break: The Fonteyn Jane Flat
-

 Tech6 days ago
Zoom Screen-Sharing Bug Let People Fully Take Over Other Devices On A Call
-
 Crypto World7 days ago
Hormuz Nerves Cost Bitcoin $65,000 Mark Despite Solid Institutional Flows
-

 Crypto World7 days ago
Bitcoin's BIP Editors Remove Luke Dashjr Two Days After BIP-110 Fork Stalled
-

 Fashion6 days ago
Claire Life: Kicking Off MVAAFF With the C Suite Luncheon Featuring Phylicia Rashad, Letoya Luckett, and More!
-

 Fashion6 days ago
Should you refinance your debt? Pros, cons, and real numbers
-
 Crypto World5 days ago
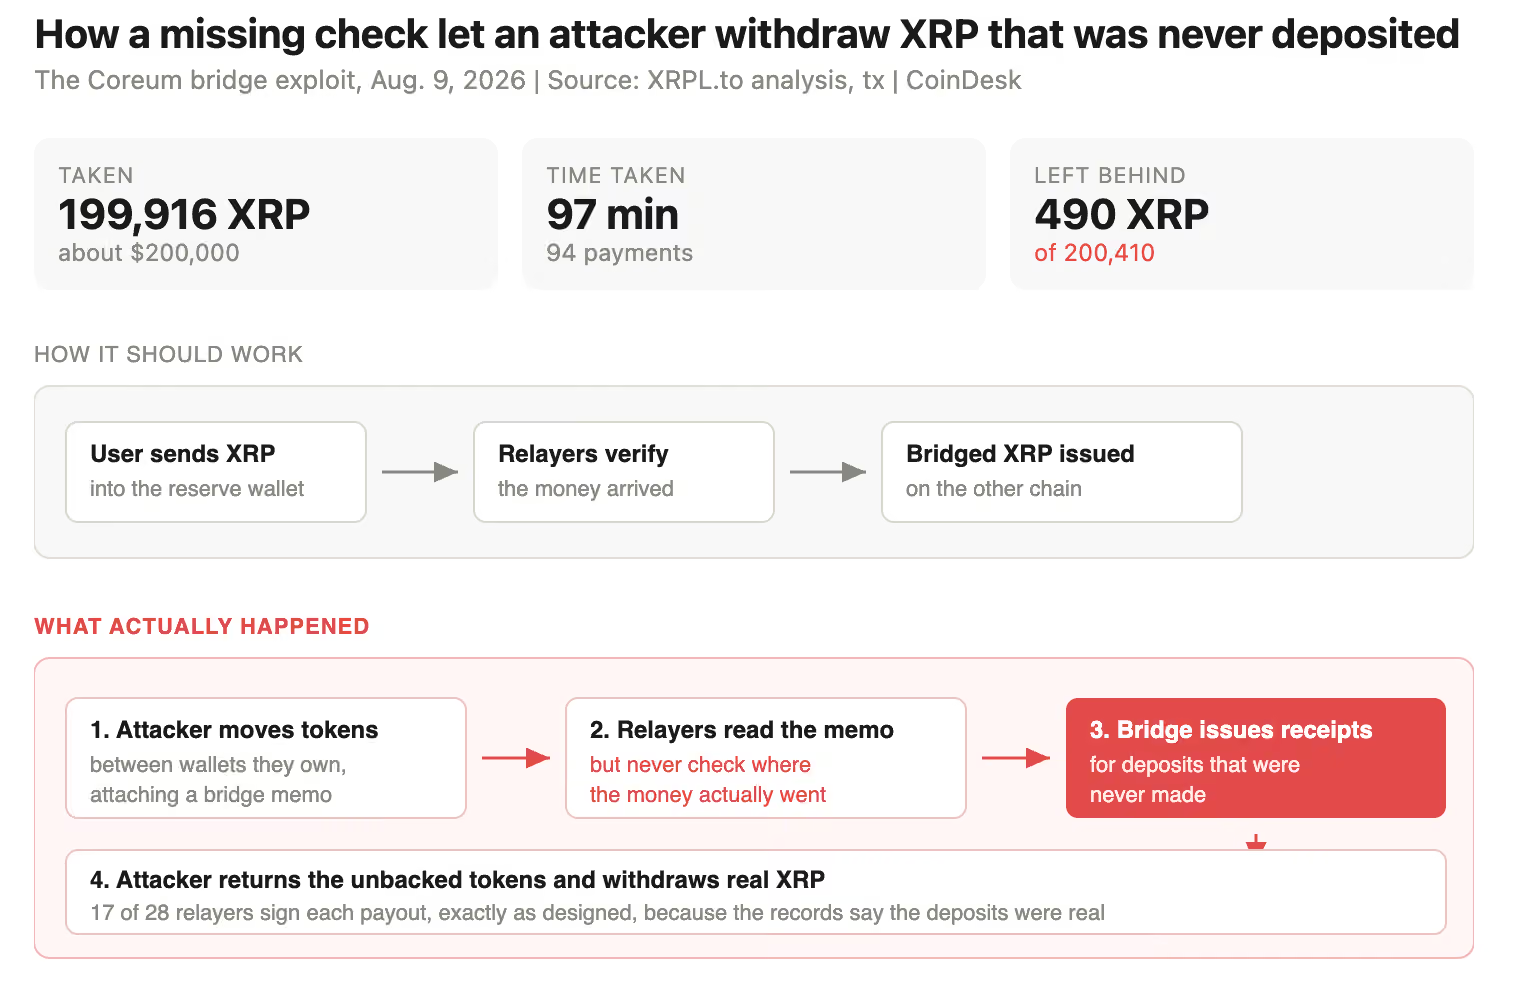
XRP bridge drained after software mistook fake deposits for real ones
You must be logged in to post a comment Login