

Crypto World
TradFi Assets Reach 9% of Binance Futures Volume Amid Rising Market Volatility

TLDR:
- TradFi assets now make up 9% of Binance futures volume, signaling a shift in trading behavior
- Rising stock market volatility is pushing traders to explore crypto-linked derivative markets
- S&P 500 drawdowns show that corrections are frequent, even during extended bull market phases
- Faster recoveries after 2010 reflect changing market dynamics and stronger policy responses
Global trading patterns are shifting as traditional financial assets gain ground within crypto derivatives markets. Recent data shows a steady rise in cross-market activity, while long-term equity drawdowns continue to shape how traders assess risk and timing across asset classes.
TradFi Assets Gain Ground in Crypto Futures
CryptoQuant reported that traditional financial assets now account for about 9% of Binance futures volume. The update came through a post shared by CryptoQuant, citing analyst JA Maartun. The data points to a gradual shift in trader focus beyond digital assets.
The tweet noted that rising volatility in stock markets is drawing more attention from crypto traders. As a result, exposure to equities through derivatives platforms is increasing. This trend reflects how trading strategies are expanding across asset classes.
Market participants are no longer focused only on altcoins or major cryptocurrencies. Instead, they are engaging with broader financial instruments. This shift suggests a blending of strategies between crypto-native and traditional market participants.
At the same time, volatility in equities appears to play a key role in this transition. When stock markets become unstable, traders often seek opportunities in derivative products. Binance futures markets now serve as one such venue for this activity.
This movement also aligns with the growing overlap between crypto infrastructure and traditional finance. As platforms expand their offerings, traders gain easier access to diversified instruments. That accessibility continues to reshape trading behavior.
S&P 500 Drawdowns Reflect Market Stress Cycles
Alongside this trend, long-term data on the S&P 500 provides context for how traders respond to volatility. The chart shared in the update tracks drawdowns from all-time highs between 2000 and 2026. It presents a clear view of market stress periods.
Major downturns stand out across the timeline. The early 2000s dot-com crash saw a drawdown near 45%. The global financial crisis pushed losses close to 50%, marking the deepest decline. Meanwhile, the 2020 pandemic shock caused a rapid drop of about 35%.
More recent movements show different patterns. The 2022 bear market recorded a decline near 25%, but it lasted longer. In contrast, post-2020 recoveries have been faster, often supported by policy responses and liquidity measures.
The data also shows that smaller corrections occur frequently. Declines between 5% and 15% appear even during strong market phases. These movements are part of normal volatility rather than signs of structural breakdown.
Another pattern emerges in recovery timing. Before 2010, markets often took several years to regain previous highs. Since then, recoveries have become quicker, especially after major shocks. This shift reflects changing market dynamics and intervention tools.
The chart further indicates that markets spend more time near peak levels than in deep declines. Most of the timeline stays close to all-time highs. This pattern suggests a tendency toward recovery rather than prolonged downturns.
Periods of calm also alternate with bursts of volatility. Stable phases, such as 2016 and 2017, are followed by more turbulent conditions. These cycles show that risk does not appear evenly over time.
Taken together, the rise in TradFi participation on crypto platforms and the history of equity drawdowns present a connected narrative. Traders are adapting to volatility across markets while using new tools to manage exposure.


TLDR:
- Brian Armstrong highlighted tokenization as a major priority for future financial infrastructure
- Coinbase’s CEO linked stablecoins and AI systems to faster and cheaper global financial services
- Armstrong called for risk-based crypto regulation instead of broad industry-wide restrictions
- The post tied blockchain networks to startup funding, open access, and self-custodial finance
Coinbase CEO Brian Armstrong has outlined several areas where he believes the global financial system still requires major upgrades.
His comments focused on tokenization, stablecoins, AI-powered finance, and broader access to capital markets.
The post quickly gained attention across crypto discussions because it tied blockchain infrastructure to long-term financial reform. Armstrong also highlighted regulation and self-custody as central parts of the industry’s next phase.
Brian Armstrong Pushes Tokenization and Global Crypto Trading
Armstrong shared the framework through a post on X outlining eight sectors he believes still need modernization. The list placed tokenization of real-world assets at the center of future financial infrastructure.
According to the post, tokenized assets could include real estate, stocks, bonds, and investment funds. Armstrong said blockchain-based settlement may improve distribution and fractional ownership access.
The Coinbase executive also pointed to round-the-clock global trading as another major gap in traditional finance. He described a system where global liquidity pools allow faster trading access across borders.
Stablecoin payments formed another key part of the discussion. Armstrong referenced near-instant and lower-cost international transfers, including payments tied to AI agents and automated systems.
The comments arrive as tokenization continues gaining traction among crypto firms and traditional financial institutions. Several large firms have recently explored blockchain settlement systems and tokenized treasury products.
Armstrong also linked open blockchain protocols with expanded financial participation. He said self-custodial wallets and smartphone-based access could reduce reliance on traditional intermediaries.
Coinbase CEO Highlights AI, Regulation, and Capital Formation
Armstrong’s post also focused heavily on artificial intelligence within finance. He said AI-powered systems may improve risk analysis, compliance checks, fraud detection, and financial advice.
The comments connected crypto infrastructure with automated financial tools that operate across digital networks. Armstrong described broader access to financial guidance through AI-driven systems.
Regulation also appeared as a central theme throughout the post. Armstrong argued for risk-based regulatory frameworks instead of broad rules that treat all crypto activity equally.
The Coinbase executive said innovation-friendly regulation could increase competition and reduce barriers for startups. He tied those changes to future capital formation across blockchain markets.
Armstrong also described blockchain networks as tools for cheaper fundraising. According to the post, lower issuance costs could help more startups access investment opportunities.
The final section focused on sound money and inflation concerns tied to fiat systems. Armstrong described cryptocurrency as a possible refuge during periods of declining monetary discipline.
His remarks reflected a wider push across the crypto industry toward integrating blockchain systems with traditional finance infrastructure. The post also reinforced how tokenization, stablecoins, and AI remain central themes in current crypto market development.
TLDR:
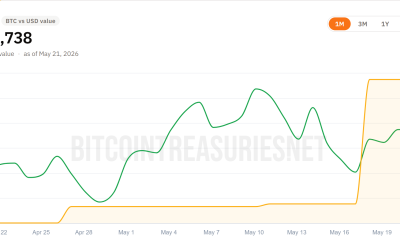
- Strategy holds about 843,768 Bitcoin with an average acquisition price near $75,700 per BTC
- Michael Saylor’s “BitVac is charging” post sparked fresh speculation about another BTC purchase
- Strategy reportedly added over 171,000 Bitcoin during 2026, exceeding new miner output
- The company continues funding Bitcoin buys through stock sales and preferred share offerings
Michael Saylor has again triggered Bitcoin market speculation with a new social media message tied to Strategy’s treasury activity.
The company executive posted “BitVac is charging” as traders watched for another corporate Bitcoin purchase. Strategy already holds one of the world’s largest Bitcoin reserves among public companies.
The latest signal also arrived as investors tracked the firm’s funding plans, debt restructuring, and comments around possible future Bitcoin sales.
Michael Saylor Bitcoin Signal Revives Strategy Buy Expectations
Saylor shared the “BitVac is charging” message through his X account, drawing immediate attention from Bitcoin traders. Similar posts have often appeared before Strategy disclosed additional Bitcoin purchases.
The company currently holds around 843,768 Bitcoin according to figures cited in the report. Strategy’s average acquisition price stands near $75,700 per Bitcoin.
Bitcoin traded close to $75,958 during the latest market session. That price placed the asset slightly above Strategy’s average cost basis.
Strategy’s Bitcoin purchases this year have reportedly exceeded newly mined Bitcoin supply worldwide. The company added more than 171,000 BTC during 2026 based on the supplied figures.
That accumulation pace has increased Strategy’s influence across Bitcoin markets. Investors now closely monitor both the company’s treasury moves and financing structure.
The firm’s Bitcoin strategy has transformed its market identity over recent years. Many investors now view Strategy primarily as a leveraged Bitcoin holding company rather than a software business.
Strategy Funding Model and Bitcoin Sales Draw Focus
Strategy has financed recent Bitcoin purchases through common stock offerings and preferred shares. The company’s STRC preferred shares reportedly carry an 11.5% dividend.
The company also moved to repurchase approximately $1.50 billion in convertible notes. That decision reflected continued adjustments to its capital structure.
Saylor recently discussed Strategy’s long-term Bitcoin approach during appearances on Coin Stories and The Wolf Of All Streets podcast. He said management remains focused on maximizing Bitcoin per share over time.
The comments marked another example of Strategy linking corporate performance directly to Bitcoin accumulation. That approach has shaped how shareholders evaluate the company.
Saylor also suggested limited Bitcoin sales could occur under certain conditions. The remarks drew attention because Strategy has historically promoted a long-term holding strategy.
According to comments cited from The Wolf Of All Streets podcast, Saylor said credit rating agencies must recognize Bitcoin as an asset. The statement followed discussion around Strategy’s financing model and balance sheet structure.
Strategy shares closed at $159.89 during the latest trading session based on Google Finance data referenced in the report. The stock declined 10.86% during the previous 30 days.
Market participants continue tracking Strategy’s next Bitcoin move after the “BitVac” signal. Traders are also watching how future purchases could affect funding costs and broader Bitcoin demand.
TLDR:
- Tom Lee warned of a possible bear market while BitMine continued buying Ethereum during the decline
- BitMine recently acquired another 60,000 ETH through wallets linked to Kraken and BitGo
- Ethereum traded near $2,093 while remaining roughly 57% below its reported 2025 peak
- BitMine’s Ethereum treasury now exceeds 5.2 million ETH, equal to 4.37% of supply
Tom Lee’s latest bear market warning has reignited debate across the crypto market. The comments surfaced as BitMine continued expanding its Ethereum treasury despite prolonged ETH weakness.
Blockchain tracking data showed the firm recently acquired another 60,000 ETH through wallets linked to Kraken and BitGo. The move arrived while Ethereum traded more than 50% below its reported 2025 peak.
Tom Lee Bear Market Warning Puts Ethereum Strategy in Focus
Crypto Tony shared Lee’s warning on X, drawing immediate attention from traders monitoring broader market conditions. The discussion intensified because BitMine has remained aggressive with Ethereum accumulation.
BitMine launched its Ethereum treasury strategy in July 2025 following a $250 million private placement. The company later disclosed holdings of 163,142 ETH valued near $500 million at the time.
Since then, the firm has steadily expanded its position during periods of market weakness. Recent blockchain activity tracked by Lookonchain pointed to another 60,000 ETH purchase worth roughly $126 million.
The transactions reportedly moved through newly created wallets connected to Kraken and BitGo infrastructure. Blockchain investigator EmberCN also linked the transfers to BitMine’s treasury activity.
The latest acquisition pushed BitMine’s reported Ethereum holdings above 5.2 million ETH. That figure represents about 4.37% of Ethereum’s circulating supply.
Lee has continued defending the treasury strategy during the decline. According to the report, he viewed Ethereum prices below $2,200 as an attractive accumulation zone.
BitMine ETH Treasury Expands Despite Ethereum Market Weakness
Ethereum traded near $2,093 during the latest market session according to TradingView data. The asset remained roughly 57% below its reported 2025 high.
BitMine previously indicated it would slow future Ethereum purchases during May. However, the company did not signal an end to the treasury plan.
The firm still aims to control 5% of Ethereum’s total supply before December. That target has kept attention fixed on BitMine’s accumulation pace.
Meanwhile, traders continue monitoring Ethereum’s technical structure. Market watchers highlighted a rising wedge formation during the recent recovery attempt.
Some technical setups referenced in the report pointed toward possible downside near $1,600 if support levels fail. A move lower could increase unrealized losses tied to BitMine’s holdings.
Based on reported treasury data, estimated paper losses could approach $10.1 billion depending on Ethereum market prices. The calculation used an average acquisition cost near $3,513 across 5.28 million ETH.
At the same time, rebound scenarios remain active across trading discussions. Analysts tracking the wedge formation identified $2,530 near the 200-day moving average as a resistance level if buyers regain momentum.
Changpeng Zhao (CZ) denied a viral rumor that claimed he went missing in a Dubai surfing accident on Sunday. The fabricated story spread first through Chinese-language WeChat groups.
In his pushback, the Binance founder noted Dubai is not a surfing destination but opportunistic traders had already spun up tiny meme coins on Solana and BNB Chain.
Hoax Triggers Wave Of Low-Cap Meme Coin Launches
The fabricated post claimed CZ had been swept out to sea near Jumeirah beach as rescue teams searched.
“According to eyewitnesses and security personnel at the scene, the sea appeared calm at the time, but the rip current was extremely strong. Zhao was reportedly swept out to sea without warning and disappeared from sight within moments. Local coastal guards and maritime rescue teams quickly deployed speedboats, drones, and rescue helicopters to conduct a large-scale search operation,” the post claimed.
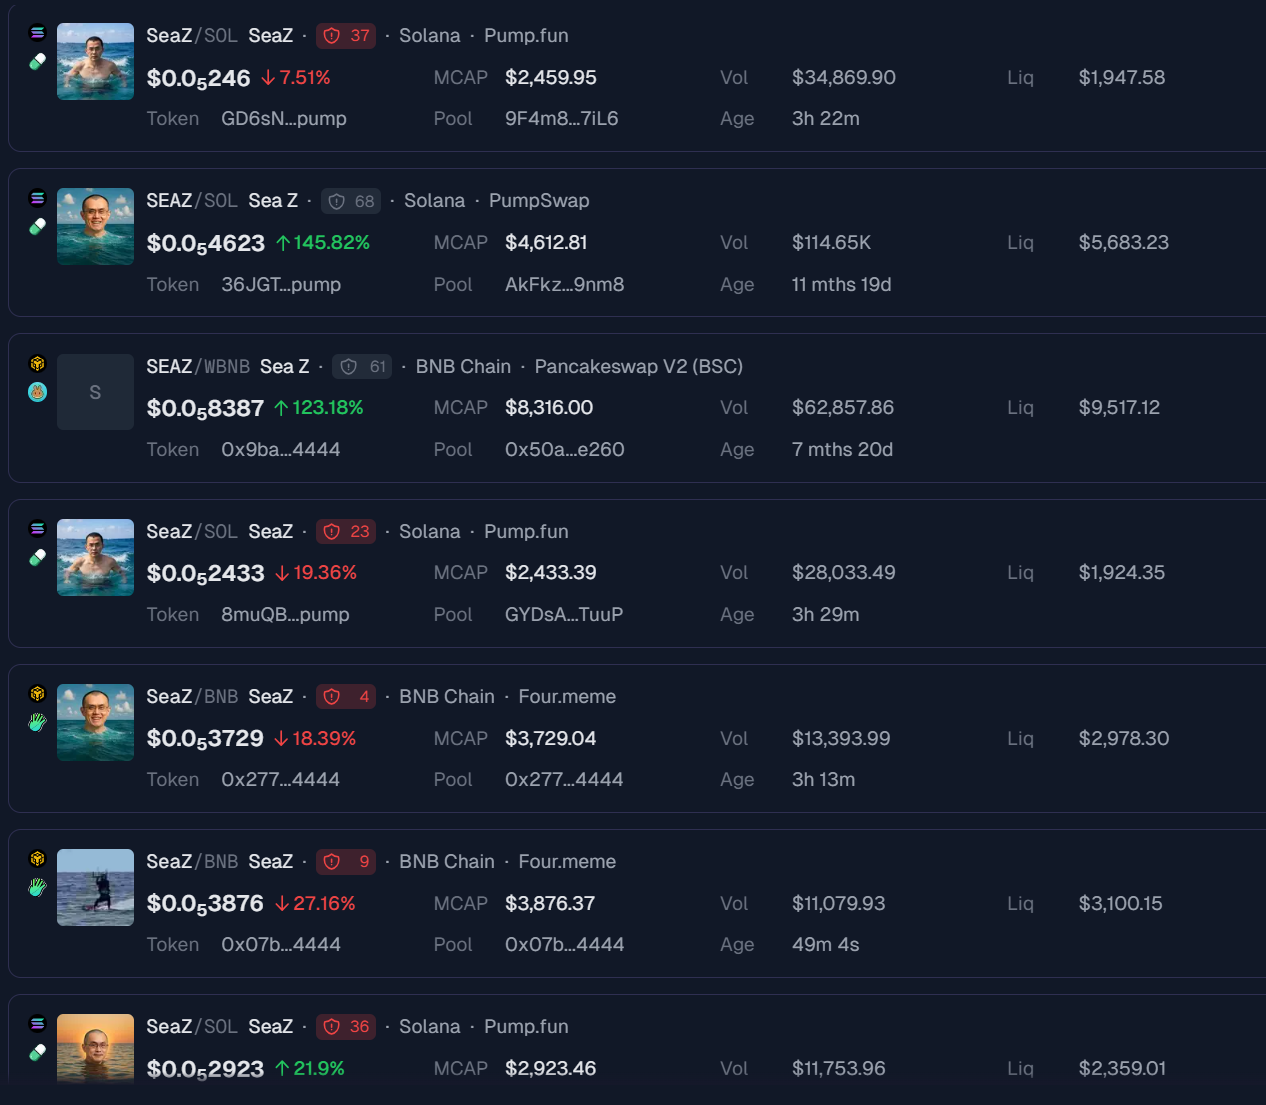
Within hours, traders deployed knockoff tokens on pump.fun and the BNB Chain meme launchpad, most carrying SEAZ and RIPCZ tickers.
GeckoTerminal data shows several SEAZ pools on Solana priced below one-thousandth of a cent. Market caps ranged from roughly $2,400 to $4,600 with liquidity under $6,000.
The BNB Chain version on PancakeSwap V2 traded near $8,300 in market cap on $9,500 of liquidity. One Solana SEAZ pool printed about $114,000 in volume on just $5,683 of liquidity.

Follow us on X to get the latest news as it happens
The setup recalls past Solana meme coin rugs. Most tokens dropped 10% to 40% within hours of launch.
CZ Pushes Back On The Rumor Cycle
CZ addressed the hoax, noting that he kite surfs rather than surfs and invited followers to try Surf Abu Dhabi together.
The Binance founder has criticized meme coin traders before for chasing tokens tied to his name.
“I am not against memes, but meme coins are getting “a little” weird now,” he noted.
The incident mirrors past Binance fake news incidents, including an Interpol red notice rumor that briefly hit BNB.
This pattern also recalls earlier CZ-linked meme frenzy incidents, when traders piled into thin tokens before momentum collapsed.
The post CZ “Surfing Accident” Hoax Sparks Meme Coin Frenzy Across Solana And BNB Chain appeared first on BeInCrypto.

Nakamoto Inc. (NAKA) has defended why a Bitcoin (BTC) treasury company keeps a Chief Medical Officer on payroll. The role went viral as a symbol of what skeptics call Digital Asset Treasury (DAT) excess.
Analysts point to the role alongside NAKA’s 99% share collapse and roughly $200 million debt load. CEO David Bailey responded that the medical position exists for reasons rooted in the company’s reverse merger origin.
Why a Bitcoin Treasury Firm Keeps a Doctor on Staff
NAKA began as KindlyMD, a Utah-based pain management provider. It listed on Nasdaq before merging with Bailey’s private Nakamoto Holdings in 2025.
Tim Pickett, who founded KindlyMD, stayed on as Chief Medical Officer to run the legacy healthcare subsidiary.

“We have a chief medical officer because we merged with a healthcare company and maintaining an operating business is a Nasdaq listing requirement,” explained David Bailey, Nakamoto’s CEO and chairman.
The healthcare arm generates the bulk of Nakamoto’s modest recurring revenue and helps the company avoid shell-company classification.
It is one of several medical firms rebranded into crypto vehicles in 2025.
Follow us on X to get the latest news as it happens
Dilution and Losses Fuel the Backlash
The CMO became a punchline as wider concerns intensified. Analyst Justin Bechler highlighted Nakamoto’s Q1 2026 10-Q, which reported a $238 million net loss.
Operating revenue was $2.3 million while insiders received $7.3 million in compensation.
The company also acquired BTC Inc. and UTXO Management from Bailey and CIO Tyler Evans.
The deal diluted public holders by 58% in one quarter, fueling shareholder dilution concerns across the Bitcoin treasury sector.
Shareholders later authorized a 1-for-40 reverse stock split to restore Nasdaq’s $1 minimum bid compliance. The split took effect May 22, lifting NAKA from around $0.16 to roughly $6.
It also compressed 696 million outstanding shares into 17.4 million.
The first insider lock-up tranche releases August 20, and the Q2 10-Q lands the same month. Both will test whether Bitcoin 2026 conference revenue can justify the goodwill from the BTC Inc. acquisition.
Investors watching ongoing DAT sector losses and Nakamoto’s earlier BTC sale are focused on the operating line.
The 5,058 BTC headline holdings matter less for the next two quarters.
The post A Bitcoin Treasury Company Has a Doctor on Staff, But Why? appeared first on BeInCrypto.

SOL fell 33% in the first quarter of 2026 to close at around $83, but Messari’s Q1 State of Solana report tells a story that’s harder to dismiss than the price chart would suggest.
While dollar-denominated numbers dropped across the board, the network set new records for daily transaction volume, grew its real-world asset market cap to over $2 billion, and barely budged on validator revenue.
Record Activity, Shrinking Prices
The headline figure from the report was the new all-time high for average daily non-vote transactions: 112.6 million, up 50% from the previous quarter and 15% above the previous record set in Q2 2025.
It means that more transactions happened on Solana every day in Q1 than at any point in the network’s history, which clearly sits at odds with the price decline. Meanwhile, Chain GDP, which is Messari’s term for total application revenue, stayed almost flat at $342.2 million, fractionally above Q4 2025’s $341.8 million.
Per the report, Pump.fun is still the largest single revenue source at $124.7 million, an improvement of 17% quarter-over-quarter. In second place was Axiom, a trading app, which recorded a 36% jump, raking in $42.4 million.
However, the most dramatic mover was a launchpad that lets users share trading fees with social media accounts, called Bags. Its revenue went up 1,347% to $11.5 million after meme coins tied to open-source AI projects generated intense trading activity in January.
That momentum didn’t hold, with Bags’ revenue dropping 85% month-over-month into February, making the episode another example of how quickly new activity cycles through Solana’s application layer.
On the other hand, DeFi TVL fell 22% quarter-over-quarter to $6.16 billion, a drop that tracks almost directly with SOL’s price dip rather than with any meaningful outflow of users. Solana’s share of total DeFi TVL moved barely at all, going from 6.9% to 6.7%, while Kamino reclaimed the top protocol spot with $1.72 billion, edging Jupiter at $1.69 billion.
Drift’s performance was affected by a $285 million exploit attributed to a sophisticated social engineering operation linked to North Korean state-affiliated threat actors.
Looking at Real Economic Value, which is basically the fees and MEV tips paid to validators, the report shows it fell just 1% to $89.5 million. That figure placed Solana second among all networks, only behind Hyperliquid’s $156 million.
RWAs Take the Lead
If one story defined Q1 beyond the bear market backdrop, it was real-world assets. On Solana, the market saw its value grow 43% quarter-over-quarter to $2.01 billion.
BlackRock’s BUIDL tokenized money market fund doubled to $525.4 million after Anchorage Digital added custody support, with the latter holding around 81% of the total supply on-network by quarter’s end.
Meanwhile, Ondo Finance launched 200-plus tokenized US stocks and ETFs on Solana, including a same-day tokenization of BitGo stock on the date of the company’s NYSE IPO.
Finally, while the stablecoin market cap on the platform remained at just under $15 billion, the composition changed. USDC fell 21% to $7.83 billion but remains the largest at 53% of the total, while USDT rose 34% to $2.89 billion.
At the same time, World Liberty Financial’s USD1 climbed 473% to $883.5 million, largely on the back of Binance reallocating customer holdings to Solana.
The post Report: Solana Activity Hits Record High Despite SOL’s 33% Q1 Drop appeared first on CryptoPotato.
Cryptocurrency markets staged a notable recovery, adding roughly $75 billion to total market capitalization after a Saturday update from U.S. President Donald Trump suggested progress toward a peace agreement with Iran and regional partners. The president’s remarks, published on Truth Social, described an agreement that was “largely negotiated” and subject to finalization among the United States, Iran, and a coalition of Middle Eastern states.
The post named Saudi Arabia, the United Arab Emirates, Qatar, Pakistan, Turkey, Egypt, Jordan and Bahrain as participants in the talks. It also carried a bold assertion about finalization and the future opening of the Strait of Hormuz, a strategic chokepoint whose status has historically influenced global energy costs and risk appetite across asset classes, including crypto.
“An agreement has been largely negotiated, subject to finalization between the United States of America, the Islamic Republic of Iran, and the various other countries, as listed,” he said. His post said: “Final aspects and details of the deal are currently being discussed and will be announced shortly. In addition to many other elements of the agreement, the Strait of Hormuz will be opened.”
The prospect of reopening Hormuz is tied closely to energy price dynamics, which have long weighed on high-risk assets such as cryptocurrencies. In recent weeks, investors have fretted that energy-market volatility would spill over into risk assets, helping explain a dampened crypto mood even as a ceasefire agreement in the region held tentative ground.
Key takeaways
- Crypto markets gained roughly $75 billion in total market capitalization following Trump’s peace-talk update, signaling renewed risk-on sentiment on negotiations’ potential?
- The proposed deal would involve the United States, Iran and a bloc of Middle Eastern countries, with an emphasis on reopening the Strait of Hormuz to improve energy flow and prices.
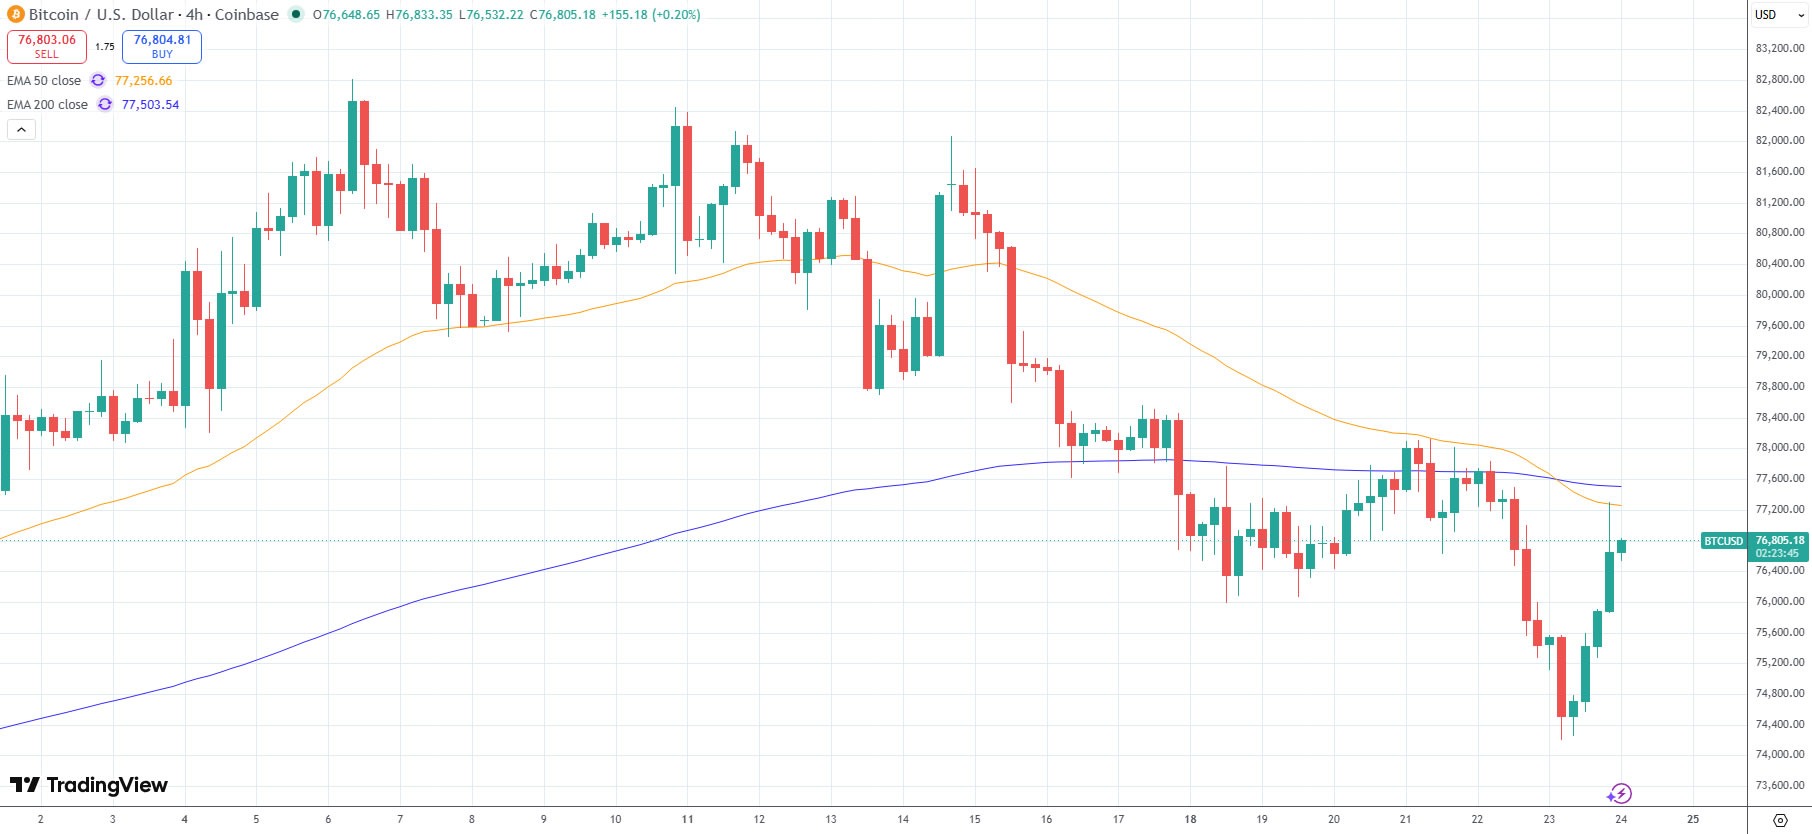
- Bitcoin experienced intra-day volatility, slipping to a five-week low near $74,250 on Saturday before bouncing toward the $77,000 area, then easing to around $76,800, with ongoing debates about macro and energy-linked risk appetite influencing moves.
- Bitcoin remains substantially below its October peak, down about 39%, highlighting the still-fragile risk-off backdrop even as headlines shift sentiment.
- Concurrent remarks from regional and U.S. officials underscored ongoing political complexity, with seen calls for denuclearization and open straits echoing through markets’ mood.
Geopolitics, energy sensitivity and crypto appetite
The Saturday update arrives at a moment when the broader ceasefire between Washington and Tehran has proved fragile since early April, despite several attempts to formalize a durable agreement. The geopolitical tension there has consistently fed energy-price volatility, a well-known driver of crypto risk appetite. By signaling a pathway to open strategic waterways like the Strait of Hormuz, Trump’s message touches on a key fulcrum for both traditional markets and digital assets.
During a visit to India, U.S. officials reiterated that security guarantees and non-proliferation considerations remain central to any eventual accord. The communications underscored the long arc of negotiations and the precarious path to finalization, a backdrop that has historically tempered appetite for high-volatility assets such as Bitcoin and altcoins.
From a market structure perspective, a less volatile energy backdrop could help soothe risk-off pressures that have weighed on crypto equities and tokens in recent months. If Hormuz operations are stabilized and energy shipments normalize, investors may reallocate capital toward higher-risk assets, including broadly diversified crypto bets, though the exact timing and scale of any shift remain uncertain.
Bitcoin price action and the broader market context
Bitcoin’s price action reflected a risk-off-to-risk-on tug-of-war around the weekend. The weekly low near $74,250 marked a five-week bottom as traders weighed geopolitical headlines and macro indicators. In early Sunday trading, BTC touched the 50-day exponential moving average around $77,000, a level traders often see as a short-term gauge of trend resilience. The price subsequently eased to roughly $76,800 as liquidity dynamics and risk sentiment evolved through the session.
From a longer-term perspective, Bitcoin remains significantly below its late-October peak, with a drawdown exceeding 39%. The current bounce has not yet signaled a durable reversal, and analysts continue to watch major support and resistance thresholds around $70,000 and the $80,000 zone for any decisive directional shift.
Brokerage and exchange commentary during the period has underscored that the macro environment—comprising energy price trajectories, global inflation readings, and the pace of traditional market equities—continues to color crypto flows. While the weekend rebound suggests a temporary relief rally tied to geopolitical headlines, investors remain cautious about the durability of any move higher without clearer signs of policy alignment or more concrete progress toward regional de-escalation.
What to watch next
Markets will be keenly attuned to further developments around the Iran talks and any government disclosures about the status of negotiations. The exact terms, sequencing of steps, and verification mechanisms will shape how energy markets respond, which in turn feeds back into crypto demand and liquidity. Traders should monitor:
- Official confirmations on the terms of any peace agreement and the timeline for implementing open maritime routes.
- Energy price trajectories and any stabilization in shipping costs that could alter risk appetite across asset classes.
- Comments from policymakers and central banks that could recalibrate inflation expectations and liquidity conditions.
- Technical levels for Bitcoin and major altcoins, especially near the $70,000 support zone and the $82,000–$85,000 resistance band that has historically constrained upside momentum.
In the near term, investors will weigh the potential for a de-escalation in Middle East tensions against the durability of a broader macro recovery. The outcome could determine whether crypto markets resume a more pronounced upcycle or revert to a cautious stance as traders reassess risk premiums across asset classes.
As always, readers should seek balanced signals: geopolitical easing can reduce volatility, but structural shifts in energy markets and global liquidity will ultimately shape how quickly crypto markets regain momentum. The coming weeks will be telling as more details emerge from the negotiating table and as markets parse any credible milestones toward a finalized accord.
For now, the week’s chatter underscores a persistent truth for crypto traders: geopolitical risk remains a meaningful driver of sentiment, even as technologists, investors, and miners continue to pursue longer-term narratives around adoption, infrastructure, and regulation. Watch how policymakers translate words into actions, and how energy-market signals align with risk appetite to determine the path forward for digital assets.
Cryptocurrency markets have recovered around $75 billion in total capitalization following a progress update on Saturday from US President Donald Trump on a peace agreement with Iran.
Trump said a deal has been “largely negotiated” among the United States, Iran, and several Middle Eastern countries, in a post on Truth Social on Saturday.
The countries included in the negotiations were Saudi Arabia, the United Arab Emirates, Qatar, Pakistan, Turkey, Egypt, Jordan and Bahrain.
“An agreement has been largely negotiated, subject to finalization between the United States of America, the Islamic Republic of Iran, and the various other countries, as listed,” he said. His post said:
“Final aspects and details of the deal are currently being discussed and will be announced shortly. In addition to many other elements of the agreement, the Strait of Hormuz will be opened.”
The deal also includes reopening the Strait of Hormuz. The closure of the key waterway has caused global energy prices to spike and has weighed on the cost of living in many nations. It has also hit investments in high-risk assets such as crypto, which have retreated recently.
Three months of war takes its toll
Trump’s announcement comes amid a fragile ceasefire that began in early April with several failed attempts at reaching an agreement between the US and Iran.
US Secretary of State Marco Rubio reiterated Trump’s demands for a peace deal during a visit to India on Saturday. “Iran can never have a nuclear weapon. The straits need to be open without tolls. They need to turn over their enriched uranium,” he said.
Related: Warsh will cut rates, despite consensus view of rate hikes: Analyst
Crypto markets react positively
Bitcoin prices fell to a five-week low of $74,250 on Saturday, according to TradingView.
The asset recovered to tap the 50-day exponential moving average at $77,000 in early trading on Sunday before falling back to $76,800 at the time of publication.
BTC has resumed its downtrend after failing to break resistance at $82,000 and remains down 39% from its October peak.

BTC sees minor recovery after Trump’s deal announcement. Source: TradingView
Magazine: Crypto scammers face death, Aussie CGT makes Asian hubs attractive: Asia Express
Ethereum co-founder Vitalik Buterin responded to growing criticisms of the Ethereum Foundation’s role in the Ethereum ecosystem, pushing back against critics who want the organization to take a more active role in supporting token prices and marketing.
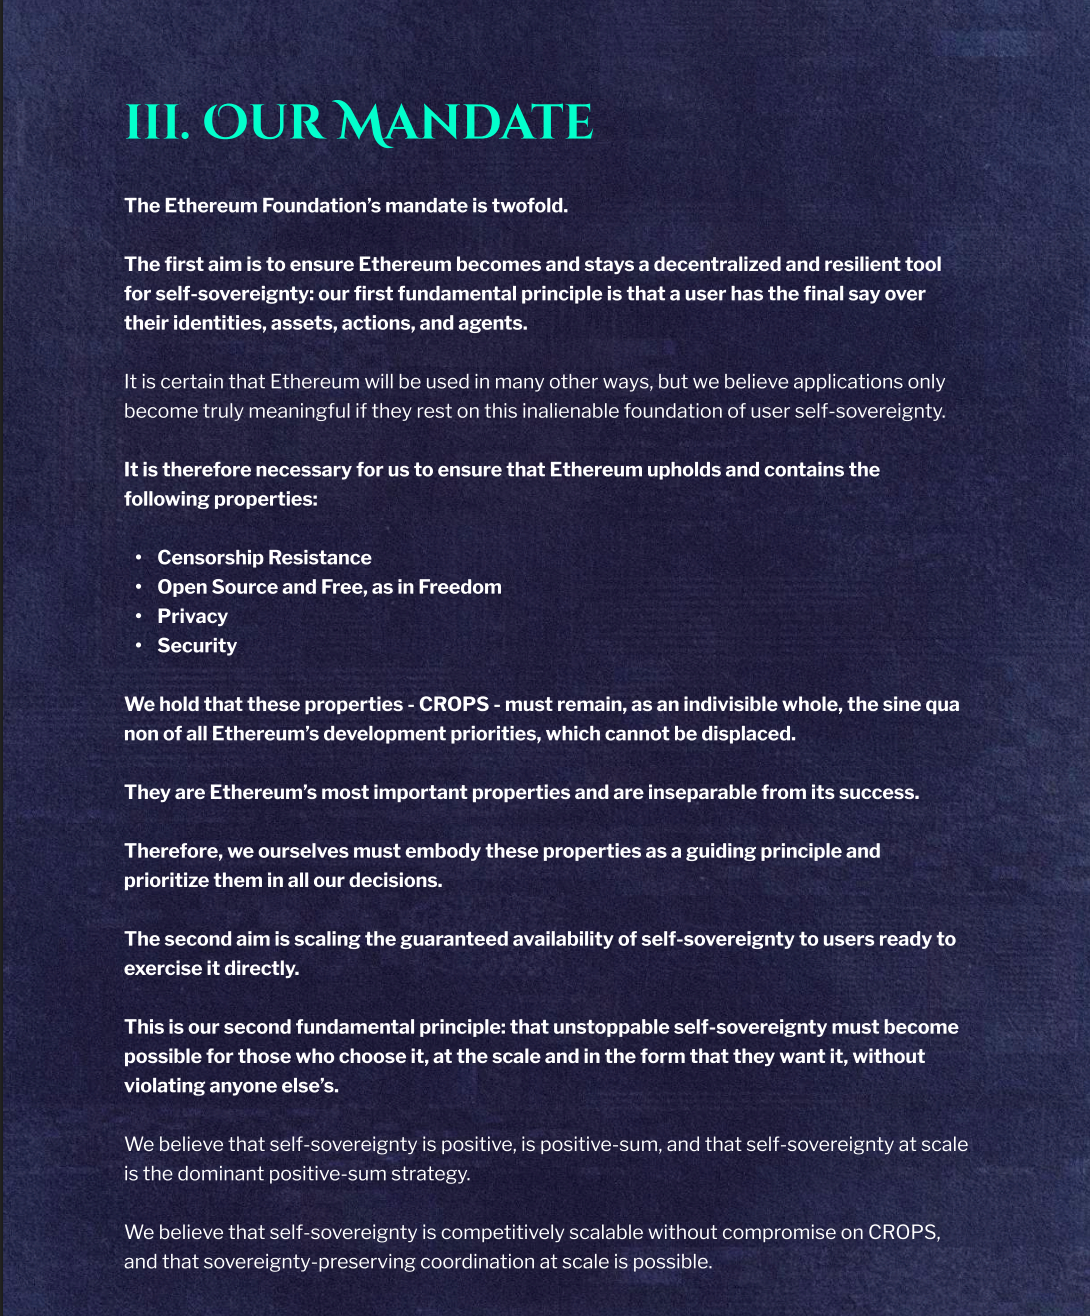
Buterin said the Foundation will continue to focus on promoting censorship-resistance, open source software code, long-range research, cybersecurity, and decentralization of the Ethereum Protocol, as outlined in its mandate. He said:
“EF is not a ‘center of Ethereum’, rather EF is ‘one node, with a defined purpose, alongside other nodes’. We have always said that the EF should be the latter, but many in the Ethereum ecosystem, and even within the EF, wanted us to be the former.
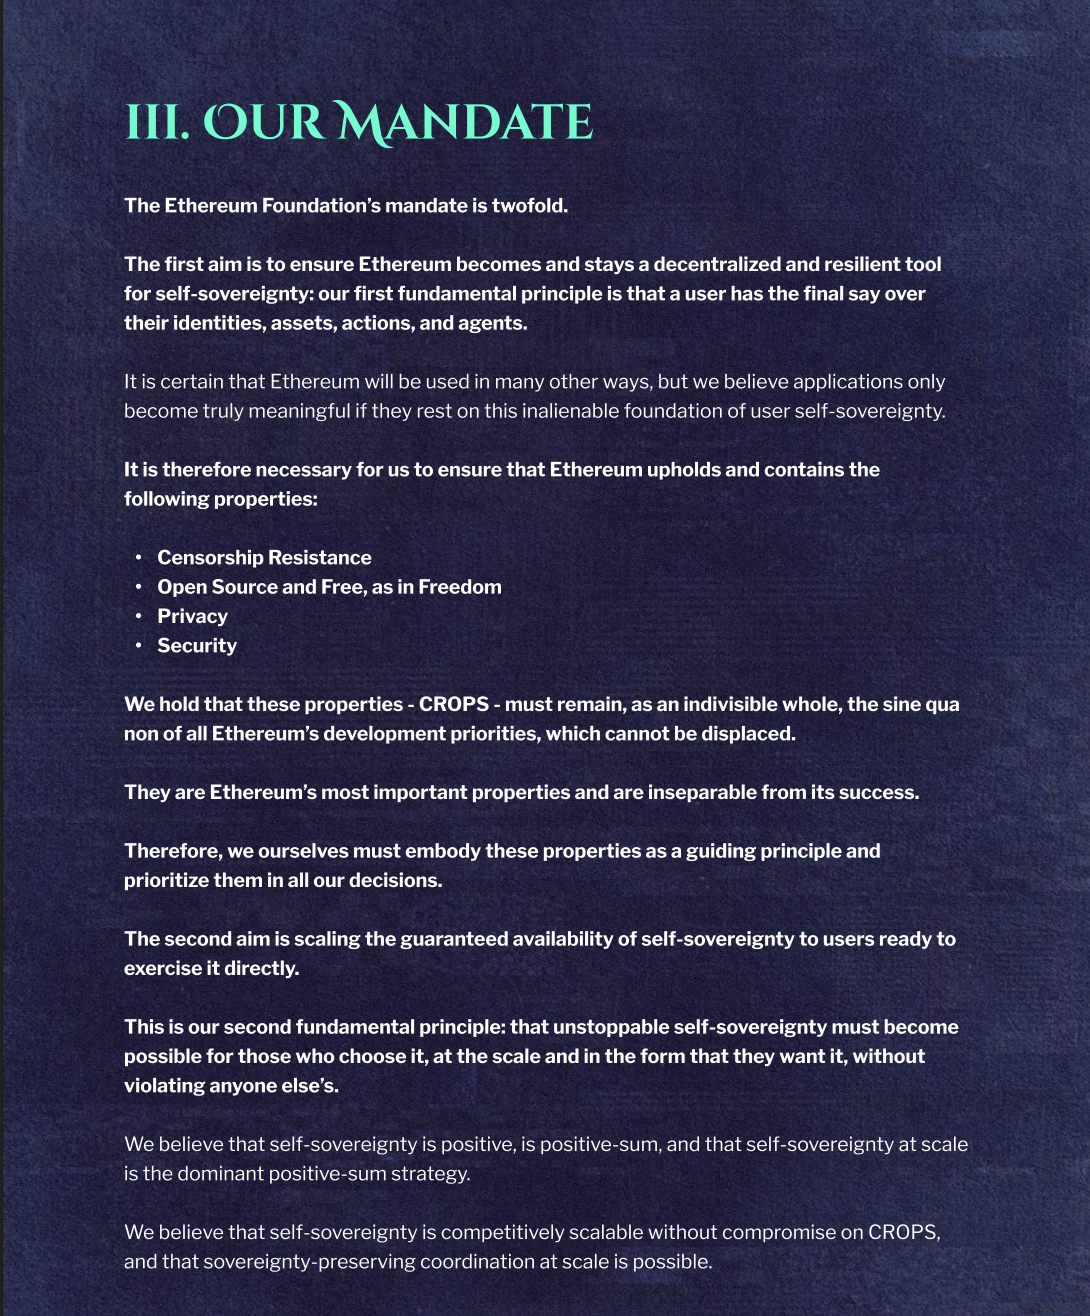
The Ethereum Foundation’s mandate was published in March 2026. Source: Ethereum Foundation
“Now, we are taking action to ensure that we will be the latter,” he continued, adding that the Ethereum Foundation seeks to strengthen Ethereum’s cybersecurity and code base but not necessarily compete with high-throughput chains or scale to 1 million transactions per second.
The comments follow several large ETH holders selling their entire ETH position and high-profile departures from the Ethereum Foundation, as the current price of the cryptocurrency, about $2,094, sits more than 50% below its all-time high of nearly $5,000 reached in August 2025.
“The EF has only about 0.16% of all ETH,” he said, noting that it is common for other foundations to hold 10-50% of their native tokens.
Related: Blockchain researcher defends Ethereum Foundation, says it’s doing ‘exactly’ its job
Under pressure amid falling token price
“I think Ethereum’s original sin was not considering tokenomics with every move it made from Dencun on,” cryptocurrency journalist Laura Shin said.
The Dencun upgrade was a major protocol update released in March 2024, which significantly reduced network fees for layer-2 transactions and led to a subsequent collapse in Ethereum’s base layer revenue.
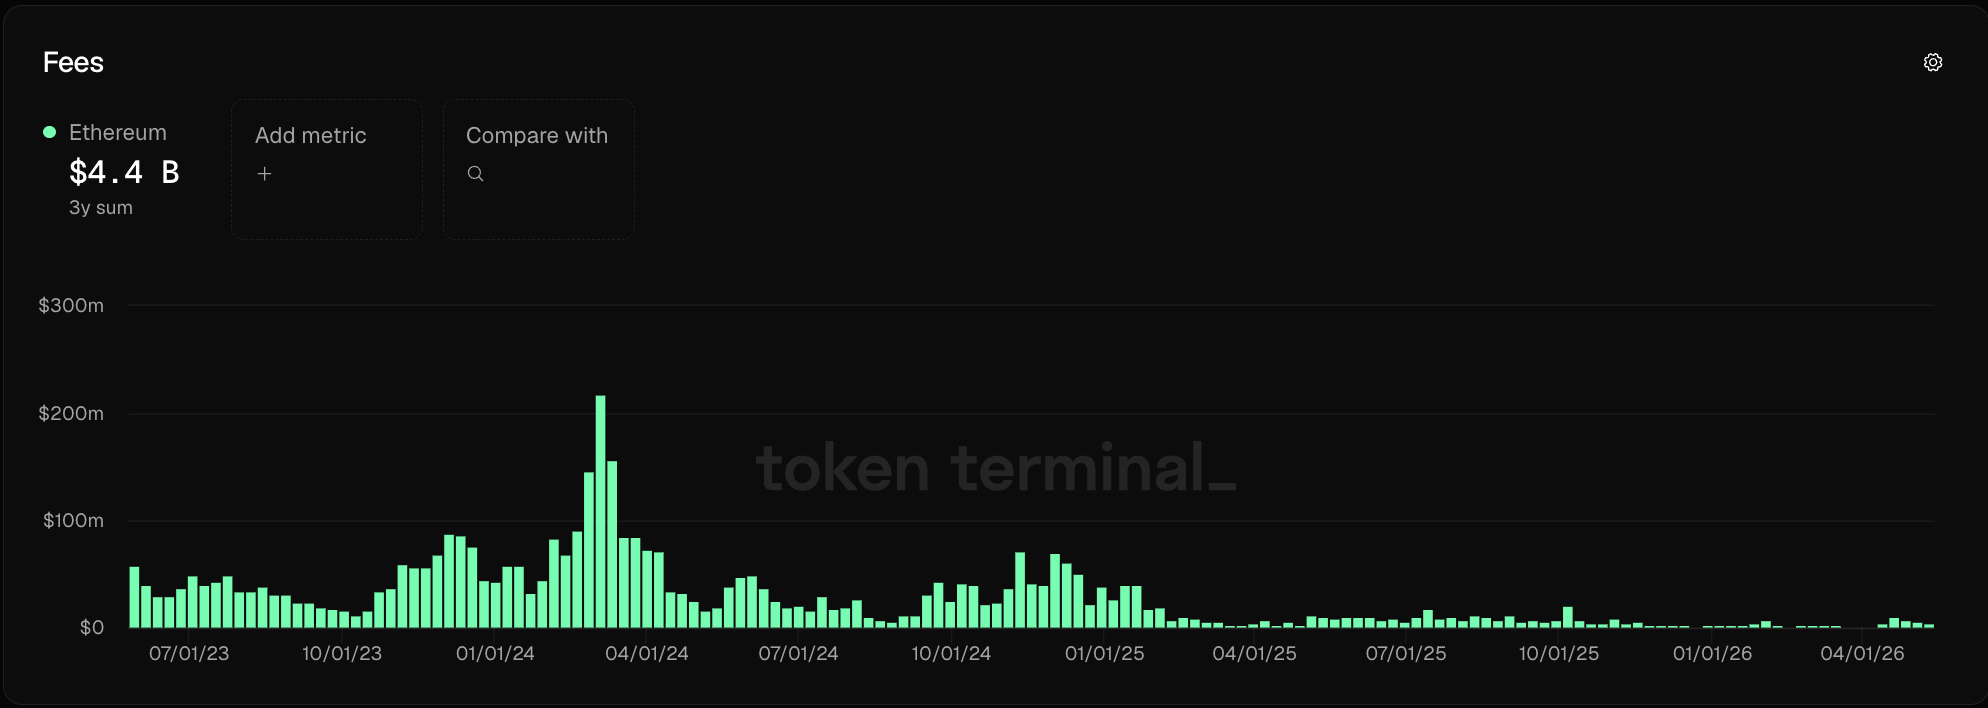
Fees on the Ethereum layer-1 blockchain network fell significantly after the Dencun upgrade in March 2024. Source: Token Terminal
Most investors “don’t want to believe in something that is not also putting up points on the scoreboard,” Shin said about ETH.
Buterin said on Sunday that the Foundation would focus on “longevity” and stretch its funds to finance research, meaning it would sell less ETH in the future.
In May, the Foundation unstaked 21,270 ETH from the Lido liquid staking platform, as part of its treasury strategy.
Unstaking ETH means those holdings will no longer generate yield for the Ethereum Foundation, but it is not a confirmation that the organization will sell those tokens.
Magazine: Why is Ethereum Foundation selling? BTC futures warning signs: Market Moves
TLDR:
- Alphractal linked Bitcoin rallies to improving Fed liquidity trends across multiple market cycles
- Fed RRP declines and Treasury spending continue shaping crypto market liquidity conditions
- VirtualBacon challenged expectations of a delayed Bitcoin bear market capitulation phase
- Bitcoin’s 200-week SMA near $61K remains a closely watched technical market level
Bitcoin liquidity conditions tied to Federal Reserve cash flows are gaining attention across crypto markets. New analysis from Alphractal linked Bitcoin price cycles to changes in Fed liquidity plumbing over the past several years.
The data focused on the Federal Reserve’s Reverse Repo Facility and Treasury General Account activity. The discussion emerged as Bitcoin traded near $76,500 while investors debated whether deeper downside remained ahead.
Bitcoin Liquidity Data Tracks Fed RRP and TGA Trends
Alphractal shared a breakdown showing how Fed liquidity conditions aligned with Bitcoin market cycles since 2020. The firm focused on the interaction between the Reverse Repo Facility, known as RRP, and the Treasury General Account.
According to the thread, rising liquidity often supported Bitcoin rallies across previous cycles. Tightening liquidity conditions frequently appeared before major crypto market corrections.
The report pointed to the 2020 and 2021 market expansion period. During that phase, combined RRP and TGA balances reportedly climbed from roughly $2 trillion to $7 trillion while Bitcoin rose from $10,000 to $69,000.
The same framework showed a reversal during 2022. Alphractal stated that aggressive liquidity tightening preceded Bitcoin’s decline from $69,000 to nearly $15,500 by several weeks.
The report also tracked conditions through 2023 and 2024. During that period, money market funds rotated into Treasury bills while the RRP facility steadily declined.
Alphractal said improving liquidity conditions appeared before Bitcoin rebounded toward $73,000. The post also referenced Bitcoin’s reported October 2025 peak near $126,200, noting liquidity indicators weakened months earlier.
Bitcoin Market Debate Shifts Toward Bear Market Timing
The liquidity discussion gained traction alongside a separate market thread from VirtualBacon focused on Bitcoin bear market bottoms. The post challenged the widely repeated expectation of a final capitulation event later in the cycle.
VirtualBacon compared prior Bitcoin downturns from 2015, 2018, and 2022. According to the thread, only the 2022 cycle ended with a sharp collapse near the final stage of the bear market.
The post argued that earlier cycles bottomed much sooner. In both 2015 and 2019, Bitcoin reportedly reached lows near its first major correction before stabilizing later.
VirtualBacon also highlighted Bitcoin’s 200-week simple moving average as a recurring market support zone. The thread placed the indicator near $61,000 while projecting it could rise toward $63,000 or $64,000 within two months.
Meanwhile, Alphractal noted current liquidity conditions remain mixed. The report cited a Federal Reserve rate range between 3.5% and 3.75%, a 3.8% CPI reading, and a stronger U.S. dollar index.
Despite those conditions, the thread stated Treasury spending and declining RRP balances continue adding liquidity beneath headline tightening measures. The report linked those trends to prior Bitcoin recoveries during fear-driven market periods.
Meghan McCain’s older brother, Douglas Shepp McCain, dies at 66: ‘A truly wonderful, joyful man,' the ex-“View” star says

Blak-blakan Menkeu Purbaya di Jogja Financial Festival

Kimi Antonelli wins Canadian GP after George Russell retires from lead

US brings back mandatory military draft registration

Steven Gerrard disagrees with Gary Neville over ‘shock’ Chelsea and Arsenal claim | Football

Register Renaming | Hackaday
Blak-blakan Menkeu Purbaya di Jogja Financial Festival

Iran’s Crypto Pipeline Raises New Questions #breakingnews #crypto #iran #bitcoin #blockchain #trump

Why is GenZ Taking LOANS?! | Financial Nihilism Part 2 | Ankur Warikoo Hindi
-

 Crypto World3 days ago
Blockchain.com files with SEC for U.S. IPO
-

 Fashion2 days ago
Holiday Weekend Open Thread – Corporette.com
-
 Crypto World3 days ago
Bitcoin Accumulation Weakens as BTC Realized Losses Hit $600M
-

 Business2 days ago
Dell Technologies DELL Stock Surges 15% on AI Server Momentum and Analyst Upgrades in 2026
-
 Crypto World2 days ago
Space X IPO Is ‘Bad News’ for Tech Stocks: But What About Bitcoin?
-

 Politics2 days ago
Makerfield: a tale of two social-media histories
-
 Crypto World3 days ago
MicroStrategy’s Saylor Says Miners No Longer Set Bitcoin Price, Another Force Has Taken Over
-

 Crypto World2 days ago
Robinhood crypto COO Tanya Denisova exits
-

 Business5 hours ago
NYT Strands Answers May 24 2026 Revealed for Puzzle No. 812 Theme Summer Essentials
-
 Tech2 days ago
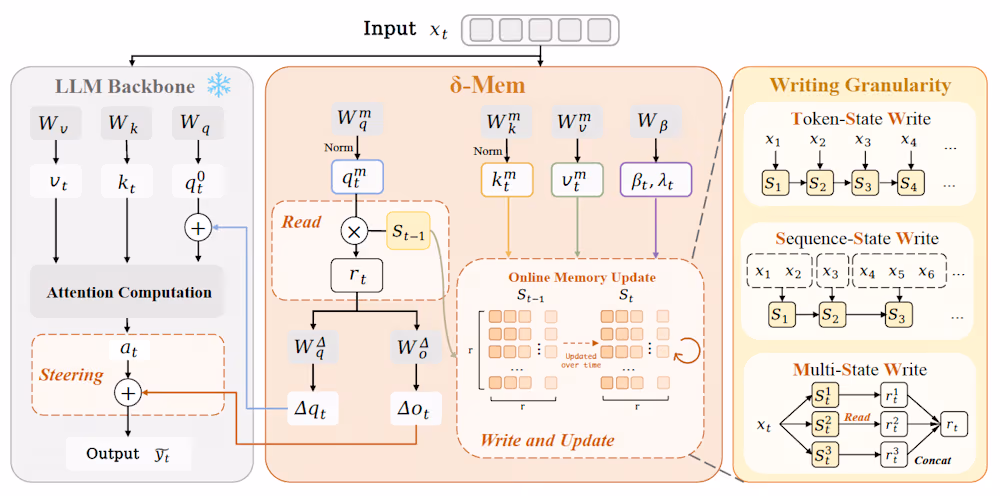
A 0.12% parameter add-on gives AI agents the working memory RAG can’t
-

 Crypto World2 days ago
AI infrastructure race heats up as IREN pitches full-stack strategy, WhiteFiber lands $160M deal
-

 Tech3 days ago
WhatsApp ads could make Irish debut after discussions with DPC
-

 Business3 days ago
Trump Invests $1M-$5M in Kura Sushi USA Chain With 27 California Locations
-

 Tech3 days ago
You Can Now Add ChatGPT To PowerPoint
-
Crypto World6 days ago
Revolut Launches Dogecoin Debit Card Across UK and EU
-

 Sports3 days ago
2026 CJ Cup Byron Nelson leaderboard: Brooks Koepka finds putting stroke in Round 1
-
 NewsBeat3 days ago
Charity run by Reform leader Malcolm Offord accused of ‘law breaking’ over Scottish registration
-

 Crypto World3 days ago
Trump Media’s Bitcoin Stash Shrinks Again as 2,650 BTC Lands on Crypto.com
-
Business3 days ago
Goldman Sachs reinstates Ageas stock coverage with neutral rating
-

 Crypto World4 days ago
Exa Labs raises $250 million in funding led by a16z
You must be logged in to post a comment Login