
Crypto World
Trump’s Hormuz Ultimatum Sends Oil Past $110, Highest Since March
Oil prices extended gains in early Asian trading on Monday as President Donald Trump sharply escalated threats against Iran. He vowed to strike power plants and bridges unless Tehran reopens the Strait of Hormuz by Tuesday.
The latest ultimatum signals that the six-week-old conflict is entering a more dangerous phase with no diplomatic off-ramp in sight.
Trump’s Ultimatum: ‘Power Plant Day, and Bridge Day’
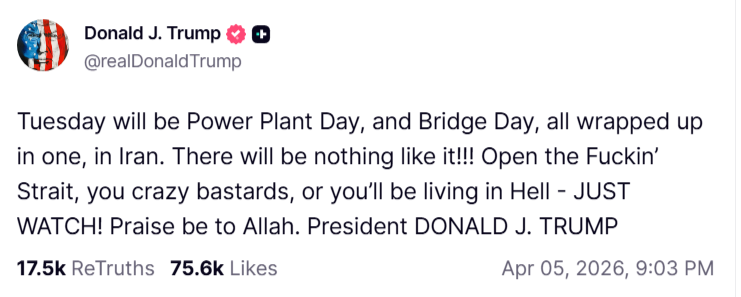
In a social media post, Trump declared Tuesday would be “Power Plant Day, and Bridge Day” and demanded Iran “open the f—ing Strait,” warning Tehran would “be living in Hell.” The unprecedented language signals Washington’s growing frustration with stalled diplomacy over the critical waterway.
Brent crude climbed above $111 a barrel, up 1.9%, while West Texas Intermediate traded near $112 during the Asian morning session. Tehran rejected the demands, and the Strait of Hormuz remains closed to most shipping traffic. The war has triggered a supply shock now threatening to become a full-blown global energy crisis.
Rising oil and fuel prices are stoking inflation, slowing economic growth, and squeezing businesses and consumers worldwide. US gasoline pump prices have risen by roughly $1 per gallon since the conflict began. Analysts expect the March consumer price data on Friday to show the sharpest monthly increase since 2022.
OPEC+ members approved a modest 206,000 barrel-per-day output increase for May after a weekend meeting. However, the move was largely symbolic, as key producers cannot increase output due to the war. Russian supply has also been disrupted by Ukrainian drone strikes on its Baltic Sea export terminal.
Market stress indicators are flashing red. Brent’s prompt spread widened beyond $10 a barrel in backwardation. That gap exceeds peaks seen during Russia’s 2022 invasion of Ukraine. Physical market prices tell an even starker story. Dated Brent surged past $140, reaching levels not seen since 2008.
Diplomacy Stalls as Attacks Continue
Iran has officially told mediators it will not meet US officials in Islamabad, and ceasefire efforts have stalled. Tehran has allowed limited passage through the Strait of Hormuz for select vessels from countries it deems friendly. Iraq received an exemption from Iran’s shipping curbs, though carriers remain cautious about entering the strait. Oman said it discussed options with Tehran to restore shipping flows.
Global buyers are now aggressively bidding for alternative crude supplies from the US Gulf Coast and the North Sea. Israeli strikes continued across Iran over the weekend, while Tehran hit Kuwait Petroleum Corp. headquarters and shut down an Emirati petrochemicals plant.
Asian equity markets opened cautiously. Japan’s Nikkei rose 0.7% and South Korean shares gained 2%. Gold fell about 1% to around $4,630 as surging energy costs undermined expectations of interest rate cuts.
The post Trump’s Hormuz Ultimatum Sends Oil Past $110, Highest Since March appeared first on BeInCrypto.


QuickSwap has issued an urgent warning after its official Discord server was compromised by an unauthorized party, raising fresh concerns over security risks in crypto communities.
The alert, posted on the platform’s verified X account on April 6, 2026, cautioned users to avoid interacting with any content shared within the server.
QuickSwap Under Attack as “Unauthorized Party” Seizes Discord: What Users Should Know
According to the team, attackers may be using the breach to spread malicious links, impersonate administrators, and promote fake giveaways or airdrops designed to trick users into connecting their wallets or transferring funds.
QuickSwap emphasized that it will never send direct messages first or request funds from users under any circumstances.
The decentralized exchange urged its community members to immediately mute or leave the Discord server and rely solely on official communication channels for updates.
The team also confirmed that it is actively working to regain control of the server, with further information expected as the situation develops.
Importantly, there is currently no indication that the breach has affected QuickSwap’s core protocol or smart contracts. This suggests that user funds remain safe unless individuals engage directly with malicious actors through the compromised server.
Discord hacks have become a recurring issue in the Web3 space, often exploiting human error rather than technical vulnerabilities. As such, users are strongly advised to remain cautious, verify all announcements through official sources, and avoid clicking unfamiliar links during this period of heightened risk.
The post QuickSwap Discord Breach Triggers Urgent Security Warning for Users appeared first on BeInCrypto.
The meme coin sector is showing pockets of strength even as the broader crypto market trades cautiously. Whale flows and technical divergences are building across several tokens simultaneously, suggesting that capital is quietly rotating back into the category. BeInCrypto analysts have identified three key meme coins to watch this week.
While several factors have influenced the coin identification, on-chain accumulation and chart structure converging are the key triggers.
Shiba Inu (SHIB)
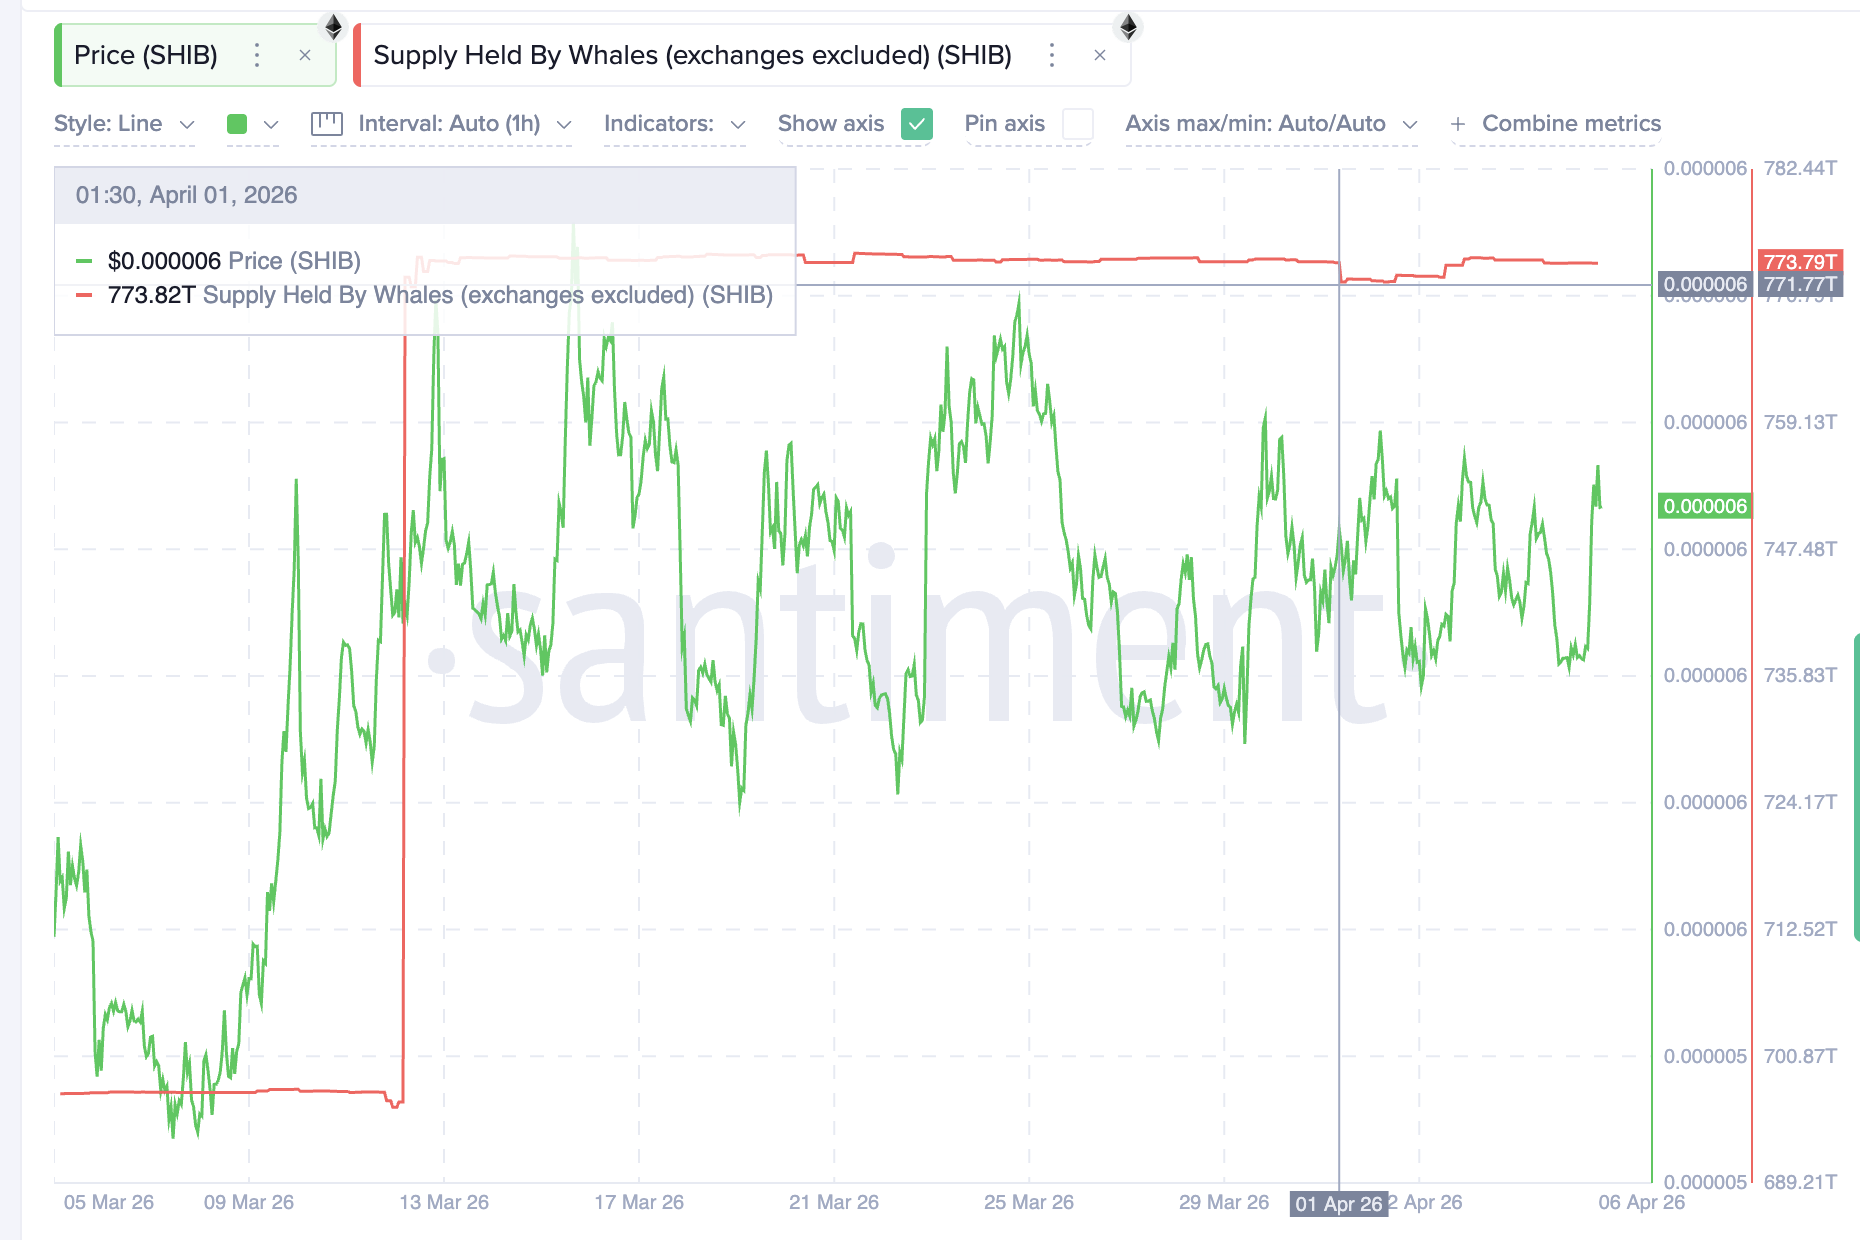
Shiba Inu (SHIB) trades at $0.00000602, up 11% over the past 30 days but still down 13% year-to-date. Whale wallets have been gradually increasing their holdings since a sharp accumulation phase began around March 13, when balances surged to above 771 trillion SHIB. Since April 1, whales have added another 2.02 trillion tokens worth approximately $12.16 million, pushing total holdings to 773.79 trillion.
The daily chart supports the case for a potential reversal and validates renewed whale interest. Between January 31 and April 5, price made a lower low while the Relative Strength Index (RSI), a momentum oscillator, made a higher low. That standard bullish divergence flashed on April 2 as well, and SHIB has since bounced before failing at the 0.382 Fibonacci level . The token now trades just above that level, sitting at $0.00000599.
However, meaningful resistance sits at $0.0000064, a level that has capped every recovery attempt since February 18. A clean close above that level would open the path toward $0.0000072 and higher. A fall below $0.0000057 would weaken the divergence setup and expose $0.0000052 as the next floor.
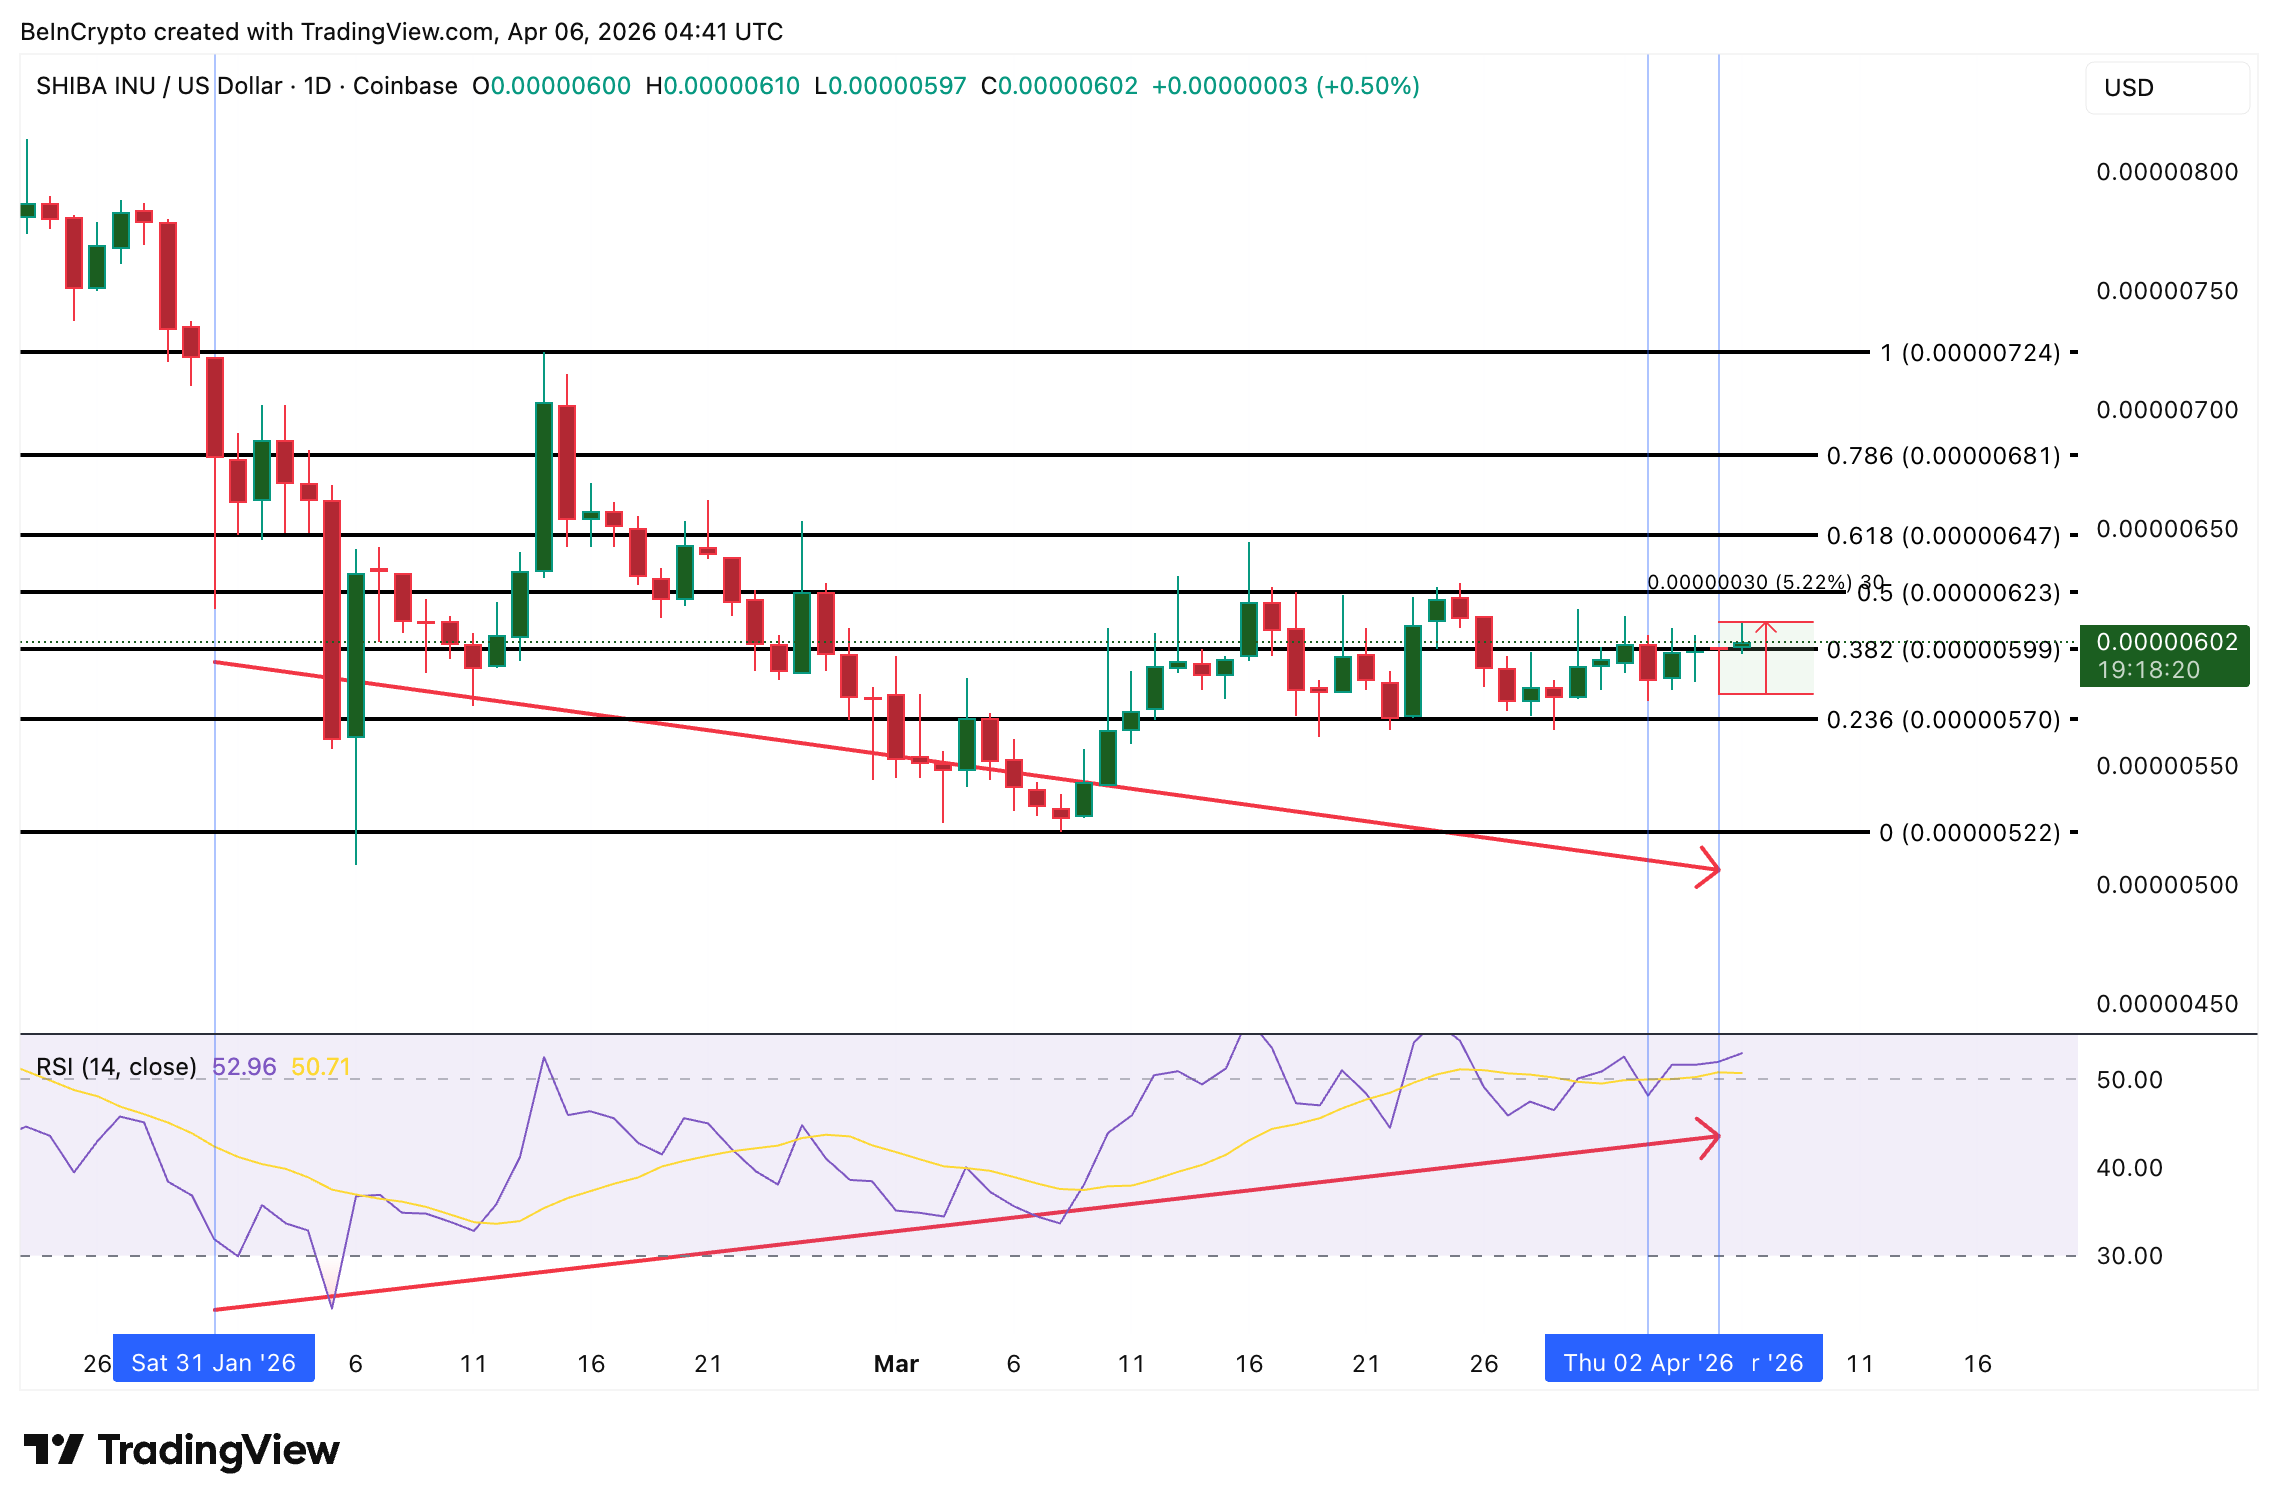
A close above $0.0000064 confirms whale-backed strength, while a break below $0.0000057 invalidates the divergence for now.
SPX6900 (SPX)
SPX6900 (SPX) sits near $0.28, up 6.51% on the day after crypto influencer Murad Mahmudov argued that SPX is stabilizing at the same market cap level where Dogecoin and Pepe consolidated before their explosive rallies.
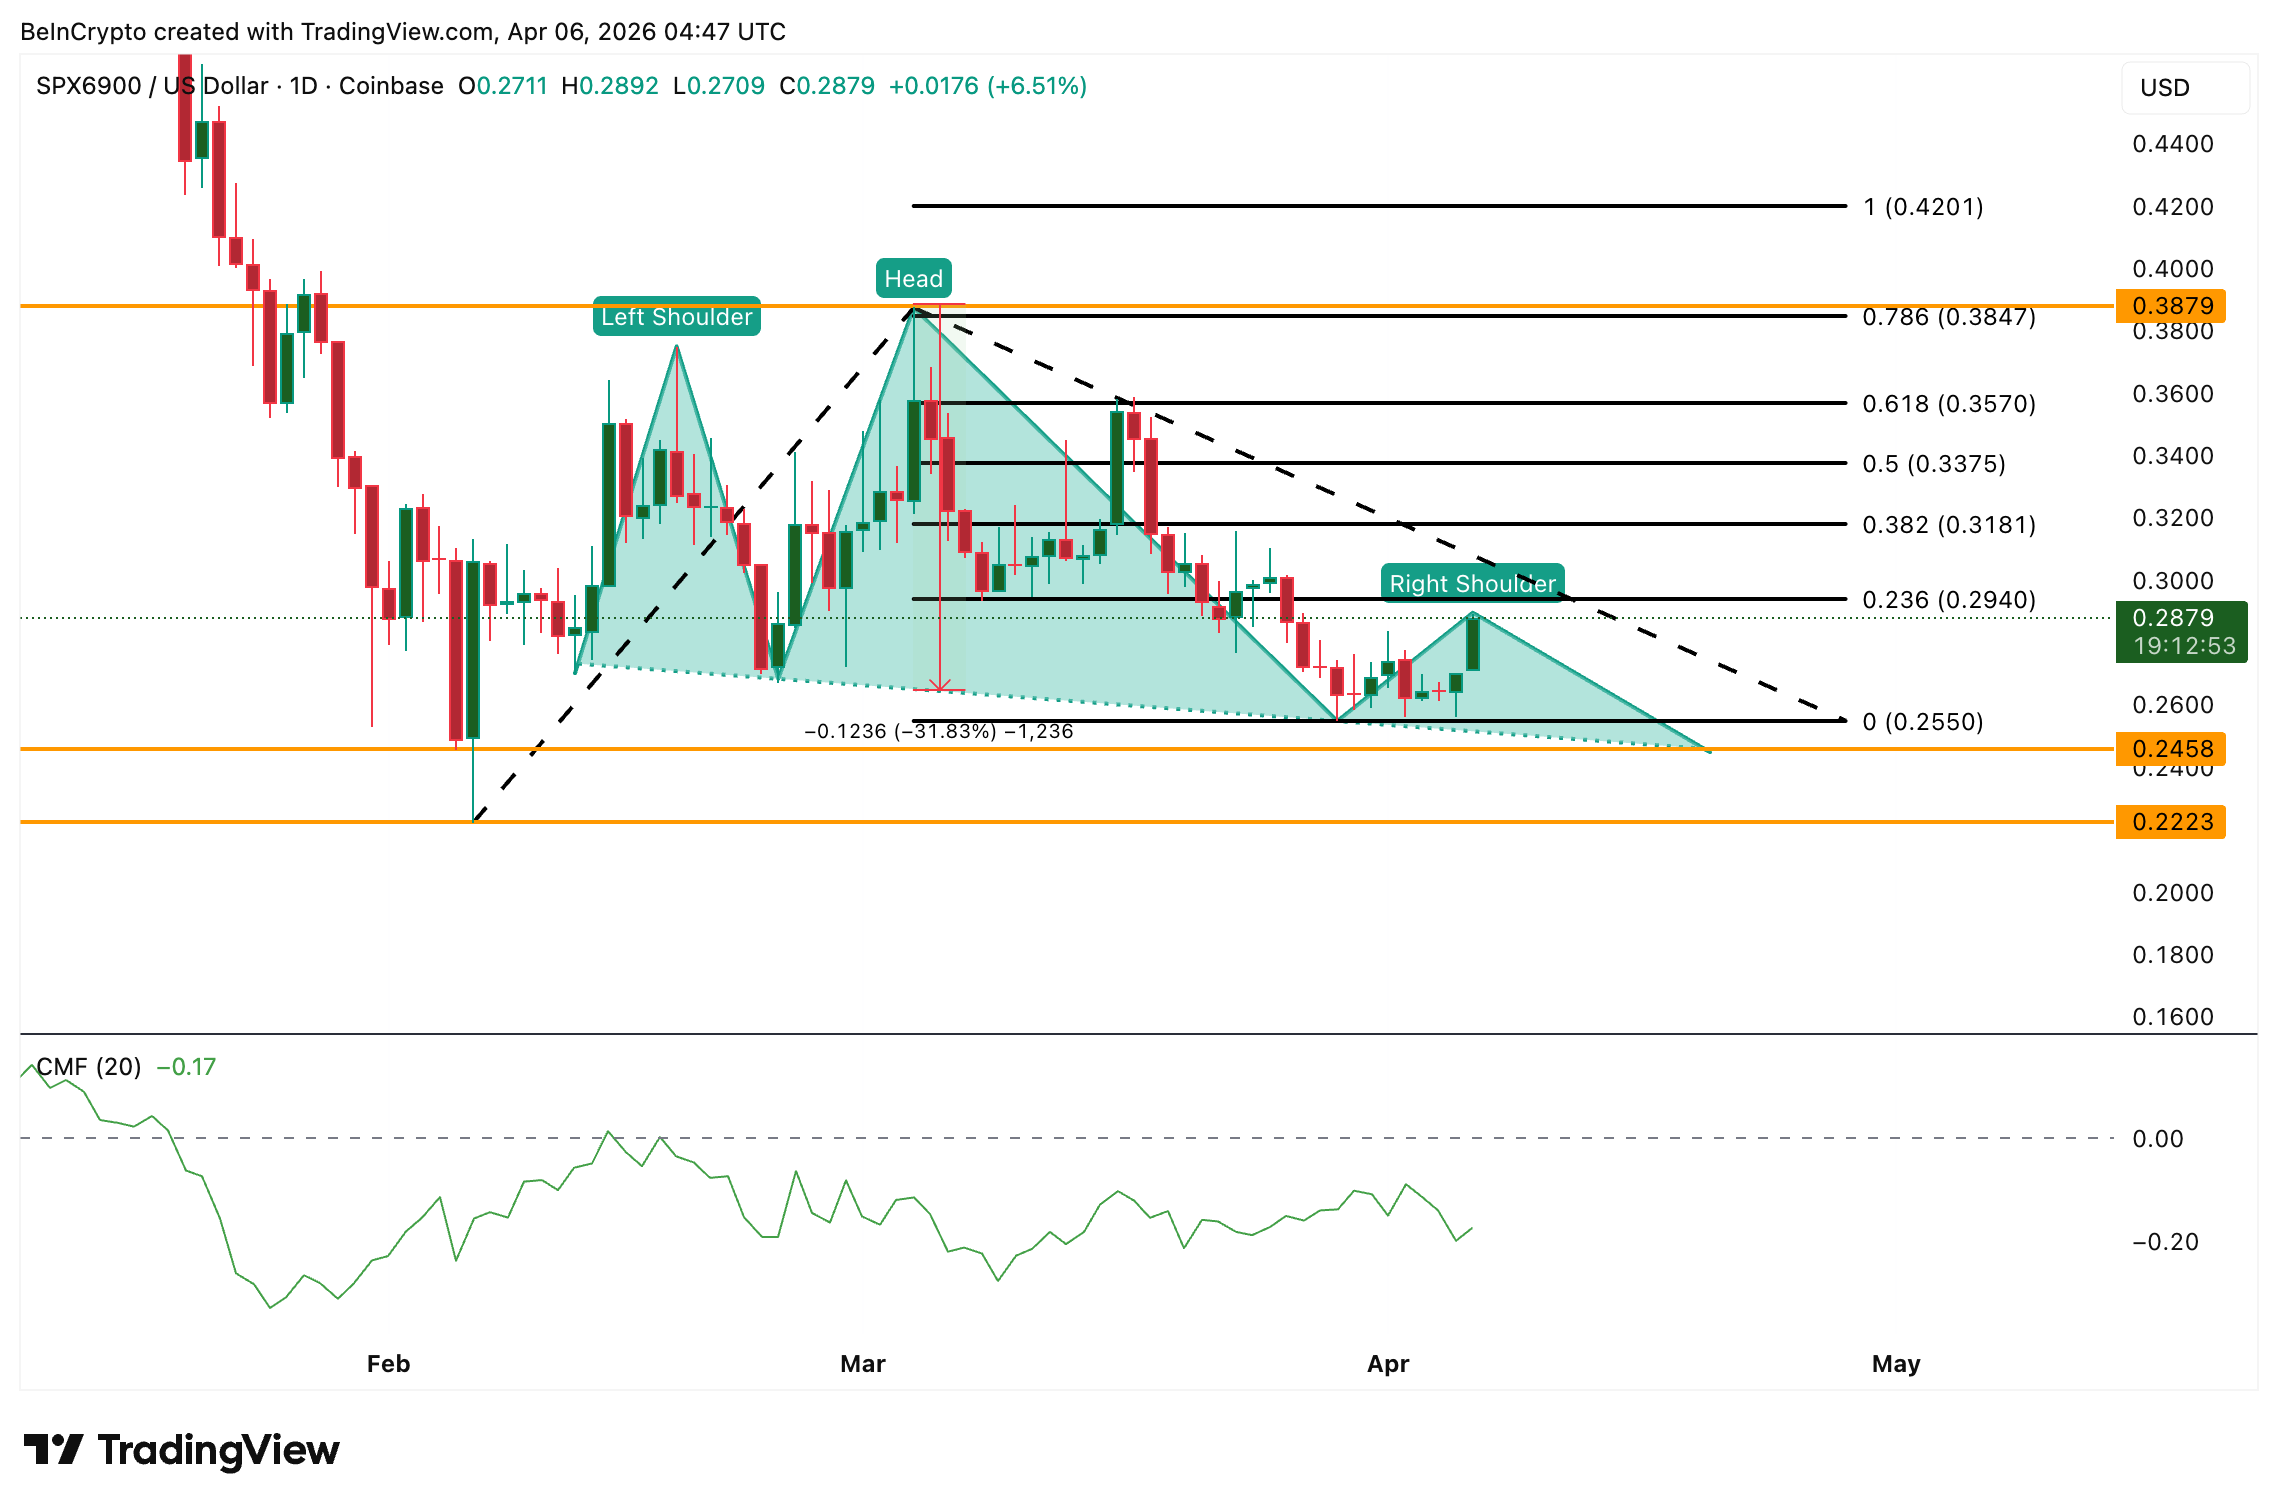
The chart tells a more cautious story about this meme coin to watch. The daily timeframe shows a developing head and shoulders pattern. The neckline sits at $0.24. A confirmed break below that level would activate a 31% measured move target.
Chaikin Money Flow (CMF), a proxy for institutional buying and selling pressure, reads -0.17 and remains well below the zero line. That negative reading means big money has not been flowing in despite the price bounce. Until CMF crosses above zero, every rally risks forming the right shoulder of a bearish reversal pattern rather than the start of a sustained move.
Want more token insights like this? Sign up for Editor Harsh Notariya’s Daily Crypto Newsletter here.
Any price peak toward $0.38 while CMF stays negative would complete the right shoulder and strengthen the bearish case. For the pattern to be invalidated, SPX would need to reclaim $0.35 with CMF turning positive. However, if it fails to hold above $0.29 and breaks the $0.24 neckline, the pattern projects a drop toward $0.22 and lower.
A reclaim of $0.35 with positive CMF weakens the head and shoulders formation and a move above $0.38 invalidates the bearishness altogether. However, a break below $0.24 activates a 31% downside target.
Pepe (PEPE)
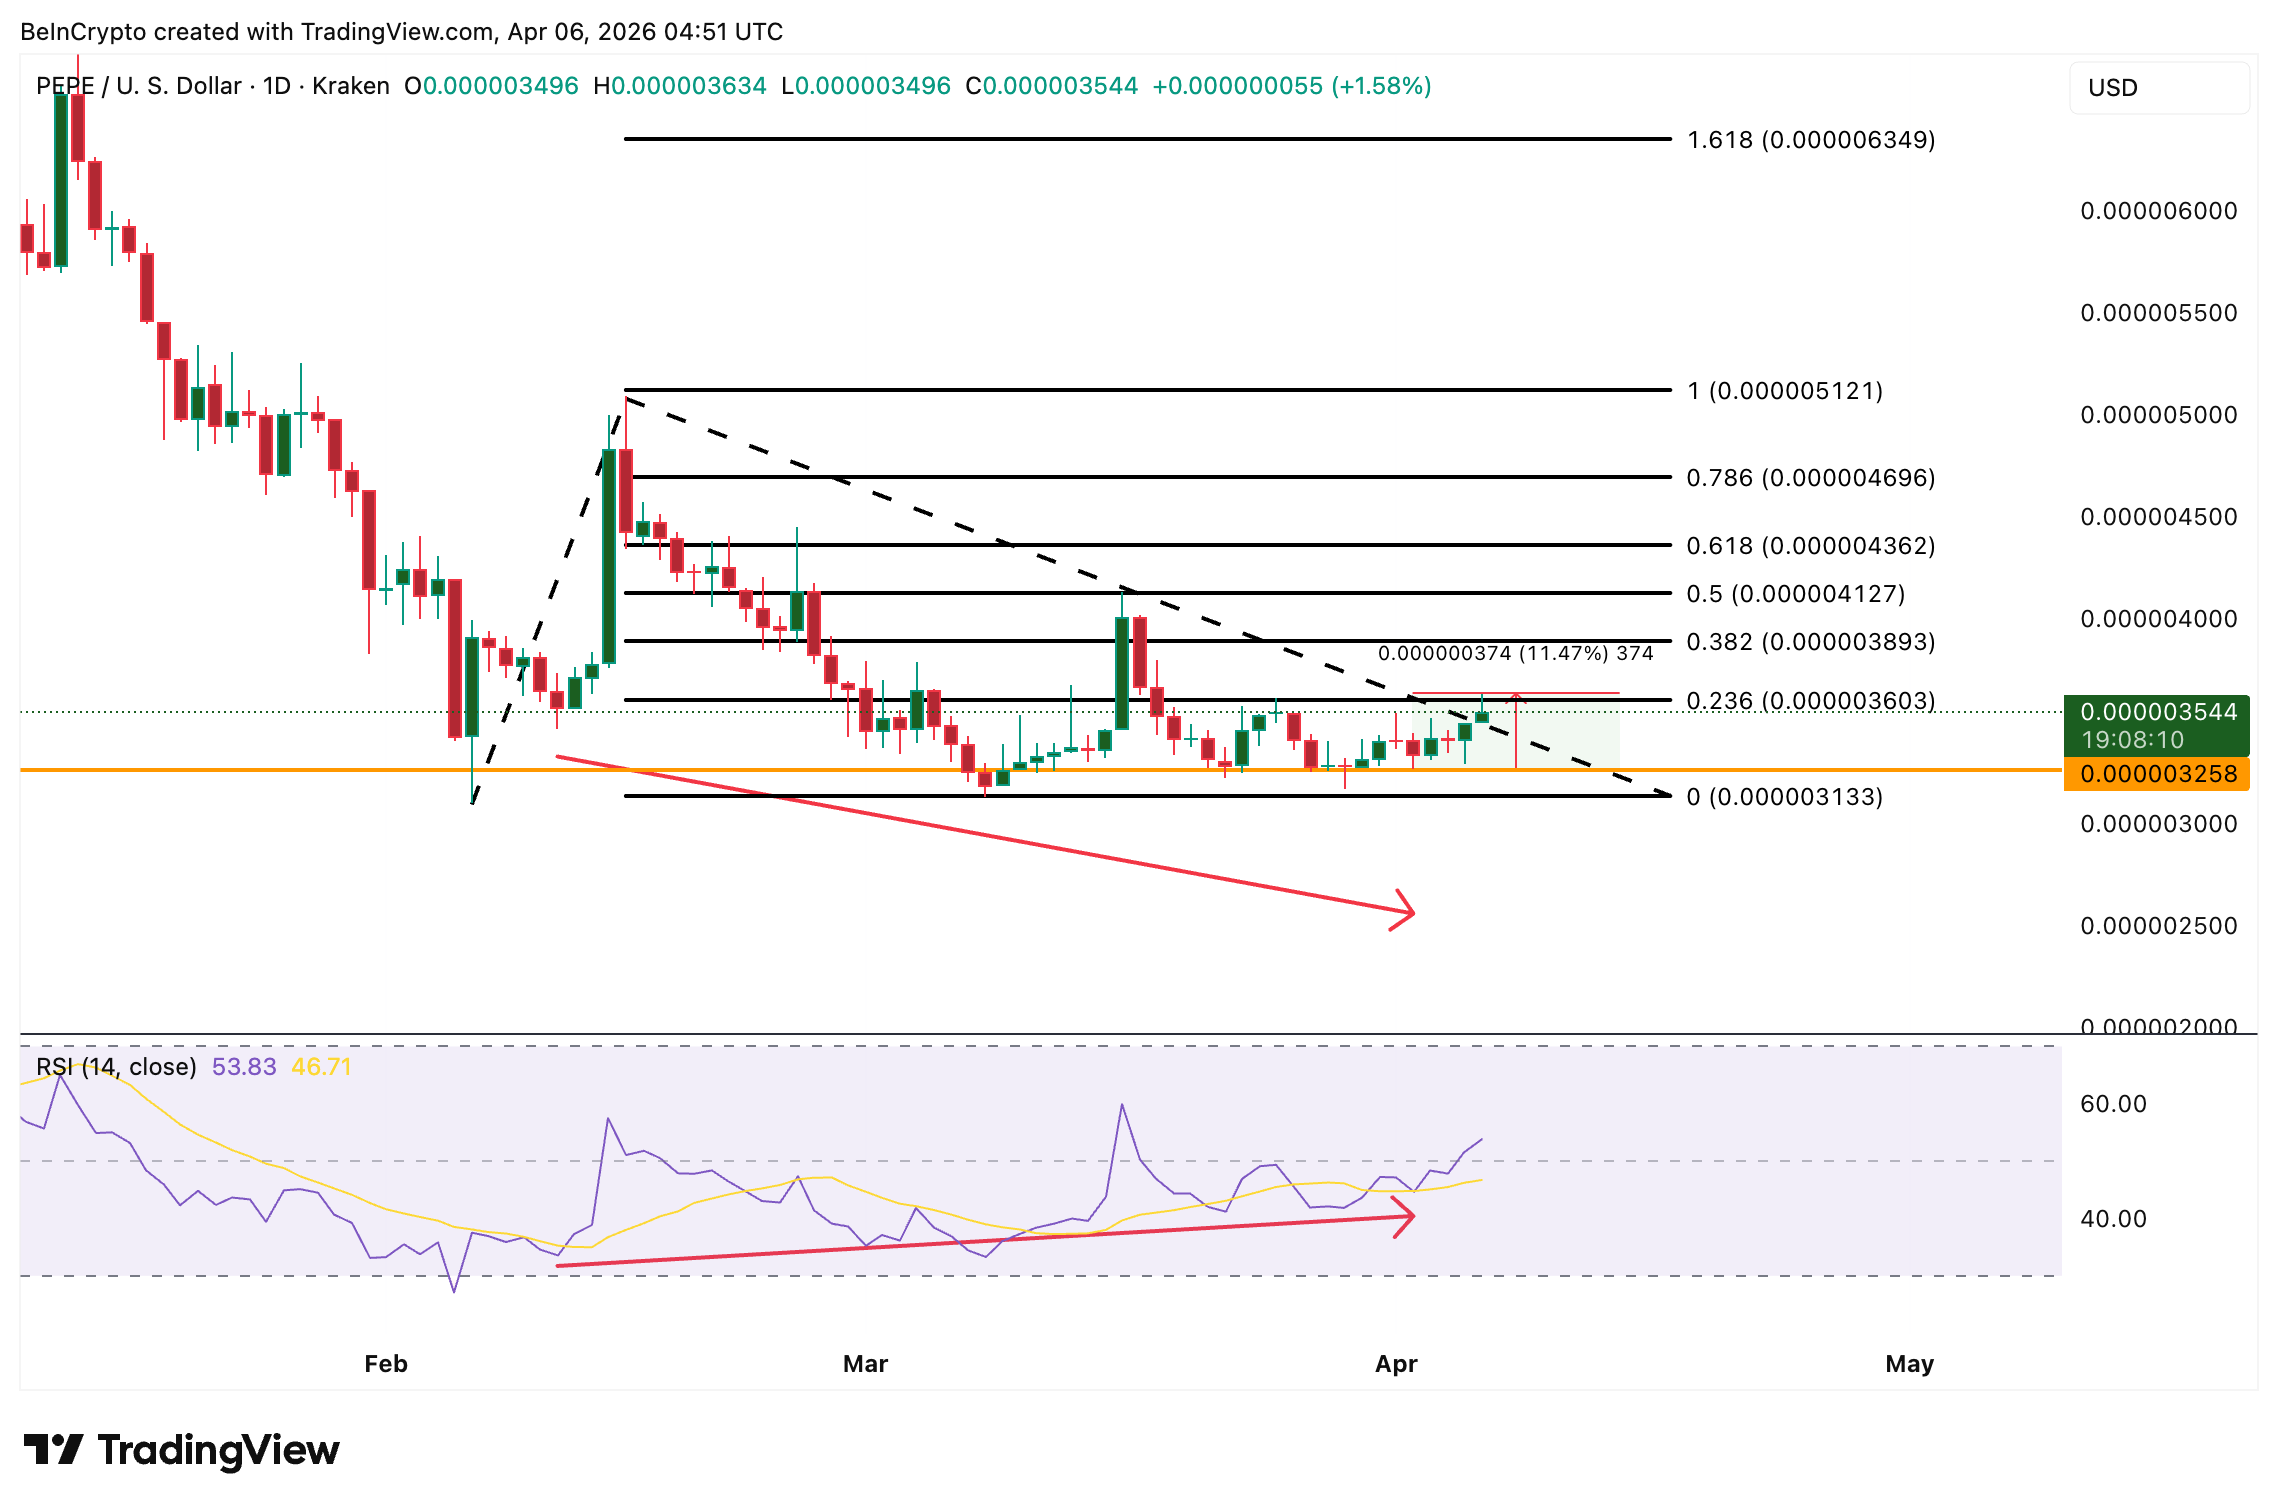
Pepe (PEPE) is at $0.000003544, up 4% over the past 30 days and 6% over the past seven days. Among the meme coins to watch this week, PEPE shows the most aligned setup between whale activity and chart structure.
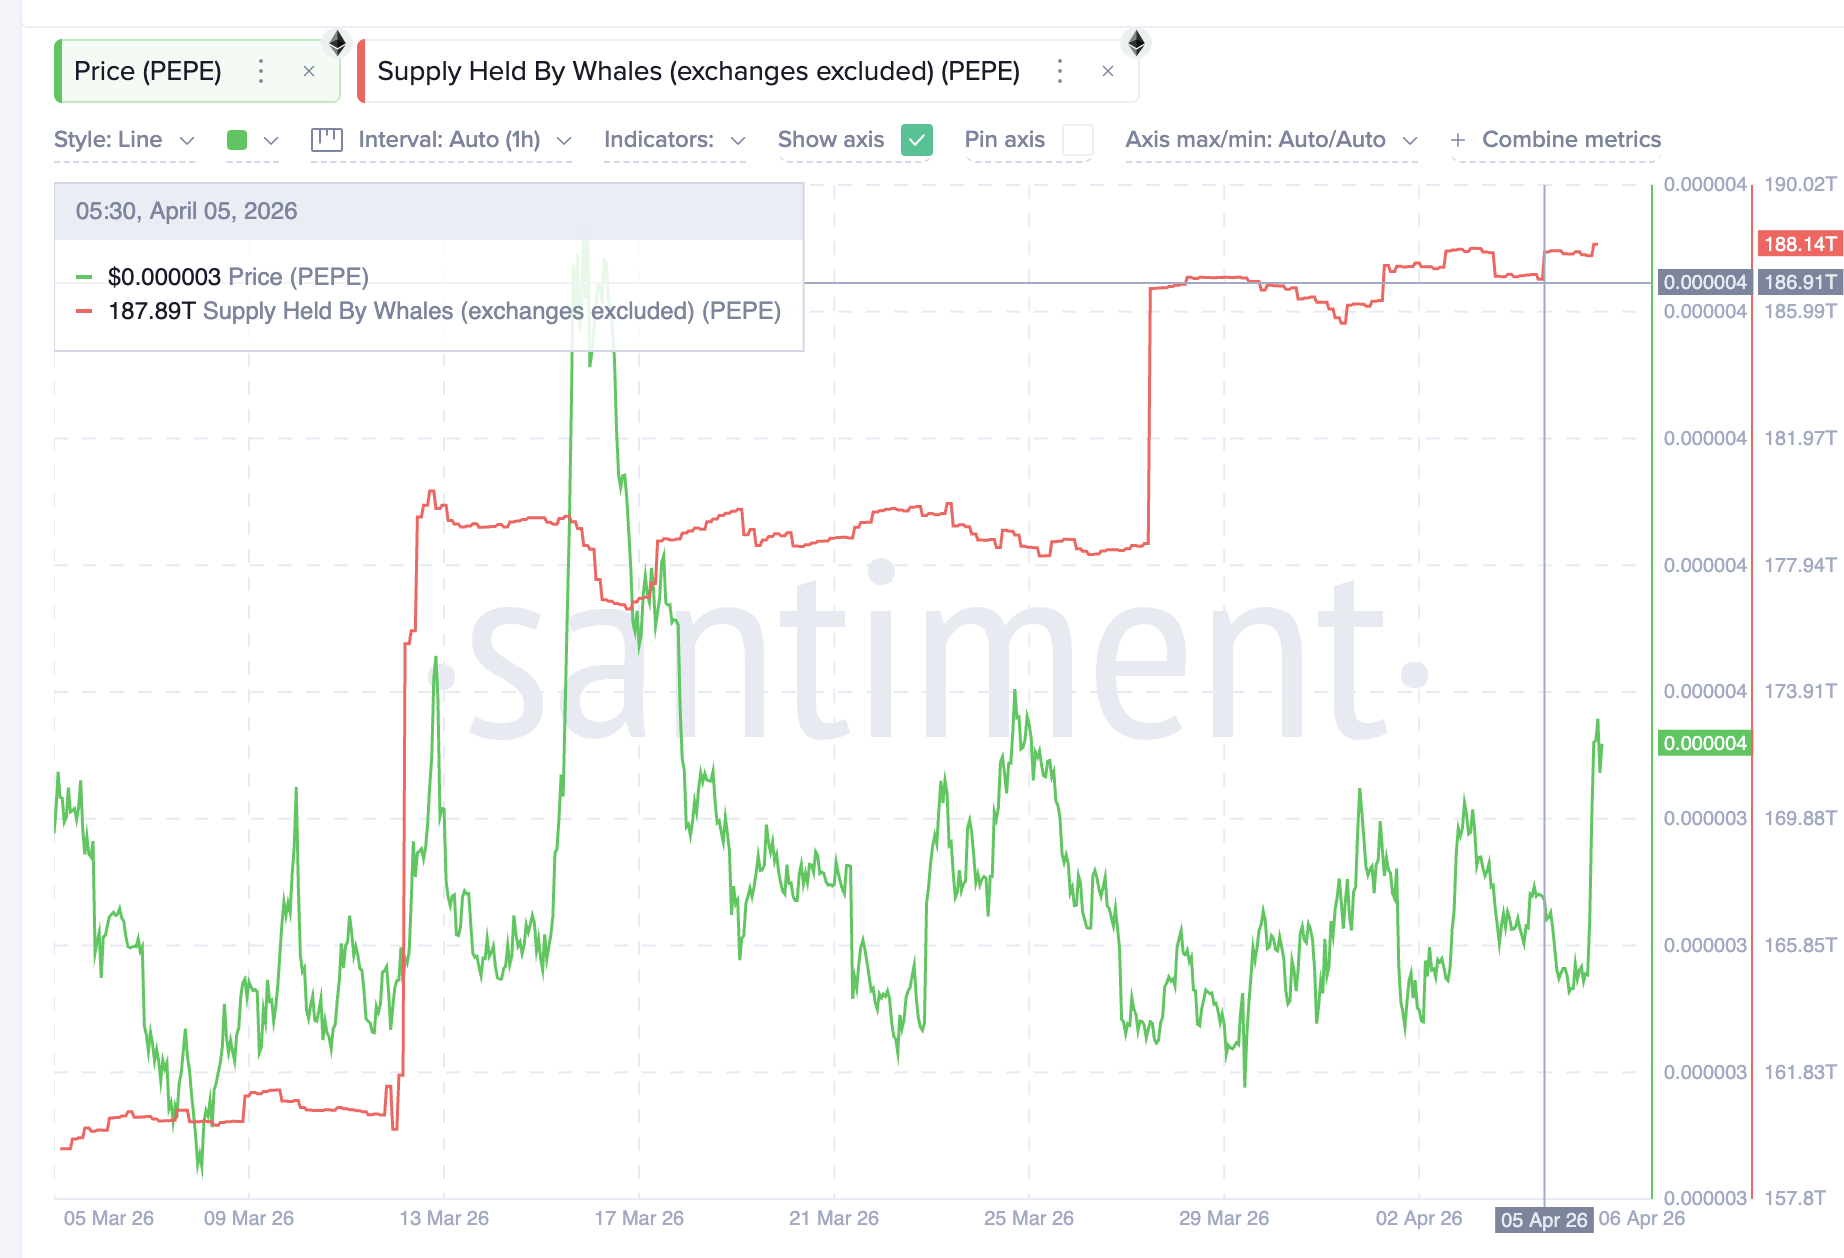
On-chain data from Santiment reveals a sharp spike in whale holdings on April 5, jumping from 186.91 trillion to 188.14 trillion PEPE. That 1.23 trillion token increase worth roughly $4.36 million represents fresh accumulation rather than a redistribution between wallets, as the move coincides with a visible buying wick on the price chart.
The daily chart confirms the momentum shift. Between February 11 and April 2, price printed a lower low while RSI printed a higher low, forming a standard bullish divergence. Since the divergence completed, PEPE has rallied approximately 11% with whales adding incrementally between April 1 and April 5. The token now trades above the $0.0000032 support and is approaching the $0.0000036 resistance.
A close above $0.0000036 would confirm the breakout and target $0.0000043 at the next major technical level. Above that, the uptrend extends toward $0.0000047 and higher. A fall below $0.0000032 would weaken the divergence structure and open the path toward $0.0000031 and lower.
A close above $0.0000036 confirms the whale-backed rally has legs. However, a break below $0.0000032 would undermine the bullish divergence setup.
The post 3 Meme Coins To Watch In The Second Week Of April 2026 appeared first on BeInCrypto.

Inflation returns to the center of attention this week, with a fresh inflow of data likely to shape expectations for U.S. interest rates and risk assets like bitcoin .
Thursday’s U.S. core PCE reading for February and Friday’s March CPI release will test the view that the Federal Reserve can afford to wait before cutting rates. Earlier this year, rate cuts looked almost certain. That has shifted. On Polymarket, odds of no rate cuts in 2026 climbed from about 2.9% in mid-January to 35.9%.
André Dragosch, head of research at Bitwise Europe, said on social media that bitcoin has been “pricing in a (U.S.) recession already” and has acted as a “canary in the coal mine,” falling below signals from financial conditions and forward-looking indicators.
Recent data complicates that view. The ISM Manufacturing Index surprised to the upside in March, suggesting the U.S. economy may be more resilient to higher oil prices than in past cycles.
Following the release, market-based recession odds for this year dropped from around 37% to 28%.
As bitcoin has priced in a storm, Dragosch noted that the risk-reward ratio for bitcoin “is significantly skewed to the upside.” Still, an unexpected escalation in the war in the Middle East could bring about the priced-in storm.
What to Watch
(All times ET)
- Crypto
- April 6, 12 p.m.: DeFi Dev Corp. (DFDV) to host a March 2026 recap and Ask Me Anything (AMA) session on X Spaces.
- April 8: Stellar’s Yardstick protocol stable release to become available.
- April 9: Aerodrome’s Flight School to conclude and merge with the Public Goods Fund to form the Momentum Fund.
- April 9: Binance to migrate all DAI functionality to USDS.
- Macro
- April 6, 09:00 a.m.: U.S. ISM Services PMI for March est. 55 (Prev. 56.1)
- April 7, 07:15 a.m.: U.S. ADP Employment Change Weekly (est. 10K)
- April 7, 7:30 a.m.: U.S. Durable Goods Orders MoM for February est 04% (Prev. 0%)
- April 7, 11:35 a.m.: Chicago Fed President and CEO Austan Goolsbee to participate in a conversation on economic and monetary policy.
- April 8, 4:00 a.m.: Euro Area PPI YoY for February est. -1.9% (Prev. -2.1%); MoM est. 0.5% (Prev. 0.7%)
- April 8, 1:00 p.m.: FOMC minutes from the March 17–18 meeting release.
- April 9, 7:30 a.m.: U.S. Core PCE Price Index MoM for February est. 0.4% (Prev. 0.4%);
- April 9, 7:30 a.m.: U.S. Personal Income MoM for February est. 0.3% (Prev. 0.4%); Personal Spending MoM est. 0.5% (Prev. 0.4%)
- April 9, 7:30 a.m.: U.S. Q4 GDP Growth Rate QoQ (final) est. 0.7% (Prev. 4.4%)
- April 9, 7:30 a.m.: U.S. Initial Jobless Claims for week ending April 4 est. 200K (Prev. 202K)
- April 9, 8:30 p.m.: China CPI YoY for March est. 1.2% (Prev. 1.3%) ;MoM (Prev. 1%)
- April 9, 8:30 p.m.: China PPi YoY for March est. 0.4% (Prev. -0.9%)
- April 10, 7:30 a.m.: Canada Unemployment Rate for March (Prev. 6.7%)
- April 10, 7:30 a.m.: U.S. CPI MoM for March est. 0.9% (Prev. 0.3%); Core CPI MoM est. 0.3% (Prev. 0.2%)
- April 10, 7:30 a.m.: U.S. CPI YoY for March est. 3.4% (Prev. 2.4%); Core CPI YoY est. 2.7% (Prev. 2.5%)
- April 10, 10:00 a.m.: U.S. University of Michigan Consumer Sentiment (Preliminary April) est. 52.5 (Prev. 53.3)
- Earnings (Estimates based on FactSet data)
Token Events
- Governance votes & calls
- April 7: Kamino and xStocks to host an X Spaces session on tokenization.
- Aave DAO is voting to adjust oracle configurations, reduce liquidation thresholds, and modify interest-rate models across its V2 markets to support their continued deprecation. Voting ends April 6.
- Decentraland DAO is voting to require the DAO Council and Regenesis Labs to formally publish a 2030 definition of success and contingency plan. The proposal currently has support from voters. Voting ends April 6.
- Balancer DAO is voting across two linked proposals to restructure operations with a reduced team and budget, and to revamp tokenomics by halting BAL emissions, discontinuing veBAL, routing all fees to the treasury, and offering a token buyback. Voting ends April 7.
- CoW DAO is voting 85 to fix its solver rewards budget at 50% of protocol revenue, splitting it between performance and new consistency rewards. The proposal has overwhelming support and ends April 7.
- ShapeShift DAO is voting to cut DFC compensation, saving ~$24k/year in FOX. It clarifies roles and mandates annual renewals. Voting ends April 8.
- Arbitrum DAO is voting across two proposals to amend its Audit Program with a flexible alignment framework and an AI-security scan pilot, and to transfer 6,000 ETH and idle stablecoins to the Treasury Management Portfolio for yield generation. Voting ends April 9.
- Unlocks
- Token Launches
- April 9: OneFootball (OFC) token generation event to occur.
Conferences

Beyond oil, the Strait of Hormuz blockade is now rippling through another critical artery of the global economy: fertilizers.
Analysts warn this disruption could spiral into a multi-country food crisis well beyond the energy markets.
The Iran War’s Quiet Domino Effect
Around one-third of the world’s seaborne fertilizer trade moves through the Strait of Hormuz. Countries exposed to instability in the Persian Gulf export nearly half of the global urea and 30% of the ammonia, two nutrients essential for crop growth.
Follow us on X to get the latest news as it happens
Since the conflict began on February 28, shipping through the strait has collapsed by more than 95%, according to UNCTAD. The chain reaction is straightforward and severe: no fertilizer → smaller harvests → spiking food prices → basic staples become unaffordable for millions.
This is not a distant risk. It is already unfolding. Granular urea prices in Egypt, a major global benchmark for nitrogen fertilizers, have jumped to roughly $700 per metric ton from a pre-war range of $400 to $490.
“Urea fertilizer is up 50% since the Strait closed five weeks ago. 30% of the world’s fertilizer passes through Hormuz. The Gulf produces nearly half of global urea and 30% of ammonia. European and African farm markets are already paying for it,” The Hormuz Letter posted.
The Food and Agriculture Organization (FAO) projects global fertilizer prices will average 15% to 20% higher in the first half of 2026 if the disruption persists. FAO Chief Economist Máximo Torero called the blockade one of the most severe shocks to global commodity flows in recent years.
UBS economist Arend Kapteyn projects fertilizer prices will rise 48% year over year, pushing global food prices up 12%.
Why Timing Makes This Worse
The timing of the disruption is especially critical. In countries like India, fertilizer shortages directly affect planting decisions during the kharif season. Miss this window, and the consequences are locked in for the rest of the year.
“Procurement for the kharif season typically begins in May, ahead of sowing of crops such as rice and cotton in June and July, leaving a narrow window before fertilizer shortages could start to affect the harvest yield,” The Guardian reported.
The crisis is structural, not just logistical. The Hormuz disruption could have food supply consequences lasting well beyond any ceasefire or resolution.
Shanaka Anslem Perera argues that the 2026 crisis mirrors Sri Lanka’s 2022 collapse, but instead of a policy move, it’s driven by supply disruptions from the Strait of Hormuz.
“The kharif planting season runs April through June. Seeds not planted in April do not produce rice in October. Fertiliser not applied at sowing does not improve yields at harvest,” he said. “Sri Lanka’s 2022 default took eleven months from fertiliser ban to sovereign collapse. The Hormuz closure is five weeks old. The kharif window closes in June. The trajectory is the same. The velocity is faster. And the number of countries on the path is not one. It is twelve.”
Thus, what started as a geopolitical disruption in oil markets is also shifting into a multi-layered global crisis. Fertilizers sit at the foundation of modern food production. Any sustained shock to their supply could have delayed but compounding effects.
Unlike oil, which can be rerouted or substituted over time, fertilizer shortages are far less flexible. Agricultural cycles are fixed, and missed inputs result in direct losses of output.
If the Strait of Hormuz remains constrained, the world may be facing not just an energy crunch but the early stages of a synchronized global food shock.
Subscribe to our YouTube channel to watch leaders and journalists provide expert insights
The post The Strait of Hormuz Isn’t Just an Oil Problem, It’s Now a Food Problem appeared first on BeInCrypto.
Key Highlights
- Bitcoin declined roughly 1.5% over the past week while the S&P 500 plummeted approximately 10% in just two days
- Charles Schwab announces plans to offer direct spot Bitcoin and Ethereum trading by H1 2026
- BitMEX co-founder Arthur Hayes forecasts Bitcoin may drop under $60,000 before climbing to $250,000
- A technical analyst projects potential Bitcoin collapse to $12,000–$13,000 range by mid-2027
- Historical data reveals Bitcoin typically outperforms both gold and S&P 500 within 60 days following major crises
Bitcoin experienced significantly less volatility than traditional equities this past week. As the S&P 500 tumbled approximately 10% over a two-day period, Bitcoin’s decline stayed modest at around 1.5%. This divergence has prompted some market participants to reassess cryptocurrency’s role in their portfolios.
The equity selloff was triggered by President Trump’s tariff policy announcements, which sent shockwaves through international financial markets. Throughout the turbulence, Bitcoin maintained support above the $66,000 level, later climbing back toward $67,300 even as stock indices continued their descent.

Charles Schwab, overseeing approximately $12 trillion in client assets, revealed plans to introduce direct spot trading for Bitcoin and Ethereum. The forthcoming “Schwab Crypto” account is slated to debut during the first six months of 2026.
This offering differs fundamentally from exchange-traded fund products. Users will gain the ability to manage cryptocurrency holdings alongside their traditional stock and bond portfolios within a single unified account.
Robinhood’s CEO Vlad Tenev also captured attention this week by describing market closing times as “a legacy design choice” and suggesting that tokenization could transform markets to function more similarly to internet infrastructure.
Hayes Advises Caution Until Fed Action
Arthur Hayes, who co-founded BitMEX and serves as Chief Investment Officer at Maelstrom, expressed a cautious stance on current market conditions. During an appearance on the Coin Stories podcast, he stated he wouldn’t allocate his final investment dollar to Bitcoin at present.
His rationale centers on the Federal Reserve’s current liquidity stance. Hayes contends that tariff policies will ultimately generate sufficient voter backlash to force the United States toward implementing capital controls as an alternative approach.
Such capital controls, according to his analysis, would serve as a significant driver for Bitcoin adoption. He maintains ambitious long-term price projections ranging from $250,000 to $750,000 for Bitcoin before this market cycle concludes.
However, he cautioned that an extended military confrontation between the U.S. and Iran might temporarily drive Bitcoin beneath the $60,000 threshold. Hayes additionally identified artificial intelligence-driven workforce displacement as another risk factor that could trigger a deflationary credit contraction.
Historical Performance Analysis
Analysis conducted by Mercado Bitcoin examined the 60-day aftermath of significant global disruptions, encompassing previous tariff wars and the COVID-19 pandemic outbreak. Their findings indicate Bitcoin repeatedly delivered superior returns compared to both gold and the S&P 500 during these recovery windows.
Bitcoin typically experiences initial selling pressure during crisis events as market participants shift toward cash positions. Yet historical patterns demonstrate it has recovered more rapidly and aggressively than conventional asset classes.
Not all market observers anticipate an imminent price floor. A technical analyst operating under the pseudonym King of the Charts anticipates Bitcoin establishing a bottom between $51,000 and $53,000, followed by an 80% to 90% correction down to approximately $12,000 by the middle of 2027.
The Crypto Fear and Greed Index has remained anchored in “Extreme Fear” territory for multiple weeks, with measurements approaching single-digit levels.
In a separate conversation with David Lin, Hayes emphasized that straightforward Bitcoin acquisition represents the optimal strategy for protecting against fiat currency devaluation, particularly given the increasing complexity of equity selection.
The Schwab cryptocurrency platform remains on schedule for its first-half 2026 launch.

Crypto World
China orders Apple to pull Dorsey’s Bitchat, the messaging app used during Iran protests


Tech giant Apple removed Bitchat, a decentralized peer-to-peer messaging app developed by Block CEO Jack Dorsey, from its China App Store at the request of Beijing’s internet regulator, Dorsey disclosed in an X post on Sunday.
The Cyberspace Administration of China argued the app violated regulations governing online services with “public opinion or social mobilization capabilities,” a provision that requires security assessments before launch.
Apple’s app review team told Dorsey that both the App Store listing and the TestFlight beta version would no longer be available in China, though the app remains accessible in other countries.
Bitchat runs entirely over Bluetooth and mesh networks with no internet connection required, a design that makes it functionally impossible for governments to block through conventional internet shutdowns or firewall filtering.
That architecture has made it a tool of choice during recent protests in Madagascar, Uganda, Nepal, Indonesia, and Iran, where authorities attempted to restrict internet access to curb dissent.
The app has been downloaded more than three million times across platforms, with over 92,000 downloads in the past week alone, though regional breakdowns are not available. The Google Play Store shows more than one million registered downloads separately.


Rwanda’s central bank has reiterated that cryptocurrency activity tied to the local currency remains prohibited, responding swiftly after crypto exchange Bybit introduced support for the Rwandan franc on its peer-to-peer marketplace.
Summary
- Rwanda’s central bank reaffirmed that crypto payments and trading using the Rwandan franc remain prohibited following Bybit’s P2P support update.
- Regulators warned of financial risks and barred licensed institutions from facilitating conversions between FRW and crypto assets.
In a statement posted to X on Sunday, the National Bank of Rwanda (NBR) made clear that crypto-assets are not permitted for payments, conversions involving the franc, or P2P trading under the current regulatory framework.
Authorities also cautioned residents against engaging with such services, warning of “serious financial risks and no recourse in case of loss.”
The clarification followed an announcement from Bybit on Friday indicating that users could buy and sell digital assets using the Rwandan franc through its P2P platform. The move appeared to prompt an immediate response from regulators, who emphasized that the franc remains the country’s only recognized legal tender. Financial institutions licensed by the NBR are also barred from facilitating conversions between FRW and crypto-assets.
ByBit has yet to issue an official statement as of press time.
Rwanda has kept a strict stance on crypto since 2018, with policymakers focusing on protecting the financial system and supporting the local currency.
At the same time, the country has been working on a state-backed digital currency, the e-franc rwandais, which is still in the proof-of-concept stage and may move to pilot testing.
Meanwhile, Rwanda’s Capital Market Authority has put forward a draft framework to support “responsible innovation” in the crypto sector.
The proposal sets clear limits, including a ban on using crypto as legal tender, restrictions on mining and mixer services, and controls on tokens linked to the franc.
Data from Chainalysis places Rwanda among lower-ranking countries in crypto usage across 2024 and 2025, with transaction volumes trailing far behind regional peers such as Nigeria and South Africa.
Bybit continues expanding offerings
Despite the regulatory pushback, Bybit has continued expanding its product offerings globally.
As previously reported by crypto.news, the exchange has recently leaned into strategies designed to attract users during uncertain market conditions, including a stronger focus on stablecoin yield products and fixed-income-style instruments. Bybit plans to roll out up to $10 million in stablecoin-backed opportunities.
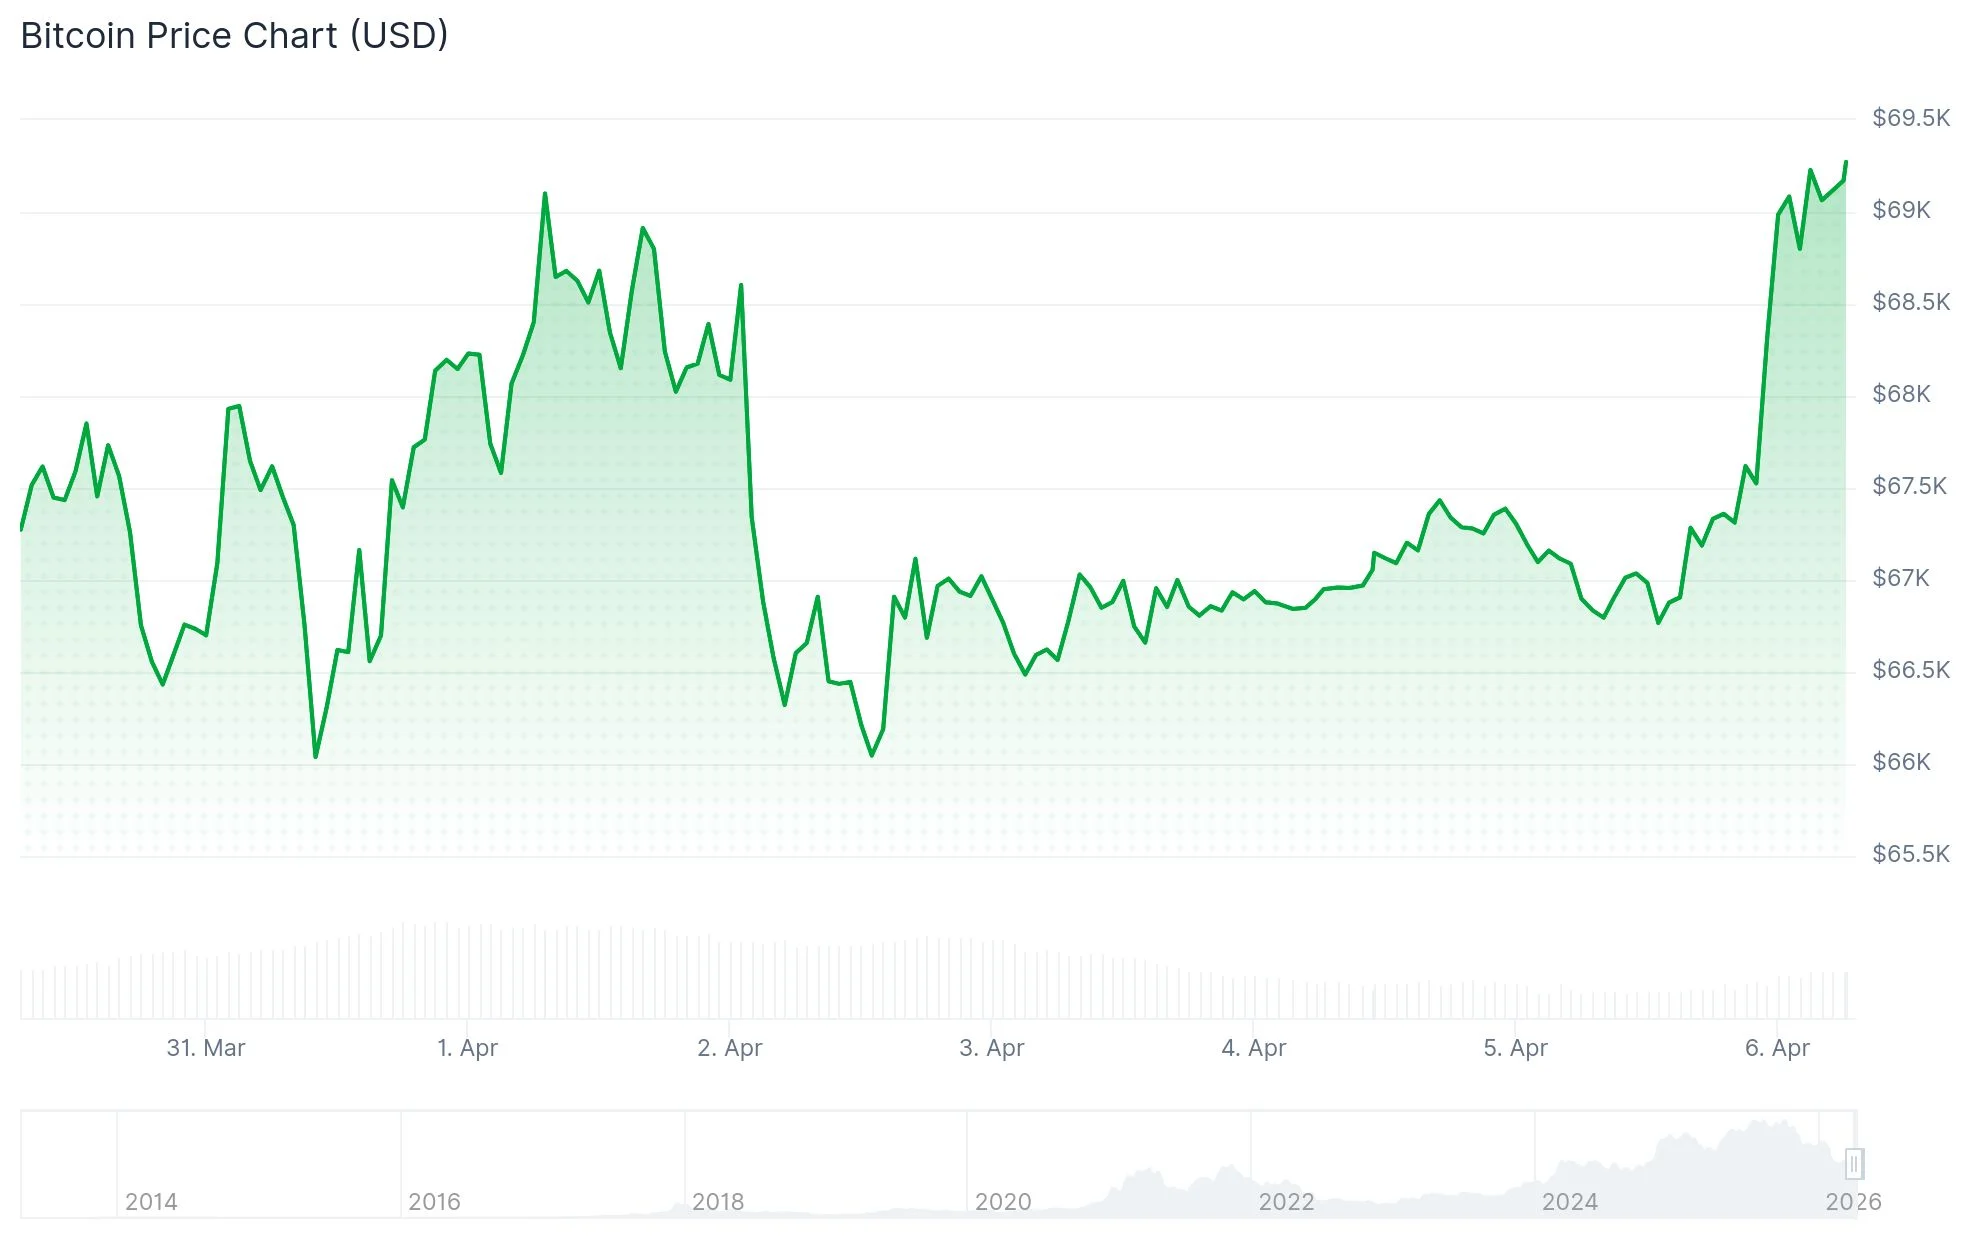
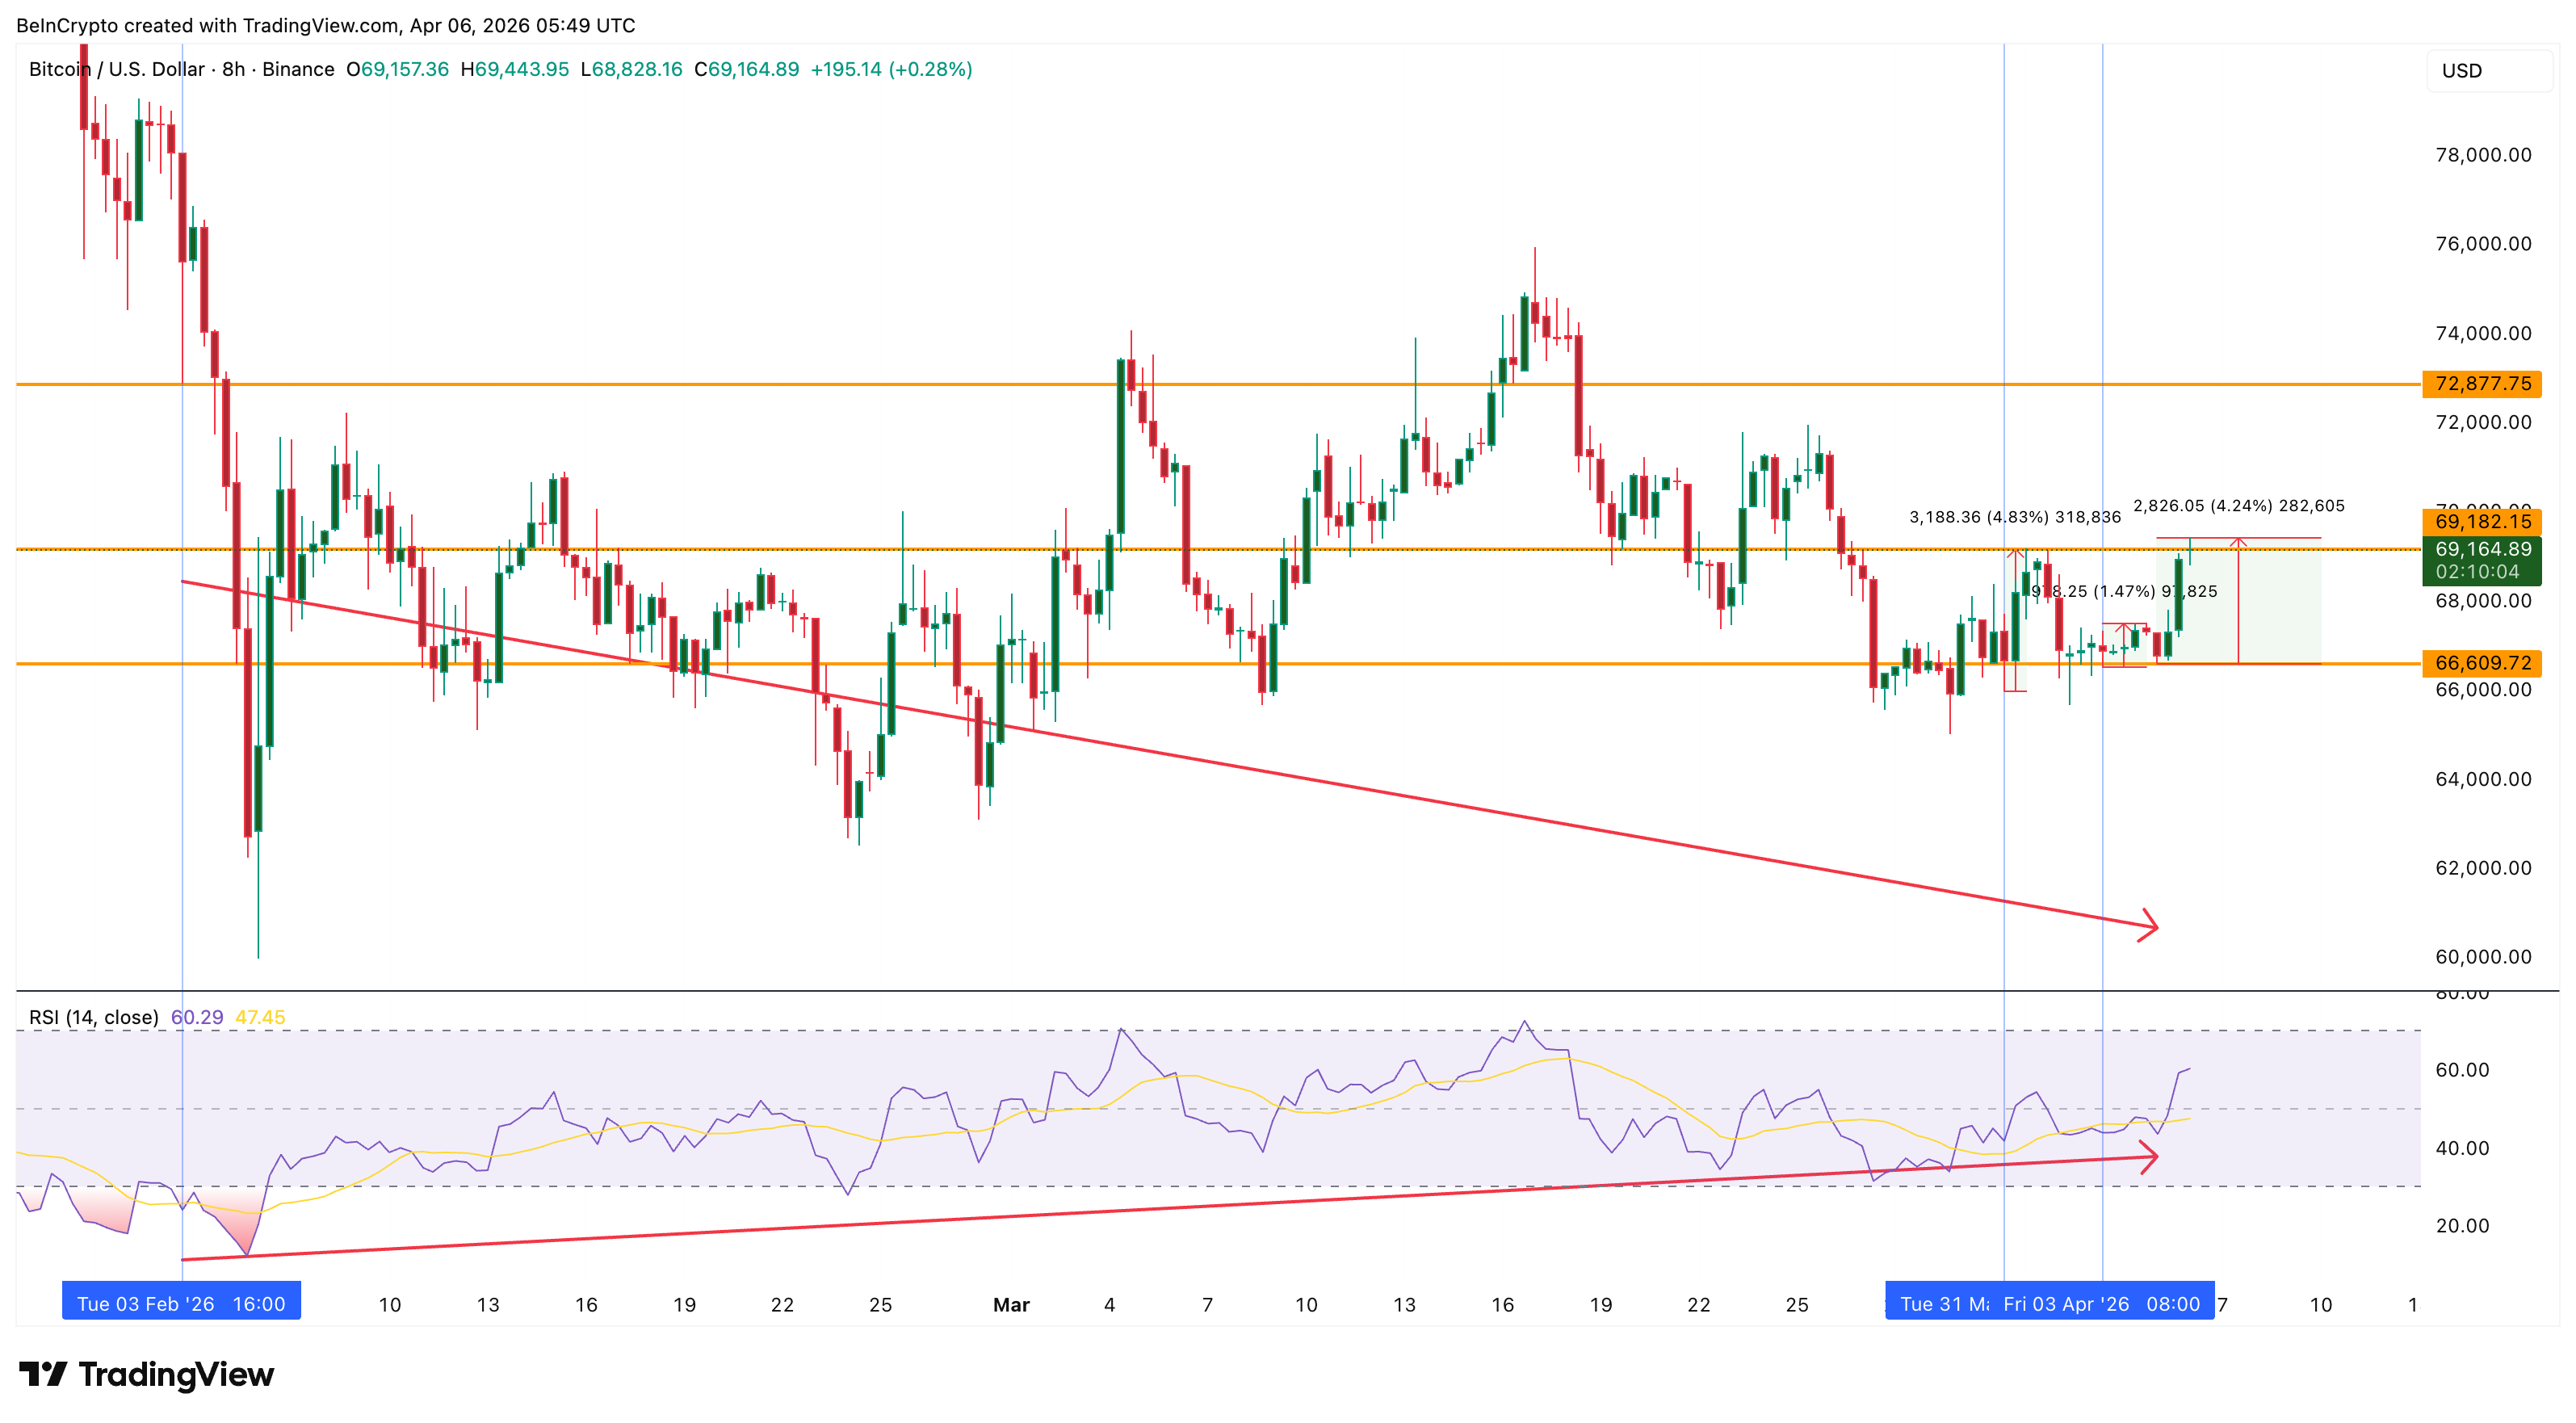
Bitcoin (BTC) price trades at $69,192 on April 6 after gaining approximately 4% from a local low on April 5. The bounce is the third in just a week to emerge from the same technical signal on the 8-hour chart.
Each time, the signal has produced a move to the upside. But each time, the rally has stalled below the same zone. The pattern raises a question that on-chain data can answer, and the answer determines whether this attempt ends differently or joins the first two as another failed breakout.
Three Cues, Same Ceiling
Bitcoin price has been forming a series of near-term standard bullish divergences on the 8-hour chart. The Relative Strength Index (RSI), a momentum oscillator that measures the speed and direction of price changes, made a higher low on each occasion while price printed a lower low. This pattern typically signals weakening selling pressure and precedes a reversal.
The first divergence completed on March 31, with the base date at February 3. Bitcoin rallied 4.83% before the move stalled. The second completed on April 3 and produced only a 1.47% bounce, the weakest of the three. The third completed on April 5 and has so far generated a 4.24% rally, pushing price back toward $69,192.
Want more token insights like this? Sign up for Editor Harsh Notariya’s Daily Crypto Newsletter here.
All three rallies share a common trait. None managed to close decisively above $69,182 on the 8-hour chart, a level where one of the previous bounces flattened. The signal keeps firing. The ceiling keeps holding.
At press time, Bitcoin price sits just above that level, testing whether the third attempt has enough momentum to break through where the first two failed. The answer lies not in the chart pattern itself but in who is buying and who is selling behind the scenes.
Two Conviction On-Chain Pillars Are Weakening
The reason the divergences have not translated into a sustained rally becomes visible in two on-chain datasets.
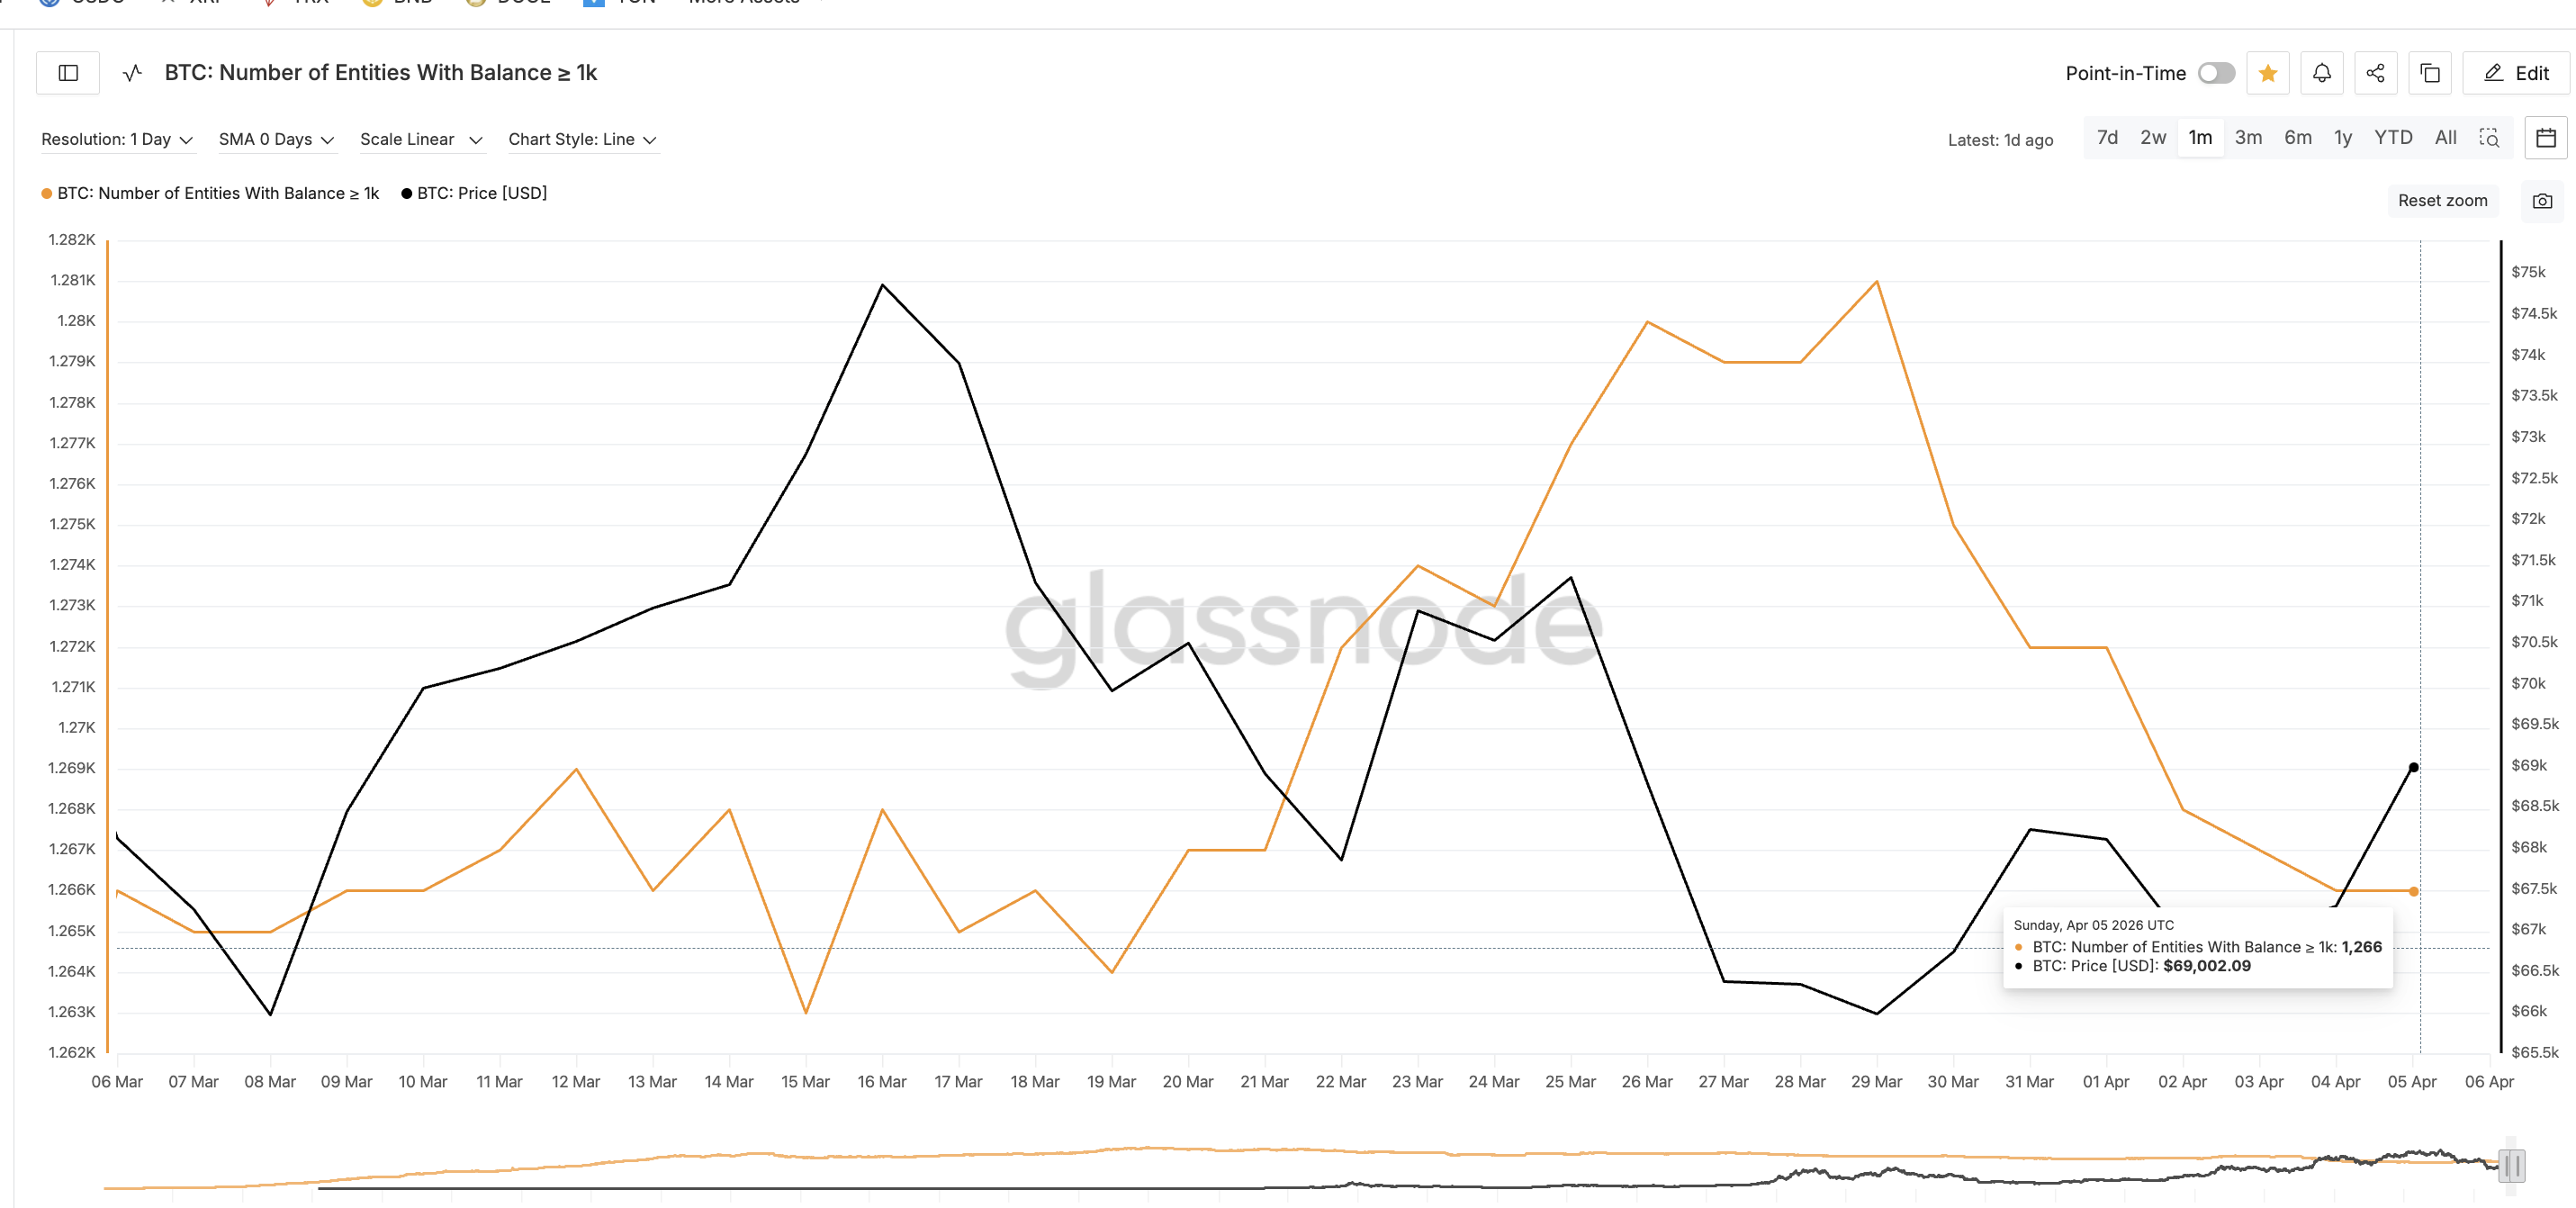
The first is whale concentration. The number of entities holding 1,000 or more BTC, a proxy for the largest holders in the market, peaked near 1,281 around mid-March. Since then, the count has declined steadily to 1,266 as of April 5. That reduction of 15 whale-tier wallets over three weeks means that the concentrated buying power which typically drives breakouts is thinning rather than building.
The decline accelerated after March 29, overlapping precisely with the window when the three divergences were forming.
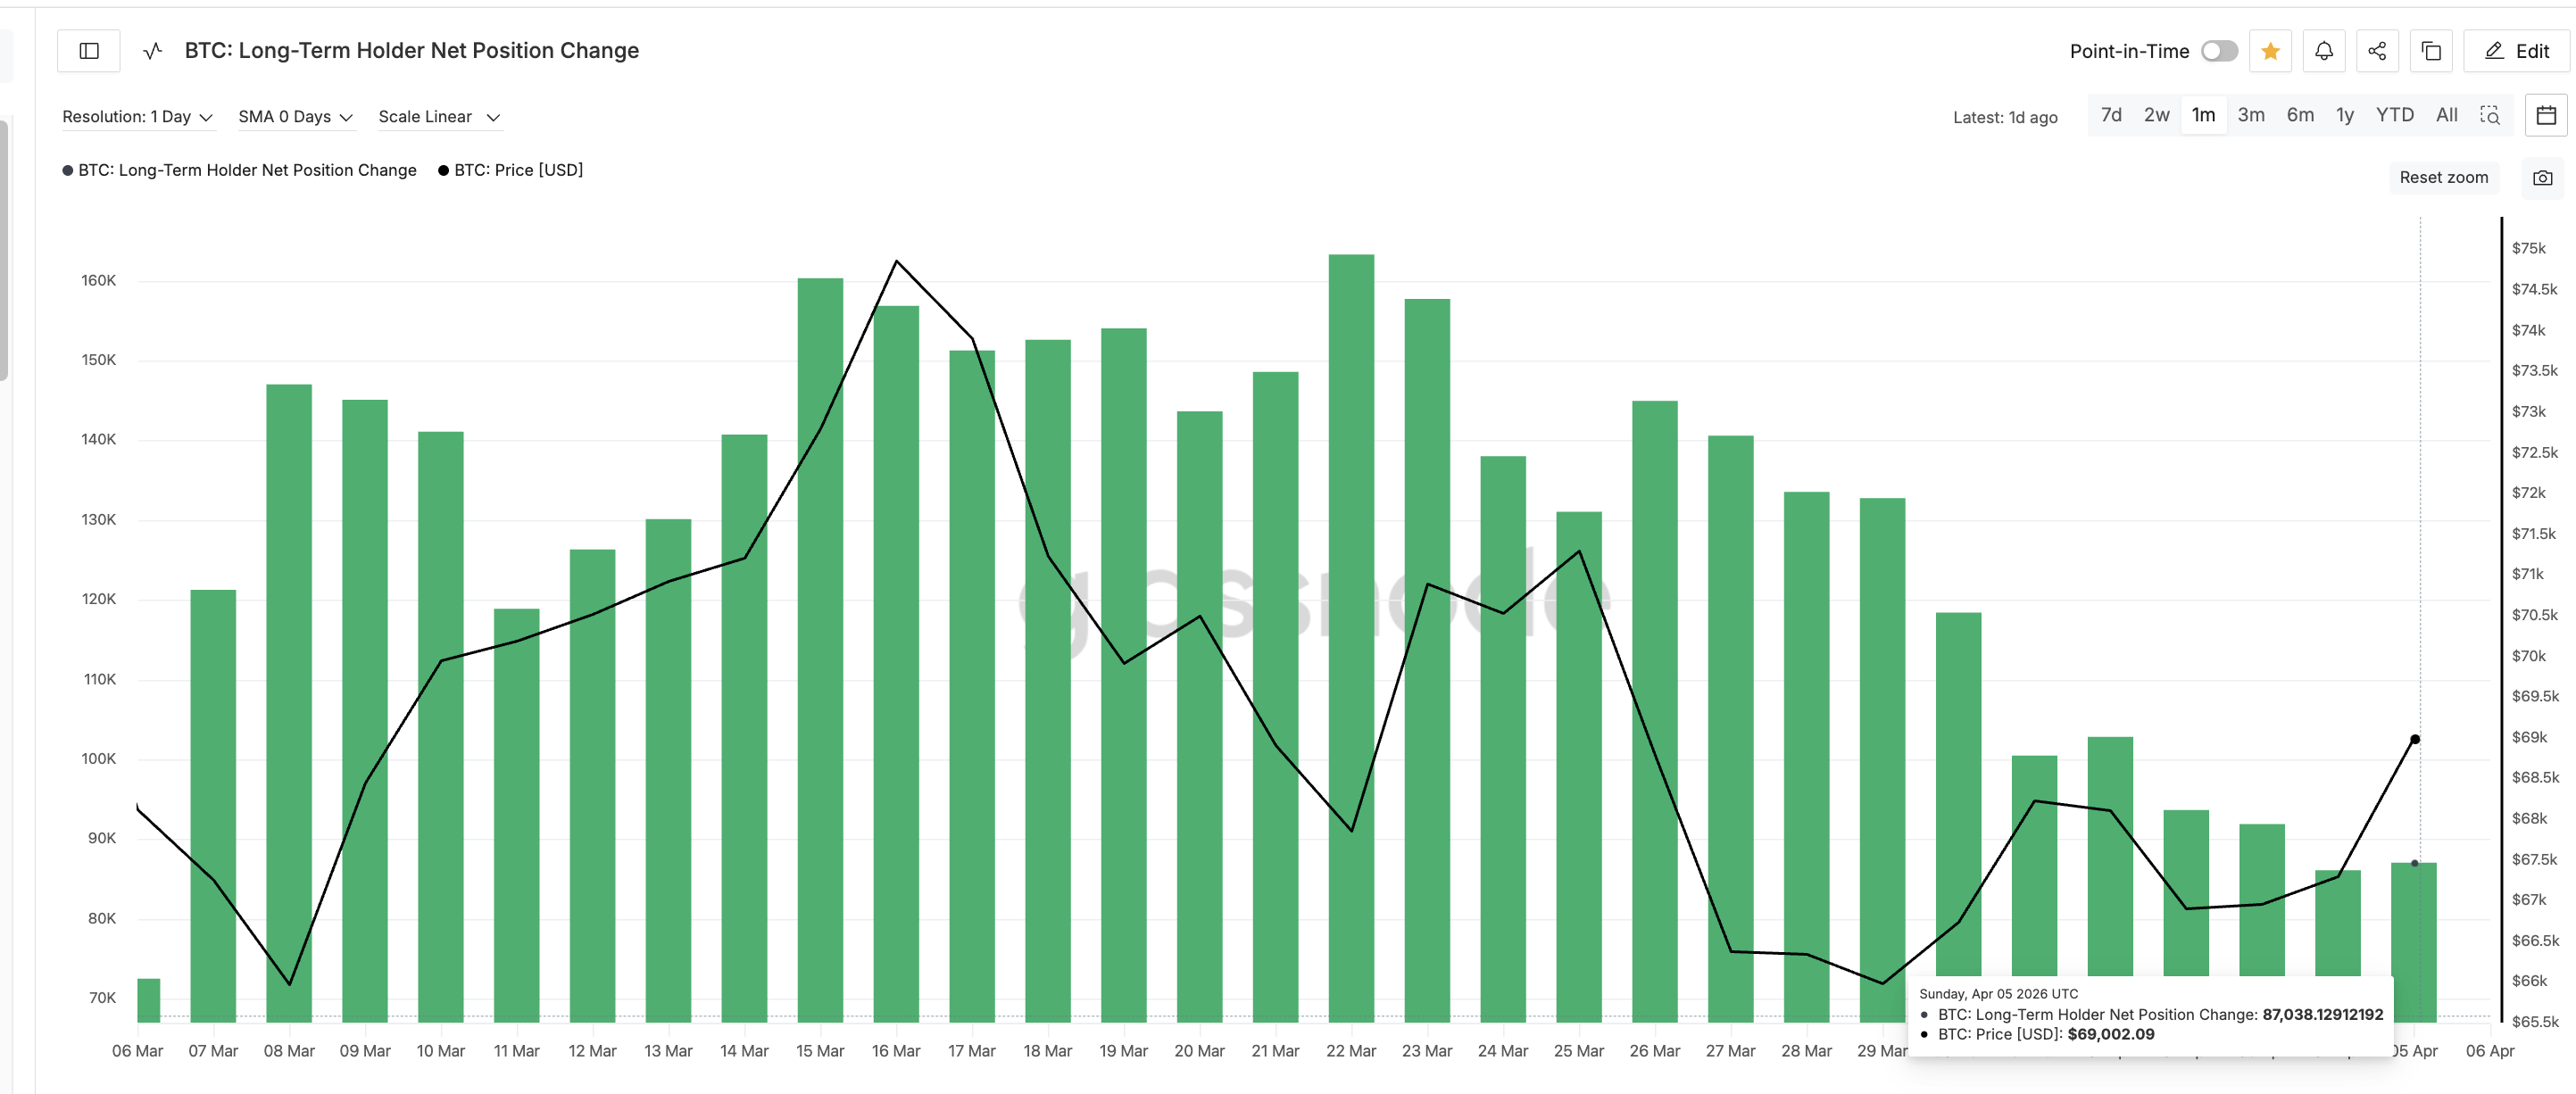
The second is long-term holder behavior. The Long-Term Holder Net Position Change, which tracks whether holders with a history of sustained positions are adding or reducing exposure, peaked at 163,262 BTC around March 22. By April 5, it had dropped to 87,038 BTC, a decline of nearly 47%. Long-term holders are not capitulating, but their conviction has weakened.
The UTXO Realized Price Distribution (URPD), which maps how much supply was last moved at each price level, reveals the structural obstacle sitting directly overhead. A 1.7% supply cluster sits at the current price range near $69,422. This means that 1.7% of all Bitcoin supply has its cost basis at or near the current level, creating a wall of potential sellers who may look to exit at breakeven.
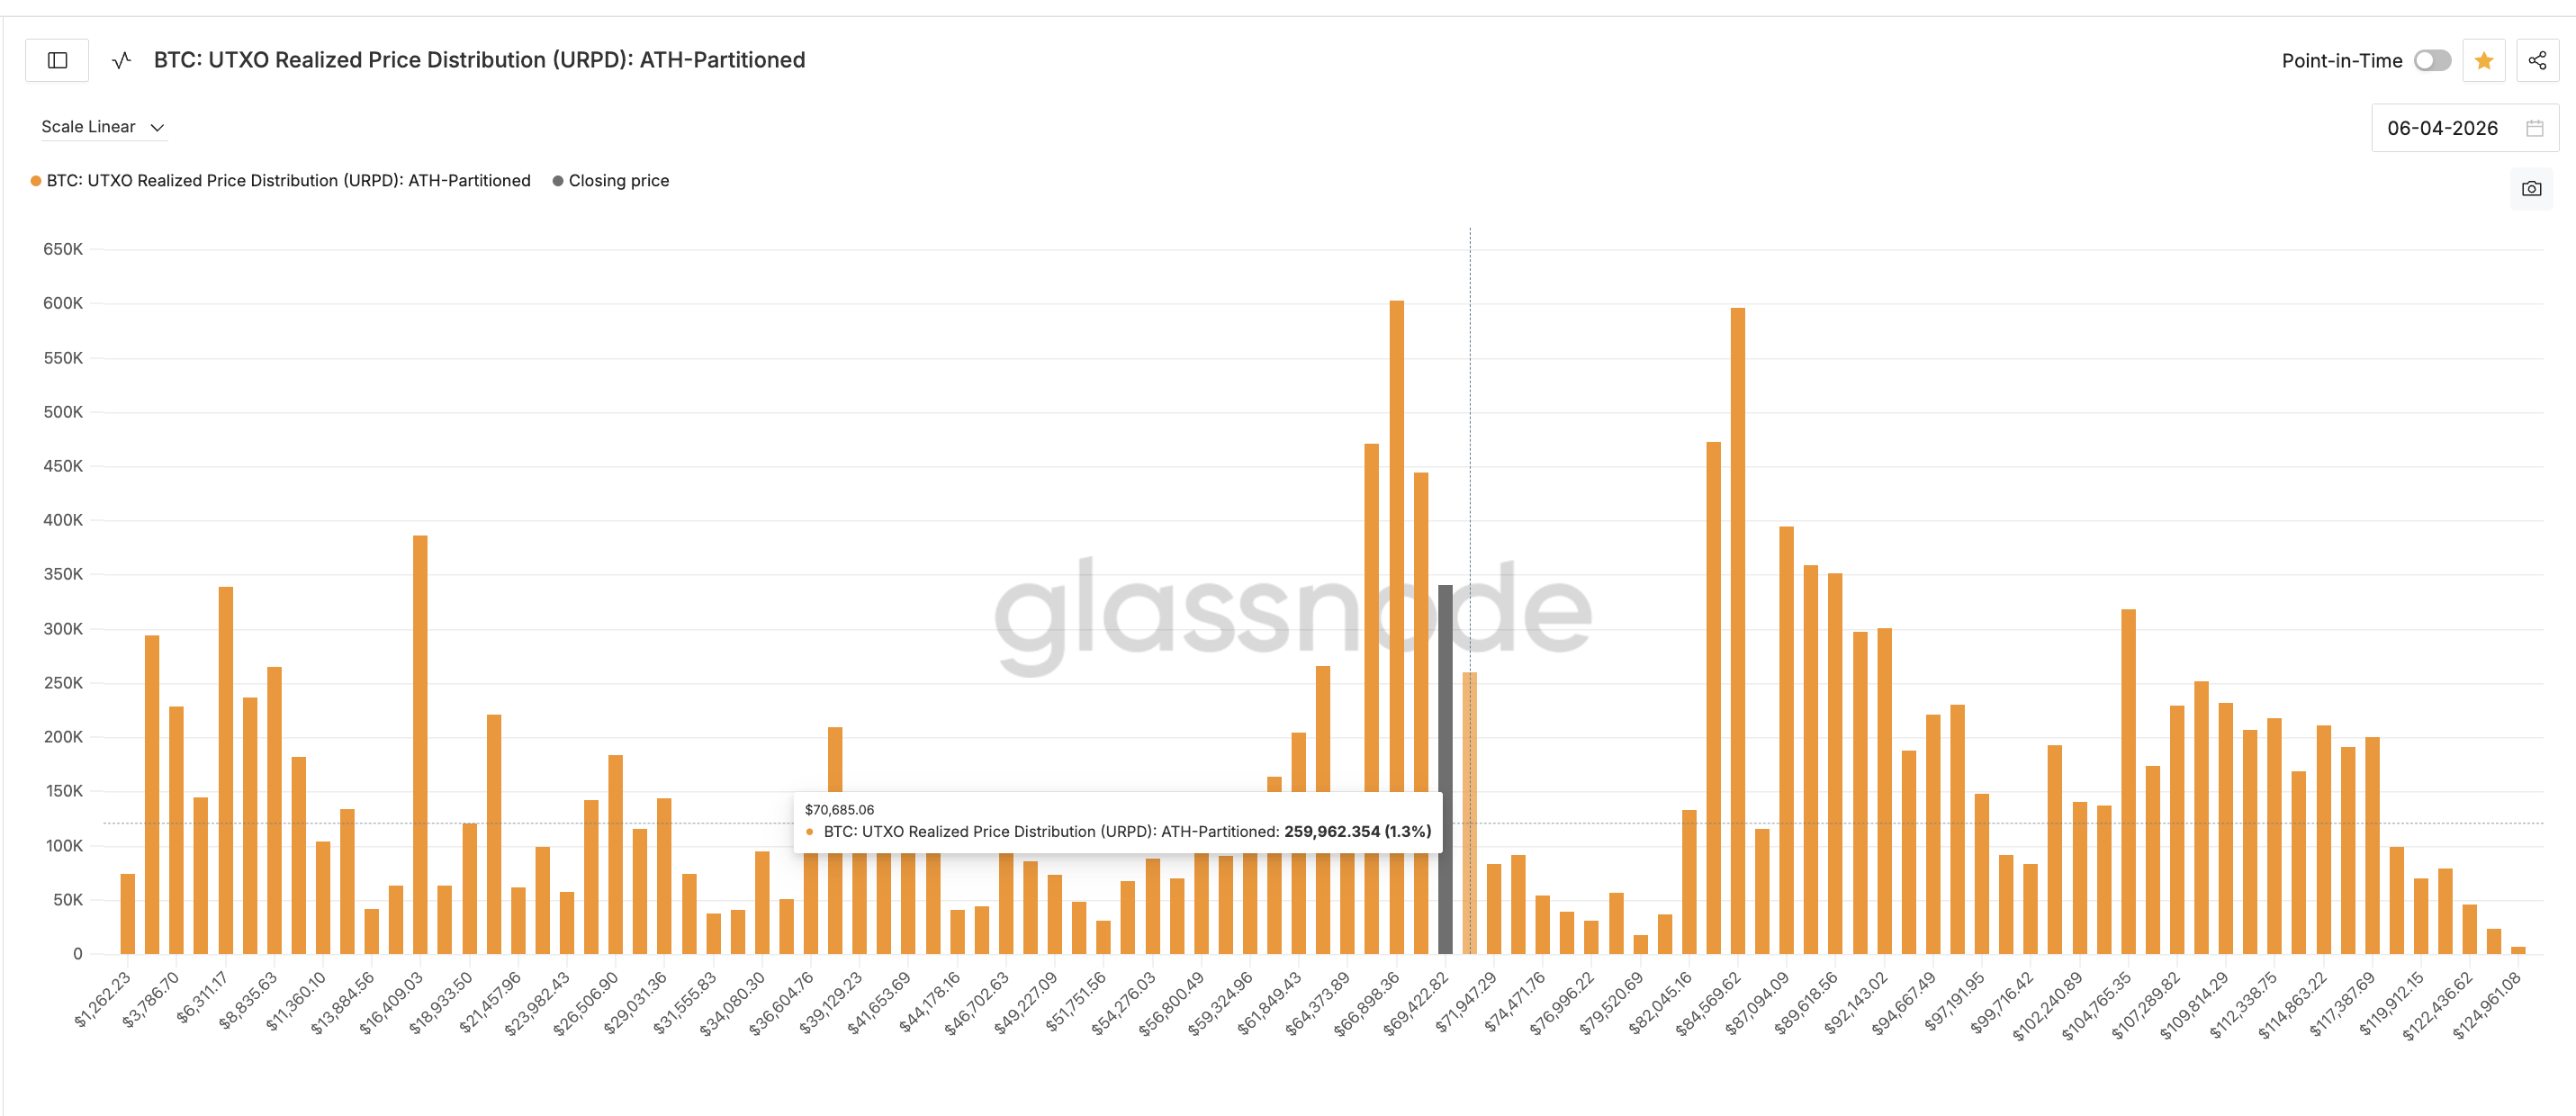
However, the cluster dynamics change quickly above that level. At $70,685, the supply concentration drops to 1.3%. Beyond that, the clusters thin significantly until around $84,000, where another dense zone appears. The difficulty is getting through the first wall without the whale and long-term holder conviction that usually support breakouts.
Bitcoin Price Levels That Separate a Breakout From Another Stall
The 8-hour chart with the completed swing between March 17 and March 25 frames every critical level for this week.
The immediate hurdle is $69,920. An 8-hour close above that level would indicate that the 1.7% supply cluster at the current range did not sell into this rally, which would be the first meaningful departure from the pattern set by the previous two divergences.
Above $69,920, the swing high at $71,956 becomes the next target, and a close above it would confirm that Bitcoin price has broken out of the range that has contained it since late-March.
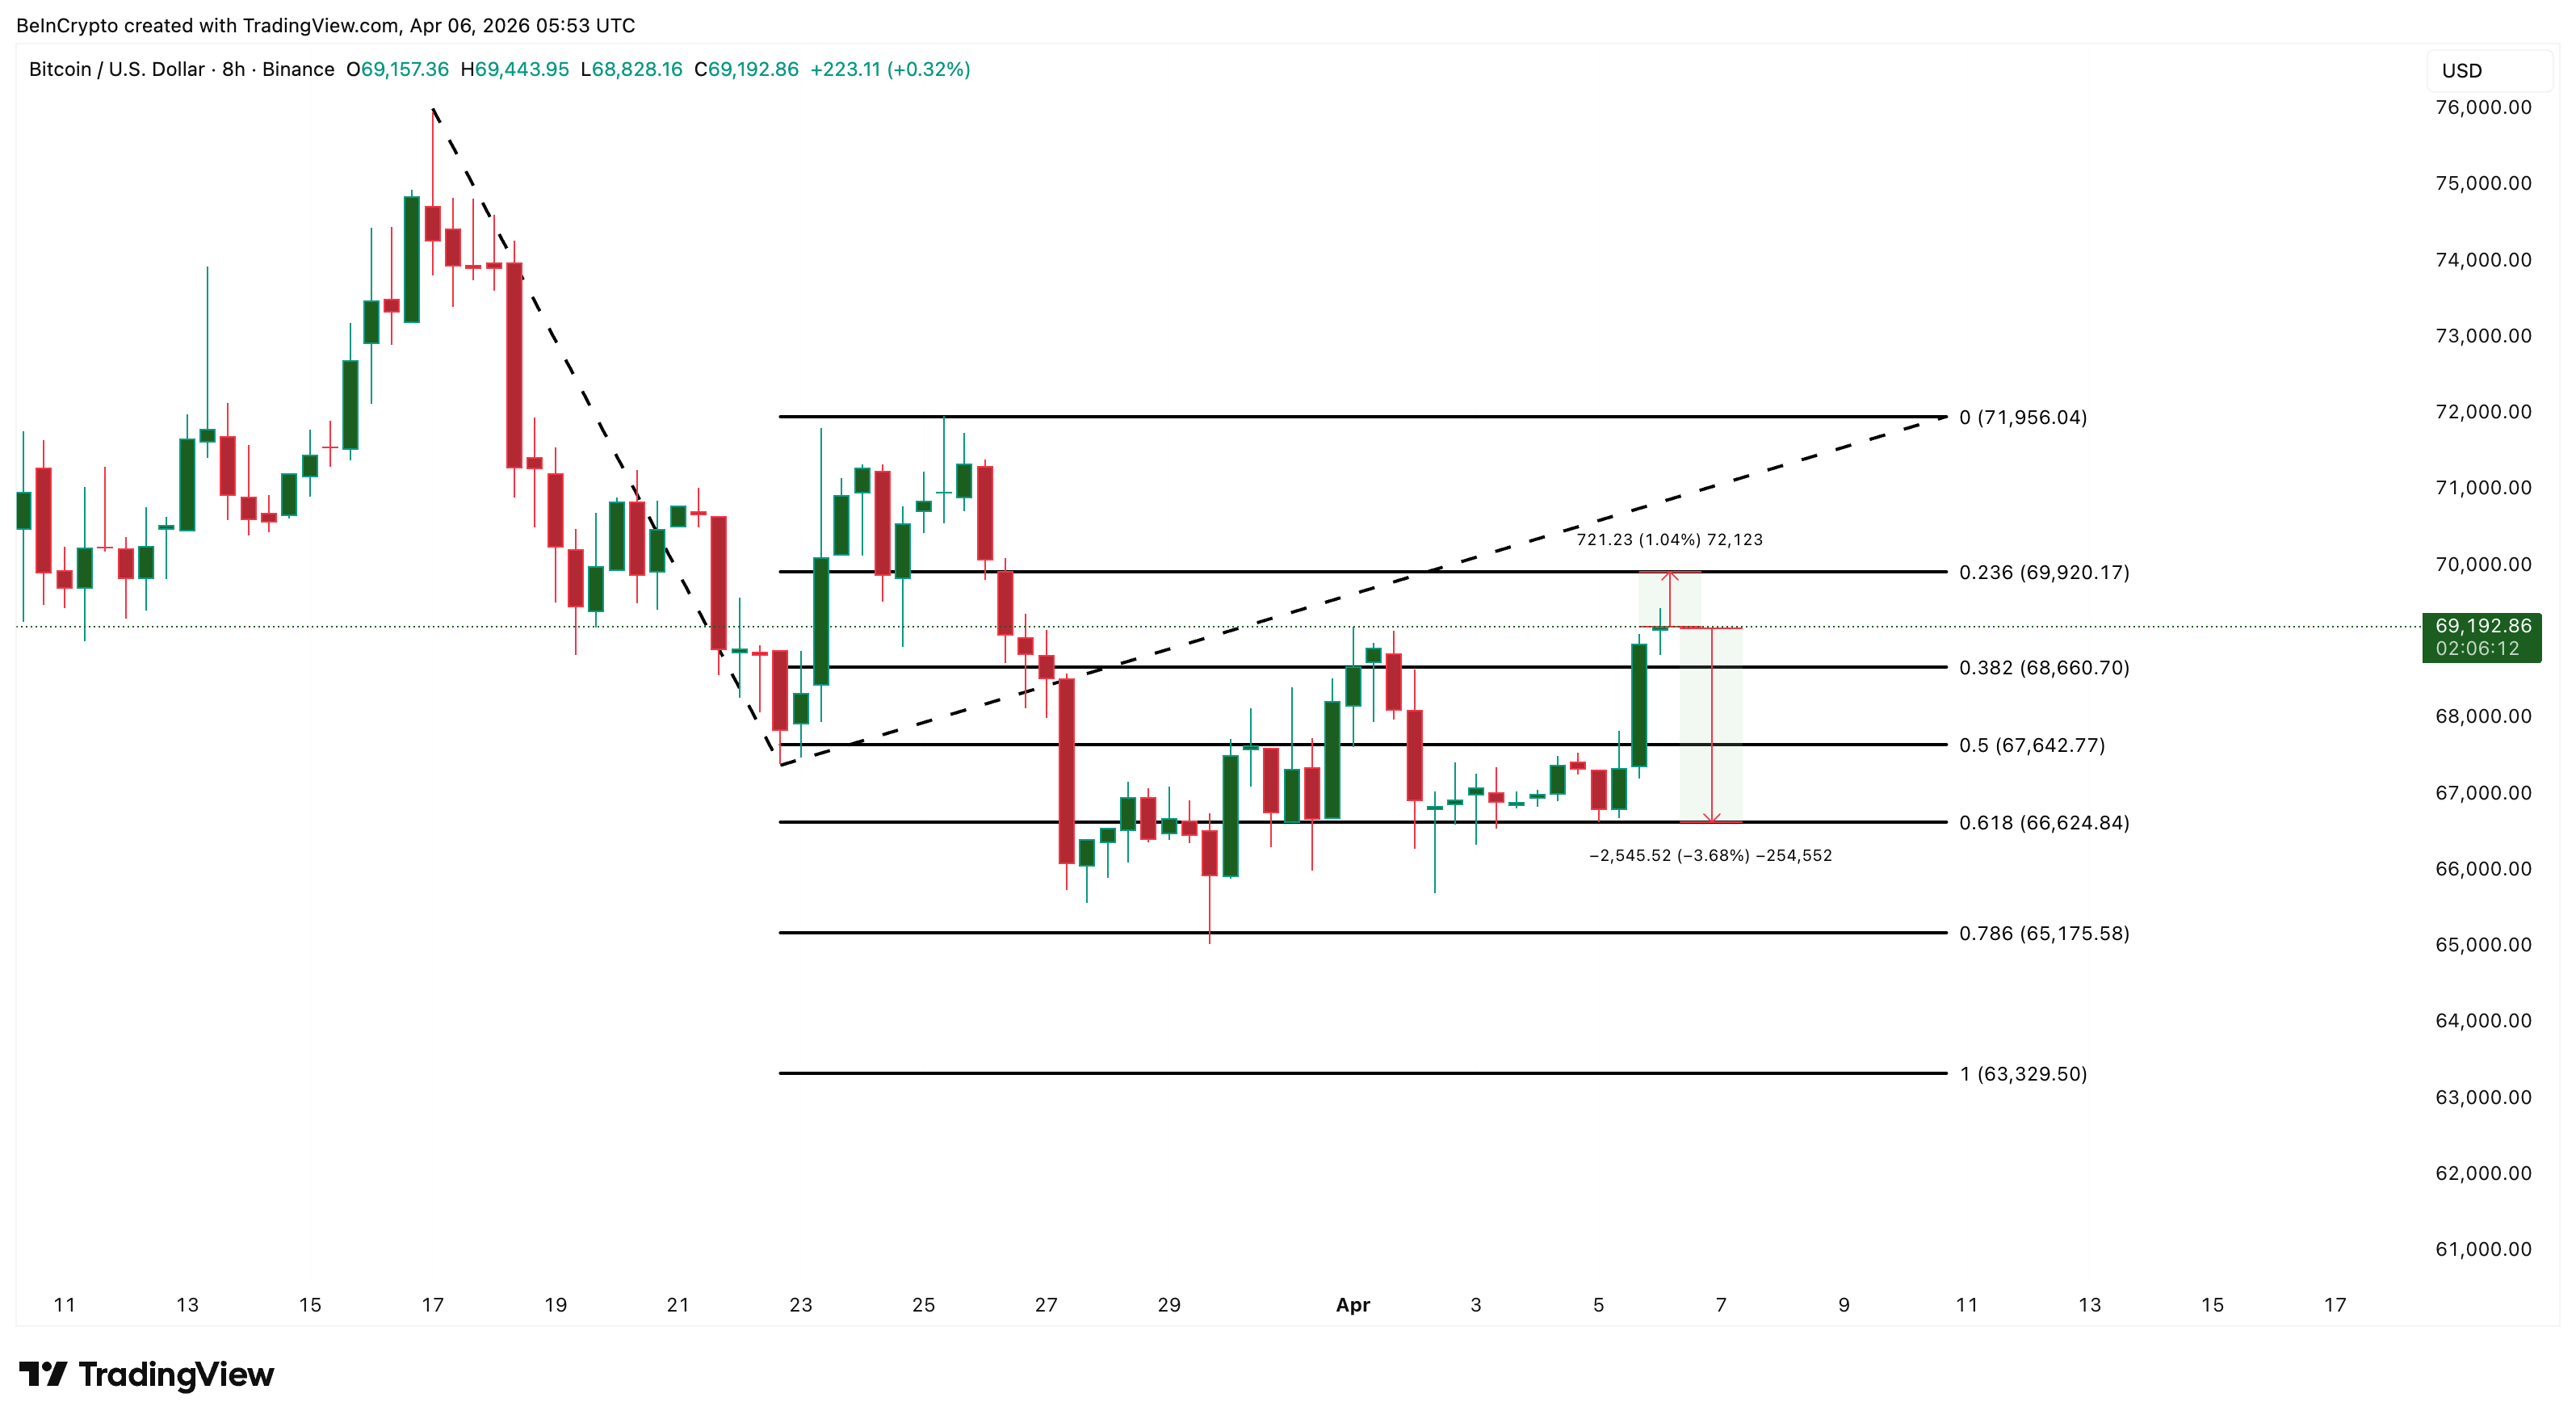
On the downside, $68,660 serves as immediate support for BTC. Below that, $66,624 has acted as a strong floor with multiple touch points since late March. If that level breaks, the structure deteriorates significantly and $63,329 becomes the next reference.
A clean 8-hour close above $69,920 would be the first sign that this divergence is different from the two that came before, while a failure to hold $66,624 would suggest the on-chain weakness has fully overtaken the technical signals and the next leg moves lower.
The post Bitcoin Price Flashed 3 Bullish Hints in a Week and None Delivered a Breakout appeared first on BeInCrypto.

Gold price rallied above $4,750 before correcting lower. Crude oil prices are rising and could climb further higher toward $110.00.
Important Takeaways for Gold and WTI Crude Oil Prices Analysis Today
· Gold price gained pace for a move toward $4,800 and recently corrected lower against the US Dollar.
· A key bullish trend line is forming with support at $4,630 on the hourly chart of gold at FXOpen.
· WTI Crude oil prices are moving higher above the $100.00 resistance zone.
· There was a break above a bearish trend line with resistance at $97.00 on the hourly chart of XTI/USD at FXOpen.
Gold Price Technical Analysis
On the hourly chart of Gold at FXOpen, the price was able to climb above $4,500. The price even surpassed $4,750 before the bears appeared.
The price traded close to $4,800 before there was a downside correction. There was a move below $4,750 and $4,700. The price settled below the 50-hour simple moving average, and RSI dipped below 50. There was a move below the 38.2% Fib retracement level of the upward move from the $4,351 swing low to the $4,800 high.
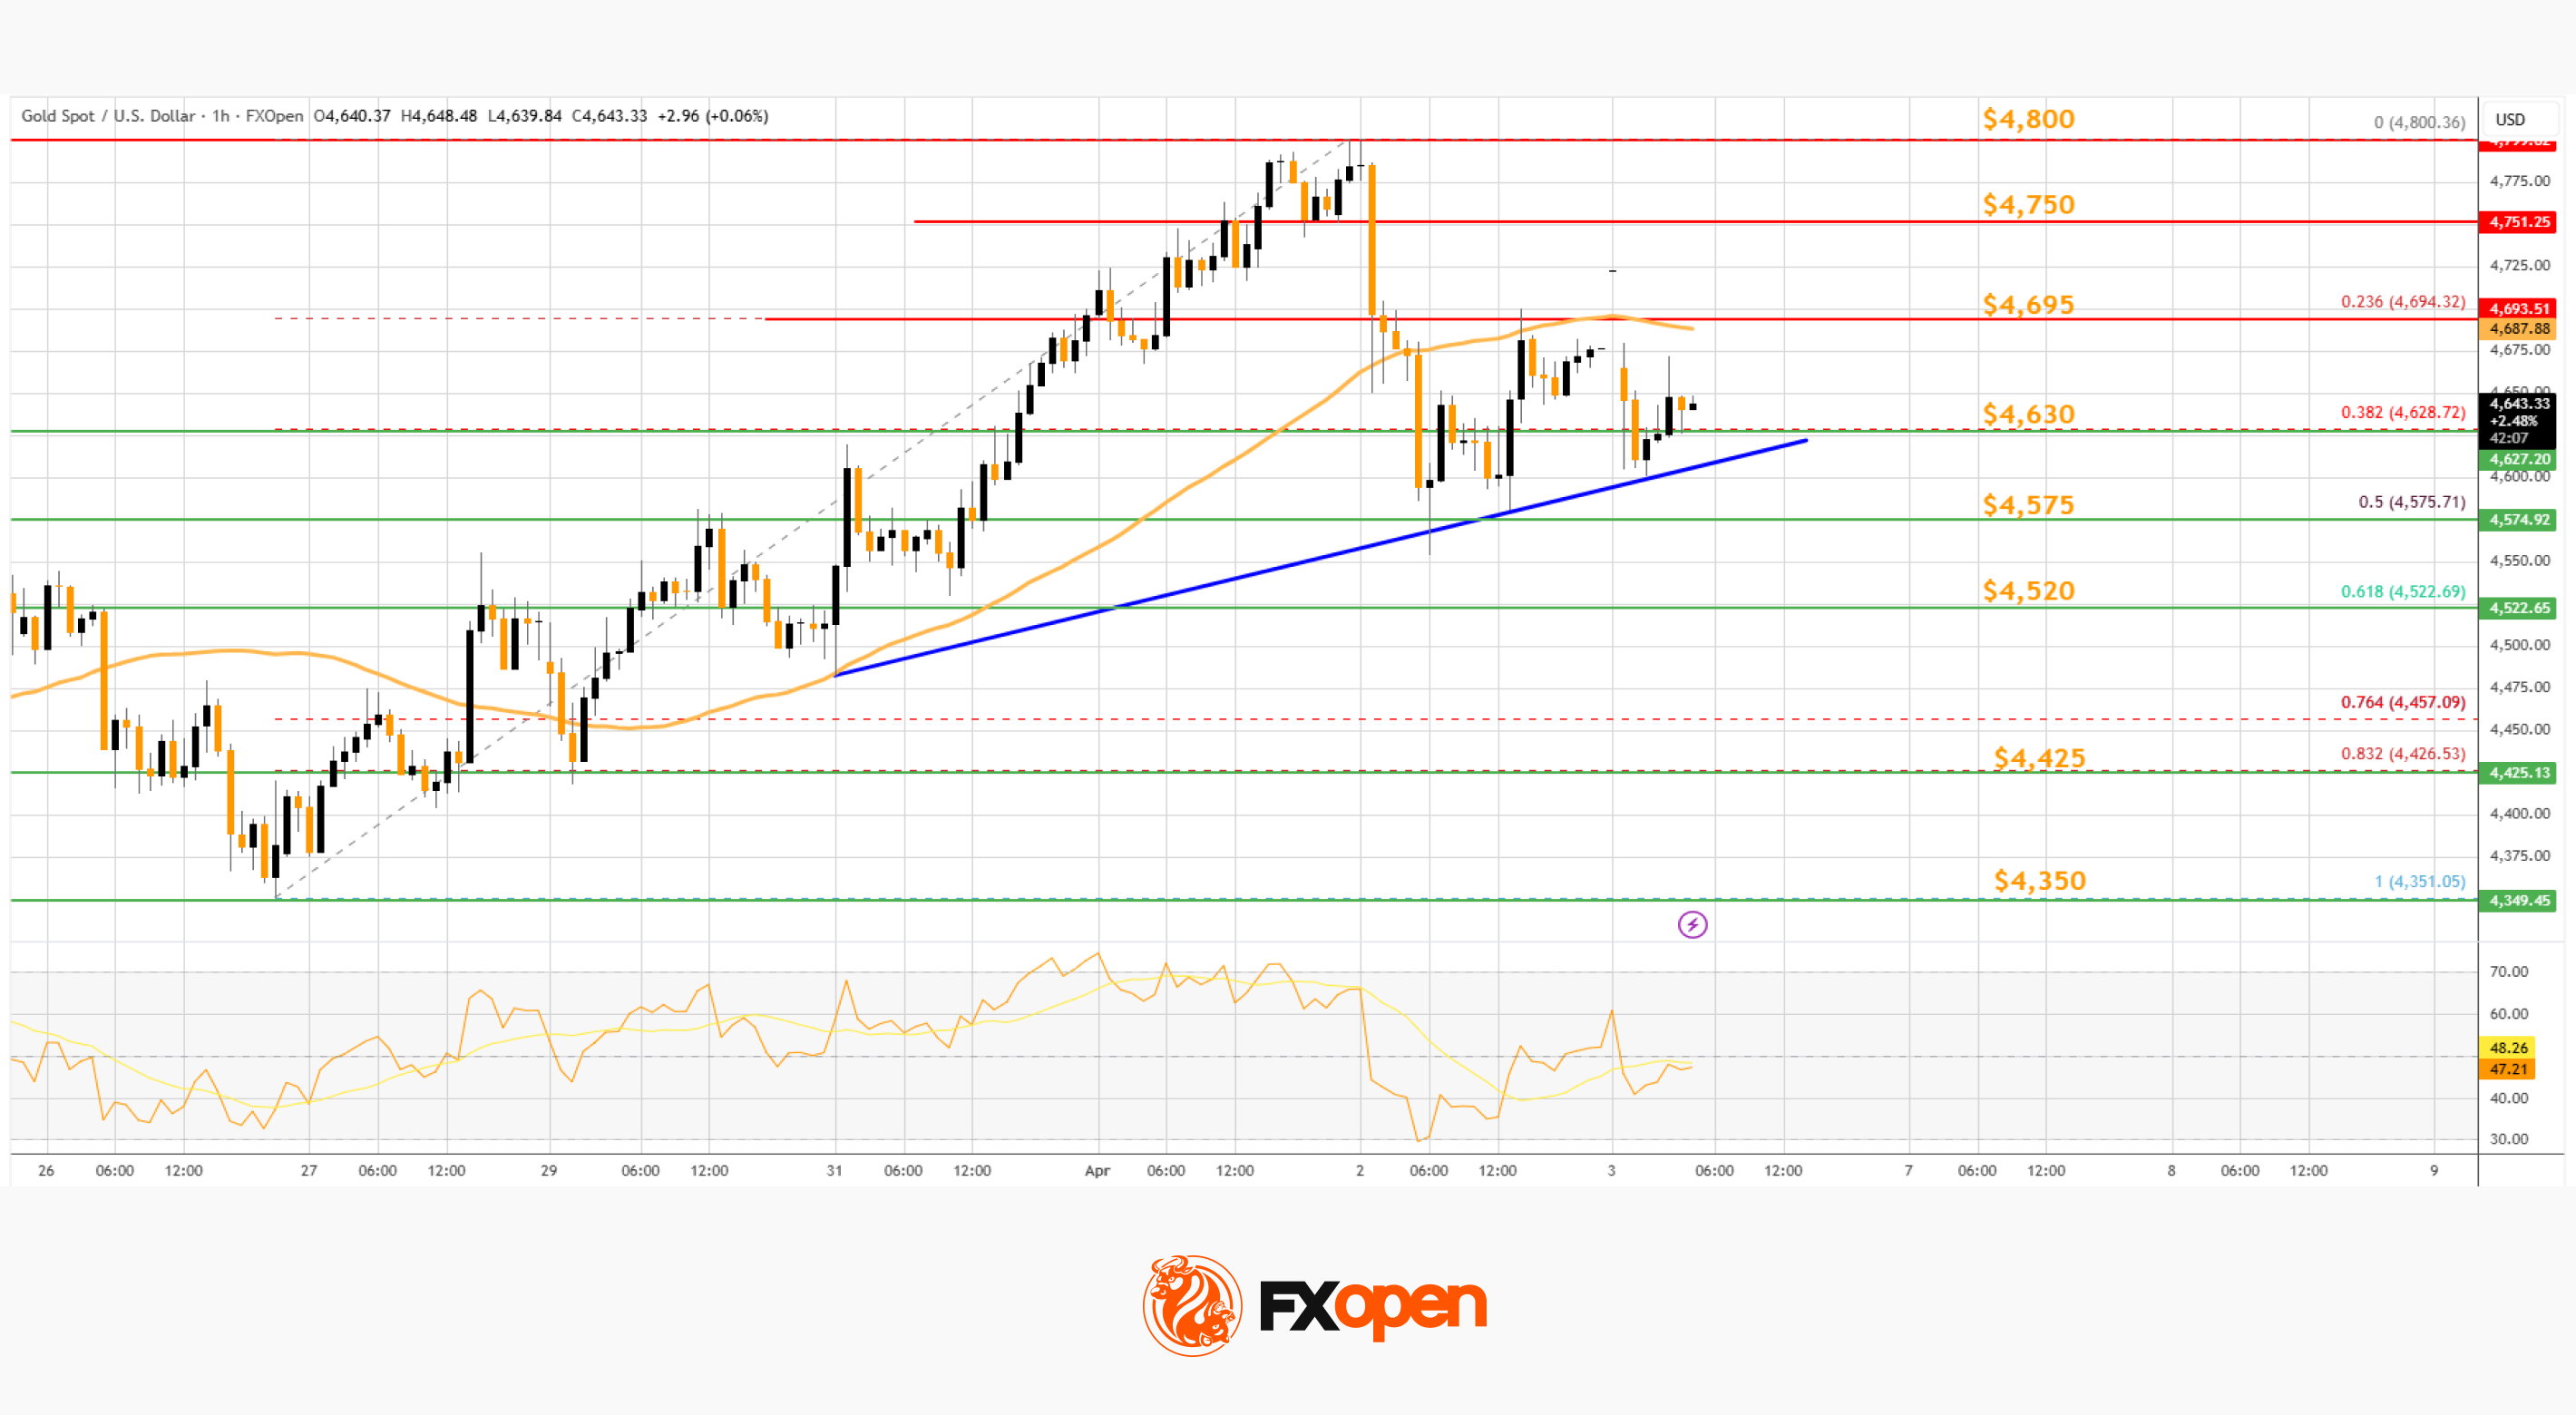
However, the bulls are active above $4,575 and the 50% Fib retracement. There is also a key bullish trend line forming with support at $4,630.
Immediate hurdle on the upside is $4,695 and the 50-hour simple moving average. The next major breakout level is $4,750. An upside break above $4,750 could send Gold price toward $4,800. Any more gains may perhaps set the pace for an increase toward $4,880.
If there is no fresh increase, the price could continue to move down. Initial support on the downside is near $4,630 and the trend line. The first key breakdown zone could be $4,520. If there is a downside break below $4,520, the price might decline further. In the stated case, the price might drop to $4,350.
WTI Crude Oil Price Technical Analysis
On the hourly chart of WTI Crude Oil at FXOpen, the price started a steady increase against the US Dollar. The price gained bullish momentum after it settled above $96.40.
The bulls pushed the price above the 50-hour simple moving average, and the RSI climbed toward 75. Besides, there was a break above a bearish trend line with resistance at $97.00. The price tested the $105.85 zone and is currently consolidating gains.
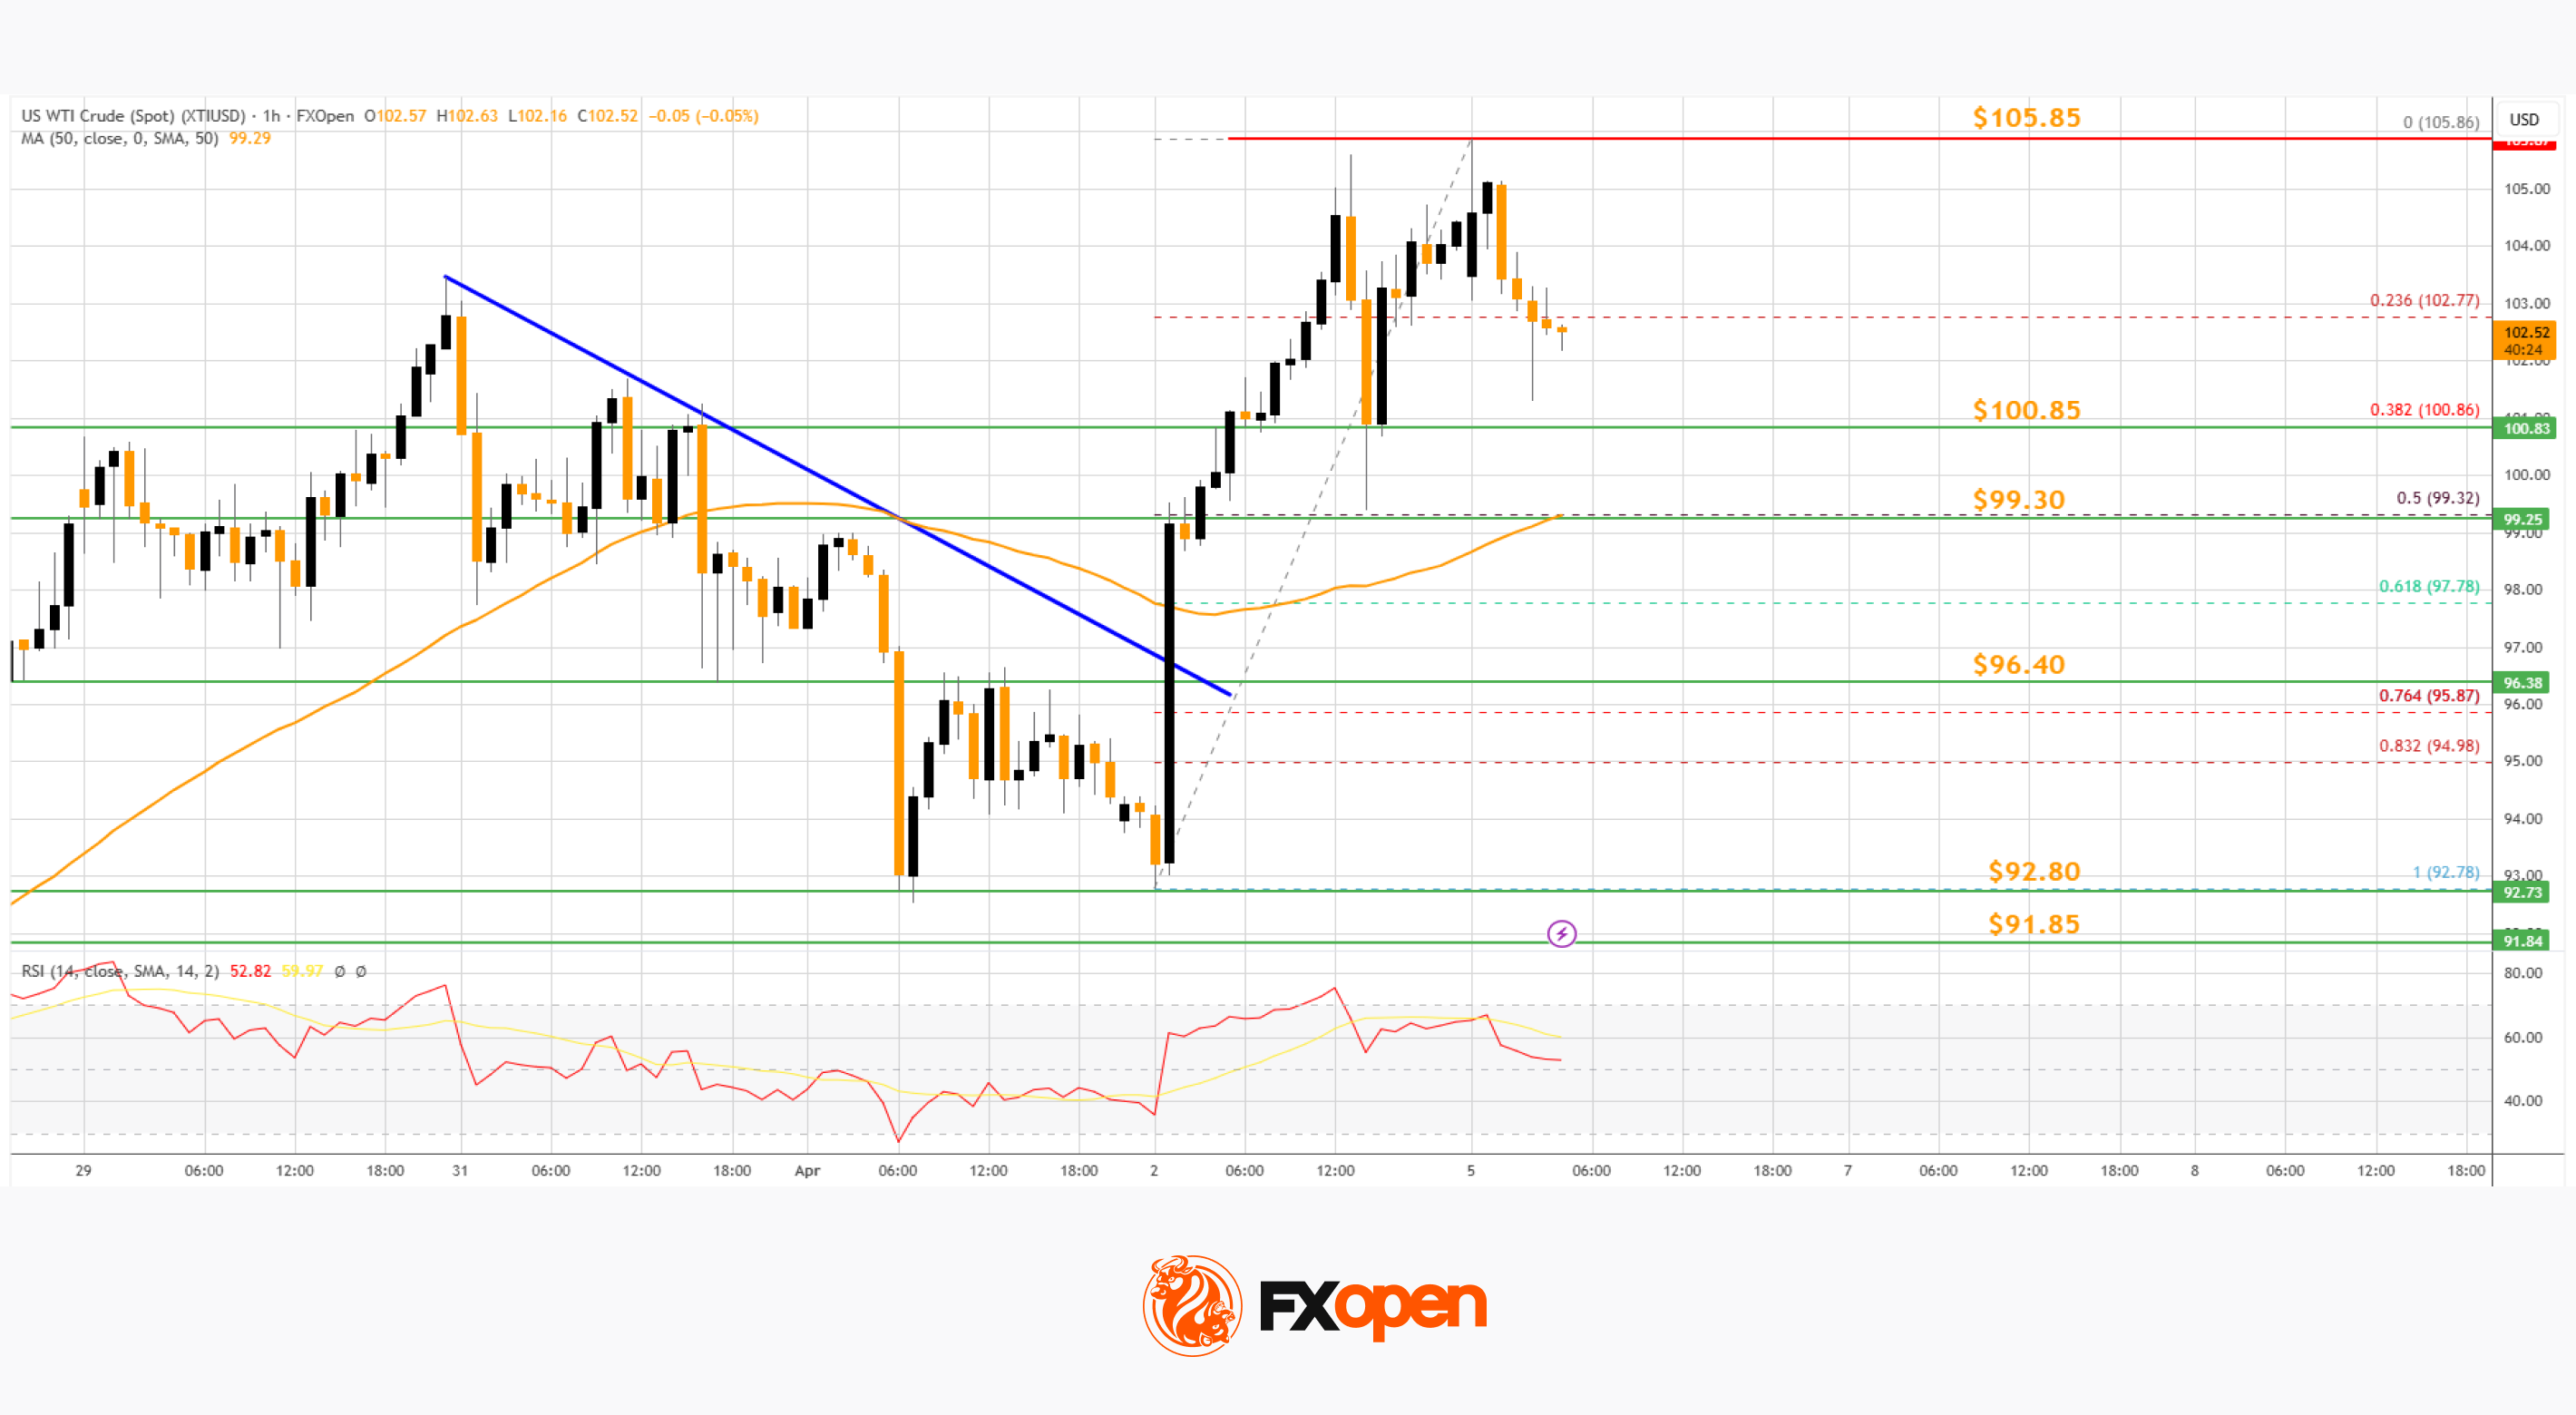
There was a minor pullback below $103 and the 23.6% Fib retracement level of the upward move from the $92.78 swing low to the $105.86 low.
If there is a fresh increase, the price could struggle near $105.85. A close above $106.85 could send the price toward $108. The next key area of interest might be $110. Any more gains might send the price toward $112.
Conversely, the price might correct gains and test $100.85. The main bid area on the WTI crude oil chart could be $99.30, the 50% Fib retracement level, and the 50-hour simple moving average. If there is a downside break, the price might decline toward $96.40. Any more losses may perhaps open the doors for a move to $92.80.
Start trading commodity CFDs with tight spreads (additional fees may apply). Open your trading account now or learn more about trading commodity CFDs with FXOpen.
This article represents the opinion of the Companies operating under the FXOpen brand only. It is not to be construed as an offer, solicitation, or recommendation with respect to products and services provided by the Companies operating under the FXOpen brand, nor is it to be considered financial advice.
Crypto World
How North Korean Operatives Orchestrated a $270M Crypto Heist After Months of Patient Infiltration

Key Points
- State-sponsored North Korean operatives masqueraded as a legitimate quantitative trading firm, cultivating trust within Drift Protocol over a six-month period before executing a $270 million theft on April 1.
- The threat actors established in-person relationships with protocol contributors at international crypto conferences and injected over $1 million in actual funds to bolster credibility.
- System infiltration occurred through a malicious TestFlight application and exploitation of a documented security flaw in VSCode/Cursor development environments.
- Security researchers have linked the operation to UNC4736, alternatively identified as AppleJeus or Citrine Sleet, with ties to North Korean state interests.
- Legal experts suggest the breach may represent actionable negligence, with class action litigation efforts already underway.
On April 1, Drift Protocol suffered a catastrophic $270 million security breach following an extended infiltration campaign orchestrated by a North Korean state-backed hacking collective spanning approximately half a year.
The sophisticated operation began at a prominent cryptocurrency conference during autumn 2025. The perpetrators successfully impersonated representatives of a quantitative trading operation, arriving with comprehensive technical knowledge, authenticated professional credentials, and detailed familiarity with Drift’s infrastructure and operations.
Initial communications were established through a Telegram channel, initiating months of sustained dialogue. Discussions centered on topics typical of institutional trading partnerships: vault integration protocols, strategic trading methodologies, and operational frameworks.
During the December 2025 to January 2026 timeframe, the fraudulent entity officially established an Ecosystem Vault within the Drift ecosystem. They conducted numerous collaborative working sessions with platform contributors and deployed over $1 million in actual capital—a calculated move designed to establish authenticity.
Throughout February and March 2026, Drift personnel engaged in direct, face-to-face meetings with representatives from the group at various international conference venues across multiple nations. By the time of the April 1 attack, the relationship had matured over nearly half a year.
Technical Compromise Methods Revealed
The breach materialized through a dual-vector attack strategy. Initially, a team member installed a TestFlight application—Apple’s beta distribution system that circumvents standard App Store security verification processes—which the attackers had marketed as their proprietary wallet solution.
Additionally, the threat actors weaponized a publicly documented vulnerability present in VSCode and Cursor, two prevalent integrated development environments. The exploit required nothing more than opening a compromised file within either editor to silently execute malicious payload code without triggering any user notifications or security alerts.
Following successful device compromise, the attackers methodically extracted credentials necessary to secure two multisignature wallet approvals. These pre-authorized transactions remained inactive for over a week before execution on April 1, resulting in the extraction of $270 million within sixty seconds.
Cybersecurity analysts have connected the incident to UNC4736, a threat actor group also designated as AppleJeus or Citrine Sleet. Blockchain forensics revealed transaction patterns linking to the October 2024 Radiant Capital compromise, which investigators also attributed to North Korean actors. Notably, individuals who appeared physically at conferences were not North Korean citizens—DPRK-affiliated groups characteristically employ third-party proxies with elaborately fabricated identities.
Legal Ramifications and Security Failures
Cryptocurrency legal specialist Ariel Givner has indicated the incident potentially constitutes actionable civil negligence. She emphasized that fundamental security protocols—including maintaining signing keys on isolated, air-gapped systems and conducting thorough background verification of developers encountered at industry events—appear to have been inadequately implemented.
“Every credible project understands these requirements. Drift failed to implement them,” Givner stated. Marketing materials for class action litigation targeting Drift are already in circulation.
Drift’s security team has expressed “medium-high confidence” that identical threat actors executed the October 2024 Radiant Capital attack, where malicious software was distributed via Telegram from an individual impersonating a former contractor.

HOPING Street Kitchen and Hickory’s help homeless at Easter

Thailand Struggles with Scorching Heat and Thick Pollution Haze
QuickSwap Discord Breach Triggers Urgent Security Warning for Users


-

 NewsBeat4 days ago
Steven Gerrard disagrees with Gary Neville over ‘shock’ Chelsea and Arsenal claim | Football
-

 Business3 days ago
No Jackpot Winner and $194 Million Prize Rolls Over
-

 Fashion3 days ago
Weekend Open Thread: Spanx – Corporette.com
-
Entertainment7 days ago
Fans slam 'heartbreaking' Barbie Dream Fest convention debacle with 'cardboard cutout' experience
-

 Crypto World4 days ago
Gold Price Prediction: Worst Month in 17 Years fo Save Haven Rock
-

 Business9 hours ago
Three Gulf funds agree to back Paramount’s $81 billion takeover of Warner, WSJ reports
-
Crypto World6 days ago
Dems press CFTC, ethics board on prediction-market insider trades
-

 Sports1 day ago
India men’s 4x400m and mixed 4x100m relay teams register big progress | Other Sports News
-

 Business4 days ago
Login and Checkout Issues Spark Merchant Frustration
-

 Tech7 days ago
Apple will hide your email address from apps and websites, but not cops
-

 Tech6 days ago
EE TV is using AI to help you find something to watch
-

 Sports6 days ago
Tallest college basketball player ever, standing at 7-foot-9, entering transfer portal
-

 Politics7 days ago
Should Trump Be Scared Strait?
-
Tech6 days ago
Daily Deal: StackSkills Premium Annual Pass
-

 Tech6 days ago
Flipsnack and the shift toward motion-first business content with living visuals
-

 Fashion7 days ago
The Best Spring Trends of 2026
-

 Crypto World6 days ago
U.S. rule change may open trillions in 401(k) funds to crypto
-

 Sports6 days ago
Women’s hockey camp eyes fitness boost, tactics ahead of WC 2026 campaign | Other Sports News
-

 Politics7 days ago
BBC slammed for ignoring author of The Fraud
-

 Tech6 days ago
How to back up your iPhone & iPad to your Mac before something goes wrong
You must be logged in to post a comment Login