
Crypto World
Turkey’s ruling party unveils 10% crypto income tax proposal


Turkey’s ruling AK Party has introduced a sweeping economic bill in parliament that would formalize crypto taxation while revising a range of tax and spending rules.
The draft, now before the Turkish Grand National Assembly, would amend the Income Tax Law and Expenditure Taxes Law to create a new framework for cryptocurrencies, the country’s state news agency Anadolu Ajansı reports.
Crypto platforms regulated under the country’s Capital Markets Law would withhold a 10% tax on gains each quarter, regardless of whether the investor is an individual or company, resident or non-resident.
Service providers would also pay a 0.03% transaction tax on the sale amount or market value of crypto assets they broker.
Crypto brokers and other intermediaries would be on the hook for tax checks based on the records they keep. If a user provides wrong or incomplete information, tax authorities would pursue that person for any shortfall, the news outlet writes.
The bill also makes clear that key terms such as “crypto asset,” “wallet,” and “platform” carry the same meaning as in Turkey’s Capital Markets Law, tying the tax regime to existing financial rules.
The country’s president would also have the power to lower the 10% withholding tax to 0% or raise it to 20%, depending on the type of token, how long it was held, who issued it, or the type of wallet used.
The bill exempts crypto deliveries subject to the transaction tax from value-added tax (VAT) and excludes foundation university hospitals from corporate tax exemptions starting in 2027.
The crypto provisions would take effect two months after publication if approved.


Ripple is moving ahead with new payment plans tied to its RLUSD stablecoin as it targets faster cross-border trade settlement.
Summary
- Ripple and Unloq are testing RLUSD in Singapore to automate trade payments on XRP Ledger.
- BLOOM gives Ripple a regulated sandbox to test settlement tied to shipment verification and financing.
- The pilot adds to Ripple’s broader payments expansion in Asia and planned Australian licensing push.
According to the announcement, the company is working with supply chain finance firm Unloq to test a trade finance model on the XRP Ledger through BLOOM, a sandbox run by the Monetary Authority of Singapore.
Meanwhile, the pilot will examine whether RLUSD can replace manual payment steps that have slowed trade finance for years. Ripple and Unloq said the system can release payments “automatically when predefined conditions are met, such as shipment verification.”
Ripple plans to use RLUSD as the settlement asset in a pilot built with Unloq’s SC+ platform. The project aims to combine trade obligations, settlement rules, and financing workflows in one execution layer on the XRP Ledger.
The companies said current trade finance still depends on manual checks, documentary credits, and correspondent banking links that often take days or weeks to complete. They said the new model seeks to reduce delays by automating payment release once agreed trade conditions are verified.
The pilot will run inside BLOOM, which stands for Borderless, Liquid, Open, Online, Multi-currency. MAS launched the initiative in October 2025 to expand settlement options for tokenized bank liabilities and regulated stablecoins.
Ripple said the test will focus on whether RLUSD can replace manual processes that have “slowed cross-border trade for decades.” The companies also said the model could give firms better visibility into settlement risk while helping smaller businesses access trade-finance services.
RLUSD growth supports Ripple’s wider payments plan
Ripple launched RLUSD in December 2024 with institutional use as its main target. The stablecoin has grown to a market value near $1.5 billion, placing it among the largest stablecoins by market capitalization.
The BLOOM pilot comes less than four months after Ripple said MAS approved an expanded scope of payment activities for Ripple Markets APAC in December 2025. That approval added to Ripple’s push to deepen its role in regulated payment infrastructure in Asia.
As previously reported, Ripple has also outlined plans to expand in Australia through an Australian Financial Services License. The company said it aims to obtain that license by acquiring BC Payments Australia Pty Ltd., subject to the final completion process.


- Bitcoin price rebounds above $71,000 amid cautious market sentiment.
- Exchange outflows suggest long-term accumulation by investors.
- Geopolitical signals and Bitcoin transfers shape near-term trends.
Bitcoin has bounced back above $71,000 after a week of mixed signals in the market.
The move comes as investors closely watch geopolitical developments, particularly efforts to ease tensions in the Middle East.
Notably, a peace proposal between the United States and Iran has sparked cautious optimism, lifting risk assets and sending Bitcoin higher.
Despite the rebound, sentiment remains cautious, with the Fear & Greed Index at 35, signalling that investors are still in the “Fear” zone.
This suggests that while the price has recovered, many market participants are hesitant to commit fully, waiting for clearer direction.
Exchange outflows signal an accumulation phase
Recent on-chain data shows that more bitcoins have been leaving crypto exchanges than entering them.
This trend is often interpreted as a sign of accumulation.
Investors appear to be moving coins into private wallets for long-term holding rather than selling immediately.
The persistent outflows indicate confidence in Bitcoin’s fundamentals and a willingness to weather short-term price swings.
This accumulation behaviour can help reduce selling pressure in the market.
When coins leave exchanges, fewer are available for immediate trading, which often supports the price even during periods of uncertainty.
Bhutan Government moves $37 BTC
Adding another layer to the market dynamic, the Royal Government of Bhutan recently moved roughly $37 million worth of Bitcoin from government-controlled wallets, according to Arkham Intelligence data.
Analysts see this as a structured transfer rather than a sudden liquidation, suggesting careful treasury management.
While the exact motives are not fully public, such large-scale movements highlight that governments and large holders can influence liquidity.
These actions can affect market psychology, especially when combined with broader investor accumulation trends.
Bitcoin price forecast for the coming days
Overall, the market is in a consolidation phase, seeking a catalyst to define the next sustained move.
Exchange outflows, government movements, and geopolitical developments are all factors that could influence the next direction.
The recent Bitcoin price movements suggest that it may have recently hit bottom around $67,500, even though the broader picture is still uncertain.
But whether the current recovery signals a true bottom or just a temporary rebound remains to be seen, although the combination of accumulation behaviour, controlled government movements, and cautious optimism on geopolitical developments has created an environment where Bitcoin can maintain support and potentially build momentum.
A daily close above $73,000 could signal strength and potentially push the price toward $75,000, according to analysts.
Conversely, a break below $70,000 might prompt a retest of $67,500 support, marking a critical line for short-term investors.

European currencies are trading without a clear direction against the US dollar, remaining in a consolidation phase following the earlier decline driven by USD strength. At the start of the week, both EUR/USD and GBP/USD attempted a recovery, but the upside proved limited, and the pairs are now testing the upper boundaries of their short-term trading ranges.
Market participants are adopting a wait-and-see approach ahead of the release of key macroeconomic data, which could determine the next direction for the dollar and major currency pairs. Geopolitical uncertainty in the Middle East remains an additional factor weighing on sentiment. Reports of ongoing tensions and risks to energy supply disruptions continue to support elevated oil prices, fuelling inflation expectations and prompting investors to reassess the outlook for central bank policy.
Today, the focus is on business activity and inflation data from Europe and the UK, as well as housing market and consumer activity figures from the US. These releases could significantly impact interest rate expectations, prompting traders to refrain from opening large positions ahead of the data.
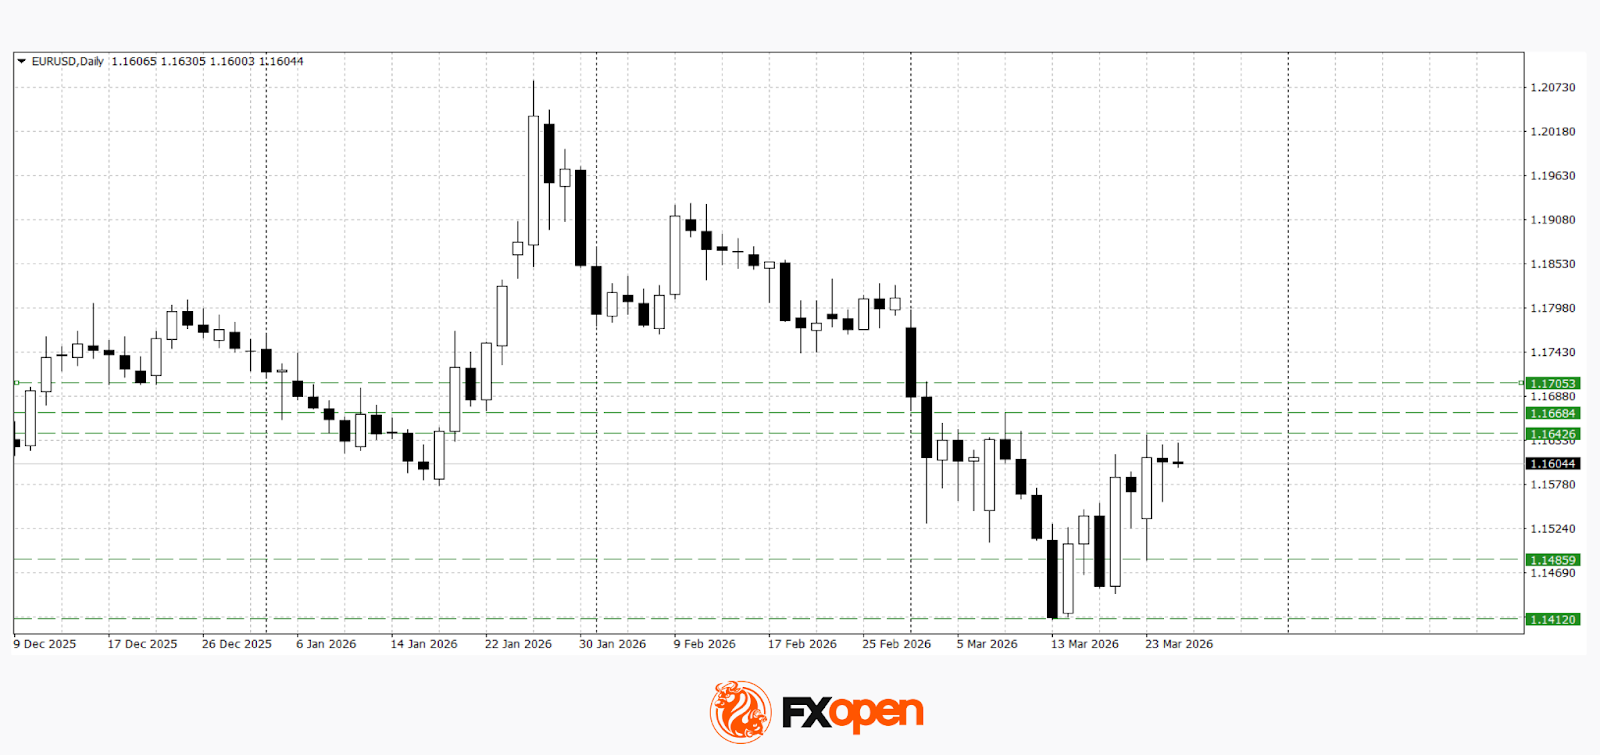
EUR/USD
At the start of the week, EUR/USD tested key support near 1.1480 before rebounding above 1.1600. Technical analysis suggests a range-bound market: a rejection from the key resistance level at 1.1640 could lead to a renewed test of recent lows in the 1.1420–1.1480 area. Conversely, a firm break above 1.1640 and a move out of the range could open the way for further gains towards 1.1680–1.1710.
Key events for EUR/USD:
- Today at 11:00 (GMT+2): Germany business expectations index
- Today at 13:00 (GMT+2): Bundesbank monthly report
- Today at 14:30 (GMT+2): US current account balance
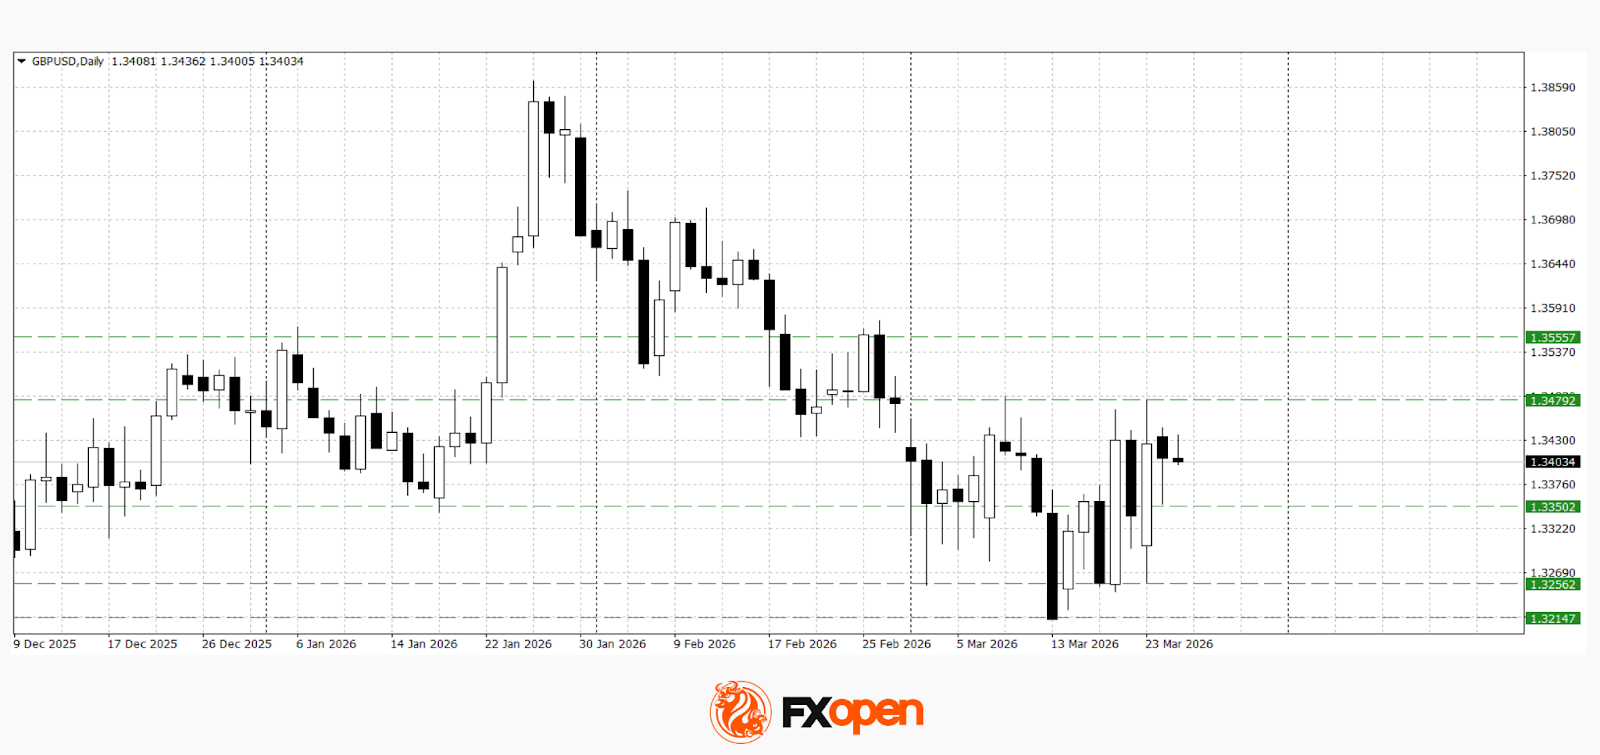
GBP/USD
GBP/USD is also trading within a range. Following last week’s Bank of England meeting, the pair strengthened towards 1.3480 but failed to sustain upward momentum, retreating to 1.3250 on Monday. Technical analysis points to the potential for a retest of the recent high; however, in the event of weak UK data, a move lower towards the 1.3350–1.3250 area is equally possible.
Key events for GBP/USD:
- Today at 09:00 (GMT+2): UK Consumer Price Index (CPI)
- Today at 11:30 (GMT+2): UK house price index
- Tomorrow at 11:30 (GMT+2): Speech by Bank of England Financial Policy Committee member Sarah Breeden
Trade over 50 forex markets 24 hours a day with FXOpen. Take advantage of low commissions, deep liquidity, and spreads from 0.0 pips (additional fees may apply). Open your FXOpen account now or learn more about trading forex with FXOpen.
This article represents the opinion of the Companies operating under the FXOpen brand only. It is not to be construed as an offer, solicitation, or recommendation with respect to products and services provided by the Companies operating under the FXOpen brand, nor is it to be considered financial advice.
Crypto World
Cardano (ADA) Price: Historic Bullish Indicators Emerge as Token Tests Key Support Level

TLDR
- The 365-day MVRV metric for Cardano has plummeted to -43%, entering what market analysts identify as an accumulation zone
- ADA funding rates on Binance have hit their lowest point since June 2023, indicating extreme bearish positioning
- Total Value Locked on Cardano increased 3% over 24 hours to reach 525.44 million ADA, signaling sustained network activity
- Both metrics last converged at these levels in mid-2023, preceding an approximate 300% price increase over the next year and a half
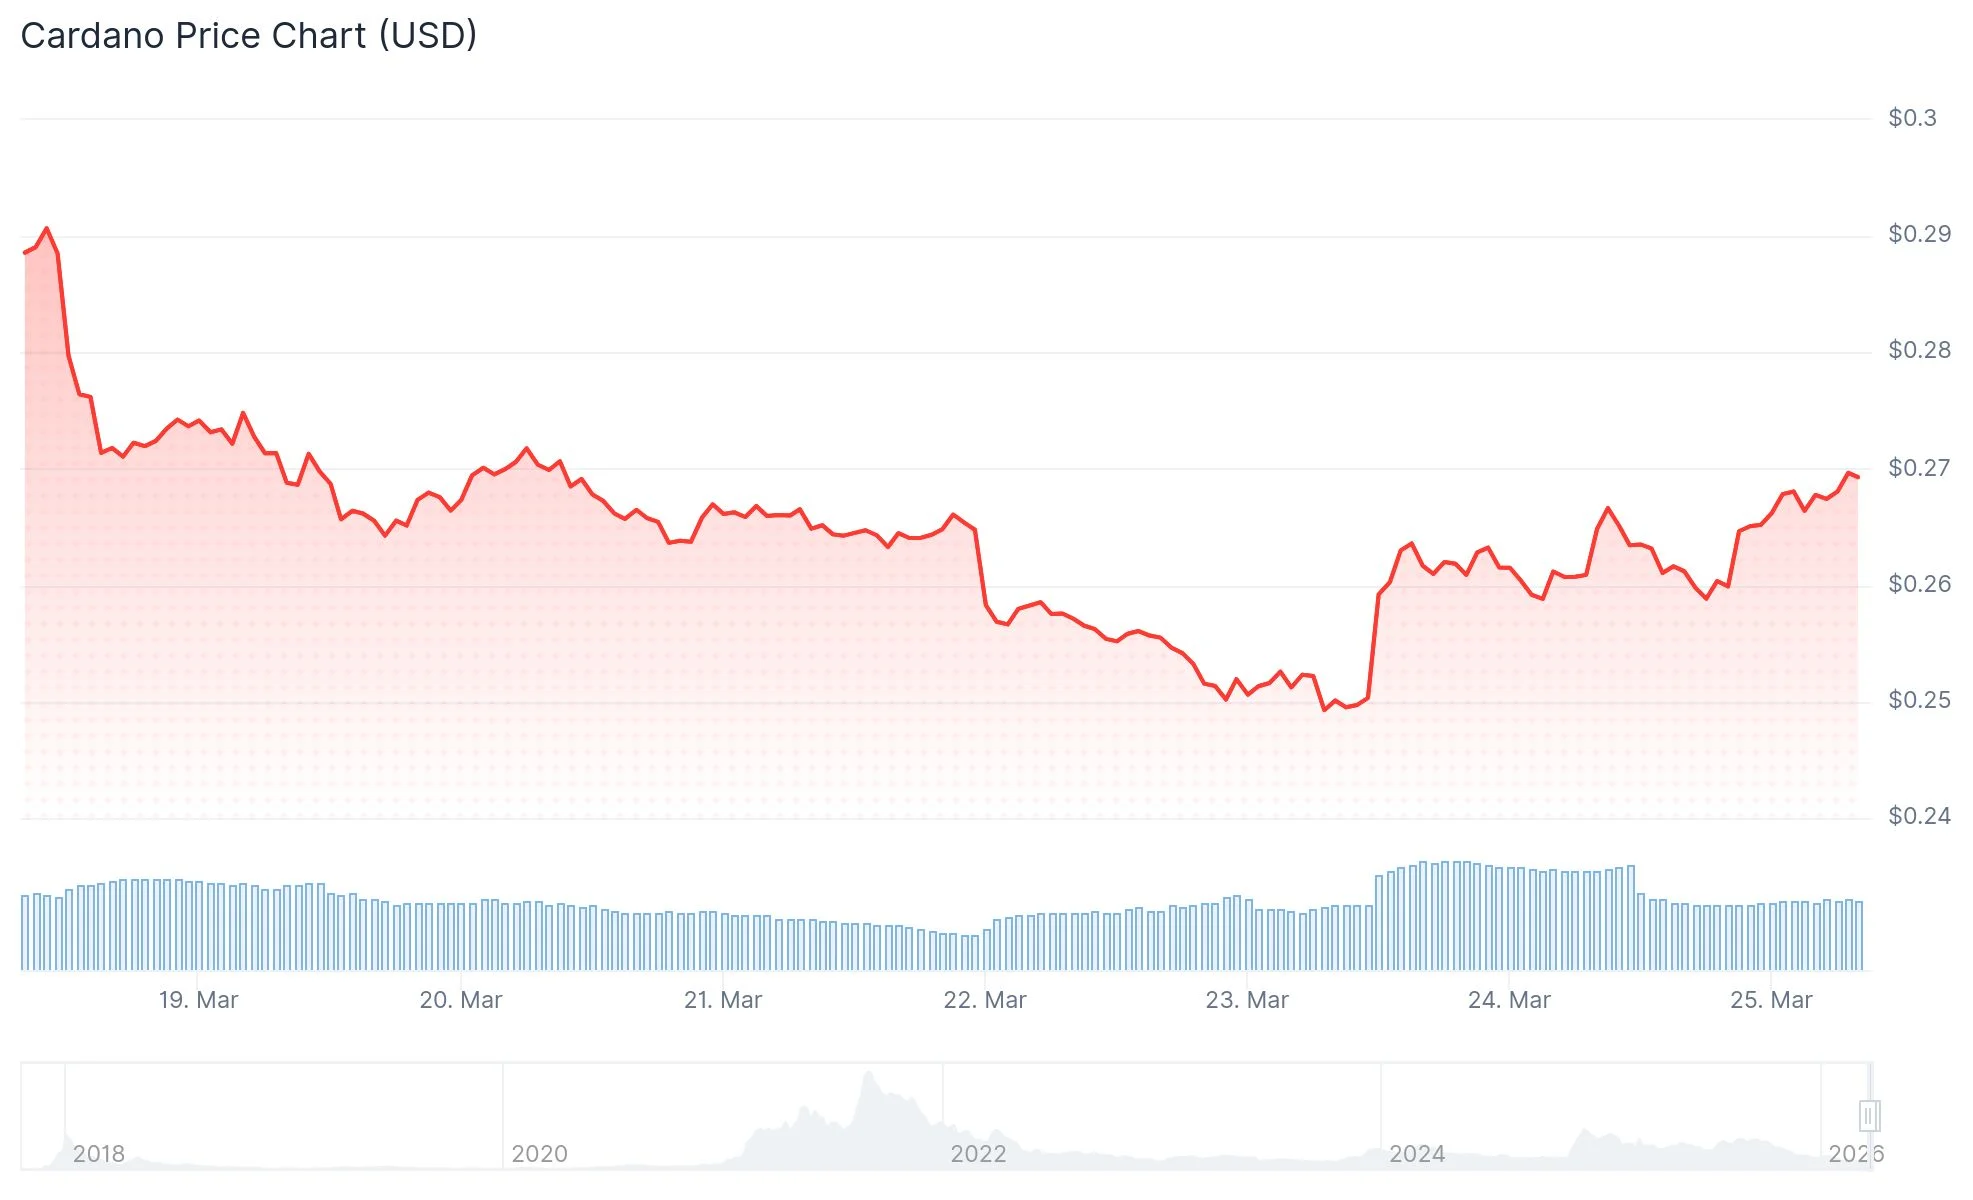
- Current ADA price stands around $0.26, reflecting a weekly decline of 7% and a 71% drop from September highs
Cardano is currently exchanging hands near the $0.26 mark following a 4% intraday recovery on Monday. A combination of two historically significant indicators from on-chain analytics and derivatives markets has simultaneously activated, mirroring conditions that previously signaled major price reversals.
The 365-day Market Value to Realized Value metric for Cardano has declined to -43%. This negative reading indicates that network participants who have been active over the previous 12 months are currently experiencing unrealized losses averaging 43%. Blockchain analytics provider Santiment categorizes this territory as the “opportunity zone.” Historical data suggests that when MVRV reaches such deeply negative values, the majority of weak-handed sellers have typically already capitulated.

The MVRV indicator measures the average profit or loss position of market participants across a defined timeframe and has historically demonstrated mean-reversion characteristics. When this metric falls significantly below zero, the remaining holders typically consist of long-term believers or investors who have already reconciled themselves to current losses. This dynamic substantially reduces the probability of additional capitulation events.
Concurrently, Binance’s weekly average funding rate for ADA perpetual futures has plunged to its most bearish level since June 2023. Funding rates in perpetual swap markets represent the cost exchange between long and short position holders. An extremely negative funding rate indicates that short sellers dominate the market and must compensate long position holders to maintain their bearish bets.
Why Short Crowding Matters
When bearish positioning reaches such extreme concentration levels, even modest upward price movements can catalyze cascading liquidations. Short positions get forcibly closed, requiring traders to purchase the underlying asset to cover their exposure, which subsequently drives prices higher and triggers additional liquidation events.
Market participants refer to this phenomenon as a short squeeze. For Cardano specifically, periods of extremely negative funding rates have more frequently preceded sharp upward price movements rather than continued downward trends.
The previous instance when both the MVRV indicator and funding rate metrics converged at comparable extreme levels occurred in mid-2023. At that juncture, ADA was trading near $0.25 before subsequently appreciating approximately 300% throughout the subsequent 18-month period.
According to DeFiLlama analytics, Cardano’s Total Value Locked experienced a 3% increase within a 24-hour window, climbing to 525.44 million ADA. The TVL measurement has exhibited a predominantly upward trajectory since the market correction that began in September.
Technical Levels to Watch
From a technical perspective, ADA continues to defend the $0.2436 support threshold, which previously served as a testing point on February 5. The upper boundary of the current range is established at $0.2991, last contacted on February 26.
Cardano remains positioned beneath its 50-day, 100-day, and 200-day Exponential Moving Averages, all of which maintain bearish downward trajectories. The Relative Strength Index registers at 45, marginally below the 50-level neutral threshold. The MACD indicator has crossed back underneath its signal line.
ADA has depreciated approximately 71% from its September zenith and trades roughly 7% lower across the weekly timeframe.


OpenAI has started shutting down the Sora app, a move that marks a sharp pullback from its consumer video push.
Summary
- OpenAI started shutting down the Sora app and said timelines for users would follow soon.
- Reports said OpenAI is winding down more video products beyond the consumer-facing Sora app too.
- Sora grew quickly, but deepfake concerns and a stalled Disney deal added pressure over time.
On Tuesday, the Sora app account said, “We’re saying goodbye to the Sora app,” and added that more details would follow on timelines for the app, the API, and ways users can preserve their work.
The move came just days after OpenAI’s own help pages described Sora 2 and the Sora app as active products. A March 23 safety page said “The Sora 2 model and the Sora app” were available, while March 19 release notes announced new editing tools on iOS and web.
The Wall Street Journal reported that Chief Executive Sam Altman told staff OpenAI would wind down products built around its video models. Reuters, citing sources familiar with the matter, said that includes the consumer app and other video-related offerings as the company shifts resources to coding, enterprise tools, robotics, and broader AI goals.
OpenAI has not yet posted a full product blog on its main site explaining the broader change. Its current developer documentation still lists Sora 2 and Sora 2 Pro among OpenAI’s video generation models, which shows some public pages had not yet caught up with Tuesday’s decision.
Sora gained users but also drew criticism
OpenAI launched the Sora app on September 30, 2025, starting with invite-only iOS access before expanding further. The company described it as a new app for short video creation, while outside reports said it reached 1 million downloads within five days of launch.
The product also faced pressure over deepfakes, copyrighted characters, and other misuse concerns. The Associated Press reported that OpenAI restricted some public-figure content after protests from families and entertainment groups, while OpenAI’s own safety material said it used watermarks, moderation systems, and provenance tools inside Sora.
In addition, the shutdown also affects a planned Disney tie-up that had drawn market attention. The Disney arrangement did not close and that no funds changed hands, even though the proposed deal had included licensed characters and a large equity component.

Key Takeaways
- Irish authorities and Europol successfully accessed a Bitcoin wallet inactive for almost ten years
- Approximately 500 BTC valued at roughly $35 million was transferred to Coinbase on March 24, 2026
- The cryptocurrency belonged to Clifton Collins, a convicted cannabis cultivator who concealed his private keys in a fishing rod container
- Authorities believed the keys were permanently lost when Collins’ possessions were disposed of in a landfill after his 2017 detention
- Law enforcement officials are confident the technique used can unlock the other 11 wallets containing over €330 million
The Criminal Assets Bureau (CAB) of Ireland, working alongside Europol, has gained access to a Bitcoin wallet that remained untouched for close to ten years. The wallet contained 500 BTC, currently valued at approximately $35 million, which was moved on-chain and deposited into Coinbase on March 24.
The cryptocurrency belonged to Clifton Collins, a Dublin resident who was found guilty of operating large-scale cannabis growing operations spanning several Irish counties over more than a decade. Before his criminal enterprise, Collins worked in security and beekeeping.
Between 2011 and 2012, Collins purchased 6,000 Bitcoin when the digital currency was trading for just a few dollars. He financed these acquisitions using profits from his cannabis business.
Collins divided his 6,000 BTC holdings evenly among 12 separate wallets, placing 500 BTC in each one. He printed all the private keys onto a single piece of paper and concealed this document inside a fishing rod case at his rented residence in Galway.
In 2017, law enforcement arrested Collins following the discovery of cannabis during a routine vehicle inspection. Subsequently, his landlord cleared out the property and discarded Collins’ belongings at a landfill site.
The fishing rod case containing the sole copy of the private keys was almost certainly destroyed in the process. Collins later indicated that a burglary at the property might have also played a role.
In 2020, an Irish High Court mandated the seizure of the Bitcoin. At the time, the 6,000 BTC was valued at approximately €53 million. Today, that same amount is worth roughly €360 million.
Despite the court’s ruling, CAB had no method to access the cryptocurrency without the private keys. Both law enforcement and Collins assumed the Bitcoin was irretrievably lost.
The Method Behind the Breakthrough
CAB and Europol have not revealed the specific method used to access the wallet. Europol stated only that it supplied “highly complex technical expertise and decryption resources.”
One hypothesis suggests Collins may have stored his keys in an encrypted file secured by a weak password, which investigators could have cracked using brute force techniques.
An alternative explanation is that Collins employed a defective tool to create all 12 key pairs. A compromised random number generator could have produced predictable keys, enabling investigators to recreate them.
Authorities reportedly have high confidence that the identical approach can be used on the other 11 wallets.
Outstanding Holdings
Collins still possesses 5,500 Bitcoin, currently worth approximately $389 million based on Arkham intelligence.
Should CAB successfully unlock all remaining wallets with the same methodology, recovering the complete 6,000 BTC would represent the largest single asset confiscation in the bureau’s operational history.
The 500 BTC transferred on March 24 represents the first verified access to any of Collins’ wallets since his apprehension nine years ago.
Key Takeaways
- XRP currently trades at $1.39, experiencing a 3.46% decrease over the past day
- Critical support remains intact at the $1.40 level following recent pullback
- Resistance zone between $1.45 and $1.50 represents the next hurdle for bulls
- The Relative Strength Index rests at 46, indicating subdued buying momentum
- Failure to hold $1.3850 support may trigger further downside toward $1.3620
XRP maintains its position near a crucial support threshold following sustained bearish pressure. The digital asset has retreated from recent peak levels and currently consolidates within the $1.40 vicinity.
Current market data shows XRP changing hands at $1.39. Daily trading volume reaches $3.16 billion while the total market capitalization stands at $85.87 billion, per CoinMarketCap statistics. The cryptocurrency has shed 3.46% of its value during the last 24-hour period.
The token previously surged beyond the $1.41 and $1.42 marks, ultimately reaching a session high of $1.4650. Following this peak, sellers emerged and forced the price below both $1.45 and $1.44 thresholds.
Price action breached the 61.8% Fibonacci retracement level calculated from the swing low of $1.3612 to the swing high of $1.4650. Demand materialized around $1.3850, coinciding with the 76.4% Fibonacci level, preventing additional downside movement.
Market analyst BitGuru observed on March 24 that XRP operates within what he identifies as a significant accumulation zone. His assessment indicates that price behavior follows a falling wedge pattern breakdown, with XRP potentially establishing support at the $1.40 level.
$XRP is moving inside a key accumulation zone after a long downtrend and recent falling wedge breakdown.
Price is now stabilizing around 1.40 support, showing signs of base formation. If buyers manage to push and hold above 1.45–1.50 resistance. pic.twitter.com/AFIZozlx3b
— BitGuru 🔶 (@bitgu_ru) March 24, 2026
Momentum Indicators Signal Cautious Sentiment
The Relative Strength Index currently registers approximately 46, remaining beneath the neutral 50 threshold. This positioning indicates that bearish forces continue to dominate market sentiment.
XRP also trades beneath its 20-day moving average positioned at $1.41 and significantly below the 200-day moving average at $2.09. The moving average configuration displays a bearish alignment.
MACD indicator lines remain horizontal within negative territory. The absence of a bullish crossover signal indicates that momentum has yet to shift toward buyer favor.
Critical Price Levels for Traders
Regarding upside potential, initial resistance emerges near $1.4250. Clearing this barrier would expose $1.44, followed by $1.4650.
A decisive breakout above $1.4650 could establish targets at $1.50 and subsequently $1.5250. Bulls must defend the $1.4250 level to sustain any upward trajectory.
Should XRP encounter rejection at higher levels, the initial support line sits at $1.40. Additional downside cushions exist at $1.3850 and $1.3620.
A daily close beneath $1.3620 may accelerate selling toward $1.35 or potentially $1.3320.
This trendline could offer a strong buying opportunity for $XRP! pic.twitter.com/rdyxCeal1s
— Ali Charts (@alicharts) March 20, 2026
Technical analyst Ali Charts shared on X that an important trendline may present a compelling accumulation opportunity for XRP, highlighting the present support region as a favorable entry zone.
XRP presently maintains levels above both $1.40 and the 100-hourly Simple Moving Average, with market participants adopting a cautious stance as they monitor developing price patterns.
TLDR:
- The Philippines imports 98% of its oil from Gulf nations, all directly disrupted by the ongoing Iran war conflict.
- Fuel prices have nearly tripled since February 28, with diesel hitting 130 pesos and LPG reserves lasting just 24 days.
- President Marcos signed Executive Order 110, granting authority over fuel rationing and essential goods distribution nationwide.
- Labor union KMU warned the emergency order could restrict worker strikes, with transport workers planning a two-day strike this week.
The Philippines has become the first country to declare a national energy emergency linked to the ongoing Iran war. President Ferdinand Marcos Jr. signed Executive Order 110 on Tuesday.
The order cites an imminent danger to the country’s energy supply stability. With roughly 45 days of fuel remaining on average, the government is moving quickly.
The declaration grants broad authority over fuel purchasing, rationing, and distribution of essential goods across the nation.
A Nation Running Low on Fuel
The Philippines imports 98% of its oil from the Gulf region. Its top three suppliers — Saudi Arabia, the UAE, and Iraq — are all caught up in the conflict.
Together, these three nations account for billions of dollars in annual oil exports to the Philippines. With the Strait of Hormuz effectively shut down, those supply lines have been severely disrupted.
Saudi Arabia has already cut oil exports to Asia for a second straight month. Meanwhile, the Philippines produces just 14,300 barrels of oil per day domestically.
The country consumes around 474,000 barrels daily, leaving a 97% gap between supply and demand. That gap is now at the center of a deepening national crisis.
As TFTC noted on X: “The Philippines just became the first country in the world to declare a national energy emergency over the Iran war. They have 45 days of fuel left.”
Energy Secretary Sharon Garin provided a detailed breakdown of current reserves. “Gasoline for 53 days, diesel for 46 days, jet fuel for 39 days, and LPG for just 24 days,” Garin stated. The 45-day figure represents the average across all petroleum products. These numbers have pushed the government toward emergency measures.
Fuel Prices Surge as Government Acts
Fuel prices in the Philippines have nearly tripled since the war began on February 28. Diesel, widely used across the country, has surged to nearly 130 pesos per liter.
Kerosene, a cooking fuel for lower-income households, has climbed to 145 pesos. Gasoline has now exceeded 90 pesos per liter, more than double pre-war levels.
In response, the government has introduced several conservation measures. Civil servants are now on a four-day workweek to cut fuel use.
Ferry services have also been reduced, and transport workers are receiving 5,000-peso subsidies. The country is also shifting temporarily to coal-fired power plants to reduce reliance on liquefied natural gas.
Labor unions, however, are not satisfied. The KMU, the Philippines’ largest labor coalition, described the executive order as an “admission” that the government failed to act sooner.
The group also warned that provisions in the order could be used to “restrict strikes and protests.” Transport workers are planning a two-day strike on Thursday and Friday in direct response to the crisis.


Robinhood has approved a share repurchase program worth $1.5 billion, according to a filing with the U.S. Securities and Exchange Commission on Tuesday. The company said it plans to execute the buyback over the next three years.
Summary
- Robinhood approved a $1.5 billion share buyback program to run over the next three years.
- HOOD closed down 4.7% Tuesday and remains nearly 39% lower so far in 2026 overall.
- Robinhood replaced its prior credit line with a new $3.25 billion JPMorgan revolving facility Tuesday.
According to the filing, the total includes $1.1 billion in new capacity. Robinhood rolled over the rest from an older repurchase plan. The company said the move reflects its capital plans as it continues to build new products and return value to shareholders over time.
Robinhood Chief Financial Officer Shiv Verma addressed the decision in a company statement. He said,
“Robinhood is a generational company with a massive long-term opportunity.” Verma also said, “This authorization reflects the confidence of our management team and board in our ability to continue delivering innovative products for customers and creating value for shareholders while returning capital over time.”
The company linked the program to its broader business strategy rather than to a short-term market move.
Robinhood shares closed Tuesday at $69.08, down 4.7% on the day. That marked the stock’s lowest closing price of the year. The shares later recovered slightly to $70.90 in after-hours trading.
The stock has fallen nearly 39% so far this year. It also stands 54.7% below its October peak of $152.46. The decline came during a weak period for both stocks and crypto, with broader macro concerns and the Iran war weighing on risk assets.
Credit facility expands while growth plans continue
Robinhood also said its unit, Robinhood Securities, entered a new $3.25 billion revolving credit facility with JPMorgan Chase. The new facility replaces a prior $2.65 billion line. It also includes an option to expand by up to $1.62 billion, which would bring the total capacity to $4.87 billion.
Even with pressure on its share price, Robinhood continues to push into crypto, tokenization, and adjacent financial products. The company launched the testnet for its Ethereum layer-2 network in February. Chief Executive Officer Vlad Tenev said the network processed 4 million transactions in its first week of public testnet activity.
Robinhood plans to launch the mainnet later this year to support tokenized equities, ETFs, and other traditional financial assets. Robinhood Ventures Fund has also invested about $35 million across Stripe and ElevenLabs.

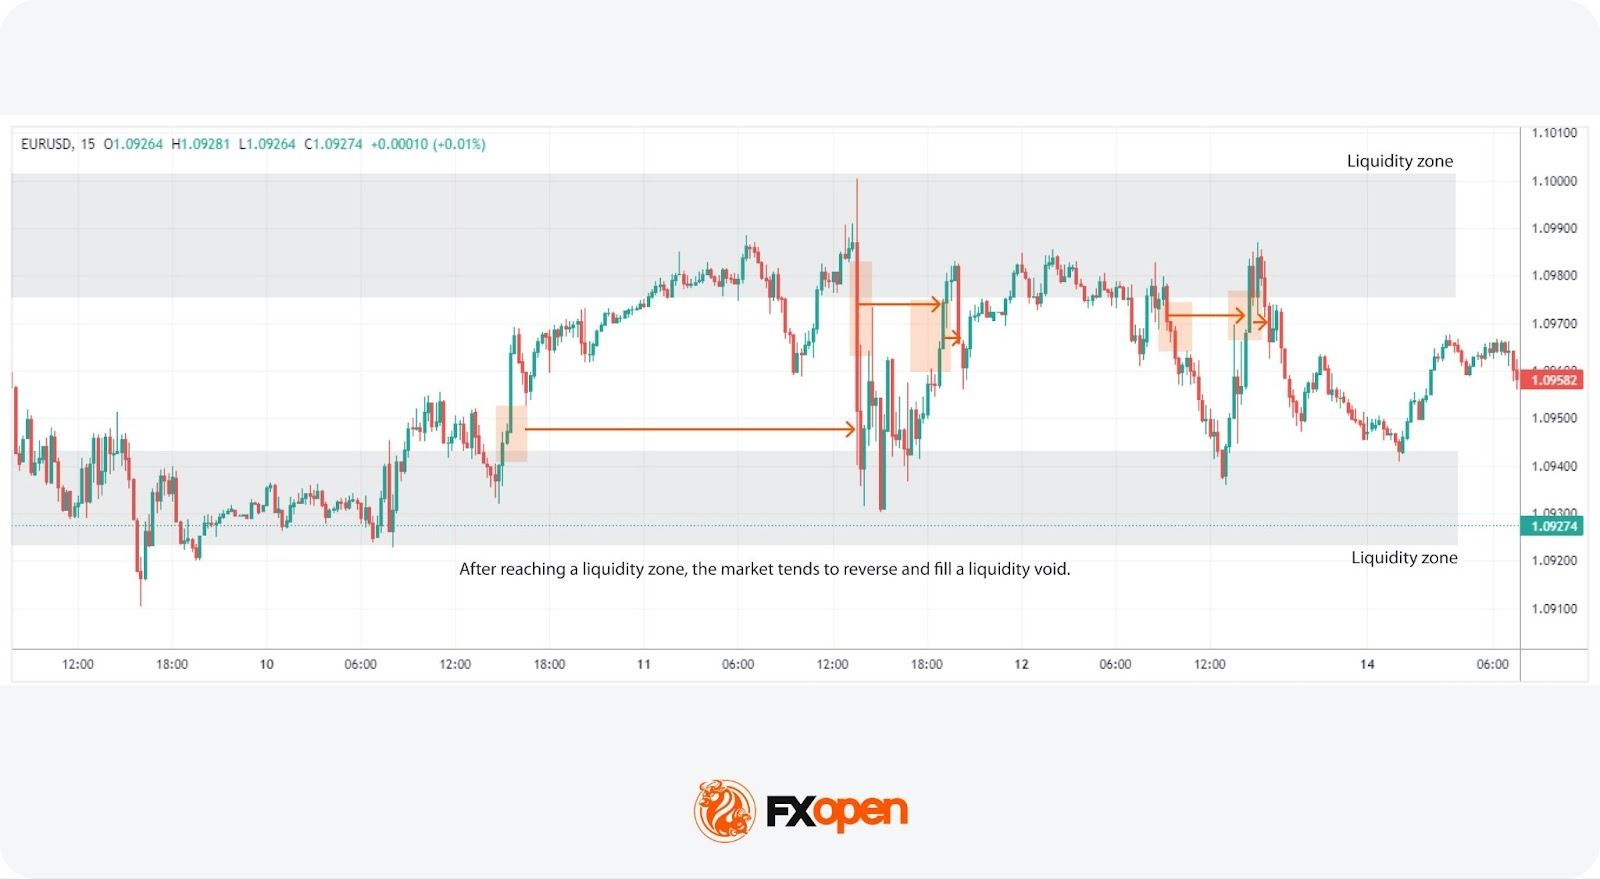
Liquidity zones are areas where large buy and sell orders cluster, often acting as support or resistance. Liquidity voids (or imbalances) are fast price moves where little trading occurred, and price often returns to fill them.
Traders use liquidity zones to identify entry and exit points, while liquidity voids may help anticipate retracements and continuation moves.
This article explains how liquidity zones and liquidity voids function in market structure and highlights their role on price charts.
Takeaways
- Liquidity zones = high trading activity (support/resistance)
- Liquidity voids = low activity (fast price moves)
- Price tends to:
- move towards liquidity
- return to fill voids
- Commonly used with:
- market structure
- volume analysis
Liquidity Zones vs Liquidity Voids
Liquidity zones and liquidity voids differ primarily in how order flow is distributed and how price behaves within each environment.
In liquidity zones, trading activity is elevated due to the presence of clustered orders around previous highs, lows, or consolidation ranges. This concentration of liquidity typically causes prices to slow down, rotate, or produce reactions, reinforcing their role as support and resistance areas.
In contrast, liquidity voids form during strong directional moves, leaving behind areas where little trading activity has previously occurred. As a result, when price revisits these regions, it often moves quickly due to the absence of significant opposing orders.
Liquidity zones are generally associated with reversal or breakout strategies, where traders anticipate interaction between buyers and sellers. Liquidity voids, however, are typically approached with mean reversion expectations, as the market tends to rebalance prior inefficiencies.
Understanding Liquidity in Trading
In trading, liquidity refers to how easily an asset can be bought or sold without significantly affecting its price. High liquidity means there are enough buyers and sellers at a given price level, facilitating smoother transactions. This concept is critical because it affects how quickly and at what price a trader can enter or exit positions.
Assets with high liquidity tend to have tighter spreads, which may reduce trading costs.
Conversely, assets with low liquidity can experience abrupt price movements due to limited order flow. Understanding liquidity may help traders make decisions.
These dynamics give rise to two important phenomena in trading: liquidity zones and voids. Liquidity zones are areas with a high concentration of trading activity, while liquidity voids represent gaps in the market where trading activity is sparse, each presenting unique conditions for trading strategies.
What Are Liquidity Zones in Trading?
Liquidity zones (also called liquidity levels) are specific areas on a price chart where trading activity is highly concentrated. These zones indicate areas where large orders can be executed with minimal price impact.
Forex liquidity zones highlight areas where currency pairs tend to see higher activity.
These areas may be useful for identifying reversals or breakouts, providing reference points for entries and exits.
These zones often form around historical price levels where significant trading activity has occurred. They often act as magnets, attracting future price movement due to expected order flow. Liquidity levels are commonly associated with support and resistance. When price approaches these levels, traders can expect increased order flow, which may lead to clearer price reactions.
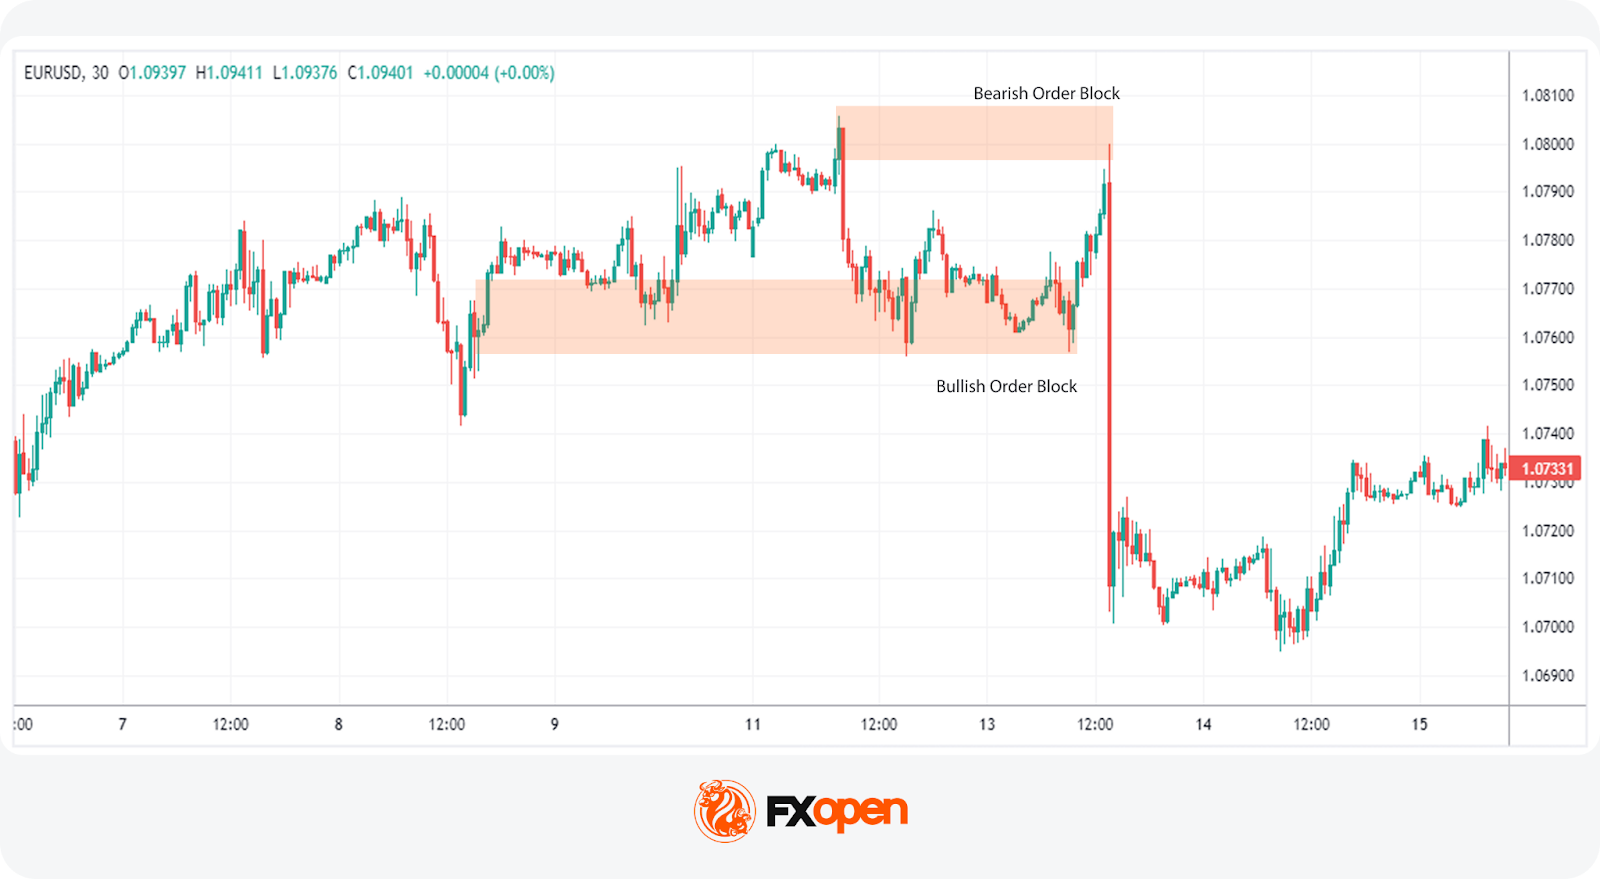
Liquidity Zones vs Order Blocks
How Traders Identify Liquidity Zones (With Examples)
Traders identify liquidity zones using volume, price structure, and historical levels. Liquidity zone trading depends on accurately identifying areas where trading activity is concentrated. These levels highlight regions of high volume and may act as pivot points for price action.
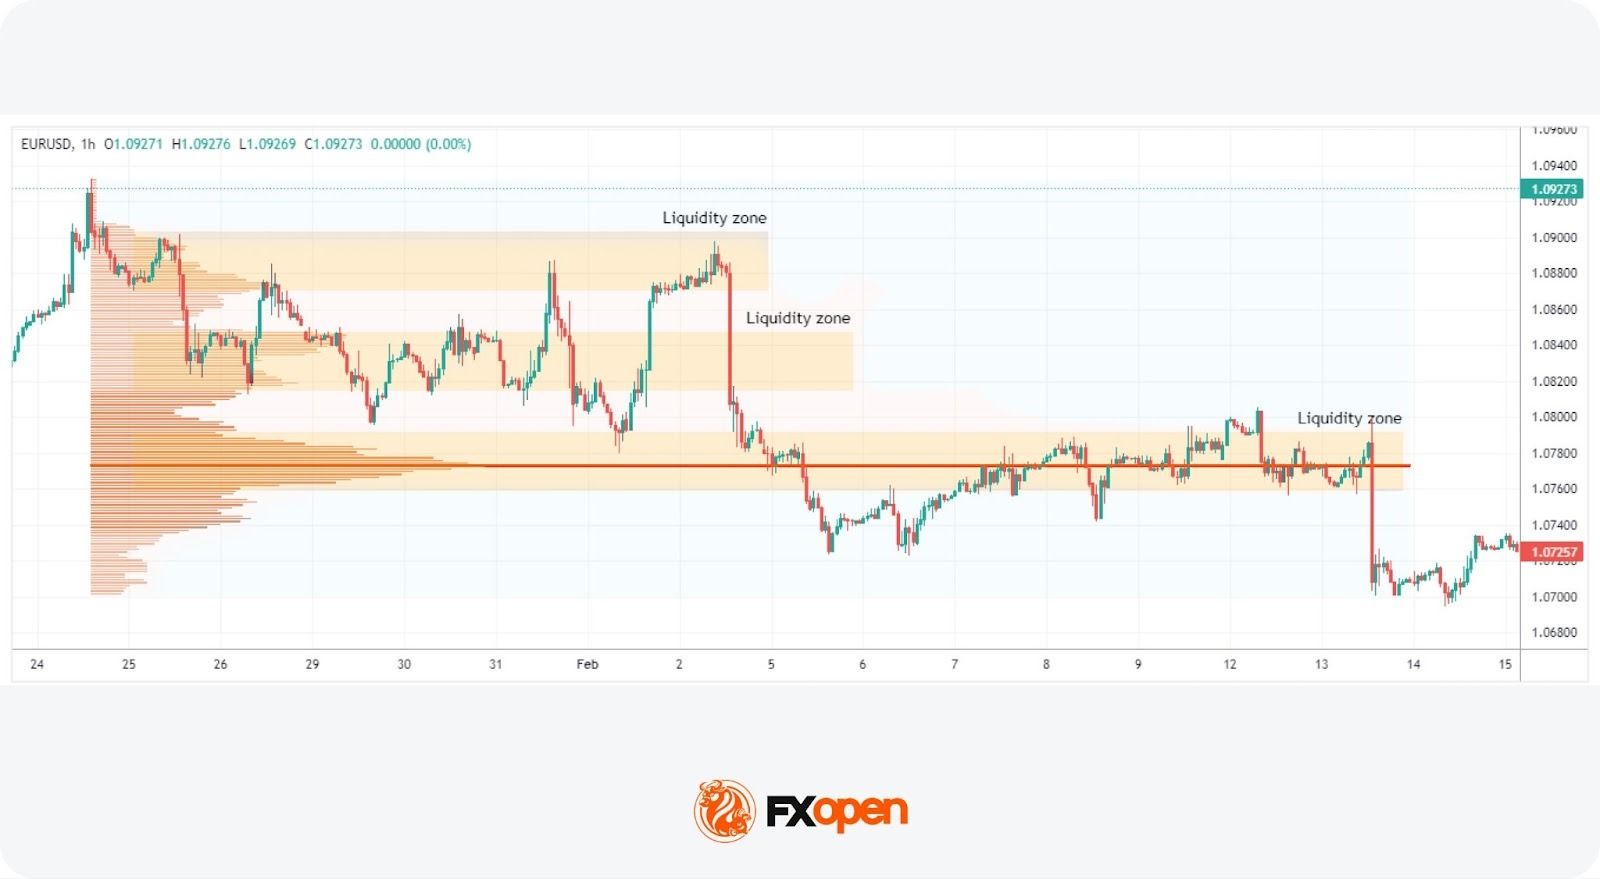
Volume Profile
This approach uses the volume profile to show where most trading activity has occurred.
Unlike traditional indicators that display volume over time, the volume profile shows volume at specific price levels. This may help traders identify peaks in volume, highlighting areas of significant liquidity.
To use the volume profile tool as we have in the picture above, you can head over to FXOpen’s TickTrader trading platform and search for “Volume Profile Fixed Range” under the Indicators tab.
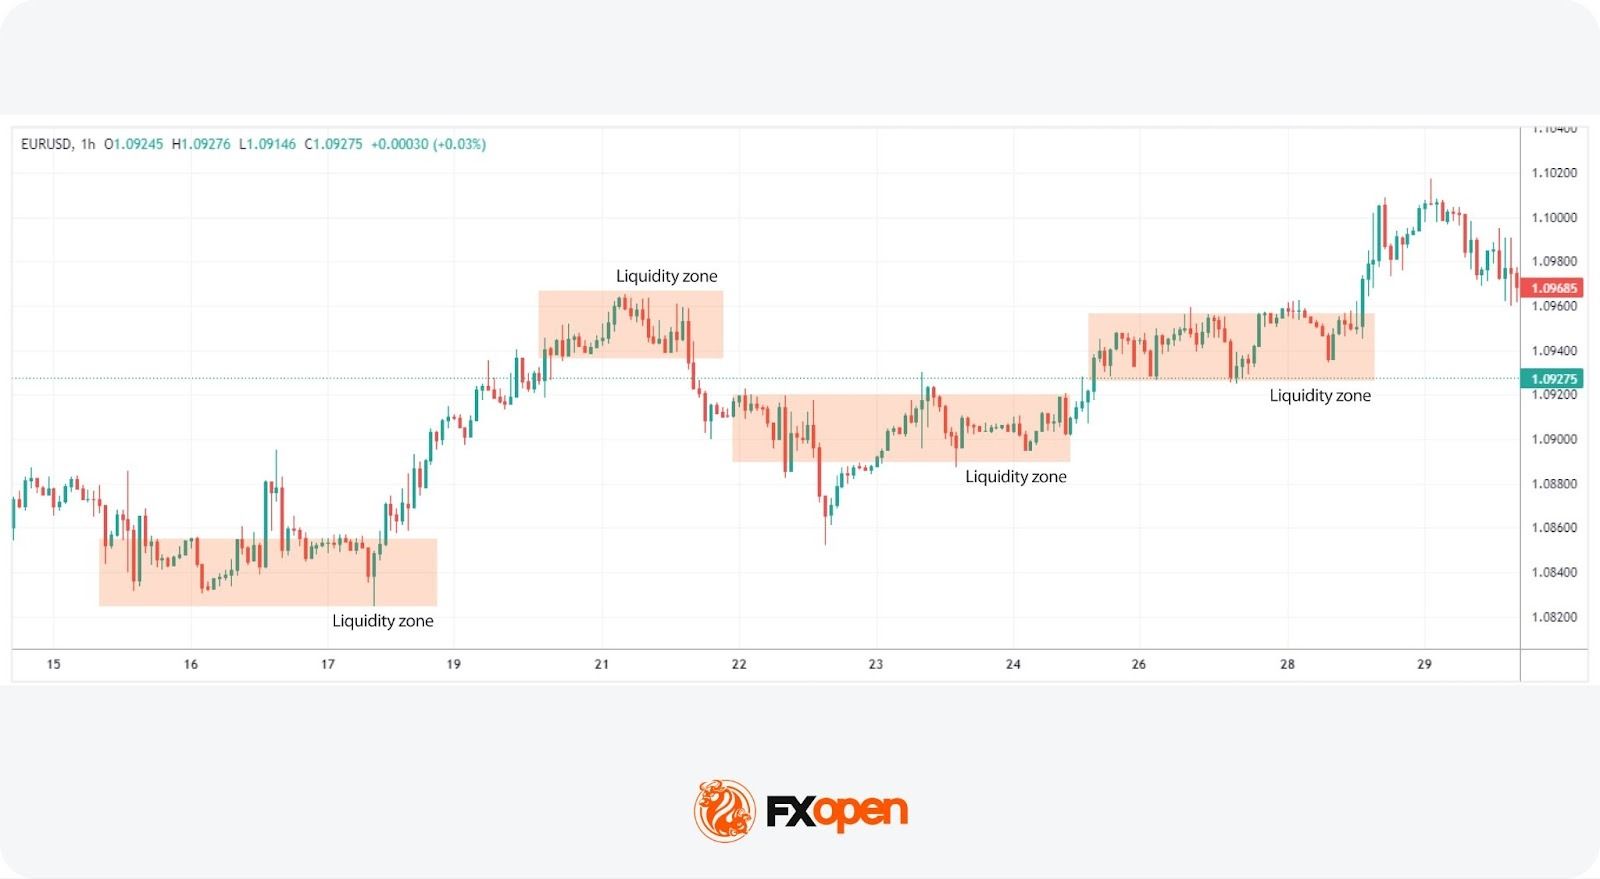
Price Consolidation Areas
Recognising zones where the price has consolidated for a notable period is another method. These areas represent a tug-of-war between buyers and sellers, resulting in a high volume of trades. Such levels often act as magnets for future price action, making them critical for liquidity area trading.
Previous Support and Resistance Levels
Historical support and resistance levels are invaluable for spotting zones. These are levels at which significant reversals or pauses in trend have occurred, indicating areas where large volumes of orders may accumulate. When price approaches these levels again, it often does so with increased trading activity, making them prime candidates for liquidity areas.
What Is a Liquidity Void (Imbalance)?
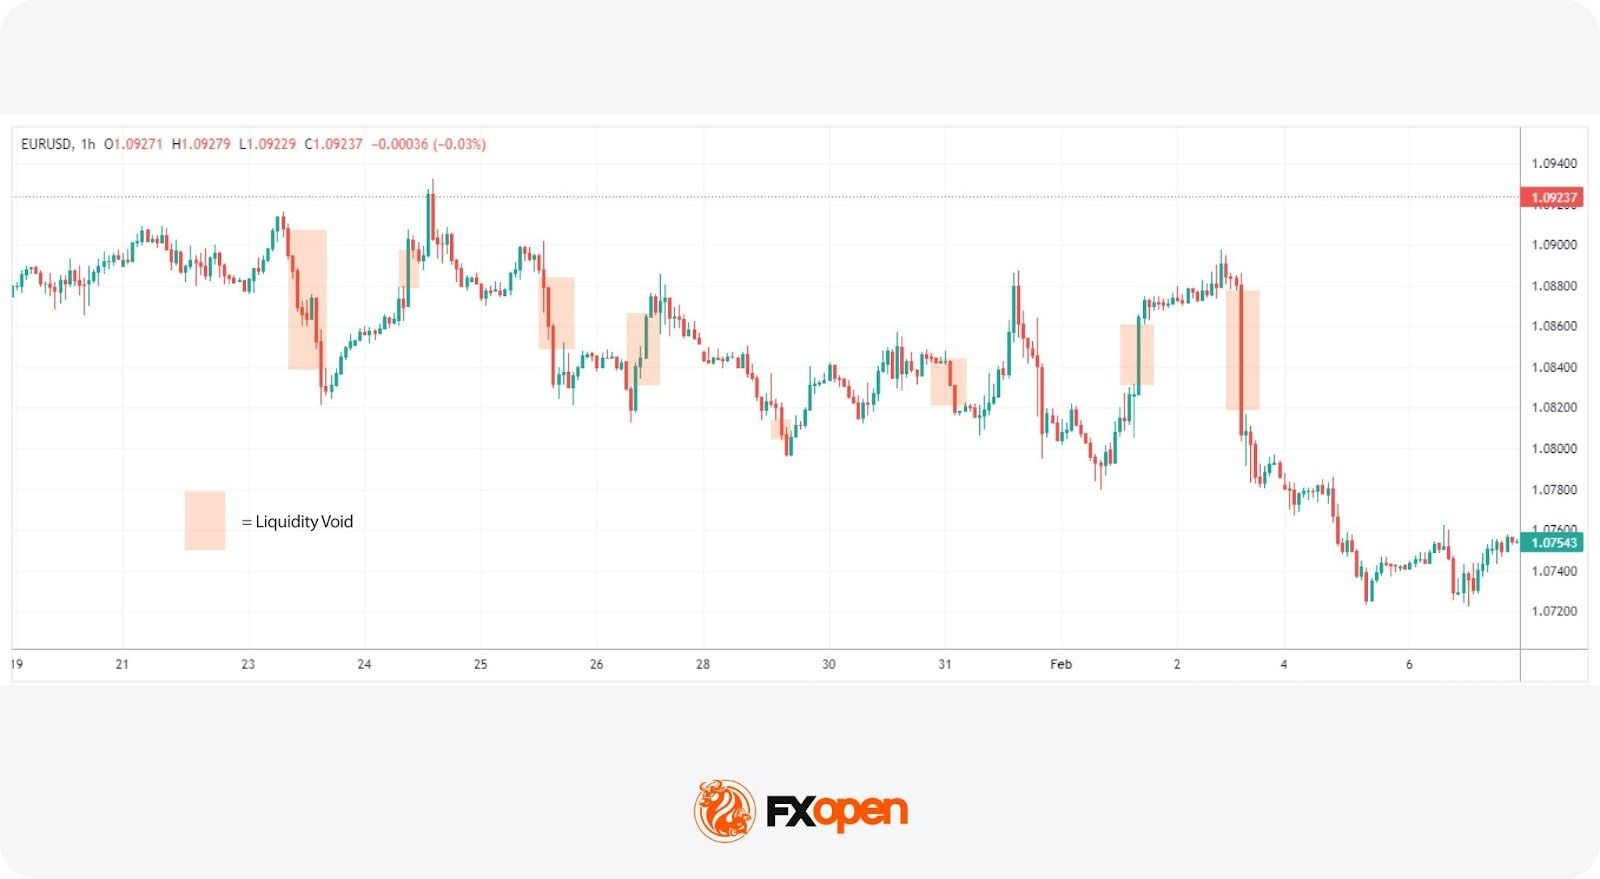
Liquidity voids (imbalances) are rapid price movements where little trading activity occurs between two levels. These gaps can lead to abrupt price changes and are often visible as sharp moves on a chart.
A liquidity void in forex signals an imbalance between buyers and sellers, causing prices to move quickly. This can result in sharp price movement as the market seeks a new equilibrium. These voids often occur after major news releases, during low-liquidity periods, or due to large institutional trades.
Their impact extends beyond the initial move. They represent areas where the market has not established a consensus price, which may lead to increased volatility later. Prices often return to these areas to “fill” the imbalance and restore balance in the market.
Traders navigate the increased volatility and unpredictability associated with these gaps but can also strategise to take advantage of the potential return to equilibrium.
How Traders Spot Liquidity Voids (Types of Liquidity Voids)
Liquidity voids can be classified based on where they appear in a trend. Liquidity voids in the forex market manifest in various forms, each with distinct characteristics and implications for traders. Understanding the different types of voids may support traders in navigating these challenging areas. Some notable types of liquidity voids are common, exhaustion, breakout, and runaway. Let’s take a look at them:
Common Liquidity Voids
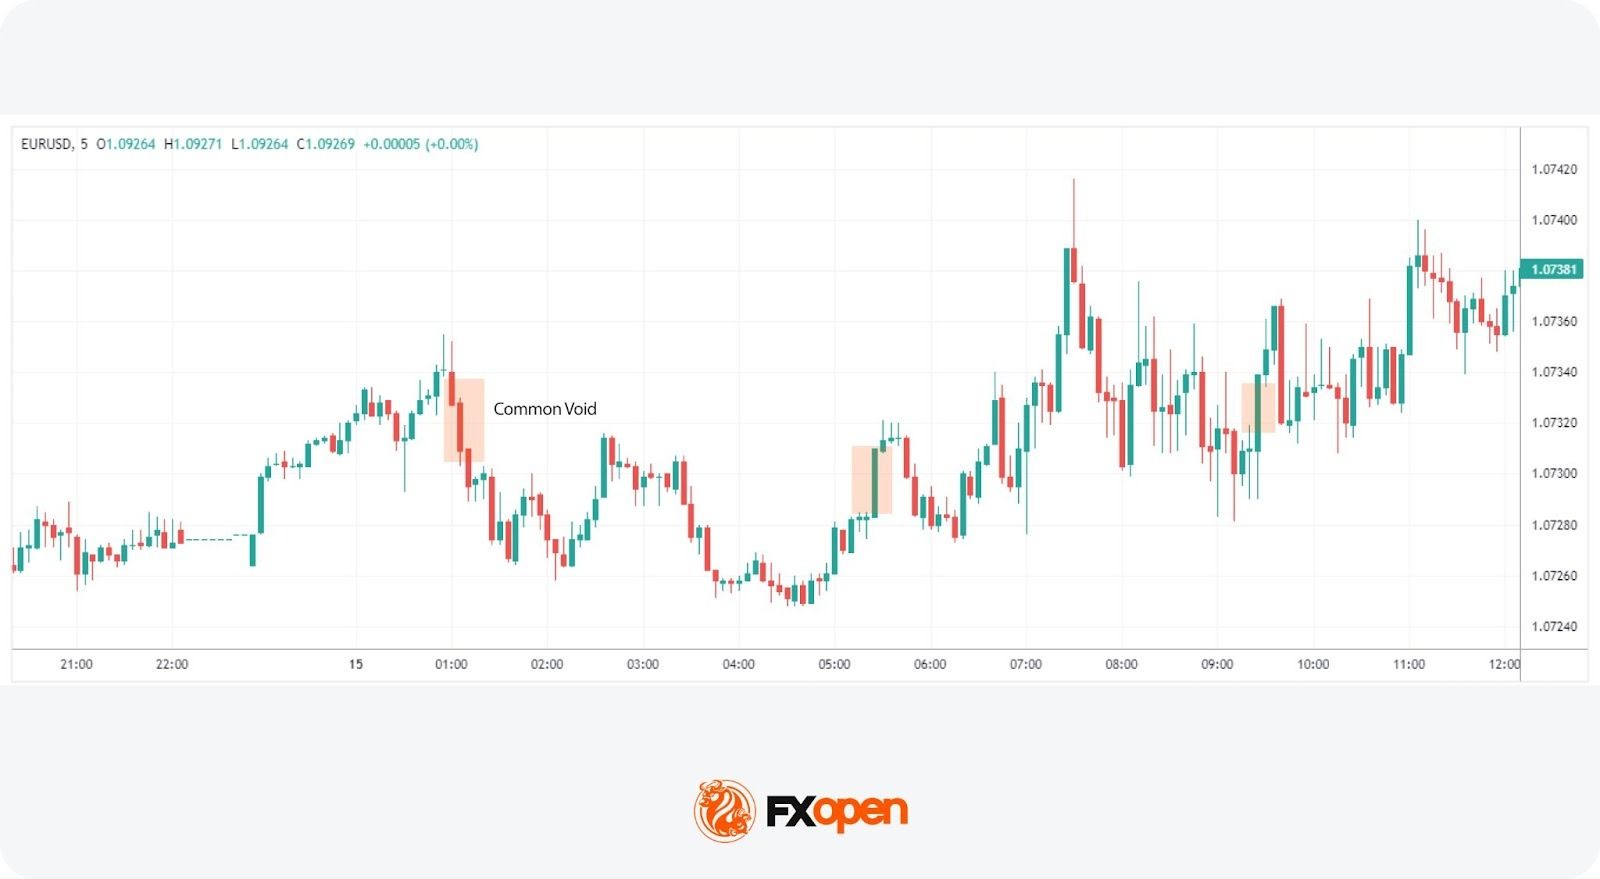
Common voids appear randomly across charts without any news or event trigger, forming from natural market ebb and flow. They don’t always carry significant analytical value but are still worth monitoring for risk management purposes.
Exhaustion Liquidity Voids
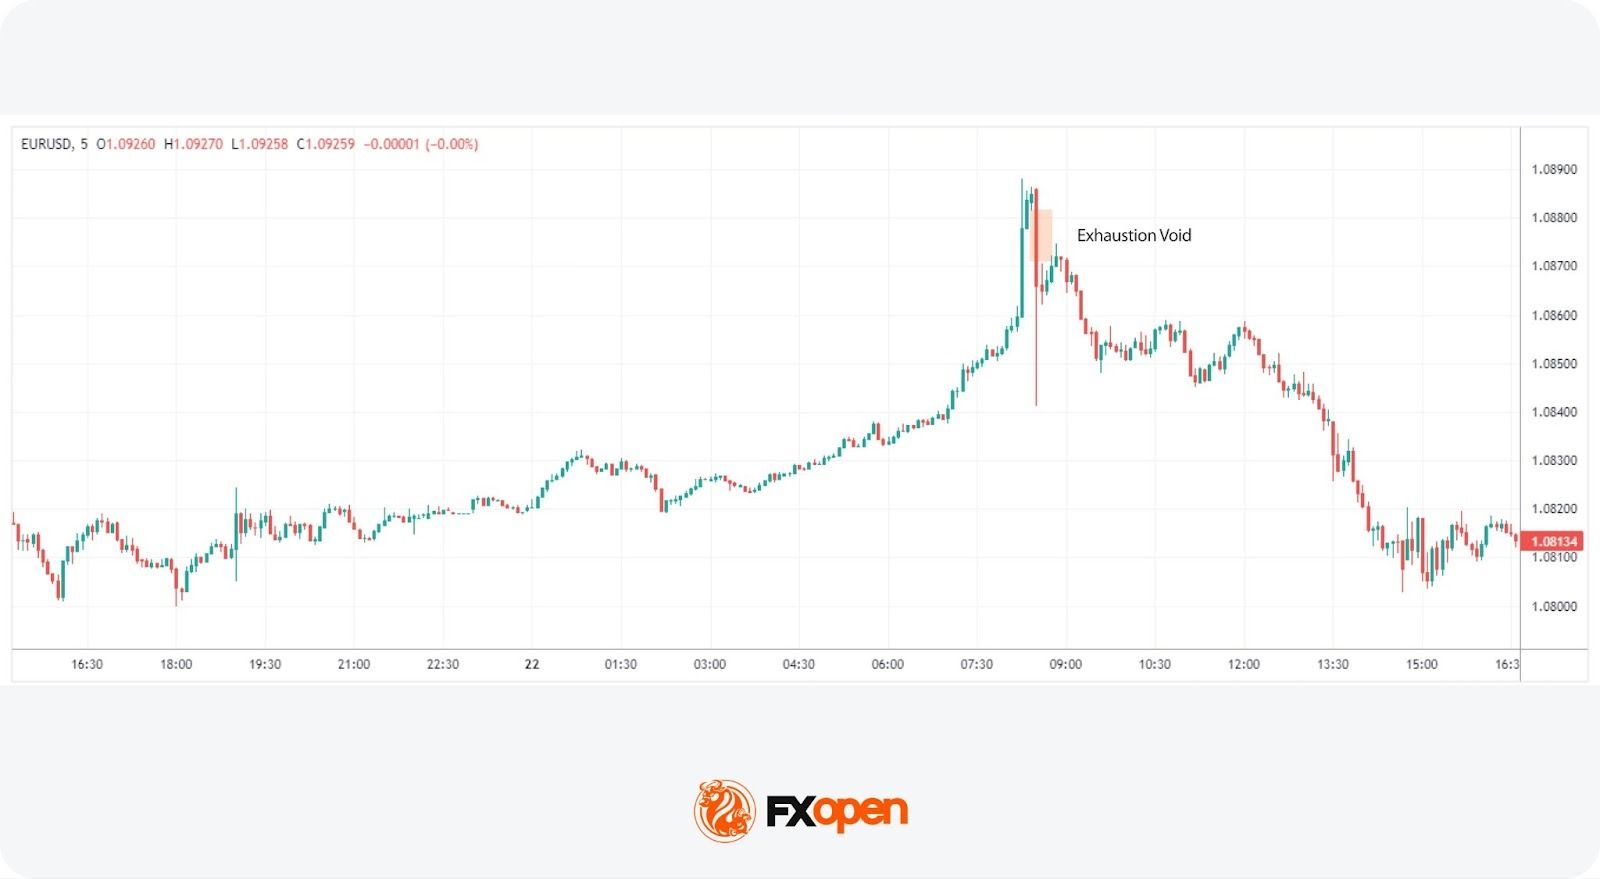
Exhaustion liquidity voids appear at the end of a trend when momentum fades and price makes a final push before reversing. Traders often watch for them as potential signals of a trend reversal.
Breakout Liquidity Voids
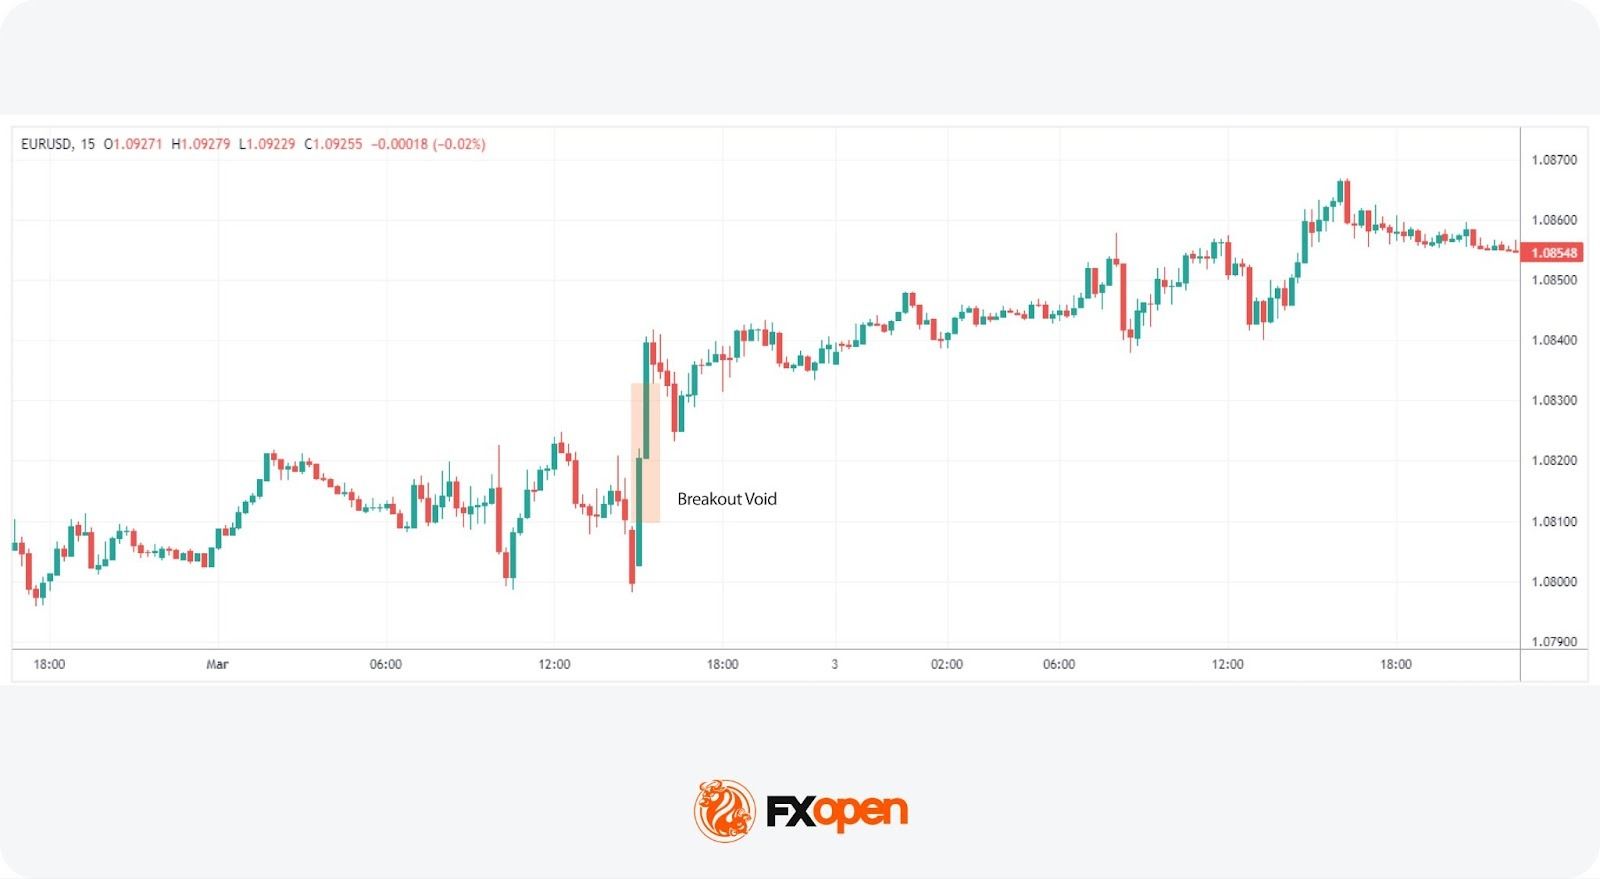
Breakout voids form when price breaks through a key support or resistance level with enough force to leave behind an imbalance. They often signal the beginning of a new trend.
Runaway Liquidity Voids
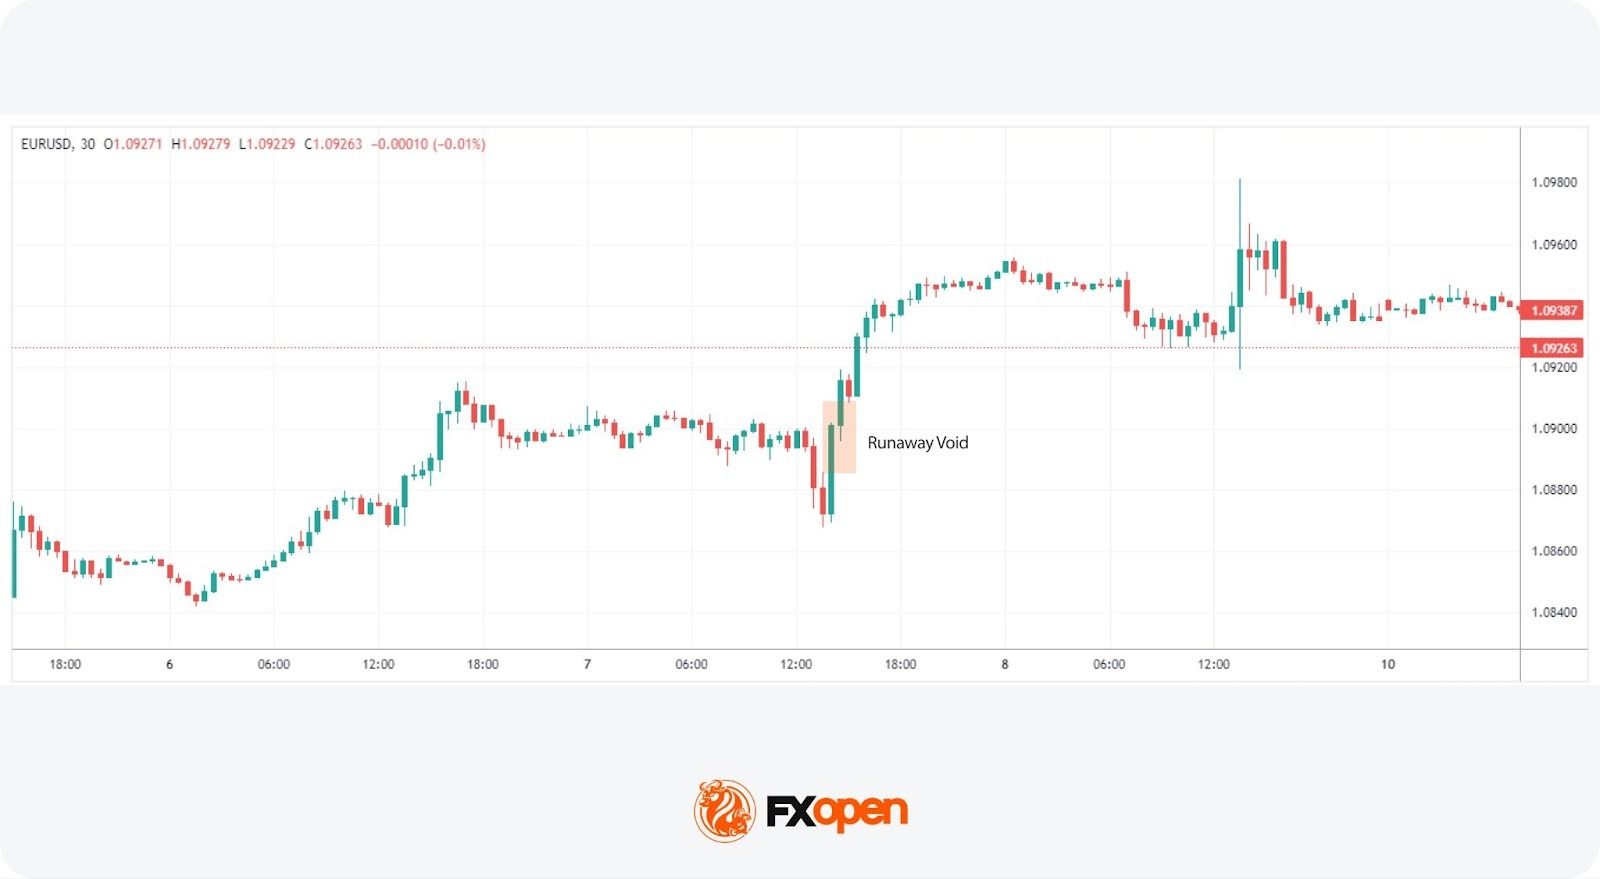
Runaway voids occur within an existing trend and signal its continuation. Price moves sharply in the trend’s direction, bypassing levels where liquidity would normally sit, which may support trend strength confirmation.
How Traders Use Liquidity Zones and Voids
Liquidity zones and voids form the basis of several common trading approaches. Here’s how traders typically work with them.
Step 1: Identify a Liquidity Zone
Traders start by locating areas where price has repeatedly reacted, such as support and resistance levels or high-volume nodes on a volume profile. These clusters of resting orders act as magnets for price.
Step 2: Wait for a Price Reaction
Rather than acting immediately, traders watch how price behaves when it reaches the zone. Does it stall? Reverse? Push straight through? The reaction tells the story.
Step 3: Look for Confirmation
A reaction alone isn’t enough. Traders look for confirmation through candlestick patterns (like pin bars or engulfing candles) or a shift in market structure, such as a break of a recent swing high or low.
Step 4: Target Nearby Liquidity or a Void
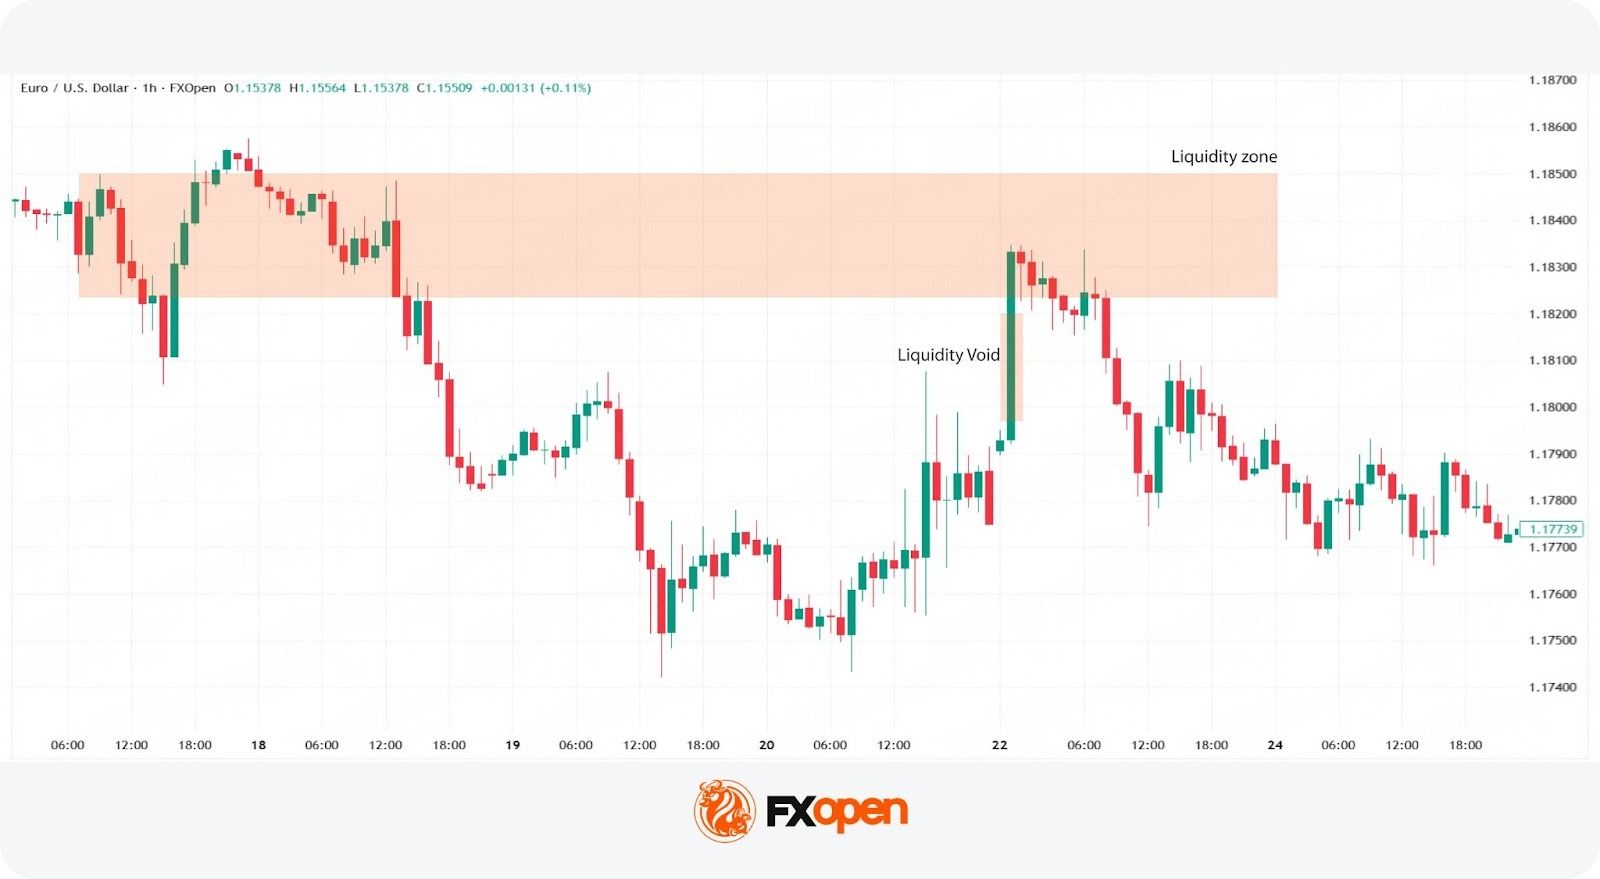
Once confirmed, traders typically set targets at the next liquidity zone or unfilled void. Voids act as areas price is likely to move toward, since they represent unfinished business on the chart.
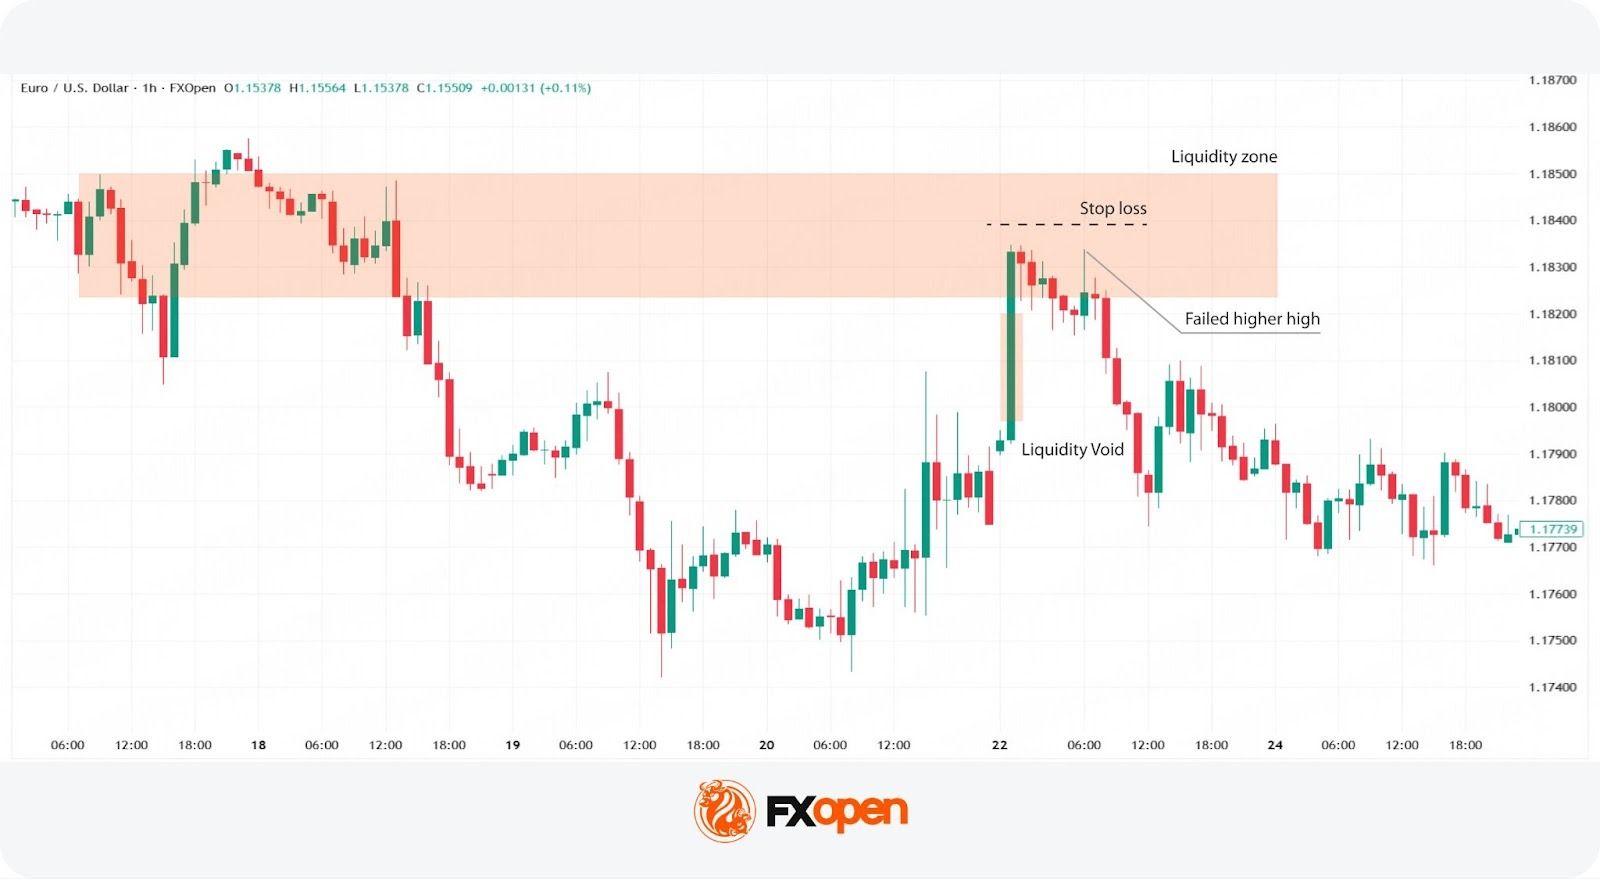
In this example, price moves into a liquidity zone, leaving a void behind it. Buyers attempt to push higher but fail, printing a long upper wick and signalling weakening momentum. Price then breaks below the established low and drops to fill the liquidity void left on the way up. A trader could have opened a sell position after the price broke below the low, set a stop-loss level above the nearest swing high, and closed the trade once the liquidity void was filled.
Limitations of Liquidity Zones and Voids
Understanding liquidity zones and voids provides traders with valuable insights into market dynamics, yet relying solely on these concepts comes with limitations. Here are some specific challenges to consider:
- Market Volatility: Market volatility can disrupt liquidity patterns, making historical levels less reliable.
- Influence of External Events: External events such as economic announcements can override expected behaviour.
- Timeframe Sensitivity: The relevance of zones and voids varies across timeframes, which may affect analysis.
- False Signals: These patterns can also produce false signals, leading to premature decisions.
The Bottom Line
Liquidity zones and voids may help explain how price moves within the forex market. They highlight areas of trading activity and imbalance, offering insight into potential price behaviour.
However, traders use them alongside other tools due to their limitations.
For traders seeking to apply these insights, opening an FXOpen account could provide a practical platform to explore and leverage the dynamics of liquidity in their trading across hundreds of tradable assets.
FAQs
What Are Liquidity Zones?
Liquidity zones are areas on a chart where buy and sell orders are concentrated, often acting as support or resistance. Traders monitor these levels to identify potential entry and exit points.
How Are Liquidity Zones Identified in Trading?
Liquidity zones are identified using tools such as volume profile, price consolidation, and historical support and resistance. These methods highlight areas where trading activity is concentrated.
How May Liquidity Zones Be Traded?
Liquidity zones are commonly used to identify potential entry and exit points. Traders monitor price reactions at these levels and may combine them with other tools to refine trading decisions.
What Are Liquidity Voids?
Liquidity voids are areas where price moves quickly due to low trading activity, creating an imbalance. Price often returns to these areas to “fill” the gap and restore market balance.
This article represents the opinion of the Companies operating under the FXOpen brand only. It is not to be construed as an offer, solicitation, or recommendation with respect to products and services provided by the Companies operating under the FXOpen brand, nor is it to be considered financial advice.

Castlery just spent 7 figures to open its first US store

Banks BLOCKING Withdrawals? | Financial CRISIS Begin
Star of 92% rated series explains why it’s what ‘the world needs right now’


-
 Crypto World4 days ago
NIO (NIO) Stock Plunges 6.5% as Shelf Registration Sparks Dilution Worries
-

 Fashion5 days ago
Weekend Open Thread: Adidas – Corporette.com
-

 Politics5 days ago
Jenni Murray, Long-Serving Woman’s Hour Presenter, Dies Aged 75
-

 Crypto World3 days ago
Best Crypto to Buy Now: Strategy Just Spent $1.57 Billion on Bitcoin During Fear While Early Investors Quietly Enter Pepeto for 150x Potential
-

 News Videos7 days ago
RBA board divided on rate cut, unusually buoyant share market | Finance Report | ABC NEWS
-

 Crypto World3 days ago
Bitcoin Price News: Bhutan Sells $72 Million in BTC Under Fiscal Pressure, but the Smart Money Entering Pepeto Sees What the Market Does Not
-

 Politics7 days ago
The House | The new register to protect children from their abusers shows Parliament at its best
-

 Tech5 days ago
inKONBINI Lets You Spend Summer Days Behind the Register
-

 Crypto World7 days ago
Canada’s FINTRAC revokes registrations of 23 crypto MSBs in AML crackdown
-

 Sports2 days ago
Remo Stars and Kano Pillars Strengthen Survival Hopes in NPFL
-
 NewsBeat6 days ago
Residents in North Lanarkshire reminded to register to vote in Scottish Parliament Election
-

 News Videos7 days ago
PARLIAMENT OF MALAWI – PAC MEETING WITH REGISTRAR OF FINANCIAL ON AMARYLLIS HOTEL – INQUIRY LIVE
-

 Politics6 days ago
Gender equality discussions at UN face pushbacks and US resistance
-

 Business3 days ago
No Winner in March 21 Drawing as Prize Rolls to $133 Million for Next
-

 Business7 days ago
Who Was Alex Pretti? 5 Key Facts About the ICU Nurse Killed by Federal Agents in Minneapolis
-

 Sports2 days ago
Gary Kirsten Accuses Pakistan Cricket Board Of ‘Interference’, Mohsin Naqvi Responds
-

 Tech2 days ago
Give Your Phone a Huge (and Free) Upgrade by Switching to Another Keyboard
-

 Tech7 days ago
Inventec’s bizarre VeilBook laptop hides its touchpad under a sliding keyboard just to give cooling fans a little breathing room
-

 Sports5 days ago
2026 Kentucky Derby horses, odds, futures, preview, date: Expert who nailed 12 Derby-Oaks Doubles enters picks
-
Sports6 days ago
Vikings Free Agency Enters Phase 2 with Key Questions
You must be logged in to post a comment Login