
Crypto World
U.S. Senate Clash Over Crypto Policy
Key Insights
- Warren questions SEC case dismissals, warning politics may be shaping crypto enforcement and investor protection.
- SEC Chair Atkins defends a shift away from lawsuits, prioritizing fraud prevention and clearer regulatory guidance.
- Senate clash highlights divide: clearer crypto laws vs stricter enforcement to protect markets and innovation.
Senate Hearing Turn Into a Crypto Flashpoint
A heated Capitol Hill hearing on February 12 thrust US crypto regulation into the spotlight as Senator Elizabeth Warren challenged Securities and Exchange Commission (SEC) Chair Paul Atkins over the agency’s recent enforcement decisions.
🚨 WARREN CALLS OUT TRUMP’S SEC OVER CRYPTO DONORS!
Sen. Elizabeth Warren ( @ewarren ) grilled SEC Chair Paul Atkins ( @SECPaulSAtkins ) over dropped cases against major crypto firms tied to Donald Trump’s ( @realDonaldTrump ) inauguration.
New data shows sharp declines in SEC… https://t.co/MAZx9QxpnA pic.twitter.com/PIbQvlzl4y
— BSCN (@BSCNews) February 13, 2026
Warren directly questioned why several investigations into major crypto firms were dropped, particularly those connected to companies that financially supported Donald Trump’s inauguration. She argued the timing raised serious concerns about political influence and investor protection.
Atkins rejected the allegations, saying the SEC is moving away from “regulation by enforcement” and back toward its core mandate: preventing fraud, protecting investors, and maintaining fair markets. He insisted previous leadership relied too heavily on lawsuits instead of clear guidance.
Is SEC Enforcement Really Declining?
Warren cited public statistics suggesting enforcement has slowed:
- Securities offering cases fell 10.64% from 2024 to 2025
- Investment adviser actions dropped 23.71%
- Broker-dealer cases declined 29.51%
Independent research also reported fewer settlements in fiscal 2025. However, Atkins countered that final annual data has not yet been released and argued the agency is prioritizing fraud over technical registration violations.
Supporters say the shift corrects regulatory overreach seen under former Chair Gary Gensler. Critics warn fewer actions could weaken accountability in the digital asset market.
Registration Violations or Innovation Barriers?
Central to the debate is whether unregistered token offerings automatically constitute misconduct. Crypto companies have long argued unclear securities definitions made compliance difficult.
Atkins supports legislation similar to the Digital Asset Market Clarity Act, which would divide oversight between the SEC and the Commodity Futures Trading Commission. He compared the past environment to innovators stuck between two competing regulators.
Warren disagreed, warning reduced oversight could usher in a “golden age of fraud.”
Could Politics Be Influencing Crypto Policy?
Warren highlighted dismissed cases involving major exchanges including Kraken, Coinbase, Gemini, and Binance, noting their financial ties to inauguration events. She also questioned dropped actions tied to executives who later received presidential clemency.
Atkins maintained pardons do not erase civil liability and emphasized that fraud investigations continue regardless of industry.
Conclusion
The battle discloses a larger policy divide: is a more explicit legislation more crucial in fostering innovativeness or is weaker enforcement more likely to hurt investors. The future of the United States regulation of digital assets may be determined by the final effect of Congress discussing crypto-market-structure legislation.

South Korea-based cryptocurrency exchange Bithumb has again postponed its planned initial public offering, with insiders signaling a listing would come only after 2028. The company previously eyed a 2025- or 2027-targeted listing, but renewed restructuring and ongoing regulatory hurdles have pushed the timeline further, according to Maeil Business News Korea.
A Bithumb official told Maeil Business News Korea that the firm would focus on preparing for the listing until 2027, while strengthening accounting policies and internal controls following an IPO advisory contract with Samjong KPMG. The company’s chief financial officer, Jeong Sang-gyun, framed the moves as part of a broader readiness program ahead of public listing.
Shareholders also reaffirmed CEO Lee Jae-won for a two-year term at the annual meeting, extending leadership continuity. Under Lee’s tenure, Bithumb has faced regulatory scrutiny, including a six-month suspension and a $24 million fine from South Korean authorities for alleged anti-money-laundering violations.
A broader context for Bithumb’s IPO plans is the evolving Korean listing landscape. Upbit operator Dunamu is reportedly planning an IPO after a share swap with Naver Financial, with September cited as the timetable by local outlets. The prospect of a major local exchange going public could influence investor appetite and domestic crypto adoption.
In February, Bithumb drew headlines for a technical blunder that credited users with about 2,000 BTC instead of 2,000 won. The incident briefly generated illusory balances in the exchange ledger totaling more than $40 billion, though most of the funds existed only on paper and were subsequently reversed.
Key takeaways
- Bithumb’s IPO timeline is pushed beyond 2028, with a continued focus on readiness through 2027.
- CEO Lee Jae-won is kept in place, providing leadership continuity amid restructuring and regulatory scrutiny.
- Governance enhancements are underway, including a strengthened role for accounting policies and internal controls via Samjong KPMG.
- South Korea’s regulatory and policy environment remains in flux, with crypto-tax discussions and stablecoin legislation shaping IPO prospects.
- Past operational missteps underscore the ongoing need for strong risk management in a country with a rapidly evolving crypto market.
Bithumb’s delayed IPO: what it signals about Korea’s crypto IPO landscape
According to Maeil Business News Korea, Bithumb’s updated timeline centers on preparations through 2027, with an IPO no sooner than after 2028. The company’s leadership has emphasized governance upgrades as a prerequisite for listing, aligning with expectations from investors for stronger disclosures and controls. The report also notes the presence of an IPO advisory contract with Samjong KPMG, underscoring a formal governance posture as the firm eyes a future public market debut. Maeil Business News Korea
Beyond internal reforms, Bithumb’s path must contend with a broader domestic IPO scene. Dunamu, the operator of Upbit, is said to be pursuing an IPO after a share swap with Naver Financial, with local press pointing to a September window. If a large exchange-minted listing materializes in Korea, the market could reassess liquidity and the competitive dynamics among domestic platforms. Seoul Economic Daily coverage has circulated the timeline, though other outlets have noted the regulatory and market hurdles that may complicate the schedule.
Regulatory climate in Korea: implications for listings and adoption
The policy environment in South Korea continues to evolve alongside the crypto sector. President Lee Jae-myung, who took office in mid-2025, has backed early proposals on payment stablecoins, signaling a readiness to integrate digital assets into the financial system. At the same time, lawmakers have wrestled with crypto-tax plans that were first floated years ago but have faced repeated delays and, in some accounts, may be scrapped entirely as of March this year. As the government calibrates its stance, the fate of a large public filing by a domestic exchange remains tethered to regulatory clarity and the cost of compliance for incumbents. As of March 2025, estimates put the number of South Koreans with crypto exchange accounts at around 16 million, illustrating the market’s scale even as policy debate continues. Cointelegraph also highlighted the broader policy conversation tied to the sector.
Operational risk and the path to a compliant IPO
Bithumb’s governance upgrades take on heightened significance in light of prior enforcement actions. The exchange faced a six-month suspension and a $24 million fine from South Korean authorities over alleged anti-money-laundering issues, a reminder that any future public listing would demand rigorous compliance and transparent controls. The ongoing emphasis on strengthening internal policies, as described by CFO Jeong Sang-gyun and corroborated by reporting on the IPO advisory arrangement, points to a broader industry-wide shift toward governance-readiness before capital market access. Cointelegraph coverage
Looking ahead, investors and builders will be watching whether Korea’s exchanges can harmonize rapid user growth with robust risk management and regulatory alignment. The coming quarters will reveal if Bithumb’s patient approach to listing—paired with stronger governance—can unlock a credible path to a public market presence in a country where crypto adoption remains high but policy remains unsettled. Cointelegraph: February BTC-credit incident
Readers should watch how Bithumb reframes its governance blueprint, how Korea’s policy stance crystallizes around crypto taxation and stablecoins, and whether the broader IPO wave among domestically run exchanges gains or loses momentum as regulators weigh the costs and benefits of public listings in the crypto era.

The U.S. Treasury on Wednesday issued a notice of proposed rulemaking seeking public comment on state-level stablecoin governance under the GENIUS Act. The proposal clarifies how states may regulate stablecoins with a market cap under $10 billion, provided their regulations remain aligned with federal policy and standards.
The GENIUS framework—short for the Guiding and Establishing National Innovation for US Stablecoins Act—enables states to oversee smaller stablecoins, while ensuring that core protections stay in sync with federal rules. The Treasury NPRM outlines non-negotiable guardrails that issuers must meet, including a stringent reserve model, ongoing reporting, and strict compliance with federal anti-money laundering and sanctions policies.
Key takeaways
- The Treasury’s NPRM invites public comment on implementing GENIUS Act state-level governance for stablecoins under $10 billion in market cap, with alignment to federal standards.
- Core protections are codified: 1:1 reserve backing with cash or high-quality cash equivalents, plus monthly reporting requirements; full AML and sanctions compliance; and a ban on rehypothecation of reserves.
- States may impose their own liquidity, reserve, risk management, and enforcement rules, but only if they are equal to or more restrictive than federal standards and raise financial thresholds when appropriate.
- Comment period is open for 60 days; once a stablecoin issuer exceeds $10 billion in market cap, federal jurisdiction applies automatically to the largest issuers.
- The broader regulatory conversation continues to grapple with yield-bearing stablecoins and the viability of sharing interest with holders, a debate rich with tensions between innovation and incumbent financial interests.
Regulatory architecture clarified by the NPRM
The Treasury’s notice articulates a clear floor of protections that stablecoin issuers under state purview must observe. The proposed framework requires reserves to back each token on a 1:1 basis with cash or high-quality cash equivalents, paired with monthly reporting to maintain transparency and accountability. In addition, issuers must operate in full compliance with federal anti-money laundering and sanctions regimes, and the proposal explicitly prohibits rehypothecation, the practice of using the same reserve asset to back multiple claims.
Crucially, the NPRM emphasizes that state-level regimes should produce regulatory outcomes that are at least as stringent as the federal framework. This principle is designed to prevent a patchwork of weaker state rules that could undermine consumer protections or introduce systemic risk across the sector. The Treasury text also signals that states are free to implement stricter liquidity or risk-management procedures if they exceed federal requirements, provided those measures maintain a conservative, shielded stance toward stability and resilience.
For market participants, the NPRM sets the stage for a more modular regulatory landscape. Smaller issuers—those below the $10 billion threshold—could be governed by state-level regimes that mirror federal guardrails, while larger players would inevitably fall under federal oversight. The proposal reiterates that public comments are welcome for 60 days, signaling a proactive, consultative phase before any formal rule adoption.
State versus federal oversight and implications for issuers
Under the GENIUS Act, state authorities may regulate stablecoins that carry a market cap of less than $10 billion, so long as the rules do not deviate meaningfully from federal policy. This design aims to strike a balance between encouraging innovation at the state level and preserving a coherent national standard for token stability, disclosure, and consumer protection.
The NPRM also outlines a practical brake on the largest issuers. When an issuer surpasses the $10 billion threshold, federal jurisdiction takes precedence, meaning the biggest players would be regulated exclusively at the federal level. This arrangement acknowledges the systemic importance of the top stablecoins and aligns with broader efforts to harmonize oversight across federal and state lines.
The GENIUS Act itself has already seen significant political attention. The act became law after President Donald Trump signed it in July, marking a notable moment in U.S. crypto regulation. This backdrop helps explain why the Treasury’s NPRM emphasizes alignment with federal policies while granting states a time-limited runway to craft tailored approaches for smaller issuers. For readers following regulatory history, the law’s signing signaled an intent to formalize stablecoin governance rather than rely on scattered, disparate state actions.
Industry debate: yields, savings and regulatory tensions
Beyond the mechanics of reserve-backed tokens, the GENIUS framework intersects with a broader policy debate about yield-bearing stablecoins. Some industry participants, including Coinbase among others, contend that stablecoins capable of earning interest could offer savers a competitive alternative to traditional savings accounts, which have historically yielded well under 1 percent in many markets. This view has positioned yield-bearing stablecoins as a potential bridge between crypto markets and mainstream savings utilities.
Still, yield-bearing structures have drawn pushback from the traditional banking lobby, which argues that enabling token holders to share in yields could siphon deposits away from traditional banking, potentially threatening financial stability for incumbents. The regulatory conversation reflects this tension: on one side, proponents view yield-bearing stablecoins as a step toward more consumer-centric financial innovation; on the other, opponents warn about destabilizing effects on conventional funding models.
Adding to the regulatory backdrop, the Financial Stability Board has previously warned about the risks posed by dollar-pegged stablecoins, particularly in emerging markets where policy transmission is more fragile. Those concerns frame a policy environment that seeks to deter a repeat of systemic stress while still supporting innovation in payments and settlement. The broader debate remains unsettled in Congress, where the CLARITY market-structure bill has stalled, complicating efforts to codify how stablecoins interact with traditional banking rails and market infrastructure.
As the rulemaking unfolds, industry participants will be watching how aggressively states implement the NPRM’s guardrails and whether federal regulators move more quickly to scale the top stablecoins into a federally comprehensive regime. The balance between openness to innovation and rigorous risk controls will shape not only token issuers but also users seeking safer, more transparent access to digital assets.
What to watch next
Public comments on the Treasury’s NPRM must be submitted within 60 days, marking the start of a multi-stage rulemaking process. Investors and builders should monitor how state regulators translate the general principles into concrete requirements, and whether any state-level regimes carve out distinct treatment for particular subcategories of stablecoins. The dynamic between state flexibility and federal uniformity will likely influence the pace at which stablecoins with smaller market caps gain practical legitimacy, while the largest issuers navigate a centralized federal framework.
For broader context, keep an eye on ongoing regulatory discussions around yield-bearing stablecoins and the fate of related U.S. legislation, such as the CLARITY bill, which currently remains stalled in Congress. The evolving regulatory narrative—spanning state innovation, federal cohesion, and the risk-versus-reward calculus for yield-bearing structures—will shape how users, traders, and issuers approach stablecoins in the months ahead.

TLDR
- BlackRock assigned the ticker $BITA to its proposed iShares Bitcoin Premium Income ETF.
- The company filed an amended S-1 registration statement for the new Bitcoin fund.
- The ETF will combine spot Bitcoin exposure with a covered call options strategy.
- Eric Balchunas said BlackRock has not set a management fee and estimated 38 basis points.
- The fund plans to hold Bitcoin-linked assets, including shares of IBIT.
BlackRock has advanced its Bitcoin product range by assigning the ticker $BITA to a new income-focused ETF. Bloomberg ETF analyst Eric Balchunas confirmed the update on X and referenced an amended S-1 filing. The product will combine spot Bitcoin exposure with an options overlay strategy.
BlackRock Advances Bitcoin Premium Income Structure
BlackRock plans to list the fund as the iShares Bitcoin Premium Income ETF under the ticker $BITA. Eric Balchunas stated on X that the firm filed an amended S-1 registration statement. He described the fund as a sequel to the company’s existing Bitcoin ETF lineup.
He added that BlackRock has not set a management fee for the product. However, he placed his “over/under” estimate at 38 basis points. The company has not announced an official launch date.
The proposed ETF will hold Bitcoin-linked assets, including shares of the iShares Bitcoin Trust. The trust trades under the ticker IBIT and provides spot Bitcoin exposure. The new strategy will also write covered call options on those holdings to generate premium income.
According to prior SEC filings, the structure aims to deliver income while tracking Bitcoin’s price performance. The fund will reflect Bitcoin returns net of expenses. BlackRock designed the ETF to expand beyond passive exposure into yield-based strategies.
The filing shows that the fund will combine direct exposure with an income-generating overlay. The approach mirrors covered call equity ETFs that seek steady option premiums. BlackRock continues to broaden its institutional crypto offerings through structured products.
Morgan Stanley Moves Forward With MSBT Listing
Morgan Stanley has progressed with its own spot Bitcoin ETF under the proposed ticker MSBT. The New York Stock Exchange issued a listing notice earlier this year. If approved, MSBT would mark the first spot Bitcoin ETF issued by a major U.S. bank.
The trust will hold Bitcoin in custody and allow brokerage clients to access spot exposure. Coinbase Custody will safeguard the Bitcoin in cold storage. BNY Mellon will manage administration, transfer agency services, and cash operations.
Filings revealed that MSBT will carry a 0.14% annual expense ratio. That fee undercuts BlackRock’s iShares Bitcoin Trust, which charges about 0.25%. The competitive pricing may support distribution within Morgan Stanley’s wealth platform.
Morgan Stanley oversees trillions in client assets across its advisory network. The firm plans to seed the ETF with about 50,000 shares valued at about $1million. The structure aligns with existing U.S. spot Bitcoin ETFs.
Recent data shows that U.S. spot Bitcoin ETFs have attracted tens of billions in inflows since launch. Asset managers continue to compete on fees and product design. Regulators have not yet announced final approval dates for either $BITA or MSBT.

TLDR
- Bitcoin price rose 3% in 24 hours and moved back above $68,000.
- The 365-day average profitability remains high at 87.5%, showing no full market reset.
- Analysts said past bear markets saw the long-term average drop near 63.8% before recovery.
- Current data shows 66.4% of the Bitcoin supply remains in profit despite recent declines.
- Bitcoin continues to trade above the $54,000 Realized Price level.
Bitcoin (BTC) price opened in April above $68,000 after a 3% daily gain, yet the broader trend remains downward. On-chain data shows long-term profitability remains elevated despite recent declines. Analysts state the market has not completed the deep reset seen in prior bear cycles.
Bitcoin Price Holds Above $68,000 as Long-Term Profitability Stays Elevated
Bitcoin price climbed 3% in 24 hours and traded above $68,000 at press time. However, price action still reflects a prevailing downtrend across higher time frames. Short-term rebounds continue, yet broader market pressure persists.
CryptoQuant analyst Axel Adler Jr. said profitability metrics have not reached prior bear market lows. He stated that 66.4% of the Bitcoin supply remains in profit as of April 1, 2026. Meanwhile, the 30-day moving average stands at 69.1%, which reflects reduced short-term gains.
Adler highlighted the 365-day moving average, which remains elevated at 87.5%. He said previous cycles saw this metric fall sharply before full recovery phases began. In late 2017, the indicator reached 96% before dropping to 63.8% by May 2019.
He explained that this earlier decline confirmed a complete market reset. In contrast, the current 365-day average has not approached those historical lows. Therefore, long-term holders still retain strong profitability levels despite ongoing drawdowns.
Historical Reset Levels and Realized Price at $54,000 Remain Key Reference Points
Adler compared the current downturn with corrections in September 2023 and September 2024. He said those pullbacks weakened short-term profitability but left long-term averages intact. The 2026 decline pushed the metric down to 55.7%, while the 30-day average fell to 66.7%.
Despite deeper losses this year, the 365-day average remains near 87.5%. Adler stated, “As long as the 365DMA stays elevated, the market resembles an extended correction.” He added that a full capitulation phase would require a sharper long-term profitability drop.
Separately, analyst Ardi reviewed Bitcoin’s seasonal performance trends since 2014. He reported that April ranks as the third-strongest month historically, with a 9.1% average return. However, he said market context matters because 2026 reflects bear market conditions.
Ardi cited April 2014, when Bitcoin declined 2%, and April 2022, when it fell 18.7%. He also referenced April 2018, which delivered a 35.7% rebound within a broader downturn. According to him, strong monthly averages do not override prevailing trends.
CryptoQuant analyst Tugce focused on Bitcoin’s Realized Price, currently near $54,000. She said Bitcoin historically falls below this level before forming major cycle bottoms. Tugce stated, “The $54,000 area represents a key historical threshold during bear phases.”
She added that price could trade below the Realized Price for an extended period. Historical data shows previous bear markets reached that stage before recovery began. Bitcoin continues to trade well above $54,000 as of the latest market update.
Crypto World
Bitcoin Price Prediction Heats Up as Nakamoto Inc Sells $20M in BTC and Pepeto Eyes 100x Before Listing
Nakamoto Inc, the bitcoin treasury firm chaired by entrepreneur David Bailey, quietly sold 284 BTC for $20 million during March at an average price of $70,422 per coin, a price Bitcoin has not touched since, while Strategy continues targeting one million BTC by year end with holdings now at 762,099 coins according to 99Bitcoins. The contrast between one treasury selling and another aggressively buying tells you everything about where conviction sits in this market.
Pepeto has pulled in more than $8.69 million during this exact fear window, locking early holders into a fixed entry before the approaching Binance listing shifts the price permanently, and this bitcoin price prediction breakdown shows where committed capital is flowing while the crowd waits.
Bitcoin Price Prediction Shifts as Strategy Targets 1 Million BTC While Nakamoto Inc Takes Profits
Strategy now controls 762,099 BTC and is targeting one million coins by the end of 2026, funded through $1.2 billion in perpetual preferred shares called STRC that hit $300 million in single-day trading volume according to FinanceFeeds.
Exchange reserves dropped to a six year low of 2.31 million BTC per BeInCrypto, and the Fear and Greed Index sits at 8, the lowest reading since October 2023, a level that has historically produced positive 14-day forward returns 78% of the time according to Blockchain Magazine.
The Fear and Greed Index in single digits is a reading that only appeared a handful of times before, and each time preceded recoveries that turned the bitcoin price prediction from bearish to explosive for holders who bought while everyone else was selling.
BTC Forecast Meets Presale Positioning in the Fear Zone
Pepeto Builds What Pepe Never Had and the Presale Proves It
Traders tracking the bitcoin price prediction are looking past surface level forecasts, they want an entry that places them before returns are already priced in. Pepeto is where that entry forms right now, created by the cofounder who built the original Pepe coin to an $11 billion peak with zero exchange tools.
The smart capital wants positioning before exchange listing removes the presale price permanently. Pepeto sits at $0.000000186 with a Binance listing approaching, and analysts project 100x to 300x from current levels, a gap that disappears the moment trading opens. More than $8.69 million raised during extreme fear confirms conviction money entering while the broader market hesitates, and every week that number climbs higher while the entry you are reading about right now gets one round closer to disappearing.

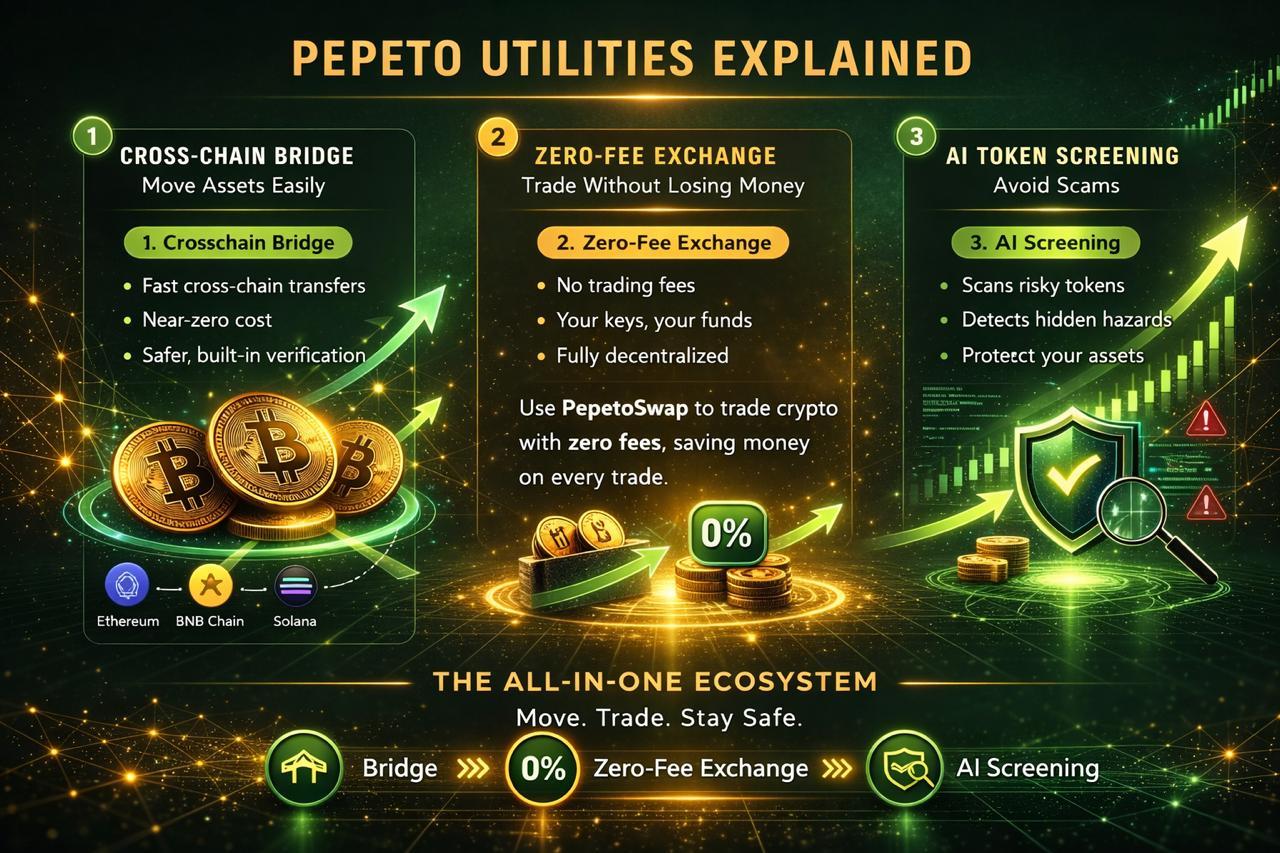
Pepeto stands apart because its exchange platform already runs and earns from every direction the market moves. PepetoSwap processes trades at zero cost so the position you build stays larger than it would on any platform taking a cut from both sides. The risk scorer checks every contract before you buy, so the money you move in stays protected while others learn the hard way which tokens were built to drain them.
Staking at 190% APY stacks a passive return while the listing approaches. Every day the presale stays open is one more day you could be inside earning, and the wallets entering now through Pepeto are building positions that listing day converts into returns everyone outside will wish they had secured when this price still existed.
Bitcoin Price Prediction Holds Near $68,839 as Exchange Supply Reaches Cycle Lows
Bitcoin trades near $68,839 according to CoinMarketCap after weeks of range-bound consolidation as geopolitical tensions keep capital in defensive positions.
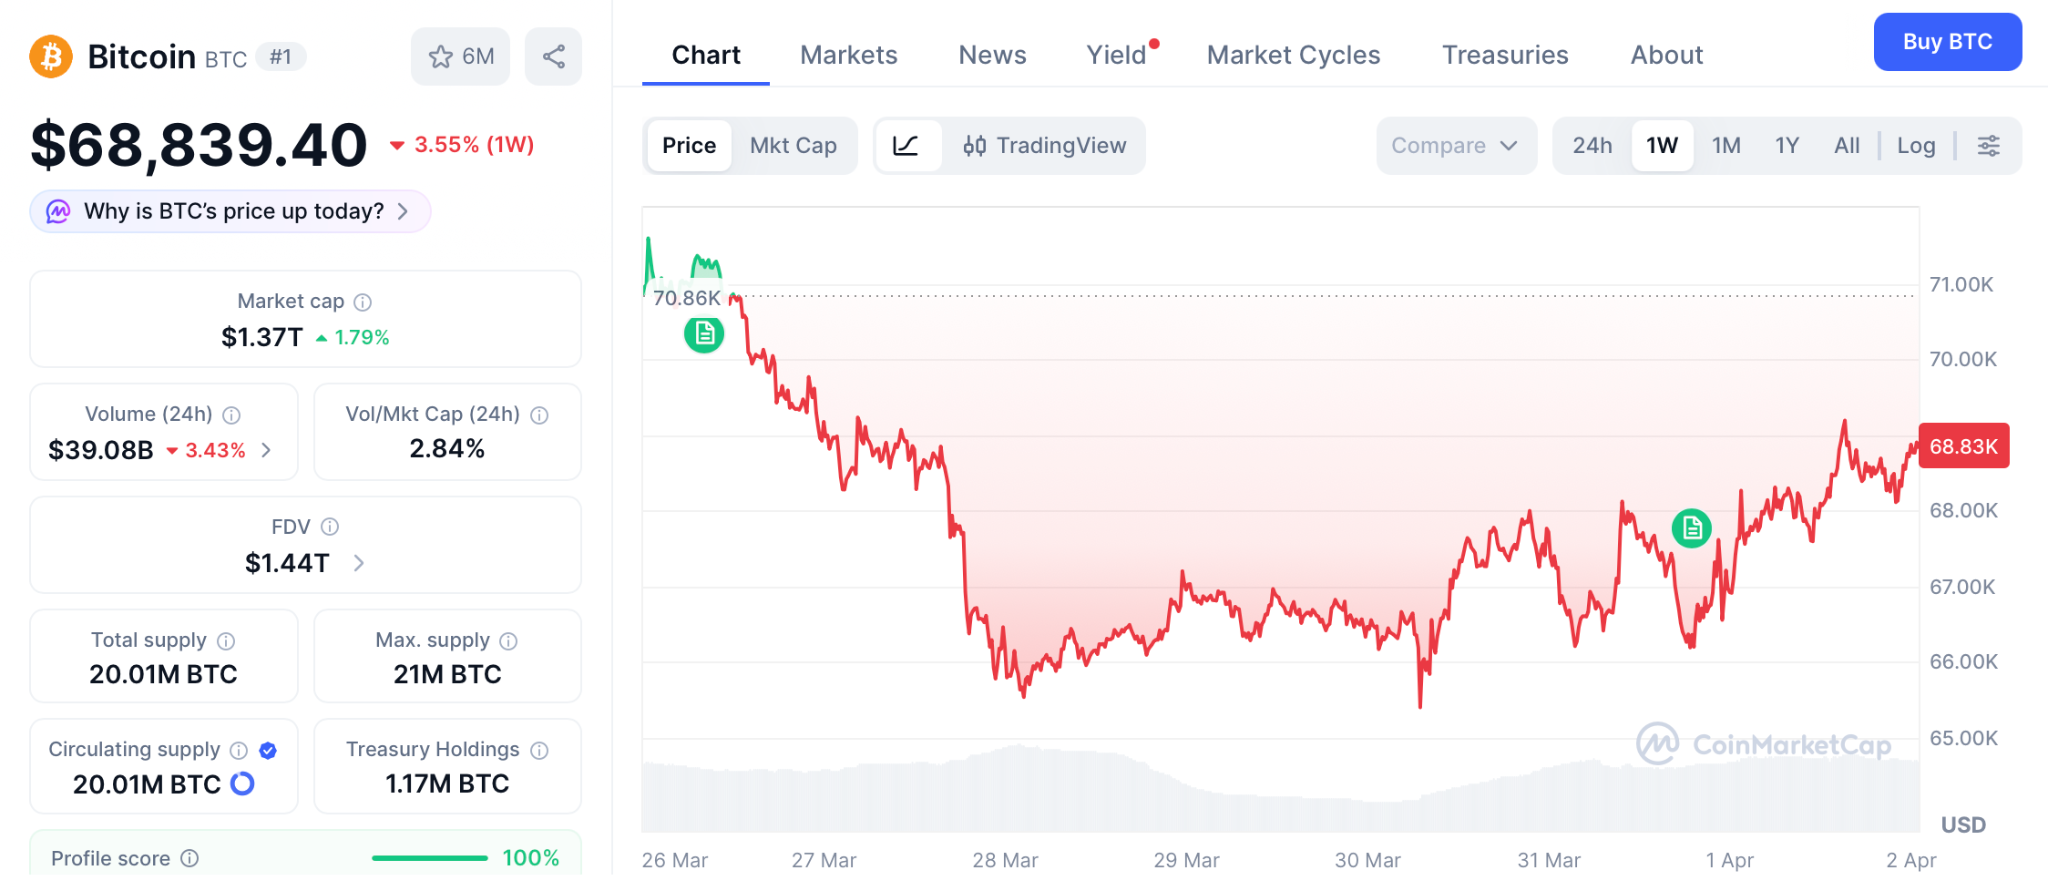
The 46% decline from October’s $126,210 all time high leaves BTC between $66,000 and $70,000, with Bernstein maintaining a $150,000 year end target citing Q1 ETF inflows of $18.7 billion per CoinDesk.
Strategy now controls 762,099 BTC according to filings, the highest corporate holding on record, while Nakamoto Inc’s $20M sale at $70,422 shows not all treasuries share the same conviction. The math from $68,839 to $150,000 delivers roughly 119% over months, real money but a fraction of what presale entries return when a confirmed listing sits weeks away.
Bitcoin Price Prediction and the Presale Window That Fear Built
The bitcoin price prediction reveals a market pinned between fear and institutional buying, with BTC showing real corporate backing despite short term weakness. These are tested assets with active capital behind them, but timing in crypto cycles decides everything. Early BTC holders turned a few hundred dollars into generational wealth, and all of them say they wish they had bought more when no one was paying attention.
That pattern is forming around Pepeto now, with more than $8.69 million locked by wallets that see the signal before the Binance listing removes the presale price permanently. The capital flowing through the Pepeto official website is choosing which side of the listing it lands on before the window shuts.
Click To Visit Pepeto Website To Enter The Presale

FAQs:
What Is the Latest Bitcoin Price Prediction for 2026?
Analysts target $150,000 by year end as Strategy accumulates 762,099 BTC during extreme fear, with BTC holding near $68,839 and Q1 ETF inflows reaching $18.7 billion.
Why Do Investors Compare BTC Forecasts With Presale Entries?
BTC’s projected move to $150,000 represents 119% gain over months, while presale entries before a confirmed listing deliver wider returns in a shorter window through the Pepeto official website.
Is Pepeto a Strong Entry During This Fear Cycle?
The bitcoin price prediction cycle rewards early positioning, and Pepeto with more than $8.69 million raised and a Binance listing approaching gives early holders a confirmed entry before the presale price disappears permanently.
Disclaimer: This is a Press Release provided by a third party who is responsible for the content. Please conduct your own research before taking any action based on the content.
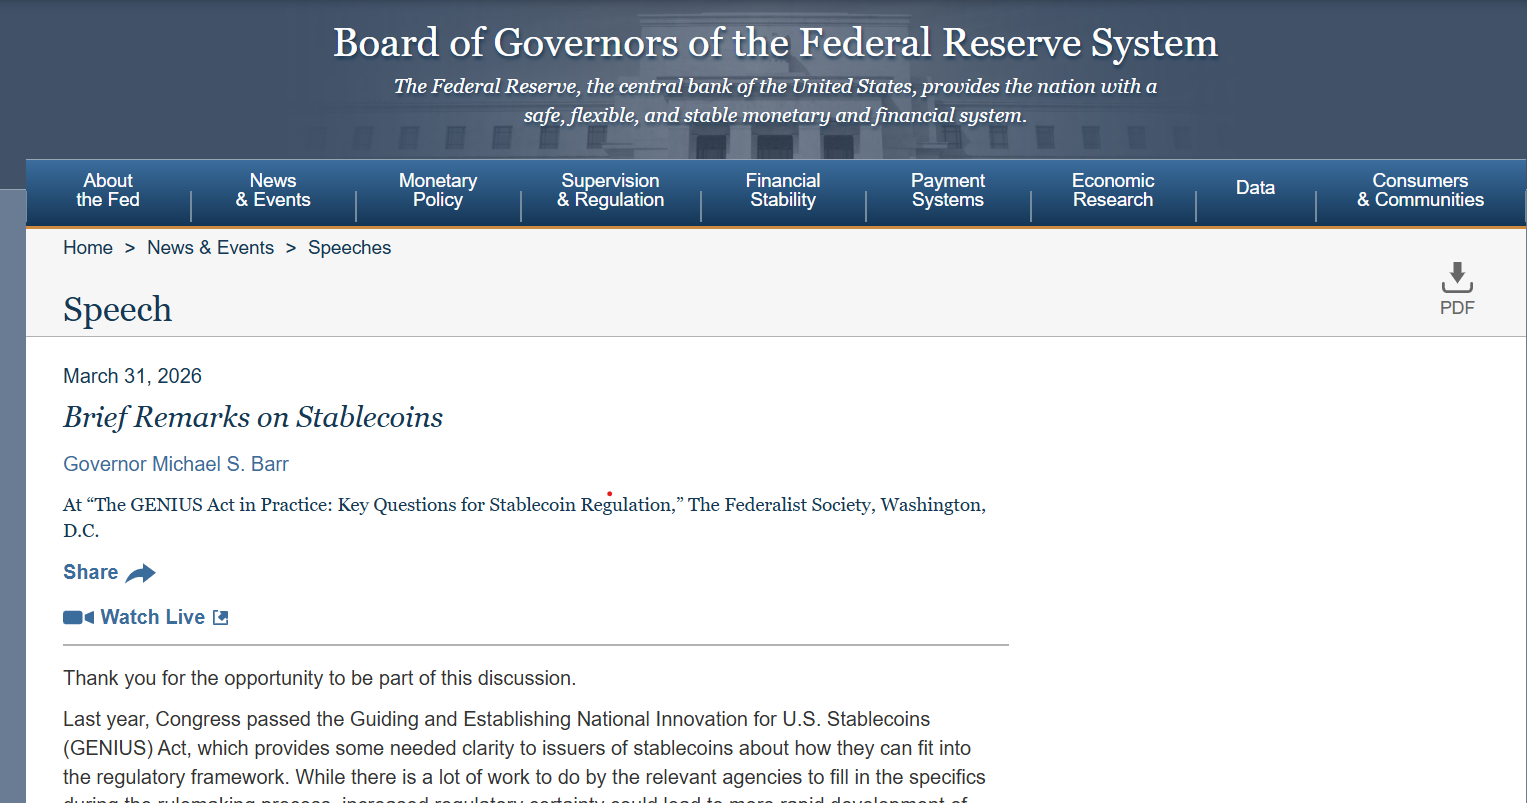
US Federal Reserve Governor Michael Barr said Tuesday that clearer US stablecoin rules could speed the market’s growth, but warned that regulators still need to address money laundering risks, bank run risks and consumer safeguards as they implement the Guiding and Establishing National Innovation for US Stablecoins (GENIUS) Act.
Speaking at a Federalist Society event on stablecoin regulation, Barr said the law provides “needed clarity” for issuers, but that “a great deal will depend on how federal and state regulators implement the statute.”
Barr said stablecoins are still used mainly for crypto trading and as a US dollar store of value in some foreign markets, though they could also lower remittance costs, speed up trade finance processing and help firms manage treasury operations. He also highlighted the risk of bad actors buying stablecoins in secondary markets without identity checks, and said issuers may be tempted to stretch for yield in reserve assets in ways that undermine confidence during stress.
Barr’s speech also cast the stablecoin debate in historical terms. He said private money has a “long and painful history” when safeguards are weak, pointing to the Free Banking Era in the US, the Panic of 1907, money market fund stress during the global financial crisis and COVID-19 shock, and more recent stablecoin valuation pressure as reasons to be cautious about any asset marketed as redeemable at par on demand.
Barr’s remarks come as US agencies move from legislation to rule-writing. The US Treasury Department opened a second round of public comment on implementing the GENIUS Act in September 2025, saying the law must be translated into rules that both encourage innovation and address illicit finance, consumer protections and financial stability risks.

Fed Vice Chair for Supervision Michelle Bowman told lawmakers in February that banking regulators were already working on capital and liquidity rules for stablecoin issuers, and Federal Deposit Insurance Corporation chair Travis Hill said in March that the agency does not expect stablecoins to receive deposit insurance under the law.
Related: Who gets the yield? CLARITY Act becomes fight over onchain dollars
Barr warns GENIUS Act rollout will test stablecoin safeguards
Barr’s speech signals where the implementation fights may land. He flagged reserve asset rules, regulatory arbitrage, the scope of issuer activities beyond issuance, capital and liquidity requirements, Anti-Money Laundering (AML) checks and consumer protection standards as the key issues still to be settled.
The GENIUS Act, signed into law on July 18, 2025, created a federal framework for payment stablecoins in the United States. The law requires issuers to maintain one-to-one backing with reserve assets such as US dollars and Treasury bills, and is expected to take effect 18 months after signing or 120 days after final agency rules are completed.
Magazine: How crypto laws changed in 2025 — and how they’ll change in 2026
Crypto World
tZERO and Stobox Sign MOU to Connect Tokenized Securities with Regulated Trading Markets
TLDR:
- tZERO and Stobox signed an MOU to connect tokenization infrastructure with regulated secondary market access.
- Stobox holds a VASP license in Europe and supports compliant exempt securities offerings across the United States.
- tZERO operates a regulated broker-dealer and ATS providing custody, trading, and settlement for digital asset securities.
- Both firms plan to explore expanded opportunities as Stobox grows its global footprint in tokenized asset markets.
tZERO and Stobox have signed a Memorandum of Understanding to align their capabilities in primary issuance and regulated trading.
The partnership connects tokenization infrastructure with compliant brokerage and secondary market environments.
As tokenized securities grow in demand, issuers need solutions beyond basic issuance. This collaboration targets distribution, investor access, and liquidity in a structured and regulated manner.
Bridging Tokenization Infrastructure and Regulated Markets
tZERO operates a regulated broker-dealer and alternative trading system, known as an ATS. Its infrastructure supports issuance, custody, trading, and settlement of digital asset securities.
The company provides institutional-grade access to blockchain-powered financial markets. This positions it as a key link between tokenization technology and regulated capital markets.
Stobox, on the other hand, focuses on structuring and issuing compliant digital securities. It supports exempt offerings in the United States under applicable regulations.
In Europe, it operates under a Virtual Asset Service Provider license. Its platform prepares tokenized assets for interaction with broader financial ecosystems.
The MOU reflects both companies’ focus on building end-to-end solutions for the digital securities market. Issuers today require a connected path from asset structuring to compliant trading environments.
The partnership directly addresses that gap in the market. It allows both firms to operate in a more compliant and coordinated manner.
tZERO CEO Alan Konevsky stated the company’s goal clearly. “Our infrastructure solutions and partner network seek to deliver integrated market solutions that bridge tokenization technology services to compliant issuance, distribution, trading, and custody,” he said.
Konevsky added that closer alignment across these nodes supports the next phase of market development.
Expanding Regulated Access for Digital Securities
Ross Shemeliak, Co-Founder of Stobox, noted the broader shift taking place across the industry. “Digital securities need a clear path from issuance to market access,” he said.
This reflects the growing demand for more structured and regulated infrastructure in the tokenized asset space. The partnership moves in that direction with a shared framework for collaboration.
Both companies intend to explore further opportunities as the relationship develops. Stobox is advancing its global footprint, and tZERO sees fintech platforms as a key target segment.
Together, they aim to support issuers operating across different markets and jurisdictions. Each organization, however, will continue to operate independently within its own scope.
The tokenized securities market continues to attract attention from institutional and retail participants alike. Access to secondary market liquidity remains one of the main challenges for issuers.
Partnerships like this one work to remove those barriers through regulated and compliant channels. The market is moving toward more interconnected infrastructure, and this MOU reflects that direction.
Crypto World
Solana Price Holds $84.25 as Memecoin DEX Volume Hits $87.8 Billion While Pepeto Presale Fills Past $8 Million

The solana price sits at $84.25 with memecoin weekly DEX volume reaching $87.8 billion in March, more than double from August 2025. Pepeto combines meme energy with real exchange tools, offering both working products and growth potential that separates it from tokens running on pure speculation. The right investment in crypto at the right time can change a life.
PEPE exploded from a presale price and the people who acted early made the biggest returns they will ever see. The same pattern is visible before the crowd confirms it, and more than $8 million entering Pepeto during fear answers why wallets keep buying without waiting.
Solana memecoin weekly DEX volume reached $87.8 billion in the last week of March, up from $40.5 billion in August 2025, according to CoinPedia.
DeFi total value locked grew 12% in March despite the correction. BeInCrypto confirmed the solana price recovery is also shaped by the SUI 42.94 million token unlock on April 1 and Firedancer validator development pushing past one million TPS in testing, adding infrastructure depth to the Solana ecosystem.
Where Working Products and Growth Potential Beat Pure Speculation
Why Pepeto Combines Meme Energy With Exchange Tools the Solana Price Cannot Offer
Pepeto combines meme energy with real exchange tools, offering both working products and growth potential that pure speculation cannot match. The cofounder who built the original Pepe coin to $11 billion designed this platform with a former Binance expert, giving holders staking returns at 189% APY, multi chain access through the bridge across Ethereum, BNB Chain, and Solana, and wallet growth confirmed by $8 million in presale capital at $0.000000186 while fear sat at 8 on the index.
The risk scorer screens every contract before capital enters, keeping scam tokens away. PepetoSwap handles zero fee trades. An independent SolidProof review confirmed every contract, and the 420 trillion supply matches what took PEPE to $11 billion with zero products.

PEPE exploded from a presale price and the people who acted early made the biggest returns they will ever see. The same pattern is visible with Pepeto before the crowd confirms it.
Analysts project 100x from presale to Binance listing, and more than $8 million entering during fear answers why everyone keeps buying: they see what the listing delivers while SOL grinds through recovery.
Solana Price Prediction: Targets, Levels, and DEX Volume Impact for 2026
SOL trades at $84.25 on April 1 according to CoinMarketCap, recovering as memecoin DEX volume doubled to $87.8 billion. DeFi TVL grew 12% in March, and Firedancer validators pushed past one million TPS in testing.
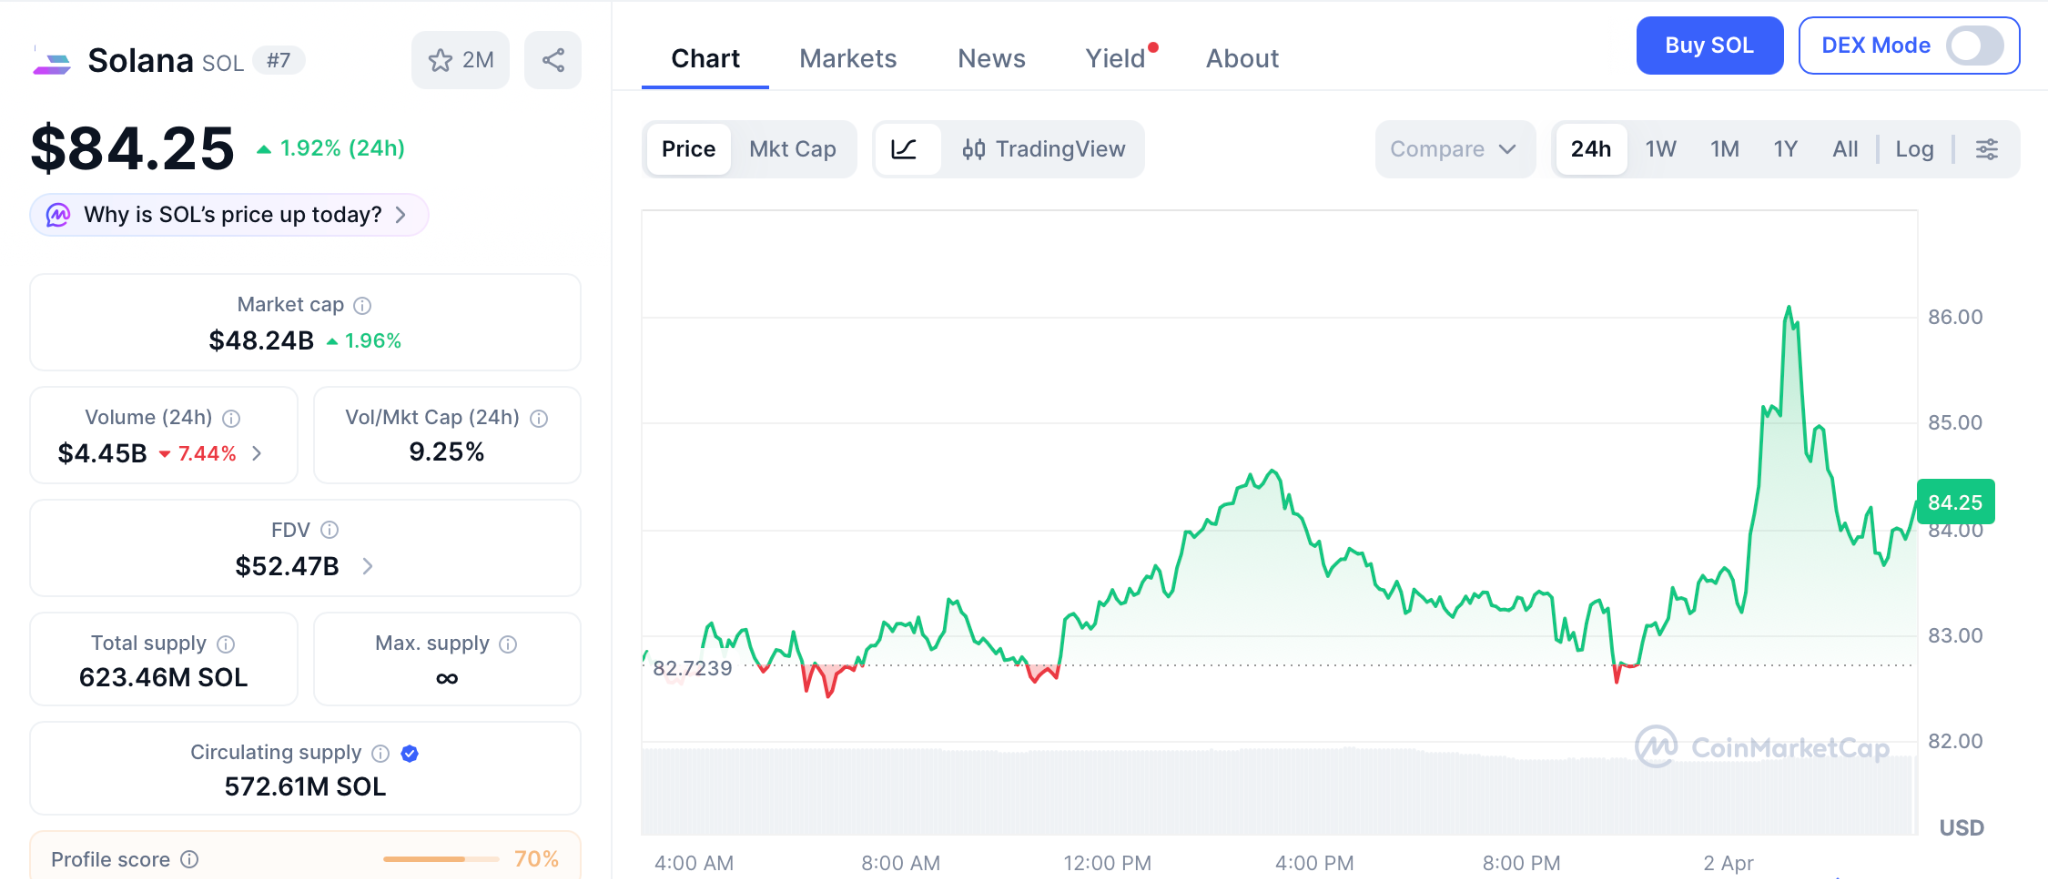
Support sits at $75 with resistance at $95 to $100. SOL ETFs launched in Q3 2025 and attracted the most sustained inflows among alt ETFs during Q1. Analyst year end targets range from $150 to $250.
From $84.25, reaching $250 gives 200% over months, a solid return that depends on sustained DeFi growth and favorable macro conditions. The solana price gives 200% over quarters while the presale compresses 100x into one listing.
The Solana Price Pattern Is the Same One, and the Right Investment at the Right Time Changes Everything
The right investment in crypto at the right time can change a life. PEPE exploded from a presale price and proved it. The same pattern is visible before the crowd confirms it with Pepeto. The Pepeto official website shows more than $8 million from wallets that already see what the Binance listing delivers.
Entering this presale while the solana price recovers and DEX volume keeps growing is how that same signal gets acted on, and letting it pass while the crowd waits for confirmation could be the one missed moment where exchange tools outperform everything that runs on meme volume alone.
Visit Pepeto before this presale stage closes and the Binance listing opens at a price nobody inside today will ever pay.
Click To Visit Pepeto Website To Enter The Presale

FAQs
What is the solana price on April 1 2026?
SOL trades at $84.25 with memecoin DEX volume at $87.8 billion and DeFi TVL up 12%. Analyst year end targets range from $150 to $250.
How does the solana price affect presale entries?
Growing DEX volume means more trades captured. The Pepeto official website shows an exchange platform positioned for that volume once the Binance listing arrives.
Is Pepeto a better entry than SOL right now?
SOL targets 200% over months. Pepeto targets 100x from presale to Binance listing with cross chain tools and the architect of the original PEPE.
Disclaimer: This is a Press Release provided by a third party who is responsible for the content. Please conduct your own research before taking any action based on the content.

Bitmine Immersion Technologies purchased 71,179 Ethereum – worth approximately $147 million – last week, its largest single-week buy of 2026 and the fifth consecutive week of sustained crypto accumulation.
Combined with the 238,244 ETH acquired over the prior four weeks, Bitmine has now stacked roughly 309,423 ETH in just over a month – and the supply mechanics behind that pace are worth examining precisely.
Chairman Tom Lee is not being subtle about the thesis. The question the market hasn’t fully answered yet: is Bitmine absorbing sell pressure fast enough to move price – or is ETH’s 22% YTD decline signaling that even $147M weekly buys aren’t enough to flip sentiment on their own?
Key Takeaways:
- Bitmine acquired 71,179 ETH (~$147M) last week – its largest weekly purchase of 2026, bringing its five-week total to 309,423 ETH.
- Total holdings now sit near 4.73 million ETH (~3.92% of supply), valued at approximately $10.5 billion – exceeding Bitmine’s $9.34 billion market cap.
- 3.14 million ETH are currently staked, generating $180M in annualized yield at a 2.81% seven-day rate – with $272M projected once MAVAN staking launches.
- Tom Lee ties the crypto winter’s end directly to oil market stabilization – citing crypto’s inverse correlation to oil as currently at its highest level in a year.
Discover: The best pre-launch token sales
Five Weeks of Crypto Buying, What 309,000 Ethereum Actually Does to Liquid Supply
Bitmine confirmed the purchase via an official post on X, with on-chain data corroborating the 71,179 ETH acquisition – up from 65,341 ETH the prior week on March 23, marking a clear escalation in weekly pace. Of its total ~4.73 million ETH holdings, 3.14 million are already staked, effectively removing them from liquid circulation entirely.
That’s a meaningful supply withdrawal at a moment when institutional staking demand is accelerating across the board.
Lee framed the strategy explicitly on Monday: “Bitmine has maintained the increased pace of ETH buys in each of the past four weeks, as our base case is ETH is in the final stages of the ‘mini-crypto winter.’” He added that the macro unlock condition is specific – “the crypto winter likely ends when the upside risk to oil prices peaks,” pointing to the highest crypto-oil inverse correlation in the past year as the key read.
StrategicEthReserve currently tracks 67 large ETH treasury holders. Bitmine leads by a wide margin – SharpLink Gaming sits second with 863,000 ETH, Ether Machine third with 496,000.
The gap between first and second place alone is more than 3.8 million tokens. That concentration matters: Bitmine is absorbing a structurally significant portion of available sell-side flow, but broader institutional outflows elsewhere are still creating headwinds that individual corporate treasury buying struggles to fully offset.
Ethereum Price Prediction: Can Bitmine’s Accumulation Force a Repricing Above $2,200?
ETH is currently trading near $2,065, down roughly 22% year-to-date despite Bitmine’s aggressive weekly purchases.
Key resistance sits at $2,200 – a level ETH has failed to reclaim since the October crash – while near-term support holds around $1,980, a zone that has absorbed two recent liquidation events. RSI on the daily chart is hovering near 42, not yet oversold but showing no clear momentum reversal signal.
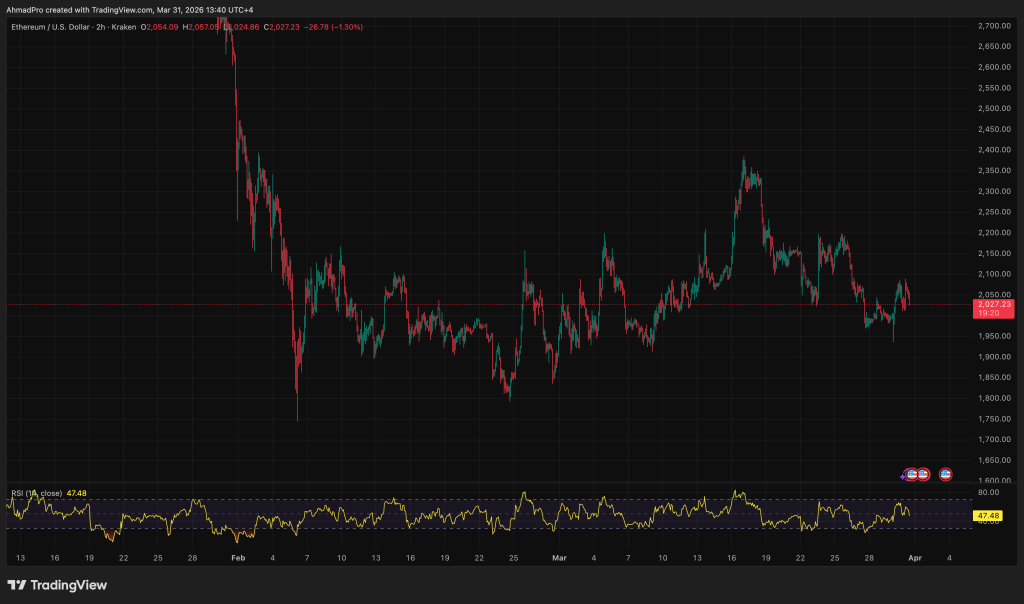
This whole move hinges on oil and whether that pressure finally cools off, because if it does, that is the kind of macro relief that can unlock risk assets, and with Bitmine steadily buying large chunks of ETH every week, supply keeps getting tighter in the background, which gives price a real shot at reclaiming $2,200 and pushing toward $2,500 if momentum follows.
Right now though it still feels stuck in the middle, with tensions and oil volatility hanging around, keeping ETH boxed between roughly $1,980 and $2,150 while Bitmine keeps accumulating but cannot fully break price out on its own, so you get a grind instead of a clean trend.
The risk is that this demand story fades before it fully plays out, because if inflows stay weak and Bitmine slows down as it gets closer to its supply target, that removes the main buying pressure, and without it, ETH can slip back toward $1,800 where the next real support sits.
The supply mechanics are shifting materially – but ETH’s price hasn’t priced in five weeks of $100M+ weekly buying. That disconnect is either a lagging signal or a warning that demand needs a macro catalyst, not just a corporate treasury, to resolve.
Discover: The best crypto to diversify your portfolio with
The post Bitmine Scoops $147M in Ethereum Crypto, Extends Five-Week Buying Streak appeared first on Cryptonews.
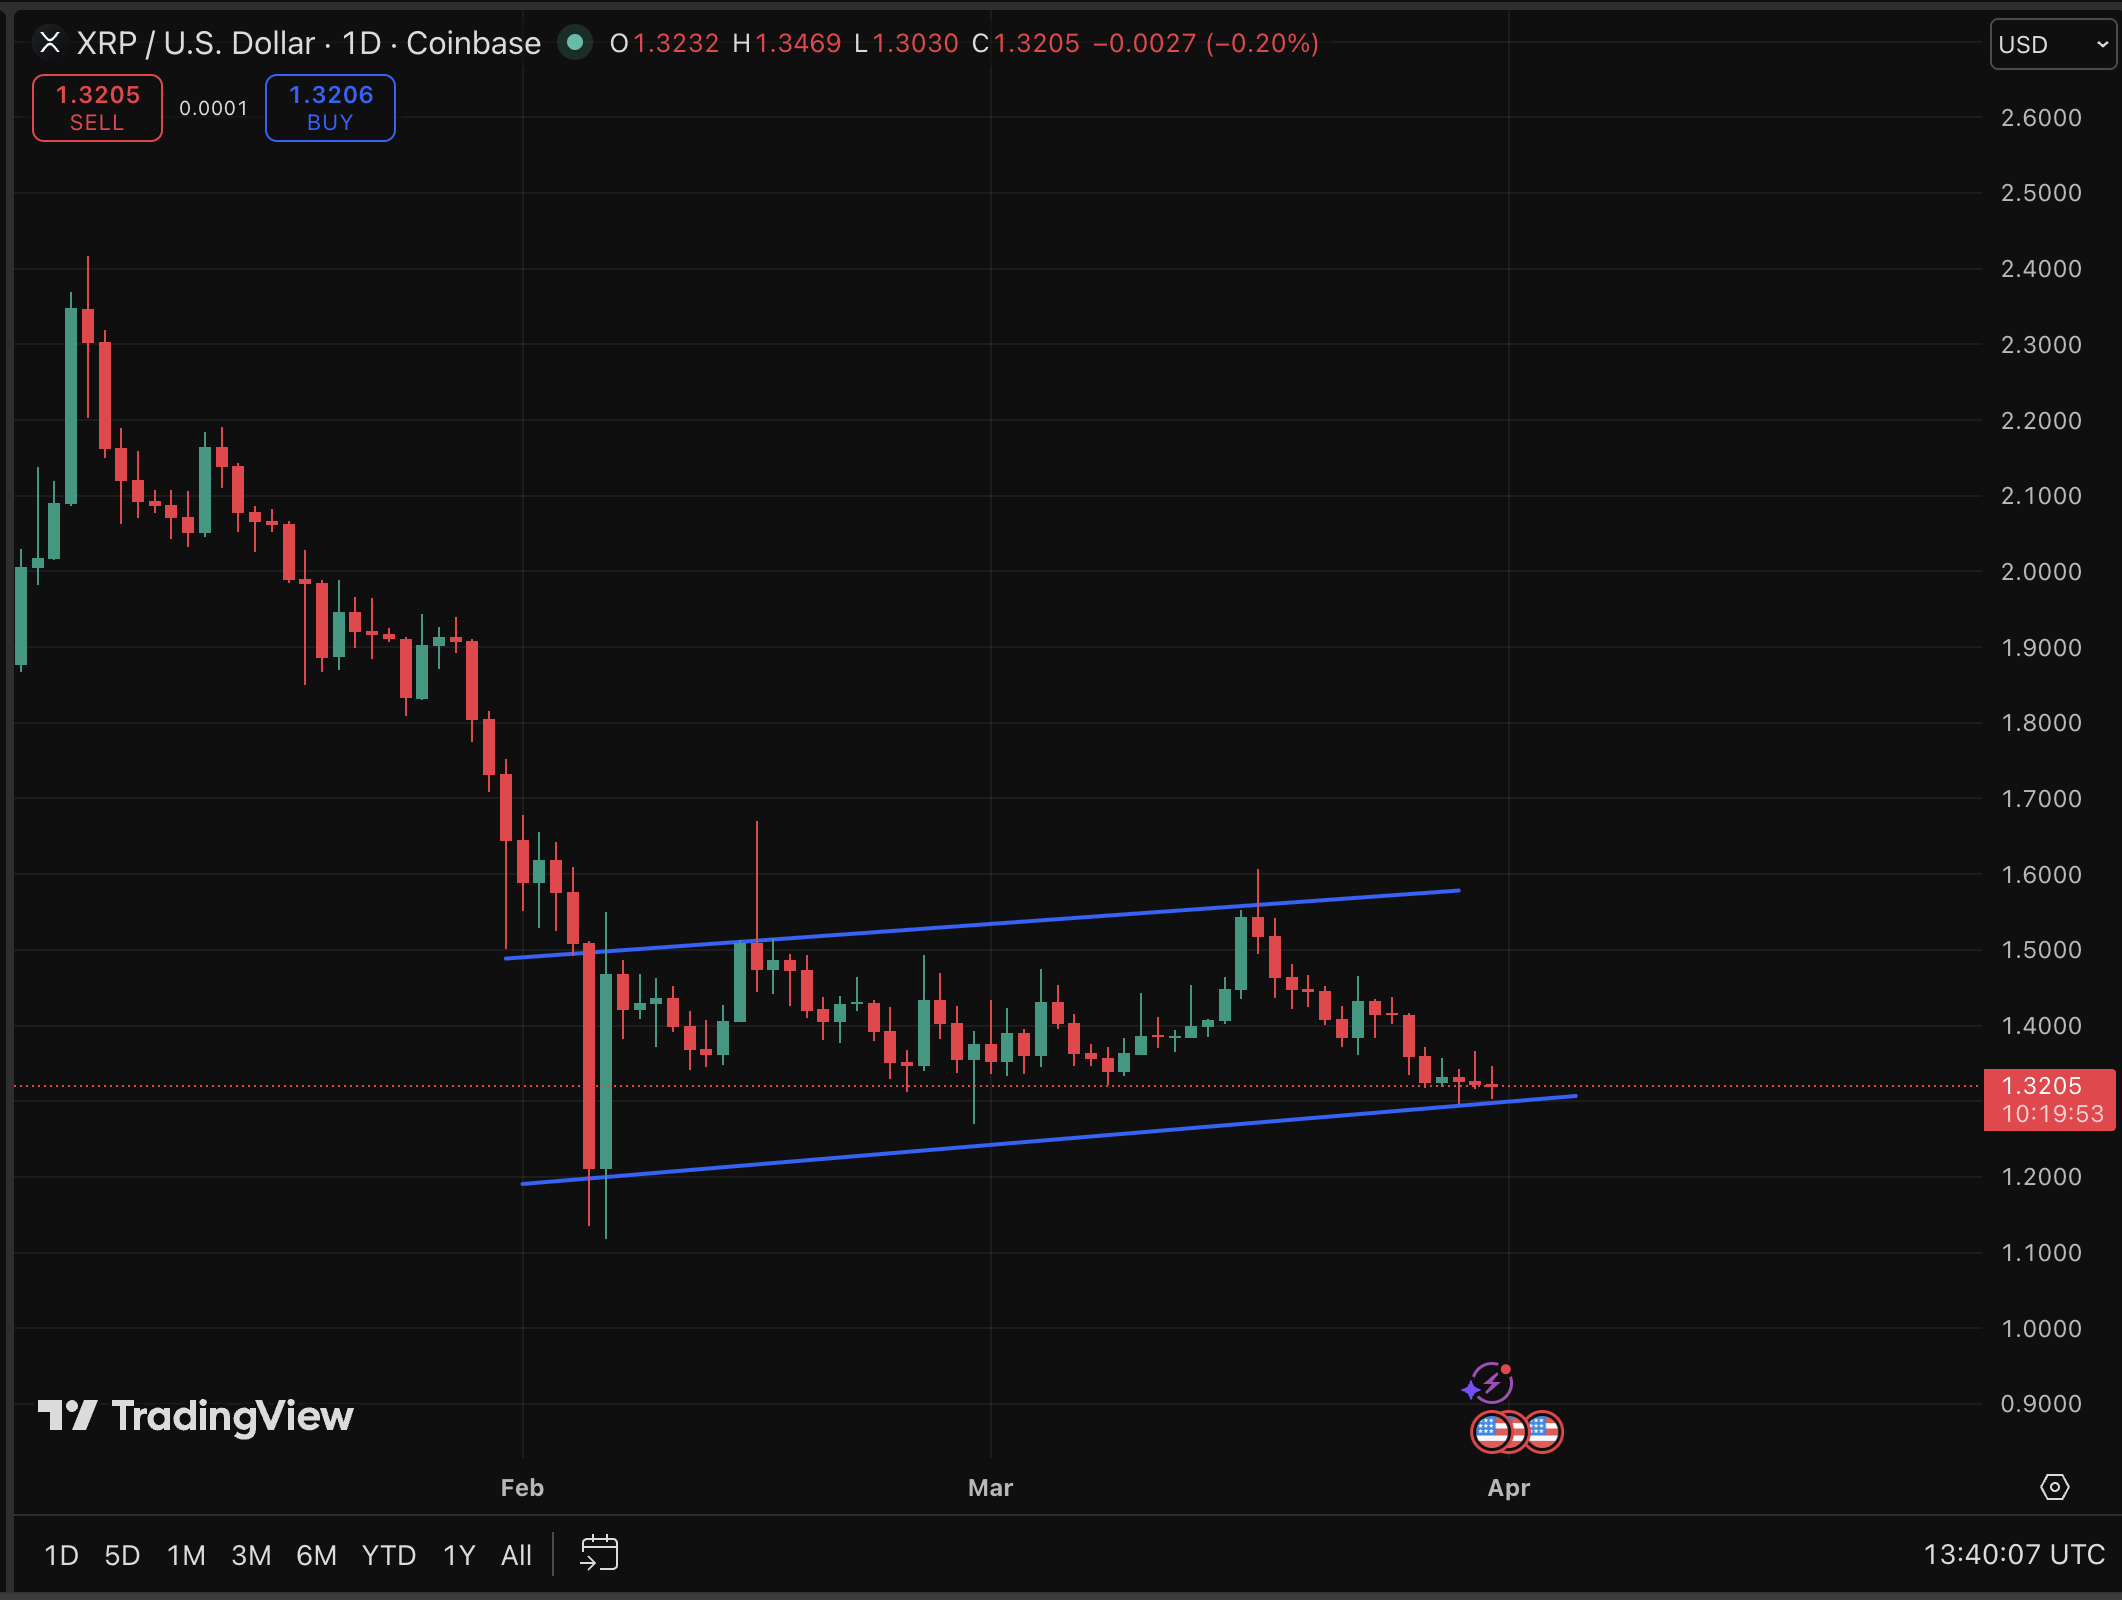
XRP price is trading at $1.32, down 2.5% in the last 24 hours, as the asset attempts to stabilize after five consecutive months of losses, which is also being boosted by Franklin Templeton’s prediction.
XRP has been grinding through a consolidation phase following its post-election peak, with analysts identifying $1.27 as the critical bear-market support floor. Meanwhile, Nvidia continues absorbing AI spending cycle uncertainty and export restriction headlines, compressing its multiple. Both assets are under pressure. Both carry asymmetric upside arguments. The difference is risk profile, time horizon, and, crucially, where each asset sits in its own cycle.
Can Ripple’s token outperform a battered Nvidia in a market where macro pressure is squeezing both crypto and tech stocks simultaneously? The answer depends almost entirely on which technical level comes next.
Discover: The best crypto to diversify your portfolio with
XRP Price Prediction: Break $1.76, or Will Bears Defend the $1.50 Resistance Wall?
XRP is currently consolidating in the $1.29–$1.39 range, with momentum turning tentatively positive after a multi-month downtrend. Five red months have left the asset searching for a directional catalyst, but the technical structure isn’t broken yet.
Key levels to watch:
- Support: $1.27 bear-market floor. A close below this level invalidates the recovery thesis.
- First resistance: $1.51, where sellers have repeatedly stepped in.
- Bull target: $1.76–$1.80, a zone where approximately 1.85 billion XRP has accumulated, making it the critical decision point for any sustained rally.
In good condition, XRP holds $1.27, clears $1.51 on volume, and targets the $1.76–$1.85 range this year, consistent with moderate AI-model forecasts projecting $1.60–$1.85. Or, it would range-bound chop between $1.29 and $1.51 as the market awaits a macro trigger. But a breakdown below $1.27 opens a retest of deeper support, invalidating the consolidation-recovery narrative entirely.

More aggressive analyst targets require a fundamental shift in institutional adoption and liquidity conditions that isn’t reflected in current price action. For now, $1.51 is the wall that matters.
Compared to Nvidia, XRP offers higher volatility and no earnings floor, but also no valuation ceiling tied to GPU shipment cycles. The same asymmetry argument applies across major altcoins, and traders rotating out of tech are increasingly running the numbers.
Discover: The best pre-launch token sales
Bitcoin Hyper Eyes Early-Mover Upside While XRP Battles Key Resistance
XRP’s recovery looks plausible, but at a $70B+ market cap, even a move to $1.85 represents modest percentage gains for new capital entering now. Traders who want crypto-native upside without waiting for Fibonacci levels to clear are scanning earlier-stage infrastructure plays. That’s where the risk-reward math gets interesting.
Bitcoin Hyper ($HYPER) is currently in presale at $0.0136778, having raised $32 million, a figure that signals serious market interest at this stage. The project positions itself as the first-ever Bitcoin Layer 2 with Solana Virtual Machine (SVM) integration, targeting sub-second finality and smart contract execution that reportedly outpaces Solana.
The architecture addresses Bitcoin’s three core constraints, slow transactions, high fees, and zero programmability, while preserving Bitcoin’s underlying security and trust model. A Decentralized Canonical Bridge handles BTC transfers natively. High-APY staking bonus is also live for early participants.
Those who want to research Bitcoin Hyper further can review the full technical documentation before the presale window closes.
This article is for informational purposes only and does not constitute financial advice. Crypto markets are volatile — always do your own research before investing.
The post XRP Price Prediction: Is Ripple a Better Investment Than Nvidia Now? appeared first on Cryptonews.
Family pays tribute to ‘beautiful’ woman killed in crash
ETMarkets Smart Talk | FII comeback will be key trigger for next rally in Indian markets: Saibal Ghosh

Bithumb delays IPO beyond 2028, signaling larger crypto listing slowdown


-

 Business6 days ago
Instagram, YouTube Found Responsible for Teen’s Mental Health Struggle in Historic Ruling
-
 Tech6 days ago
Intercom’s new post-trained Fin Apex 1.0 beats GPT-5.4 and Claude Sonnet 4.6 at customer service resolutions
-

 NewsBeat5 days ago
The Story hosts event on Durham’s historic registers
-

 Sports5 days ago
Sweet Sixteen Game Thread: Tide vs Michigan
-
Entertainment3 days ago
Fans slam 'heartbreaking' Barbie Dream Fest convention debacle with 'cardboard cutout' experience
-
 Entertainment4 days ago
Lana Del Rey Celebrates Her Husband’s 51st Birthday In New Post
-
Crypto World2 days ago
Dems press CFTC, ethics board on prediction-market insider trades
-

 Tech3 days ago
The Pixel 10a doesn’t have a camera bump, and it’s great
-

 Crypto World7 hours ago
Gold Price Prediction: Worst Month in 17 Years fo Save Haven Rock
-

 Sports1 day ago
Tallest college basketball player ever, standing at 7-foot-9, entering transfer portal
-

 Tech2 days ago
EE TV is using AI to help you find something to watch
-

 Tech2 days ago
Apple will hide your email address from apps and websites, but not cops
-

 Tech2 days ago
Flipsnack and the shift toward motion-first business content with living visuals
-

 Tech2 days ago
How to back up your iPhone & iPad to your Mac before something goes wrong
-

 Fashion7 days ago
En Vogue in Brown Leather and Tailored Neutrals by Atelier Savoir, Styled by J Bolin
-

 Politics2 days ago
Should Trump Be Scared Strait?
-

 Crypto World2 days ago
U.S. rule change may open trillions in 401(k) funds to crypto
-

 Fashion6 days ago
What Are Your Favorite T-Shirts for the Weekend?
-

 Fashion5 days ago
Weekly News Update, 3.27.26 – Corporette.com
-

 Crypto World1 day ago
Bitcoin enters the public bond market as Moody’s gives a first-of-its-kind crypto deal a rating
You must be logged in to post a comment Login