

Crypto World
Volo Protocol Loses $3.5 Million in Sui Vault Exploit Amid DeFi Hack Streak


Sui-based liquid staking platform Volo Protocol said on Wednesday that an attacker drained roughly $3.5 million from three of its vaults, the latest DeFi security breach in a month already shaken by nine-figure exploits.
Volo froze every vault after detecting the attack and notified the Sui Foundation. The stolen assets included Wrapped Bitcoin (WBTC), gold-backed XAUm, and USD Coin (USDC). The team said the remaining $28 million in total value locked across other vaults carries no shared attack vector.
Inside the Volo Protocol Exploit
Volo described the breach as a security incident in a statement posted on X early Wednesday. Only three vaults were affected, and the team said no other part of the protocol shares the same vulnerability.
The project is working with on-chain investigators and ecosystem partners to trace and recover the stolen funds. A full post-mortem will follow once the internal review concludes.
Volo originally launched as a dedicated SUI liquid staking platform, issuing the Volo Staked SUI (vSUI) token, before being acquired by Sui lending protocol NAVI in early 2024. The vault products targeted in this incident sit on top of that staking layer and accept wrapped assets and stablecoins as collateral for yield strategies.
Volo also moved to reassure users that any losses would not be passed on.
“Volo is prepared to absorb this loss. We will do our best not to pass this to our users,” Volo team, said.
The protocol said a remediation plan would follow once damage control operations finish, adding that rebuilding user trust depends on actions rather than promises.
Latest Hit in a Brutal Month for DeFi
Volo’s loss follows a string of major April incidents that have battered decentralized finance. Solana-based Drift Protocol lost about $285 million on April 1, in what Elliptic has linked to a suspected North Korean infiltration operation.
Less than three weeks later, restaking protocol Kelp DAO was drained of 116,500 restaked ether (rsETH) worth roughly $292 million through a compromised LayerZero bridge. Ethereum DeFi has since lost more than 17% of its total value locked.
Balancer also lost more than $128 million to an exploit earlier in the year. A targeted wallet drain cost one individual investor over $280 million across Ethereum and Arbitrum.
The Sui ecosystem has faced similar crises before. Attackers exploited the Cetus exchange for about 223 million dollars in May 2025. A flaw in concentrated liquidity pools enabled the attack. Sui validators and the community recovered most stolen funds. Total value locked on Sui exceeded 2.6 billion dollars in late 2025. This growth expanded the attack surface for exploiters. Attackers now target vault logic and oracle dependencies more often.
Volo promises to cover the 3.5 million dollar loss without external help. Depositors will watch closely when withdrawals reopen. The post-mortem should clarify the root cause. It will show whether the flaw was isolated or systemic. The findings may impact trust in the Sui DeFi ecosystem.
The post Volo Protocol Loses $3.5 Million in Sui Vault Exploit Amid DeFi Hack Streak appeared first on BeInCrypto.


Key takeaways
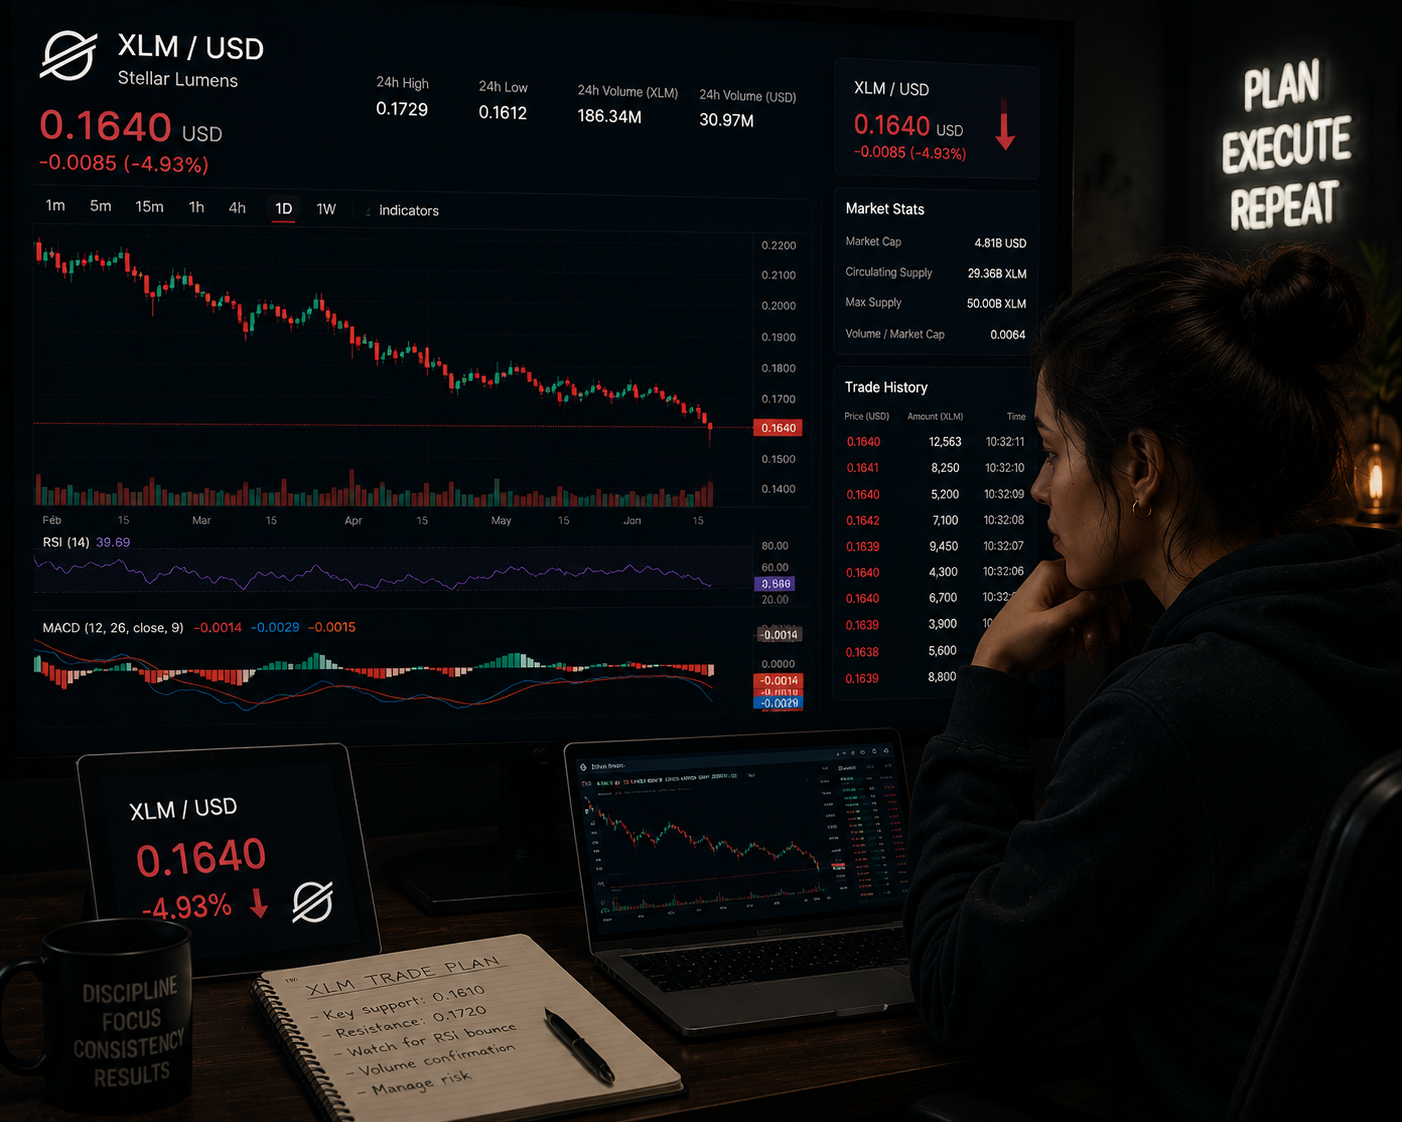
- Stellar continues consolidating between its 50-day and 100-day EMAs.
- CryptoQuant data suggests a neutral-to-bullish outlook for XLM.
On-chain and derivatives data support a mild bullish outlook
Stellar traded cautiously on Tuesday, but improving on-chain activity and derivatives positioning continued to support expectations for a potential upside breakout in both altcoins.
According to CryptoQuant summary data, Stellar reflects buy-side dominance with largely neutral market conditions, pointing to a mild bullish bias despite the lack of a decisive breakout.
CoinGlass data shows the OI-weighted funding rates for XLM flipped positive on Friday and remained positive on Tuesday at 0.0030%, respectively. Positive funding rates indicate that long-position holders are paying shorts, reflecting growing bullish positioning among traders.
Stellar technical outlook: Consolidation continues between key EMAs
The XLM/USD 4-hour chart is bearish and efficient as it is currently trading at $0.164 per coin. It is currently trading between major moving averages as traders await a clearer directional move.
XLM continues to hold above its 50-day EMA near $0.165 but remains below the 100-day EMA at $0.174 and the 200-day EMA around $0.204. Broader descending trendline resistance also continues to cap upside attempts.
Momentum indicators nevertheless show early signs of improvement. The RSI sits near 57, slightly above the neutral midpoint. The MACD line remains marginally above zero, suggesting mild bullish momentum.
If the rally resumes, the bulls would encounter resistance at key levels, including the 100-day EMA at $0.174, the 23.6% Fibonacci retracement at $0.201, and the 200-day EMA just above $0.204.

However, if the bearish trend persists, immediate support would be seen at the 50-day EMA at $0.165. A daily candle close below this level would expose the major support at $0.136.
As long as XLM maintains support above the 50-day EMA, the current consolidation structure could support a gradual recovery attempt. However, a breakdown below $0.136 would likely reopen the broader bearish trend.
Bitcoin (BTC) saw classic volatility ahead of Tuesday’s Wall Street open as a key US inflation gauge hit its highest levels in three years.
Key points:
- US CPI inflation reaches its highest year-on-year levels since 2023.
- Energy prices fuel the rise, with the US-Iran war continuing to make its presence felt.
- Bitcoin traders retain support levels while a 200-day trend line comes in as resistance.
Bitcoin price on edge as CPI beats multiyear records
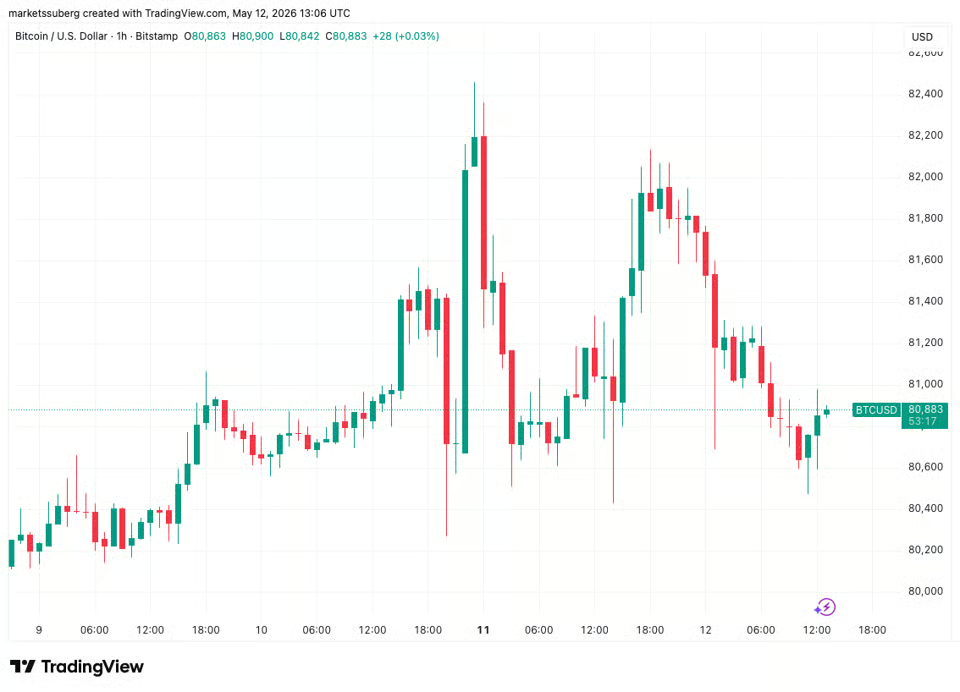
Data from TradingView showed BTC price action circling $81,000 as risk assets saw fresh headwinds.

BTC/USD one-hour chart. Source: Cointelegraph/TradingView
These came in the form of the April US Consumer Price Index (CPI), which at 3.8% year-on-year put inflation at its highest since 2023.
“The index for energy rose 3.8 percent in April, accounting for over forty percent of the monthly all items increase,” an official news release from the US Bureau of Labor Statistics (BLS) noted.
The 12-month increase in energy was almost 18%, continuing to show the impact of the US-Iran war and oil-supply squeeze on prices.
“Conversely, the indexes for new vehicles, communication, and medical care were among the major indexes that decreased in April,” the release added.

US CPI 12-month % change. Source: BLS
Reacting, trading resource The Kobeissi Letter observed that the odds of the Federal Reserve pivoting to interest-rate hikes were “surging.”
“We are now experiencing post-pandemic inflation levels amid surging oil prices,” it wrote in a post on X.

Fed target rate probabilities (screenshot). Source: CME Group
The latest data from CME Group’s FedWatch Tool showed expectations anchored around current rates staying in place throughout 2026 and next year.
Crypto and risk assets tend to see downside pressure when rate hikes return, thanks to the implied lower liquidity entering the market.
Questions over Bitcoin’s “momentum” at the 200-day trend line
Bitcoin traders, meanwhile, reiterated lines in the sand that bulls should protect in the short term.
Related: BTC price target becomes $85K next: Five things to know in Bitcoin this week
“The 21-MA is a crucial level to look at,” crypto trader and analyst Michaël van de Poppe told X followers on the day, referring to the 21-day simple moving average (SMA) at $78,800.
“The $76K area is a crucial support zone that I fancy not to be breached, if that happens, we’ll be going substantially lower.”

BTC/USDT one-day chart. Source: Michaël van de Poppe/X
Trading resource Material Indicators flagged problematic resistance in the form of the 200-day SMA near $82,600.
“Bulls appear to be attempting to establish an R/S Flip at $80.7k to build foundational support for another run at breaking the 200-Day SMA,” it summarized.
“Do bulls have the momentum to succeed?”

BTC/USD one-day chart. Source: Material Indicators/X


Key takeaways
- Bitcoin trades around $81,000, maintaining a bullish bias but facing resistance at the 200-day EMA.
- Traders await the US Consumer Price Index (CPI) data, which could trigger volatility in BTC and risky assets.
US CPI report could drive volatility for Bitcoin
Bitcoin traders are awaiting the release of the US Consumer Price Index (CPI) for April, scheduled for Tuesday at 12:30 GMT.
The report is expected to show a sharp increase in inflation, driven in part by higher oil prices amid the ongoing US-Iran tensions.
The monthly CPI is forecast to rise by 0.6%, following March’s 0.9% increase. The annual CPI reading is expected to climb to 3.7%, up from 3.3% in March, marking the highest level since September 2023. Core CPI, excluding food and energy prices, is anticipated at 0.3% for the month and 2.7% year-over-year.
The data will likely shape expectations for future interest rate cuts by the Federal Reserve (Fed), potentially triggering volatility in Bitcoin and other risk assets.
Additionally, elevated crude oil prices continue to add to inflationary pressures, reinforcing the likelihood of a more hawkish Fed stance, which could weigh on Bitcoin’s upside.
Negative headlines regarding the US-Iran situation could also strengthen the US Dollar (USD) as a reserve currency, further dampening short-term risk appetite.
Despite the uncertain macro environment, Bitcoin’s institutional and corporate demand remains strong, providing support for its price.
Spot Bitcoin ETFs recorded inflows of $27.25 million on Monday, according to CoinGlass data, breaking a two-day streak of outflows from the previous week.
While these inflows were modest, they reflect a cautious yet positive outlook from investors. If this trend continues, Bitcoin’s price could see further upward movement.
On the corporate side, Strategy (MSTR), led by Michael Saylor, added another 535 BTC to its treasury reserve on Monday, bringing its total Bitcoin holding to 818,869 BTC.
The company has consistently accumulated Bitcoin over recent months, with an average purchase price of $75,540—above the current market price, adding to the bullish sentiment.
Bitcoin technical outlook: Resistance at 200-day EMA
Bitcoin is trading around $81,000 on Tuesday, maintaining a constructive bullish bias as it holds above the 50-day and 100-day Exponential Moving Averages (EMAs) near $76,700.
The 50% Fibonacci retracement at $78,962 also provides strong support. However, Bitcoin is currently facing resistance at the 200-day EMA, located around $82,130.
A break above this level would likely open the path to the next resistance zone around $83,437 (61.8% Fibonacci retracement) and $84,410 (horizontal barrier).
The Relative Strength Index (RSI) on the 4-hour chart is at 55, and the Moving Average Convergence Divergence (MACD) remains mildly positive, suggesting that while momentum is bullish, there are no immediate overbought conditions.

If the rally continues, immediate resistance is seen at the 200-day EMA around $82,130, followed by the 61.8% Fibonacci retracement at roughly $83,437 and the horizontal barrier near $84,410.
However, if the bearish trend persists, sellers would encounter support at the psychological $80,000 level, ahead of the 50% retracement at $78,962, with the 100-day and 50-day EMAs near $76,647 and $76,248, the channel top around $75,680.


Crypto sleuth ZachXBT claims that Bitget executives are allowing “scams to operate behind the scenes” after 10 new wallets withdrew $480 million worth of LAB from the exchange.
The staggering sum, which represented 32% of the LAB supply, was withdrawn over the course of 12 hours. The token’s issuer, also called LAB, is a crypto trading infrastructure firm that claims to boast an “AI research engine.”
Fellow crypto investigator Specter Analyst claims to have tracked the LAB team depositing millions of dollars worth of the token to Bitget.
It said this all took place before a price pump in early May, leading them to suspect that LAB is a major coordinated pump-and-dump scheme that Bitget is profiting from.
Today, ZachXBT claimed that Bitget’s founder, Shawn Liu, is the exchange’s “big boss” and is helping the alleged scams. Bitget’s CEO, Gracy Chen, was otherwise described as the public face of operations.
Read more: Bitget suspended in Singapore for refusing to remove BTS-themed coin
ZachXBT called the crypto exchange a “cartel” and claimed that it “has gone unchallenged for years and doesn’t care as long as they benefit from the activity.”
The investigator added that it’s almost time for an increase in “public attacks” against the exchange.
ZachXBT previously put up a $10,000 bounty for anyone with insider details relating to LAB’s founder Vova Sadkov, and the listings of LAB on Bitget spot and perps across Bybit, Binance, and OKX.
He said, “These grifters are further hurting the industry reputation and it must not go unpunished.”
April also saw suspicious crypto listings on Bitget
Bitget is one of the largest crypto exchanges in the world and processed over $1 billion worth of trading volume in the last week. It claims to have no specific headquarters and has set up regional hubs across the globe.
Last month, Bitget-listed token $RAVE also raised suspicions of insider trading after its trading volume exceeded $300 million and its price plummeted 97% within days.
Multiple exchanges said they would investigate the listing, including Bitget, but ZachXBT wasn’t impressed with the response time.
Read more: AP just rugged crypto bros with a Swatch collab
On May 7, 20 days after Chen promised Bitget would investigate the $RAVE listing, ZachXBT noted that there is yet to be an update on the $RAVE investigation.
In 2021, the exchange was suspended by Singapore regulators for refusing to delist a token that was themed around the South Korean boy band BTS and used unlicensed images.
Protos has reached out to Bitget for comment on the LAB listing and will update this piece should we hear anything back.
Got a tip? Send us an email securely via Protos Leaks. For more informed news and investigations, follow us on X, Bluesky, and Google News, or subscribe to our YouTube channel.


Rachel Conlan, the chief marketing officer (CMO) at Binance, the world’s largest cryptocurrency exchange, said she is leaving the company next month after three years helping to build the brand.
Eowyn Chen, former CEO of Trust Wallet, will serve as the interim CMO, a Binance spokesperson said via email
“Serving as CMO of Binance has been the privilege of my career,” Conlan said in an email. “ I’m deeply grateful to Yi He, Richard [Teng] and the entire leadership team for the trust they placed in me, and to every member of the team I’ve had the honour of working with.”
Conlan, who took the post in September 2023, is credited with launching “Crypto,” the perfume. Also known as “Eau de Binance,” the fragrance was introduced by the exchange in March 2024 to celebrate International Women’s Day.
Prior to Binance, Conlan spent a year as the global head of brand and partnerships at rival OKX, working under CMO Haider Rafique.
“Rachel is a premier talent who has left an indelible mark on the company and after four years of remarkable service has decided to step down to focus on personal priorities,” a Binance spokesperson said.
Like other large crypto brands, Binance has signed a selection of high-profile partnerships, a number of which predate her tenure. These include the footballer Cristiano Ronaldo, Canadian singer-songwriter The Weeknd, the Alpine Formula One team and social media star Khaby Lame.
This year’s crypto market downturn may be hitting the wallets of marketing departments at large crypto firms. Crypto.com, a firm that has spent as much as $1 billion promoting its name on things like rebranding the Staples Center, an advert with Matt Damon, FI and UFC deals, only last week said its CMO, Steven Kalifowitz, is leaving the company.
In addition, Ben Zhou, the CEO of Bybit, the second-largest crypto exchange, said in a recent interview that he would not be renewing his F1 sponsorship, and is looking for other deals with better commercial value.
Conlan’s last day is June 15 and she will remain as an adviser to support the company through the transition, Binance said.


Cryptoquant’s bitcoin bull-bear cycle indicator turned green for the first time since 2023, which could signal that “the market structure is beginning to recover,” said the firm’s onchain market analyst Julio Moreno on Wednesday.
“Historically, this has been an important regime-change signal,” Moreno wrote. “When the indicator moves out of bear territory and enters the early bull zone, it often suggests that the worst phase of the correction has already passed and that market structure is beginning to recover.”
For Mati Greenspan, a former eToro senior market analyst and founder at Quantum Economics, the CryptoQuant Bull-Bear Market Cycle Indicator is a regime-shift indicator, not a crystal ball. He said that, “historically, it has been most useful for identifying when bitcoin stops behaving like a bear-market asset.”
Greenspan said that the real confirmation comes afterward, with sustained demand, liquidity, and price acceptance at higher levels. “So now all eyes are on price action to confirm validation,” he added.
He recalled that when this indicator turned green in 2019 and again in early 2023 following intense bearish phases, the market transitioned into “stronger bullish trends.” Moreno, however, acknowledged that March 2022 remains a critical exception. Back then, the indicator turned bullish but delivered a false positive, preceding a move into a deeper downtrend.
The analyst also stressed why the current May 2026 is so pivotal. “On one hand, the indicator is showing the first constructive regime shift in years,” he said. “Bitcoin is no longer behaving like a deep bear-market asset, and the recovery in the 30-day moving average suggests improving momentum beneath the surface.”
Currently, Bitcoin finds itself in a tug of war similar to 2022. While the onchain metrics are healing, the asset is struggling to decisively flip the $82,000 resistance level, a ceiling that has held firm despite multiple breakthrough attempts this month following a 35% rebound from February’s $60,000 lows.
To confirm this bullish signal, bitcoin must overcome the “exhaustion” presently visible in secondary metrics, Moreno suggested. Unlike the clean early-cycle entries of the past this move is clashing with a neutral Fear & Greed index and a complex macroeconomic backdrop.
While Arthur Hayes, chief investment officer of Maelstrom, did not mention CryptoQuant’s indicator, he echoed the sentiment that the cycle has shifted, stating he believes Bitcoin already found its bottom at $60,000 earlier this year. Hayes, who also co-founded the BitMEX exchange, pointed to $90,000 as the level at which the rally would turn explosive and head toward its previous high of $126,000.
Jason Fernandes, co-founder at AdLunam, concluded that while these indicators are useful, they are often misunderstood. “Metrics like MVRV (Market cap versus realized cap) or NUPL (net unrealized profit and loss) were never designed to be precise trading signals,” he said. “They are better viewed as behavioral frameworks for understanding where Bitcoin sits within a broader liquidity cycle.”
The second-largest cryptocurrency, which experienced a significant revival in mid-April and at the start of May, has been on a decline over the past week, and some analysts now believe it may plunge further in the near future.
Others remain cautious, arguing that traders should avoid jumping into ETH until it breaks convincingly out of its recent range.
Tread Carefully
As of press time, the asset is trading at around $2,280 (according to CoinGecko), representing a 4% decrease over the past 7 days. The renowned analyst Ali Martinez believes anything between $2,200 and $2,400 falls within a “no-trade zone,” arguing that only a sustained close outside this area will define “the next major move.”
X users Ted and CRYPTOWZARD also issued warning predictions. The former claimed that spot demand is weak and expects ETH to continue to underperform if it stays below $2,400.
CRYPTOWZRD forecasted that moving above the $2.4K resistance might trigger the next upside move, while trading below could lead to more “random movement.”
Certain factors reinforce the bearish scenario. The amount of ETH stored on centralized exchanges has been rising since May 5, recently surging to nearly 15 million coins. This displays that some investors have abandoned self-custody methods and flocked towards centralized platforms, which in turn increases immediate selling pressure.

Moreover, big investors have been reducing their exposure to the asset lately. Last week, Martinez revealed that whales (who owned almost 16 million ETH by October 2026) now hold less than 13 million units. Such a sell-off shows reduced confidence from these market participants, and their actions could trigger panic across the community, potentially prompting smaller players to cash out as well.
The Bullish Signs
Contrary to the pessimistic predictions and elements mentioned above, there are some developments suggesting a notable price resurgence could be on the way.
Earlier this month, Ali Martinez spotted a so-called golden cross on the asset’s chart, a pattern that appeared in the final days of April. The setup is widely viewed as bullish, occurring when the 50-day moving average crosses above the 200-day moving average. Back then, the analyst thought this could pave the way for a rally toward $2,680.
Meanwhile, Tom Lee’s Bitmine Immersion Technologies continues to increase its exposure to the cryptocurrency and now holds 5.21 million ETH. The stash represents roughly 4.3% of the asset’s circulating supply, while its USD equivalent is almost $12 billion.
The post Ethereum (ETH) Sits in a ‘No-Trade Zone:’ Here’s What Will Define the Next Major Move appeared first on CryptoPotato.
Crypto World
The CFTC is in talks with every major pro sports league to crack down on insider trading


Chairman Mike Selig of the U.S. Commodity Futures Trading Commission (CFTC) said his agency is in talks with all major U.S. professional sports leagues as federal regulators deepen oversight of sports-related prediction markets.
The regulator is seeking broader cooperation with leagues to monitor insider trading and market manipulation tied to event contracts, Selig said Tuesday at the annual FINRA conference in Washington D.C. on Tuesday, following an earlier CFTC announcement of a data-sharing agreement with Major League Baseball in March.
“We’ve entered into a memorandum of understanding with Major League Baseball, and we’re in talks with all the professional sports leagues,” Selig said at the event, hosted by the brokerage industry’s self-regulatory organization.
The CFTC agreement with baseball was its first formal information-sharing deal with a professional sports organization. The arrangement comes as federally regulated prediction markets such as Kalshi and Polymarket move deeper into sports contracts, triggering disputes with state gaming regulators over who controls the sector.
Selig took an aggressive stance on that legal fight. He said the CFTC has already sued “about five or six states” over attempts to block federally regulated event contracts and pledged the agency would continue bringing cases against states that challenge the commission’s authority. Under U.S. law, derivatives listed on CFTC-regulated exchanges fall under federal oversight rather than state gaming laws, he’s repeatedly argued.
“Different products, parallel regimes,” he said, comparing sports prediction contracts with traditional casino betting.
The chairman also outlined how the agency is approaching insider trading in prediction markets, an area regulators have only recently begun confronting.
Selig cited a case policed by the platform Kalshi involving YouTube creator MrBeast in which an employee allegedly traded ahead of market-moving information tied to online content releases. He also described hypothetical sports-related scenarios, including trainers or team staff trading on nonpublic injury information before games.
The exchanges themselves remain the “first line of defense,” Selig said, because they conduct know-your-customer and anti-money laundering checks that can help identify suspicious activity.
The CFTC also expects prediction markets to spread into mainstream investment products.
Selig said regulators are reviewing exchange-traded products and funds linked to prediction-market strategies and are coordinating oversight with the Securities and Exchange Commission (SEC). SEC chair Paul Atkins is scheduled to speak at the conference later this afternoon.
Selig’s remarks signal a broader shift at the CFTC under the Trump administration, which has embraced prediction markets and crypto-linked financial products after years of regulatory resistance toward the sector.

Bitcoin (BTC) traded with notable volatility as traders absorbed a key U.S. inflation print ahead of Tuesday’s market open. April’s consumer price index data reinforced the case for sticky inflation pressures, with energy costs acting as the primary driver behind the latest move higher in overall prices.
According to the U.S. Bureau of Labor Statistics, the CPI registered a 3.8% year-over-year rise in April, the highest rate since 2023. The energy index alone rose 3.8% for the month, accounting for a large share of the monthly increase. On a yearly basis, energy prices were up nearly 18%, a circumstance many analysts tie to ongoing supply constraints and geopolitical tensions affecting the oil market. The release also noted declines in several other categories, including new vehicles, communications, and medical care.
Against this macro backdrop, BTC was hovering around $81,000 as risk assets faced renewed headwinds. Traders kept a close eye on technical levels that could shape the near-term trajectory, with the 21-day moving average around $78,800 acting as a near-term benchmark and the 200-day moving average flirting with the upper $80,000s as a key resistance area.
Industry commentary underscored a delicate balance between safe-haven demand and macro headwinds. The broader inflation narrative, coupled with rising energy costs, fed expectations that the Federal Reserve could maintain a restrictive stance longer than some anticipated — a stance that has historically weighed on liquidity in risk assets, including cryptocurrencies.
The latest data from CME Group’s FedWatch Tool showed market participants pricing in rates staying at today’s level through 2026 and into the following year, a scenario that tends to exert pressure on riskier assets during periods of anticipated higher-for-longer rates. In this environment, Bitcoin’s price action remains sensitive to shifts in liquidity and the path of monetary policy, even as some investors view crypto as a hedge or portfolio diversifier in times of macro stress.
Key takeaways
- April CPI rose 3.8% year over year, the highest since 2023, with energy contributing a substantial portion of the monthly increase.
- Energy prices climbed 3.8% in April, contributing to a near-18% year-over-year rise in energy costs and amplifying inflation pressures tied to the oil market and geopolitical dynamics.
- Bitcoin remained around $81,000 as traders weighed macro headwinds against technical support and resistance at key moving averages.
- The 21-day moving average sits near $78,800, seen as a short-term support level, while the 200-day moving average approaches the $82,600 region as a significant resistance hurdle.
- Fed probability tooling suggested rates could stay unchanged through 2026, reinforcing concerns about liquidity headwinds for risk assets, including BTC.
Bitcoin’s momentum under the spotlight: a technical inflection zone
From a technical standpoint, market participants highlighted a confluence of levels that could determine whether BTC sustains a bullish bias or retests support. The 21-day simple moving average (SMA) at roughly $78,800 is viewed by several traders as a short-term pivot point; a break below the nearby $76,000 zone could signal greater near-term vulnerability for bulls trying to defend a base near current levels. The below-peak narrative was echoed by prominent traders monitoring intraday and swing data, who warned that a breach of that critical support area could open the door to a more pronounced move lower.
“The $76K area is a crucial support zone that I fancy not to be breached; if that happens, we’ll be going substantially lower.”
On the upside, Bitcoin faces a substantial overhang near the 200-day moving average, which analyst commentary places around $82,600. Some trading desks have described the current setup as an ongoing attempt by bulls to establish a reliable support-and-resistance flip around the $80.7k region — a move that would bolster confidence for another push toward the longer-term trend line. A number of traders underscored the risk that, without sustained momentum, the price could struggle to break through the 200-day SMA and instead consolidate near the mid-$80,000s or lean toward the lower end of the range.
“The 200-Day SMA near $82,600 is a real test for bulls. Without a convincing breakout, we could see a more measured pullback before any renewed attempt,”
Analytical notes from Market-structure researchers highlighted a delicate balance between bullish posture and the risk of a renewed pullback. One observer summarized the scene by noting that while the market has attempted to establish a higher base around the $80,000s, the lack of a decisive close above the 200-day average could keep BTC tethered to a tighter range in the near term.
Macro backdrop and the reward-risk calculus for traders
The inflation data arrived amid a political and energy backdrop that continues to influence macro markets. The April CPI print showed an energy component that has proven resilient, a dynamic some analysts attribute to ongoing geopolitical frictions and supply constraints. The energy-driven inflation impulse has implications for both the macro outlook and crypto markets, where liquidity can contract when policymakers signal a higher-for-longer rate regime.
In terms of policy expectations, markets have largely priced in a steady rate path through the near term. The FedWatch Tool’s current read suggests the Federal Reserve is not expected to cut rates in the near future and may hold policy steady through 2026, with the implied path stretching into the following year. The implication for crypto traders is twofold: liquidity tends to tighten when rate hikes are anticipated, and any shift in policy expectations can quickly alter risk appetite across digital asset markets.
Beyond monetary policy, the inflation story remains tethered to energy prices and geopolitical risks that influence oil supply. An elevated energy backdrop can sustain upward pressure on general prices, even as some components of the CPI cooled in April. The energy story, frequently cited by analysts, includes references to an oil-market supply squeeze that has historically fed into broad inflation metrics and, by extension, market sentiment around risk assets, including BTC.
On the crypto analytics side, traders still watch the interaction between macro signals and on-chain dynamics. While some market participants point to Bitcoin’s relative strength during periods of inflationary pressure, others warn that a sustained policy regime that keeps liquidity tight could cap upside momentum in the near term. The balance remains delicate: macro resilience can support demand for value storage narratives, while liquidity constraints and higher-for-longer rates might restrain rapid upside moves until new catalysts emerge.
What to watch next in Bitcoin and the macro setup
Market observers will be watching whether Bitcoin can sustain a bid above the approaching 200-day average or whether bulls must reassert footing at lower levels. The interplay between inflation data, energy costs, and policy expectations will shape the path of least resistance for BTC in the coming weeks. As traders weigh risk versus reward in a liquidity-constrained environment, any shifts in the Fed outlook or energy markets could reintroduce sharper moves for Bitcoin and other risk assets.
For readers keeping score, the next set of inflation readings, policy guidance from central banks, and energy-market developments will be critical to interpreting BTC’s short- and medium-term trajectory. In particular, investors will want to monitor whether the market’s pricing for rate paths remains anchored to a longer-dated, steady policy stance or if a renewed shift in expectations creates the conditions for a more decisive move in BTC’s price.
Next up, the market will continue to parse the evolving inflation narrative, the implications of the Fed’s policy stance, and how energy costs influence consumer prices. If energy-driven inflation cools or policy remains restrictive while liquidity conditions loosen, BTC could demonstrate greater resilience. Conversely, a renewed bout of rate hikes or a sharper squeeze in liquidity could test support near the current range and drive attention back toward the traditional gauges of momentum in the crypto space.
References to the evolving data points and opinions, such as the commentary from The Kobeissi Letter and the technical observations from Michaël van de Poppe, illustrate the spectrum of risk signals traders weigh as they navigate the crossroads of macro policy, energy markets, and crypto pricing.
As one of the more scrutinized cross-currents in markets today, Bitcoin’s trajectory remains tethered to the broader macro regime. Investors should stay alert to any shifts in rate expectations, energy-market dynamics, or geopolitical developments that could tilt the balance of risk appetite in favor of or against crypto assets in the near term.
In case you want to trace the data points mentioned above, the official CPI release is available from the U.S. Bureau of Labor Statistics at the official news release, and market-implied rate paths can be reviewed via the FedWatch Tool. For price action context, traders referenced the BTCUSD chart on TradingView, while notable technical commentary cited the Michaël van de Poppe and the Material Indicators notes. The inflation-linked context also references energy-market reporting tied to the oil-supply environment described in oil-supply dynamics.

This is a must-see event now at this point in Canadian sporting events history. The Vanier Cup is becoming less specialized. The number of people watching it is increasing, and the crowd gets louder each year. If you don’t know about it yet, it’s time to jump aboard and be part of the shift from the beginning.
A Faster, More Watchable Version of University Football
Vanier Cup games feel faster now, and that shift didn’t happen by chance. Teams move the ball more quickly and attack space without hesitation. Watching it live, or even tracking moments on Mel Bet, makes that tempo even more obvious in real time. Coaches trust modern systems and push decisions that match today’s aggressive football logic. You rarely see passive plans anymore, especially when the game is on the line.
The broadcasting side of things has greatly improved since the days of lower-quality broadcasts. Games are easier to understand and appeal to new fans of university football. The cameras show cleaner images, there is better commentary, and tighter editing to help new fans experience the excitement of live action.
Why More Fans Are Paying Attention
The growth is not random; it comes from clear changes across the board. Audiences respond when the product improves and becomes easier to access. Several factors are driving this shift:
- Increased media coverage across digital platforms and short-form content
- Stronger rivalries that create real stakes beyond a single game
- Better player development that raises overall match quality
- Easier streaming access for younger audiences
Each element works together, building momentum rather than isolated spikes in interest. Fans stay longer because the experience now feels consistent from kickoff to final whistle.
The Next Layer: Visibility and Identity
The Vanier Cup is no longer hidden behind limited exposure or outdated formats. It is building a recognizable identity that connects with modern sports audiences. That shift shows up in how fans follow games, discuss moments, and track odds through Melbet Canada during key matchups. This evolution creates a stronger connection and pulls more people into the experience.
Players Are Becoming Recognizable Names
University athletes are no longer anonymous figures who disappear after graduation. Some players now build followings during the season, especially through highlight clips and social platforms. Their performances travel faster than ever, reaching audiences beyond traditional broadcasts.
That visibility changes how games are perceived. Fans tune in not just for teams, but for specific players who bring energy and personality. It adds continuity across the season and makes the final feel like a real payoff.
Storylines Now Carry Real Weight
The Vanier Cup benefits from stronger narratives that build throughout the season. Underdog runs, comeback wins, and coaching battles create tension before the final even begins. Those stories give context to every snap during the championship game.
Viewers stay engaged because they understand what is at stake. It is no longer just a title game; it feels like the closing chapter of a larger story. That emotional investment keeps audiences locked in until the end.

A Better Product on and off the Field
The game has clearly gotten better, what surrounds the game (the overall fan experience) is equally important. The visual quality of a stadium show has increased, crowd participation is more intentional, and event management seems more polished. Now, when fans arrive early, they see activities that enhance the pre- and post-game experience.
Additionally, teams are preparing for games more as a professional organization. Teams’ conditioning and use of analytical tools (and their resultant tactical plans) have both improved; these improvements are reflected in tighter play and fewer careless sequences at crucial times in the game.
The Momentum Is Real and Hard to Ignore
Vanier Cup is creating a consistent foundation, not a one-time spike in awareness or interest. Every year adds new fans who will continue to follow U Sports Football if the product continues to deliver on its promise. As long as this trend continues, there will be less difference between university and mainstream football. Miss this opportunity now, and you’ll be trying to catch up later.
Disclaimer: This is a Press Release provided by a third party who is responsible for the content. Please conduct your own research before taking any action based on the content.


Lawyer defeats contempt charge for defending Palestine Action clients
‘I don’t normally like this’: Barcelona coach reacts to Lamine Yamal waving Palestine flag | Football News

Bottles of Blue Water Spell Out Every Passing Minute on This Unique Digital Clock
Manchester United reach agreement with Casemiro over contract clause amid transfer speculation

US brings back mandatory military draft registration

Steven Gerrard disagrees with Gary Neville over ‘shock’ Chelsea and Arsenal claim | Football

XRP Ripple Believe IT or NOT, XRP USE CASE ONLY FLARE Delivers, SBI LEADS with XRP CANTON SOLANA ETH

$30,000 XRP BUYBACK WON’T HAPPEN! – DTCC IS JUST ONE XRP SWITCH – BRAD SAYS IT ALL CONNECTS TO XRP!

Tom Lee: Bitcoin is Headed to $200,000 And It’s Happening NOW!
-
 Crypto World4 days ago
HarrisX Poll Found 52% of Registered Voters Support the CLARITY Act
-

 Fashion4 days ago
Weekend Open Thread: Marianne Dress
-

 Crypto World5 days ago
Upbit adds B3 Korean won pair as Base token gains Korea access
-
 NewsBeat5 days ago
NCP car park operator enters administration putting 340 UK sites at risk of closure
-

 Fashion23 hours ago
Coffee Break: Travel Steam Iron
-

 Fashion2 days ago
What to Know Before Buying a Curling Wand or Curling Iron
-

 Tech2 days ago
Auto Enthusiast Carves Functional Two-Stroke Engine from Solid Metal
-

 Politics18 hours ago
What to expect when you’re expecting a budget
-

 Politics3 days ago
Politics Home Article | Starmer Enters The Danger Zone
-
 Business3 days ago
Ignore market noise, India’s long-term story intact, say D-Street bulls Ramesh Damani and Sunil Singhania
-

 Tech1 day ago
GM Agrees To Pay $12.75 Million To Settle California Lawsuit Over Misuse Of Customers’ Driving Data
-

 Crypto World6 days ago
BlackRock CEO Larry Fink Discusses a New Asset Class
-

 Entertainment5 days ago
Sarah Paulson Called Out For Met Gala ‘Hypocrisy’
-
 Sports6 days ago
NBA playoff winners and losers: Austin Reaves is not loving Lakers vs. Thunder matchup, but Chet Holmgren is
-

 Entertainment6 days ago
Bold and Beautiful Early Spoilers May 11-15: Steffy Revolted & Liam Overjoyed!
-

 Entertainment5 days ago
General Hospital: Ric & Ava Bombshell – Ric’s Massive Secret Exposed!
-

 Crypto World6 days ago
Robinhood says Wall Street is building onchain
-

 Politics5 days ago
Simon Cowell Says He Was ‘Horrible’ To Susan Boyle During BGT Audition
-

 Sports5 days ago
UEFA Champions League final schedule, teams, venue, live time and streaming | Football News
-

 Tech7 days ago
Apple and Samsung are dominating smartphone sales so thoroughly that only one other company makes the top 10
You must be logged in to post a comment Login