
Crypto World
We Hacked This New Chinese AI to Predict the Price of XRP, Solana and Shiba Inu By the End of 2026

When prompted with careful instructions, Alibaba’s KIMI AI model generates explosive price projections for XRP, Solana, and Shiba Inu over the next eleven months.
The model suggests that all three major altcoins will deliver fresh all-time highs (ATHs) this year. Below is KIMI AI’s assessment of all three cryptocurrencies that it believes may be smart plays.
XRP ($XRP): KIMI AI Predicts XRP Could MOON to $30 by 2027
Ripple’s XRP ($XRP) entered 2026 with strong momentum, climbing 19% during the first week of the year.
Currently priced around $1.76, KIMI AI estimates that XRP could rise as high as $30 by the end of 2026. That outlook implies upside of roughly 1,600%, or more than seventeen times today’s valuation.
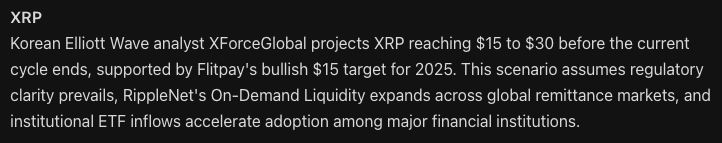
Last July, it posted its first new ATH in seven years, reaching $3.65 after Ripple secured a landmark legal win against the U.S. Securities and Exchange Commission, a decision that significantly reduced regulatory uncertainty around altcoins.
From a technical angle, XRP’s Relative Strength Index (RSI) is hovering near 43, indicating lingering selling pressure amid the current correction. However, since the New Year, the support and resistance lines have formed a bullish flag formation. Favorable macroeconomic trends and clearer regulatory guidance could trigger a breakout aligned with KIMI AI’s $15 to $30 projection.
Adding to the positive outlook, recently approved spot XRP ETFs in the United States are beginning to attract interest from traditional investors, mirroring early capital inflows seen after the launch of Bitcoin and Ethereum ETFs.
Solana (SOL): Alibaba AI Targets $650 for SOL
The Solana ($SOL) ecosystem now supports more than $9.3 billion in total value locked (TVL) and commands a market capitalization above $66.5 billion, underpinned by consistent growth in both developers and active users.
Demand for SOL has increased following the introduction of Solana-based ETFs from major asset managers such as Bitwise and Grayscale.
After a steep pullback late in 2025, SOL has spent recent months consolidating near a critical support zone and currently trades around $118. A substantial recovery may hinge on Bitcoin reclaiming the $100,000 level, a milestone many expect sooner rather than later.
Under KIMI AI’s most optimistic assumptions, Solana could climb to $1,000 by 2027. That move would represent around 750% upside from current levels and would more than triple SOL’s previous ATH of $293, recorded last January.
Institutional adoption continues to reinforce Solana’s long-term growth narrative. The network is increasingly being used for real-world asset tokenization, with firms like Franklin Templeton and BlackRock highlighting Solana’s expanding role within traditional financial markets.
Shiba Inu (SHIB): KIMI AI Projects 1,000% Returns for 2026 SHIB Holders
Shiba Inu ($SHIB), launched in 2020 to rival Dogecoin, has grown into a sizeable crypto ecosystem with a very distinct community that has helped the project hit a market capitalization of approximately $4.3 billion.
Trading near $0.000007311, KIMI AI indicates that a decisive break above resistance between $0.000025 and $0.00003 could spark a sharp rally, potentially driving SHIB to a new ATH by Christmas.
Shiba Inu’s last ATH of $0.00008616 was set in October 2021 at the height of the bull run. Recapturing this mark would give current SHIB holders 1,078.5% returns from today’s price.
Right now, SHIB is trading below its 30-day moving average with a relatively low relative strength index (RSI) reading of 38, which means the token is trading at a relative discount right now after falling 12.5% in the last fortnight due to bearish markets.
However, from a fundamentals perspective, Shiba Inu offers more than just entertainment. Its Layer-2 network, Shibarium, delivers faster transactions, lower fees, enhanced privacy, and improved developer tools, helping differentiate SHIB from other meme coins and giving it plenty of staying power.
Maxi Doge (MAXI): A Meme Coin Built for Extreme Swings
Outside of KIMI AI’s coverage, Maxi Doge ($MAXI) has emerged as one of January’s most talked-about meme coin presales, raising over $4.5 million ahead of its first exchange listings.
The project brands itself as Dogecoin’s loud, gym-bro distant cousin, fully embracing over-the-top meme culture aesthetics and the fun cartoony spirit that originally fueled the meme coin phenomenon.
Maxi Doge is quietly building a community to challenge Dogecoin’s dominance, appealing to traders drawn to high-risk speculation, viral momentum, and unapologetically degen vibes.
MAXI is issued as an ERC-20 token on Ethereum’s proof-of-stake network, giving it a lower environmental footprint than Dogecoin’s proof-of-work model.
Currently, presale participants can stake MAXI for yields of up to 68% APY, with rewards designed to decline as more users join. The token is currently trading at a price of $0.0002801, with automatic price increases at each presale stage. You can purchase it through MetaMask and Best Wallet.
Move over, Dogecoin. Maxi Doge is the new alpha in Memesville now!
Stay updated through Maxi Doge’s official X and Telegram pages.
Visit the Official Website Here
The post We Hacked This New Chinese AI to Predict the Price of XRP, Solana and Shiba Inu By the End of 2026 appeared first on Cryptonews.

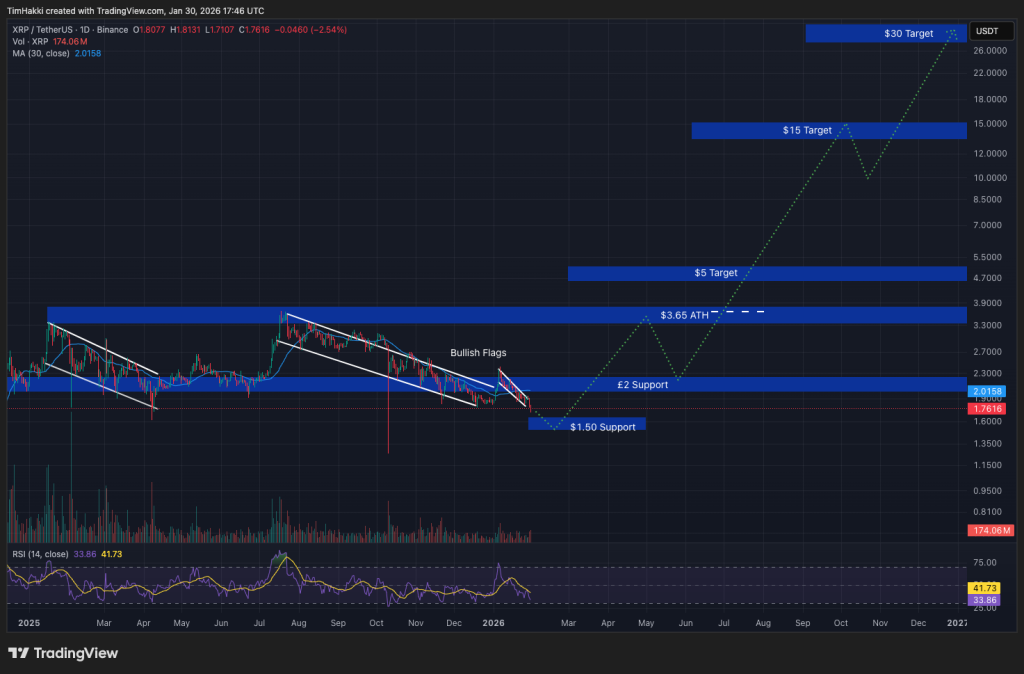
Two New York Stock Exchange-affiliated exchanges have removed the 25,000 contract position limit on options tied to 11 crypto exchange-traded funds.
NYSE Arca and NYSE American each filed three rule changes in the Federal Register on March 10 to remove contract position limits and price discovery restrictions for options linked to Bitcoin (BTC) and Ether (ETH) ETFs listed on their exchanges.
These were acknowledged by the Securities and Exchange Commission on Sunday, with the SEC waiving the standard 30-day waiting period for both sets of proposed rule changes, meaning they are now in effect.

The limits were imposed when crypto ETF options first started trading in November 2024. Limits of this nature are typically imposed to prevent market manipulation and volatility. T
The removal of those limits now puts them closer to how other commodity ETF options are treated, and gives institutions greater trading flexibility while also potentially boosting liquidity and making it easier to enter and exit positions.
It also allows the crypto options to be traded as FLEX options, which include customizable terms such as non-standard strike prices, expiration dates and exercise styles.
Related: Scaramucci says BTC’s 4-year cycle still in play, forecasts rise in Q4
A total of 11 crypto ETF options are affected by the rule changes, including BlackRock’s iShares Bitcoin Trust (IBIT), Fidelity’s Wise Origin Bitcoin Fund (FBTC) and ARK 21Shares Bitcoin ETF (ARKB).
Bitcoin and Ether ETFs issued by Bitwise and Grayscale are also affected.
In late July, the SEC approved removing the 25,000-contract position limit for the Grayscale Bitcoin Trust ETF (GBTC).
Meanwhile, one of Nasdaq’s options exchanges, Nasdaq International Securities Exchange, is seeking to raise the contract position limit for BlackRock’s IBIT to 1 million.
That proposed rule change is still under review, according to a Feb. 27 notice from the SEC.
Magazine: Would Bitcoin really be at $200K if not for Jane Street? Trade Secrets
Crypto World
Attacker exploits Resolv USR stablecoin to mint 80 million tokens, cashes out $25M: Resolv Labs


An attacker has successfully exploited the Resolv USR stablecoin protocol, minting 80 million tokens and withdrawing at least $25 million before the depeg.
An attacker has exploited Resolv Labs’ USR stablecoin to mint 80 million tokens, causing the stablecoin to depeg from its $1 peg. The attacker has reportedly cashed out at least $25 million from the exploit, marking a significant security breach for the protocol.
The incident represents a critical failure in Resolv Labs’ token minting controls and represents a major loss for USR holders and the protocol. Stablecoin exploits of this magnitude underscore ongoing risks in DeFi protocols, particularly around access controls and minting mechanisms.
Sources: ResolvLabs on X, PeckShieldAlert on X
This article was generated automatically by The Defiant’s AI news system from publicly available sources.
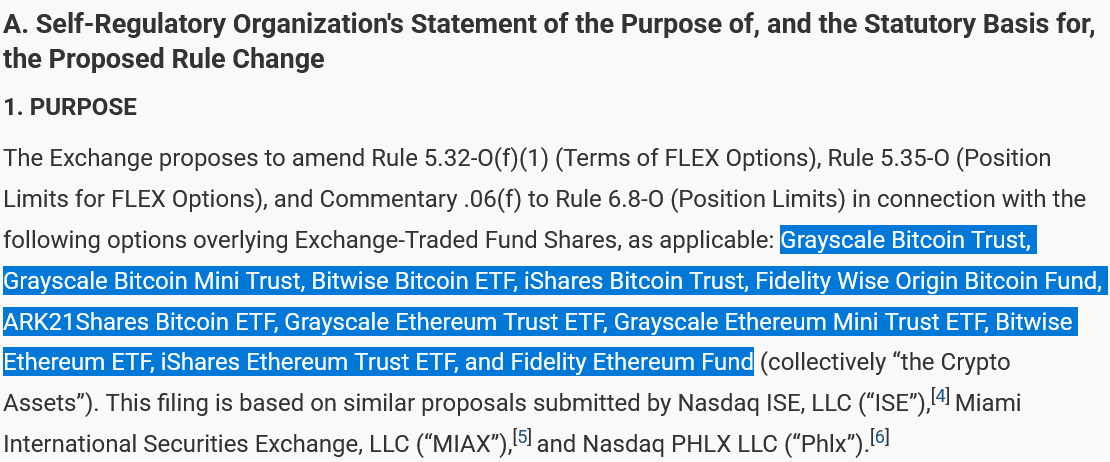
Banks are exploring tokenized deposits as they test ways to move commercial bank money onto blockchain-based payment and settlement infrastructure, according to a new report from real-world asset data platform RWA.io
The report, which was authored by RWA.io with contributions from industry participants including UK Finance, Citi, BNY, JPMorgan’s Kinexys, Standard Chartered, ABN Amro and Digital Asset, argues that tokenized deposits are emerging alongside stablecoins and central bank digital currencies as part of a broader onchain cash stack.
Tokenized deposits are digital representations of traditional bank deposits on blockchain or other distributed ledger infrastructure. Unlike many stablecoins, they are direct liabilities of the issuing bank and sit within existing banking frameworks, including deposit insurance, capital requirements, and Anti-Money Laundering and Know Your Customer rules.
The report points to a growing set of bank pilots and deployments in Europe. In January, Lloyds Banking Group and Archax said they completed the UK’s first public blockchain transaction using tokenized deposits on the Canton Network, while UK Finance’s Great British Tokenised Deposit pilot is testing person-to-person marketplace payments, remortgaging and digital-asset settlement through mid-2026.
The broader push reflects how banks are trying to preserve their role in payments, treasury and deposit-taking as digital cash instruments multiply.

Tokenized deposits as a middle ground in the stablecoin, CBDC debate
UK Finance said in the report that tokenized deposits will play a vital role in a future “multi-money” world. The industry group said tokenized deposits will complement other forms of digital money, “including privately and potentially publicly issued monies.”
Related: BNY launches tokenized deposits amid TradFi rush into blockchain and crypto
Marko Vidrih, the co-founder and chief operating officer at RWA.io said that while much of the attention in digital money focuses on stablecoins or central bank digital currencies (CBDCs), the global financial system still runs on commercial bank money.
“Bringing that money onto digital rails will underpin the next generation of digital finance,” Vidrih said. “For that reason, it is important to understand how tokenized deposits fit within the broader digital money ecosystem alongside stablecoins and CBDCs.”
ECB advances digital euro work, builds tokenized money rails
The European policy backdrop is moving in parallel. The European Central Bank is advancing work on a digital euro as US dollar-backed stablecoins continue to dominate digital asset markets and cross-border transactions.
The ECB recently opened applications for experts to contribute to workstreams focused on how a digital euro would function across ATMs, payment terminals and acceptance infrastructure. The ECB has also said it aims to begin a 12-month pilot for the digital euro in the second half of 2027.
In March, the European Central Bank unveiled Appia, its long-term plan for how tokenized financial markets in Europe could work using central bank money. A key part of that plan is Pontes, a new settlement mechanism designed to let blockchain-based financial platforms connect to the Eurosystem’s existing payment infrastructure.
That existing infrastructure is known as TARGET Services, which already processes large-value euro payments, securities settlement and instant payments across Europe. The ECB said Pontes is scheduled to launch in the third quarter of 2026, while feedback gathered through Appia’s consultation process will help shape the wider framework for Europe’s tokenized financial system.
Magazine: Are DeFi devs liable for the illegal activity of others on their platforms?

The 2026 split between gold and Bitcoin is being read through the lens of two distinct buyer groups, according to Stephen Coltman, head of macro at 21Shares, a provider of crypto exchange-traded products. While gold has benefited from a sustained wave of central-bank purchases, Bitcoin remains largely a retail asset, with ownership concentrated among individuals rather than institutions. Coltman framed the dynamic as a macro-driven divergence that could persist as fundamentals evolve.
Physical gold has a greater geopolitical strategic role currently, as the asset of choice for state actors who want to store wealth in a way that is protected from rival powers. This has meant that it has traded with greater sensitivity to deteriorating international relations.
On the other hand, Bitcoin’s practical appeal centers on everyday users seeking resilience amid financial stress. Coltman notes that BTC has significant appeal as an alternative lifeline when local banking infrastructure falters or access to the traditional financial system is constrained, a feature that becomes particularly salient during crises. This contrast helps explain why gold and Bitcoin can diverge at the same time, even as investors watch both assets for different kinds of hedging and exposure.
Coltman also highlighted the inverse correlation between BTC and gold, suggesting that investors may benefit from holding both assets to tap into their respective strengths—gold as a strategic reserve and Bitcoin as a mobile, permissionless financial option during disruptions.
Macro forces through most of the last few years pushed gold to a record run, with the precious metal climbing toward near $5,600 per ounce in January 2026. Yet heightened volatility and swift drawdowns pulled prices back to roughly $4,497 per ounce, renewing the debate about gold’s role as a store of value and how it will fare against Bitcoin in the medium term.
Key takeaways
- Gold’s rally has been driven predominantly by central-bank purchasing, while Bitcoin remains more retail-led in ownership and demand.
- The BTC–gold relationship tends to move inversely, suggesting a potential diversification benefit for investors who allocate to both assets.
- January 2026 saw gold scaling multi-decade highs near $5,600/oz, followed by a retreat to around $4,500/oz amid renewed volatility.
- Analysts diverge on the long-term leadership: some see BTC outperforming gold over the next few years, while others argue gold’s reserve-asset status strengthens its staying power.
Two camps on future dominance: BTC versus gold
Among market observers, the tug-of-war between Bitcoin and gold persists as a central theme for the years ahead. Macro economist Lyn Alden contends that Bitcoin is likely to outperform gold over the next three years, arguing that the existing rally in gold could face diminishing returns in the next cycle. As Alden put it in discussions cited in coverage around these views, the pendulum typically swings between the two assets, and heavy gains for gold could temper BTC’s upside in the near term.
But not everyone sees Bitcoin eclipsing gold. Ray Dalio, the famed hedge-fund veteran, maintains that BTC will not replace gold as a store of value. He points to Bitcoin’s exposure to risk-on dynamics and its correlation with technology equities, whereas gold carries entrenched status as a reserve asset within the global banking system. The debate underscores a broader question: which asset better preserves wealth across regimes of stress and monetary policy shifts?
Geopolitics, crises, and the case for 24/7 access
The 2026 period has also underscored the practical differences between the two assets during real-world events. Coltman cited episodes such as the Iran-related conflict, where financial infrastructure and market access in some regions faced disruption. In such moments, the appeal of a global, 24/7 settlement layer—Bitcoin—appears to offer continuity when traditional financial rails are strained. That sense of resilience helps explain why BTC can behave differently from gold in the same geopolitical environment.
The dynamic is not purely academic. In times of stress, gold’s geopolitical role as a state-aligned wealth store remains a stabilizing force for many investors who seek a traditional hedge within a framework of central-bank policy and international relations. Yet Bitcoin’s ability to function as a borderless, permissionless asset during crises adds a complementary edge for those who want an alternative pathway to financial access when banks and payments networks are disrupted.
What to watch next
As macro and geopolitical headwinds evolve, the balance between gold and Bitcoin will hinge on central-bank action, inflation dynamics, and how effectively both assets penetrate different investor cohorts. For traders and portfolio builders, monitoring central-bank balance-sheet trends, currency stability in stressed regions, and the pace of retail adoption for Bitcoin will be essential to gauge which asset gains resilience in the next phase of the cycle. The core tension—whether gold’s reserve role or Bitcoin’s crisis-resilience will lead—remains unresolved, but the ongoing dialogue among analysts signals that both assets will continue to play meaningful, albeit distinct, roles in diversified crypto and traditional portfolios.
Investors should stay alert to shifting macro signals and geopolitical developments, as these factors will continue to shape how gold and Bitcoin interact in 2026 and beyond. The landscape remains uncertain, but the case for a dual exposure—benefiting from the unique strengths of each asset—appears to be a persistent theme for informed market participants.

TLDR:
- Bitmine holds 4.6 million ETH, with 3 million actively staked and generating around $180 million annually.
- Ethereum’s 2.8% staking yield cuts the cost gap, meaning Lee needs only 8–9% more to match Saylor’s offer.
- Bitmine has been acquiring over 60,000 ETH weekly, building a low cost basis ahead of any product launch.
- Unlike Bitcoin, Ethereum’s native protocol yield subsidizes the dividend structure, making the flywheel self-reinforcing.
ETH Stretch may be the next big institutional product to emerge in the crypto market. Bitmine, led by strategist Tom Lee, currently holds 4.6 million ETH.
That figure represents nearly 4% of Ethereum’s total circulating supply. Of that holding, 3 million ETH is actively staked, generating around $180 million per year in protocol rewards.
Analyst Axel Bitblaze recently argued that Lee has the infrastructure to launch a Stretch-style fixed-yield product on this existing base.
Ethereum Staking Yield Creates a Structural Cost Advantage
Michael Saylor’s Stretch product offers a fixed 11.5% yield, with all proceeds going into Bitcoin. This buying pressure has pushed hundreds of millions into BTC each week.
Many credit this as a key reason Bitcoin held above $69,000. Without this demand, some analysts suggest prices would sit near $50,000.
Tom Lee, however, already runs a yield engine that Saylor does not have. Bitmine’s staked ETH generates about 2.8% annually from Ethereum’s protocol.
That income covers part of any fixed dividend Lee would need to pay out. Lee would only need to generate an additional 8–9% to match Saylor’s offer.
Bitblaze noted on X that this cost structure allows Lee to undercut Stretch on yield expenses. That margin could make the product more attractive to institutional capital.
Wall Street typically responds well to yield products with stronger cost profiles. Staking income is a meaningful competitive edge in this space.
Additionally, Bitmine has been buying over 60,000 ETH per week in current market conditions. The firm’s cost basis remains low, and Ethereum sentiment is broadly negative.
Those two factors create a favorable window for any product announcement. A low cost basis combined with native yield strengthens the overall case considerably.
The Ethereum Flywheel and Its Reflexivity Potential
The mechanics of an ETH Stretch product follow a clear and self-reinforcing loop. Every dollar raised would go toward buying more ETH on the open market.
More ETH purchased means more ETH available for staking. More staked ETH then generates additional protocol rewards to help fund the dividend.
This cycle differs from Saylor’s model in one key respect: Ethereum has native yield. Bitcoin has no protocol income, yet the BTC Stretch flywheel has still gained traction.
Ethereum’s staking rewards subsidize the structure from the start. That makes the feedback loop cheaper to run and easier to grow.
Bitblaze argued that Saylor’s flywheel works despite Bitcoin having no yield. Lee’s version, by contrast, would run on Ethereum’s own protocol income.
That distinction changes the product economics entirely. A yield-backed demand engine does not rely solely on price appreciation. It draws strength directly from the Ethereum protocol itself.
Should Lee announce such a product while sentiment is low, the price response could be rapid. Institutional capital targeting yield would flow in, driving ETH demand higher.
Higher ETH prices improve staking returns in dollar terms, attracting still more capital. That loop, once active, tends to accelerate.

Crypto World
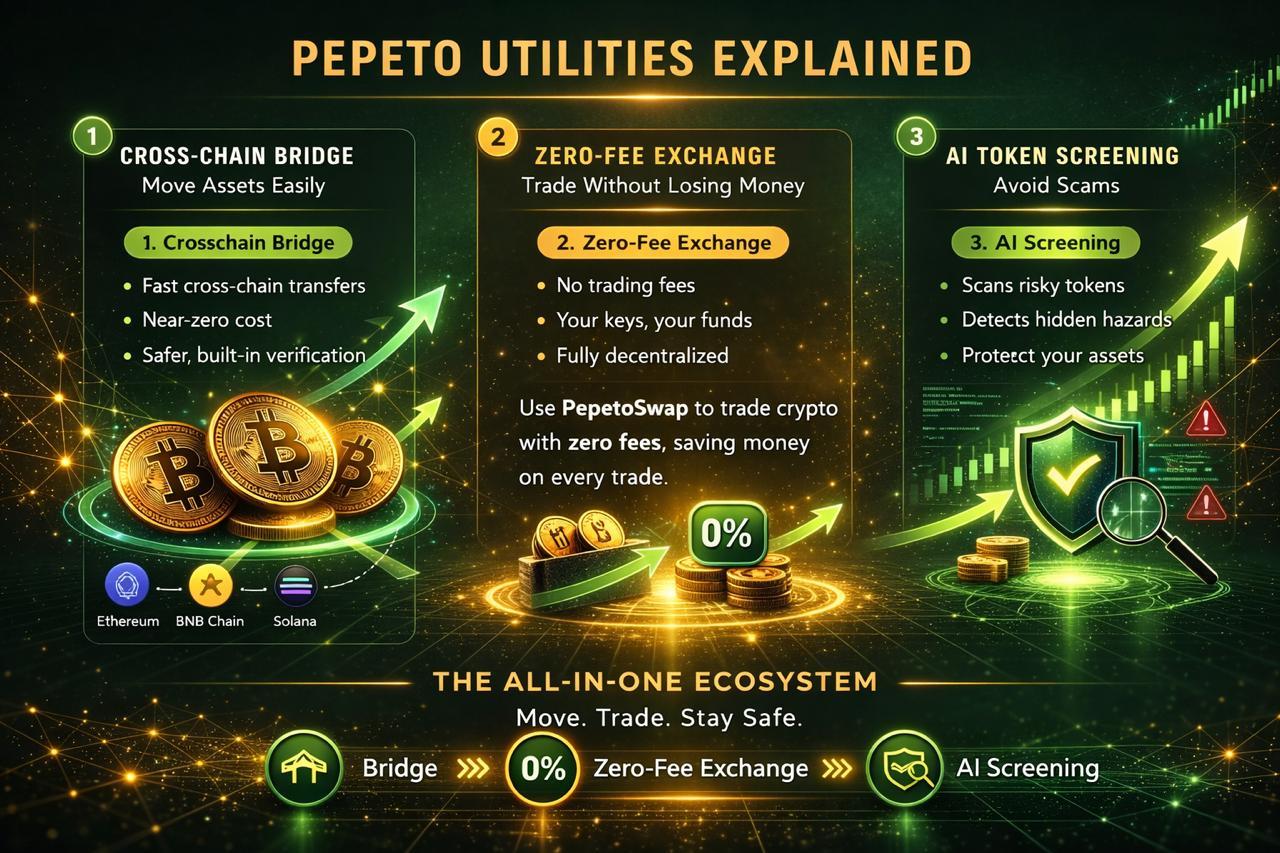
Ethereum Price Prediction: ETH Price Could Reach $2,500 as BNB Weakens and Pepeto Shows the Utility Gains That Matter
BlackRock launched the iShares Staked Ethereum Trust on March 12, and the fund pulled in $254 million in its first week, making it the fastest growing crypto ETF this quarter.
While the ethereum price prediction shows a path toward $2,500, Pepeto is drawing attention with exchange infrastructure already live, more than $8 million raised, and a Binance listing approaching. The wallets entering now are targeting returns the ethereum price prediction needs the full cycle to deliver.
Ethereum Price Prediction Gains Support After BlackRock Staked ETF Pulls $254 Million in One Week
BlackRock launched ETHB on March 12 on Nasdaq, staking 70% to 95% of its Ethereum holdings and paying investors roughly 82% of staking rewards through monthly payouts, according to CoinDesk.
The fund reached $254 million in assets within seven days, according to Decrypt. Goldman Sachs reported over $1 billion in Ethereum ETF holdings, and Larry Fink called blockchain infrastructure necessary at Davos this year.
The ethereum price prediction has institutional money behind it, but from $2,083 the path to $2,500 is a 20% move that takes patience.
Ethereum Price Prediction and the Presale Offering Returns ETH Cannot Match
Pepeto
As rug pulls grow more common, the cost of entering a project without checking its contracts keeps rising. Every cycle, traders lose more capital to scams that grow harder to detect with each new method. Doing your own research takes hours most people do not have, and it still misses the risks buried in smart contract code.
Pepeto was designed to end that problem before your money is at risk. The exchange is already running while the presale fills. The risk scorer examines every contract for hidden traps and scam patterns, giving you a clear answer in seconds instead of hours of digging through code, so you act with confidence instead of guessing.

The cofounder who took the original Pepe coin to $11 billion with nothing is now building an exchange with zero fee trading, cross chain transfers at zero cost through the bridge, and a SolidProof audit completed before the presale opened. A former Binance expert is on the dev team, 195% APY staking compounds in wallets that positioned early, and the presale has crossed more than $8 million with the Binance listing approaching.
At $0.000000186 with the same 420 trillion supply that reached $11 billion under Pepe, matching that market cap is over 150x, and Pepeto has the exchange infrastructure Pepe never built. The wallets filling the presale are taking the entry that disappears the moment trading begins, and the holders who are not inside yet are the ones who will spend this cycle wishing they had moved.
Ethereum Price Prediction: Can ETH Reach $2,500 With BlackRock Leading Institutional Demand?
ETH trades near $2,083 as of March 22, holding above the $2,000 support that formed a floor since mid February, according to CoinMarketCap.
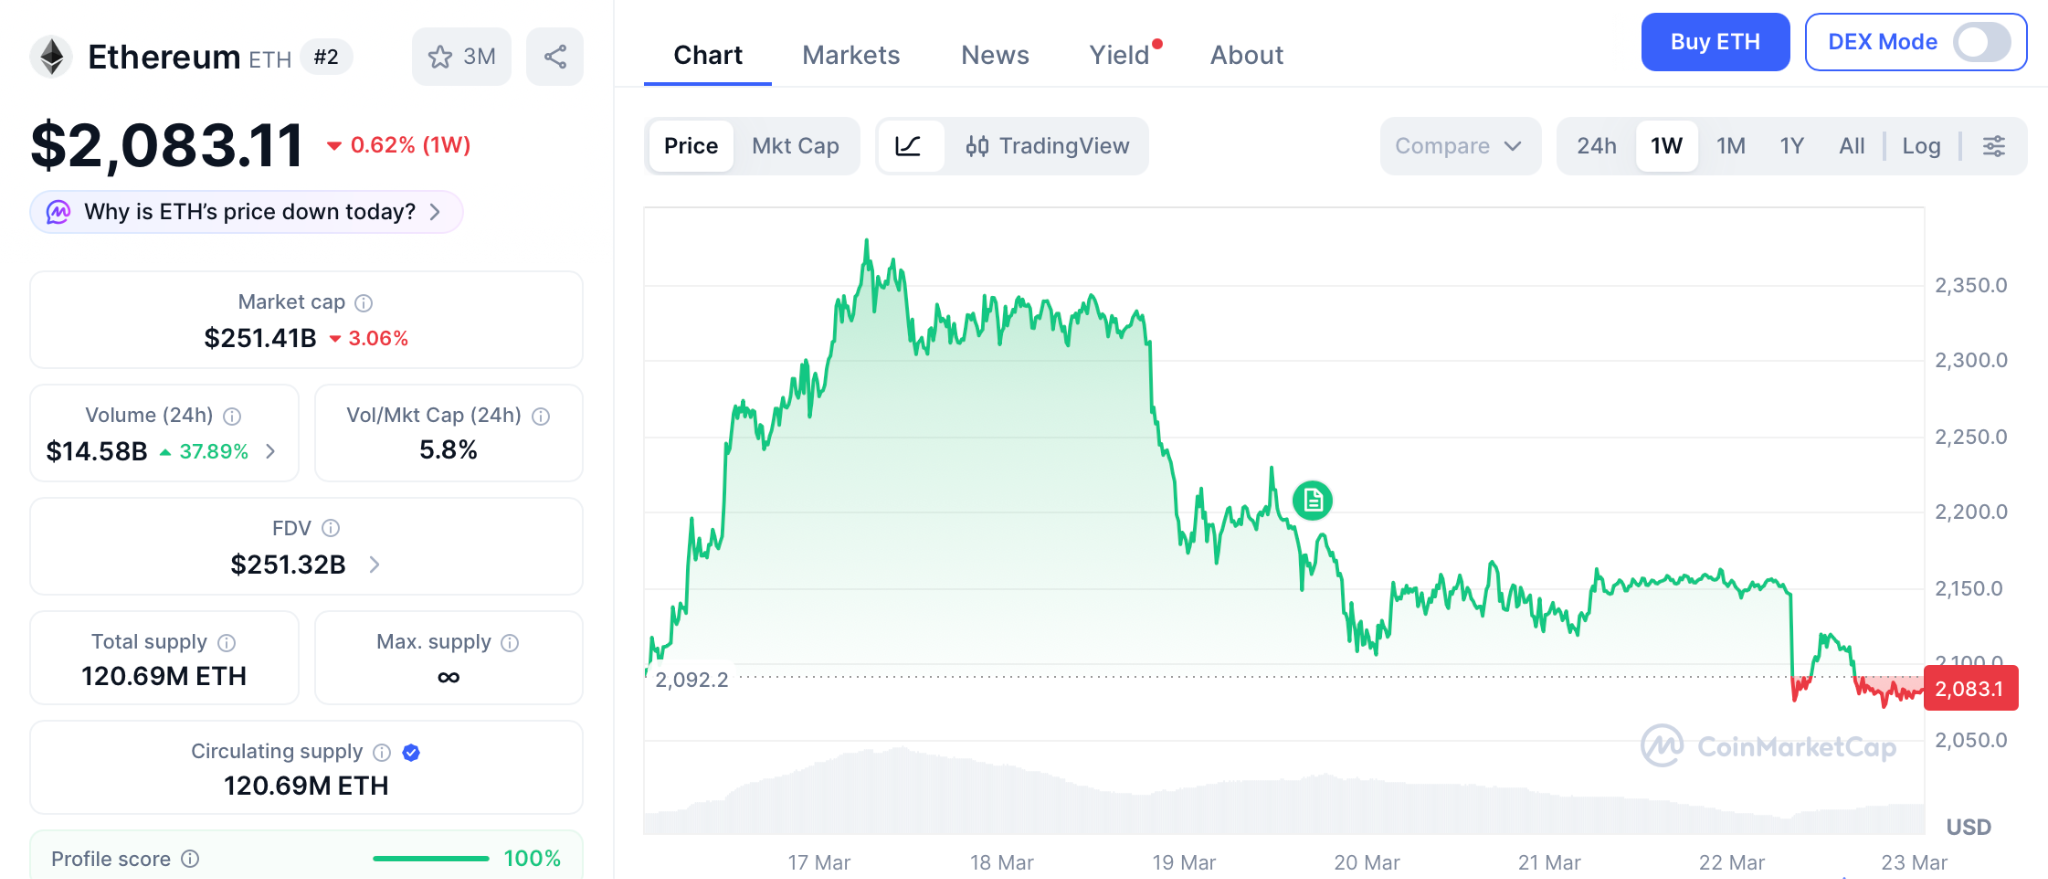
BlackRock’s ETHA holds $6.5 billion and the new staked ETHB already sits at $254 million after one week. Resistance levels form at $2,235 and $2,380, and if both break cleanly the next ethereum price prediction target is $2,500.
Losing $2,000 could trigger a pullback toward $1,800. Even the bullish $2,500 scenario is a 20% move from current prices, a return that requires months of positive conditions and institutional follow through.
BNB
BNB trades near $631 as of March 22, steady despite the broader correction, according to CoinMarketCap. The Binance ecosystem keeps BNB supported, but from $631 the token needs to reclaim $720 before any meaningful run begins.
A 2x requires BNB above $1,200, a level it has never held. Neither the ethereum price prediction nor BNB delivers the distance a presale to exchange listing compresses into the moment trading opens.
Ethereum Price Prediction Points to $2,500 but the Presale Entry Points to Where Wealth Was Built
The ethereum price prediction has BlackRock behind it, the staked ETF is pulling institutional money, and the $2,500 target is realistic. But the smart money wallets filling Pepeto at presale pricing are building positions that expect returns ETH from $2,090 takes years to match.
The crypto news will cover this moment after the Binance listing, and the only question is whether you lock in your position on the Pepeto official website today or pay a higher price later from wallets that moved while you were still reading about ETH.
BlackRock is staking ETH for 3% yield. The wallets inside Pepeto are targeting 150x, decide which return fits this cycle.
Click To Visit Pepeto Website To Enter The Presale

FAQs
What is the ethereum price prediction for today?
The ethereum price prediction targets $2,500 if ETH holds above $2,000 support. Investors seeking faster returns are looking at Pepeto, where matching Pepe’s market cap is over 150x from presale.
Why is Pepeto trending alongside the ethereum price prediction?
Pepeto has become the presale drawing the most capital because it combines a working exchange with the same supply that took Pepe to $11 billion, positioning it for returns ETH cannot match from $2,083.
How does the ethereum price prediction compare with early presales like Pepeto?
The Pepeto official website offers a presale where the Binance listing compresses the return window into days, while the ethereum price prediction from $2,083 to $2,500 is a 20% move requiring months.
Disclaimer: This is a Press Release provided by a third party who is responsible for the content. Please conduct your own research before taking any action based on the content.
TLDR:
- Trump issues 48-hour ultimatum demanding Iran reopen the Strait or face power plant strikes.
- Iran warns of full closure of the Strait and retaliation against regional energy infrastructure.
- Tanker traffic dropped 90%, increasing concerns over global oil supply and market stability.
- Iranian officials list potential targets, including Israel and US-linked energy assets.
Iran war live Trump Strait of Hormuz tensions intensified after a 48-hour ultimatum triggered threats of energy infrastructure attacks, raising risks of wider regional escalation and disruption to global oil transit routes.
Trump Issues 48-Hour Ultimatum
The United States has issued a direct warning to Tehran. In his statement, President Donald Trump demanded that Iran fully reopen the Strait within 48 hours.
He threatened attacks on major Iranian power plants if the demand is ignored. The ultimatum highlighted the strategic significance of the Strait of Hormuz, through which a significant portion of global oil shipments pass.
Tanker traffic has already fallen by nearly 90% in recent weeks, raising concerns about energy supply disruptions worldwide.
Trump’s statement did not clarify whether nuclear-linked power plants, such as Bushehr, would be included in the strike. This uncertainty added to regional tension, as the potential for collateral damage remains high.
“If Iran doesn’t FULLY OPEN the Strait, the US will hit major power plants first,” Trump’s statement read, reflecting the firm deadline.
Iran Warns of Retaliation and Regional Impact
Iranian officials outlined a detailed response as spokesperson Ebrahim Zolfaghari confirmed that the Strait remains partially open under controlled access. He however, warned that any strike on power plants would trigger immediate retaliation.
Iran indicated that a full closure of the Strait would follow any attack, with reopening dependent on reconstruction of damaged infrastructure.
Officials also listed potential regional targets, including power plants in Israel, companies with American shareholders, and energy infrastructure in countries hosting US bases.
Iran’s parliament speaker, Mohammad Bagher Ghalibaf, further emphasized the scale of potential consequences. He warned that attacks on Iranian infrastructure could lead to the irreversible destruction of energy networks across the Gulf, maintaining elevated oil prices for an extended period.
Previous demonstrations of Iran’s reach, such as the strike on Qatar’s Ras Laffan LNG terminal, showed the country’s capability to disrupt regional energy systems.
Regional and international actors are monitoring the situation closely, highlighting the strategic and economic stakes.
Iran war live Trump Strait of Hormuz tensions remain critical as the 48-hour deadline approaches, with both sides maintaining firm positions and regional stability at stake.
The divergence between gold and Bitcoin (BTC) in 2026 can be explained by two distinct segments of buyers, according to Stephen Coltman, head of macro at crypto exchange-traded product (ETP) provider 21Shares.
Gold’s rally over the last three years has been primarily fueled by central bank buying, while Bitcoin is more widely held by individuals than financial institutions, Coltman told Cointelegraph. He said:
“Physical gold has a greater geopolitical strategic role currently, as the asset of choice for state actors who want to store wealth in a way that is protected from rival powers. This has meant that it has traded with greater sensitivity to deteriorating international relations.”
However, BTC has more utility for individuals who may use it as an alternative “lifeline” when local banking infrastructure fails during times of crisis, and accessing the traditional financial system is not possible.

“Shortly after the conflict started, both the Dubai and Abu Dhabi exchanges were shut down following missile and drone strikes from Iran,” which, he said, is a “stark reminder” of how valuable 24/7 access is in wartime situations or other emergencies.
Coltman told Cointelegraph that the inverse correlation between BTC and gold means that investors should hold both to benefit from each asset’s unique properties.
Ongoing macroeconomic and geopolitical shocks over the last several years drove gold to an all-time high of nearly $5,600 per ounce in January 2026.
However, heightened volatility dragged the precious metal back down to about $4,497 per ounce, leading to renewed debate among analysts about gold’s role as a store of value asset, and how it will perform against Bitcoin in the coming years.
Related: Bitcoin vs gold shows potential bottom signals as BTC bulls defend $70K
Financial analysts are split on gold versus BTC dominance
Bitcoin is likely to outperform gold over the next three years, according to macroeconomist Lyn Alden.
“It’s usually a pendulum between the two. If gold has gone up as much as it did, the entire diminishing return story per cycle is going to be erased in the coming one, too,” Alden said.
However, former hedge fund manager Ray Dalio expects that BTC will never replace gold as a store-of-value asset because it still trades like a risk-on asset with correlation to technology stocks, while gold is entrenched as a reserve asset in the banking system.
Magazine: Is China hoarding gold so yuan becomes global reserve instead of USD?
Crypto World
Hyperliquid Surpasses 218,000 Active Traders as Crude Oil Perpetuals Hit $300 Million Open Interest
TLDR:
- Hyperliquid’s active perpetual traders reached 218,340, marking a fresh local high with a 2.14% 24-hour gain.
- Crude oil perpetuals crossed $300M in open interest, overtaking every crypto and equity pair on Hyperliquid.
- Hyperliquid’s HIP-3 markets surpassed $1.43B in total open interest as platform activity hit an all-time high.
- Real-world assets including commodities, stocks, ETFs, and FX now account for roughly 30% of platform volume.
Hyperliquid is recording fresh activity highs across its perpetual trading platform in 2025. Active perpetual traders have reached 218,340, marking a new local high with a 24-hour gain of 2.14%.
Simultaneously, crude oil perpetuals on the platform have crossed $300 million in open interest. This figure places crude oil above every crypto and equity pair on the exchange.
Together, these numbers reflect a platform experiencing steady and measurable expansion this year.
Hyperliquid Trader Activity Recovers and Pushes Into New Territory
Hyperliquid’s active trader count has followed a notable recovery path over recent months. The platform peaked around November before pulling back sharply into January, dropping to roughly 150,000 active traders. That kind of reset typically stalls momentum on most trading platforms.
However, Hyperliquid began climbing again from late January onward. Since then, participation has moved steadily higher, reclaiming previous levels along the way. The platform has now pushed past its earlier highs into fresh territory.
According to data shared by Hyperliquid Hub on X, the platform went from around 127,000 traders in August to over 218,000 today.
That represents a broad expansion in user activity within less than a year. The growth has been gradual rather than driven by a single spike.
The post further noted a reinforcing dynamic: more traders bring more liquidity, which tightens spreads and improves execution.
Better execution, in turn, draws additional traders to the platform. This cycle has been building steadily through 2025 and continues to gain traction.
Crude Oil Perpetuals Lead Platform as Real-World Assets Drive Volume
Crude oil perpetuals have emerged as the largest market on Hyperliquid by open interest. The $300 million figure surpasses all crypto and equity pairs currently listed on the exchange. This development was reported by Delphi Digital and reflects a shift in what traders are engaging with.
Real-world assets, including commodities, stocks, ETFs, and foreign exchange pairs, now account for approximately 30% of overall platform volume.
That share represents a meaningful portion of activity. The growth of non-crypto markets on the platform has been a defining trend this year.
Hyperliquid’s HIP-3 markets have also crossed $1.43 billion in total open interest across all listed pairs. Active traders reached a new all-time high alongside this open interest figure. Both metrics moved higher together, suggesting broad participation rather than concentrated positioning.
The expansion into real-world assets marks a broader shift in how the platform is being used. Traders are no longer limited to crypto pairs when using Hyperliquid. The platform’s range of markets has grown, and so has the volume flowing through them.

Bitcoin (BTC) traded just below the $69,000 mark as traders braced for a pivotal weekly candle close, with prices hovering near the long-term line around $68,300. After a weekend slide, the setup underscores a tug-of-war between a fragile near-term outlook and the possibility of a contrarian move, even as analysts debate the significance of a fresh technical signal.
Historically, the 200-week exponential moving average has anchored multi-year cycles, but this year its reliability has been questioned. Cointelegraph has noted that the long-term EMA has failed to act as a clear support in 2026, complicating investor expectations for a durable bottom or renewed upside. As BTC approached the $68,300 region, traders watched to see whether the weekly close would restore any confidence in the metric or amplify the lingering bearish bias.
Key takeaways
-
Bitcoin remained under $69,000, testing the 200-week EMA near $68,300 as a critical reference point for the weekly close.
-
Market psychology tilted toward caution, with substantial liquidations signaling risk-off dynamics over the past 24 hours.
-
A fresh bullish tempo appeared with a golden cross developing between the 21-day and 50-day moving averages, but durability remains uncertain.
-
Analysts split on the path forward: some warn of continued macro downside even as near-term momentum offers a potential relief rally.
Weekend test of the long-term line
Trading data show BTC price action around the 200-week trend line, a level that has historically framed major cycles even as the asset wobbled through the weekend. The immediate vicinity of $68,300 serves as a focal point for whether bulls can sustain a bid above entrenched resistance or if sellers reassert control as the weekly close approaches.
Extended downside pressure in the days leading into the close produced notable liquidations across the market. CoinGlass reported that more than $300 million in long positions were liquidated, with roughly $100 million in shorts also liquidating in the same window. The liquidation profile underscores a risk-off environment in which traders are shrinking risk exposure into key technical junctures.
From a chart perspective, BTC’s motion around the 200-week EMA has reinvigorated debate about whether this line can again offer a meaningful foothold. In a broader 2026 context, some analysts have warned that the EMA’s traditional role as a durable support may be waning, complicating the interpretation of daily moves around this level.
Liquidity pressure and trader sentiment
The weekend action underscored a broader mood among market participants: risk appetite remains fragile as macro uncertainties persist. With a large portion of the futures market liquidated into the close, traders may adopt a cautious stance, awaiting a clearer directional cue from the weekly close and any subsequent macro catalysts.
In such a regime, the key question is whether the counter-move, if it occurs, can sustain momentum beyond a relief rally. The balance between safe-haven flows and renewed appetite for risk will likely define BTC’s trajectory over the coming sessions, particularly as market participants await more concrete signals from on-chain data, derivatives activity, and broader market liquidity conditions.
Momentum flicker: the Golden Cross and what it may imply
On the technical front, a visible positive signal emerged as the 21-day simple moving average crossed above the 50-day moving average, a formation often interpreted as a short-term momentum cue. Proponents of the setup cautioned that the cross could herald a temporary lift, though they emphasized that durability would hinge on subsequent price action.
Keith Alan, cofounder of trading resource Material Indicators, commented on the potential implications, saying the Golden Cross “will likely deliver some short term bullish momentum. Must watch to see if it develops into something durable.” He added a more cautious note, reflecting the prevailing sentiment: “For now…the range game continues.”
These near-term signals come after March saw two “death crosses” on BTC’s daily chart, a pattern historically associated with renewed downside pressure. The market’s interpretation of a Golden Cross in the current environment remains mixed: a possible spark for a bounce, but no guarantee of a sustained breakout without follow-through from higher timeframes.
Bearish undertones persist in higher timeframes
Several well-known traders have stressed that longer-horizon momentum remains skewed to the downside. A prominent analyst reiterated a bearish thesis for the macro cycle, highlighting ongoing fragility in higher timeframes despite any short-term bullish cues. The tension between near-term momentum signals and longer-term risk remains a defining feature of the BTC narrative as the market approaches another pivotal weekly close.
“There are still 0 signs of bear market exhaustion on HTF. No divs, no bear PA exhaustion, no momentum loss, etc.” He also noted a continued outlook for lower prices, saying, “I still have high confidence in seeing 50k and likely a bit lower.”
That sentiment sits alongside reminders from earlier periods that the market can swing on a few data points, even as long-run structural factors weigh on price discovery. The debate over whether BTC can muster a sustained recovery or slide toward new macro-driven lows remains unresolved, with bulls awaiting confirmation from price action and bears watching for any renewed downside momentum.
What readers should watch next
The immediate focus for BTC markets is the weekly candle close and how price behaves in the aftermath. If the price can hold above key support near the 200-week EMA and demonstrate follow-through above near-term moving averages, a cautious upside tilt could emerge. Conversely, failure to defend the region around $68,000–$68,300 may invite renewed selling pressure and retesting of lower support bands.
Investors should also monitor liquidity patterns and derivatives activity as they often foreshadow the next directional move. In addition, traders will be paying close attention to any shifts in macro sentiment or changes in the risk-on/risk-off appetite that can influence Bitcoin’s risk premium and its correlation with broader markets.
This ongoing narrative—between a fragile near-term bounce and the weight of higher-timeframe bears—will likely shape price action in the weeks ahead. As always, readers are advised to conduct their own research and consider how these developments fit their risk tolerance and investment horizon.

‘Very sad’ – Mikel Arteta reacts to Arsenal disappointment vs Man City in Carabao Cup

OMFG HE ADMITTED IT?!?! (XRP’s Real Price?!)
Retired paramedic releases memoir on facing the front-lines of the Troubles


-

 Fashion2 days ago
Weekend Open Thread: Adidas – Corporette.com
-

 Politics2 days ago
Jenni Murray, Long-Serving Woman’s Hour Presenter, Dies Aged 75
-
 Tech5 days ago
Are Split Spacebars the Next Big Gaming Keyboard Trend?
-
 Crypto World2 days ago
NIO (NIO) Stock Plunges 6.5% as Shelf Registration Sparks Dilution Worries
-

 Crypto World1 day ago
Best Crypto to Buy Now: Strategy Just Spent $1.57 Billion on Bitcoin During Fear While Early Investors Quietly Enter Pepeto for 150x Potential
-

 News Videos4 days ago
RBA board divided on rate cut, unusually buoyant share market | Finance Report | ABC NEWS
-

 Crypto World1 day ago
Bitcoin Price News: Bhutan Sells $72 Million in BTC Under Fiscal Pressure, but the Smart Money Entering Pepeto Sees What the Market Does Not
-

 Business7 days ago
Australian shares drop as Iran war enters third week
-

 Crypto World7 days ago
Crypto Lender BlockFills Enters Chapter 11 with Up to $500M in Liabilities
-

 Politics5 days ago
The House | The new register to protect children from their abusers shows Parliament at its best
-

 Fashion7 days ago
25 Celebrities with Curly Hair That Are Naturally Beautiful
-

 Tech3 days ago
inKONBINI Lets You Spend Summer Days Behind the Register
-
 Politics5 days ago
Real-time pollution monitoring calls after boy nearly dies
-

 Crypto World4 days ago
Canada’s FINTRAC revokes registrations of 23 crypto MSBs in AML crackdown
-
 NewsBeat4 days ago
Residents in North Lanarkshire reminded to register to vote in Scottish Parliament Election
-

 Business6 days ago
Meta planning major layoffs as AI spending and automation reshape workforce
-

 News Videos4 days ago
PARLIAMENT OF MALAWI – PAC MEETING WITH REGISTRAR OF FINANCIAL ON AMARYLLIS HOTEL – INQUIRY LIVE
-

 Business9 hours ago
No Winner in March 21 Drawing as Prize Rolls to $133 Million for Next
-
Entertainment7 days ago
Oscars reunite Rob Reiner supergroup of 17 stars for emotional tribute: Here's who appeared on stage
-

 Business4 days ago
Who Was Alex Pretti? 5 Key Facts About the ICU Nurse Killed by Federal Agents in Minneapolis
You must be logged in to post a comment Login