

Crypto World
What is alt season? And why it keeps not arriving


Alt season is the phase when altcoins outrun Bitcoin and portfolios go vertical. Traders have waited more than 260 days for the latest one. Here is what it is, how to measure it, and why it keeps failing to show up.
Summary
- Alt season, or altcoin season, is a sustained period when most altcoins outperform Bitcoin, often producing the largest percentage gains of a market cycle.
- It is measured by the Altcoin Season Index, which tracks how many of the top 100 altcoins beat Bitcoin over 90 days; above 75 is alt season, below 25 is Bitcoin season, and the index sits near 43 in mid-2026.
- The classic pattern is a rotation: Bitcoin rises first, then consolidates, and capital flows out into large-cap alts, then mid-caps, then small-caps.
- The reason alt season keeps not arriving in 2026 is a mix of a bearish Bitcoin far below its record, high Bitcoin dominance, and the ETF wall, where institutional money is locked into Bitcoin through regulated funds instead of rotating into alts.
- The index is reactionary, confirming an alt season only after it has begun, which is why chasing it late and rotating prematurely are the two most common and costly mistakes.
Alt season is the crypto market’s most anticipated and most argued-about phase. It is the stretch of a cycle when the thousands of coins that are not Bitcoin suddenly outrun it, and portfolios that spent months going nowhere go vertical. Traders wait for it, debate whether it has started, and often miss it. As of mid-2026, the wait has stretched past 260 days since the last confirmed alt season, long enough that some question whether the phenomenon still works the way it used to. This guide explains what alt season actually is, how it is measured, the rotation that drives it, and, most usefully right now, why it keeps failing to arrive.
What alt season is
An altcoin is any cryptocurrency other than Bitcoin, from large names like Ethereum, Solana, and XRP down to thousands of small tokens. Alt season is the phase of a market cycle when these altcoins, as a group, significantly outperform Bitcoin over a sustained stretch, typically weeks to a few months. During one, it is common for many altcoins to double or triple while Bitcoin moves sideways or rises more slowly, and the best-performing names can post gains of several hundred percent.
The defining feature is relative performance, not just rising prices. Altcoins can go up while Bitcoin also goes up; what makes it an alt season is that they go up more. Capital that had concentrated in Bitcoin spreads outward into the rest of the market, lifting a broad range of tokens and shifting attention, liquidity, and speculation toward new narratives and projects. It is the part of the cycle that produces the outsized returns crypto is famous for, and also the sharpest reversals when it ends.
Alt season is the counterpart to Bitcoin season, the phase when Bitcoin leads and altcoins lag. The market cycles between the two, and knowing which phase you are in is one of the most useful pieces of context a crypto participant can have, because the same portfolio behaves very differently depending on which is in force.
The Altcoin Season Index
The most-cited way to judge the phase is the Altcoin Season Index, a tool that turns the question into a single number. It measures how many of the top 100 altcoins, excluding stablecoins, have outperformed Bitcoin over the previous 90 days, and expresses that as a score from 0 to 100. The thresholds are simple: a reading above 75 signals a confirmed alt season, meaning at least three quarters of the leading altcoins beat Bitcoin over the window. A reading below 25 signals Bitcoin season, where altcoins are broadly lagging. Anything between 25 and 75 is a mixed or neutral market where no clear rotation has taken hold.
As of mid-2026, the index sits around 43, up sharply from June lows near 11 to 12 but still well short of the 75 needed to confirm rotation. That reading tells a precise story: altcoins have gained some strength off the bottom, with more of them starting to beat Bitcoin, but the market remains in neutral territory, leaning toward Bitcoin, not in an alt season. The jump from the low teens to the low 40s shows early signs of life without confirmation.
The index has one important weakness that every user should understand. It is built on a trailing 90-day window, which makes it a lagging, reactionary measure. By the time it climbs above 75 and confirms an alt season, much of the move has already happened, so the confirmation arrives after the best entry points have passed. The index is excellent for describing where the market has been and poor at predicting where it is going next.
Bitcoin dominance and the rotation
The companion metric is Bitcoin dominance, often written BTC.D, which is Bitcoin’s share of the total crypto market capitalization. When dominance is high, Bitcoin holds most of the market’s value; when it falls, value is shifting into altcoins. Traders watch dominance closely because a sustained decline is one of the clearest signs that capital is rotating out of Bitcoin and into the rest of the market, the essence of an alt season.
In mid-2026, Bitcoin dominance sits in the mid-to-high 50s, and analysts have flagged a sustained break below 55%, and ideally lower, as the threshold that would signal a real, broad rotation. Above that level, Bitcoin is still absorbing the market’s capital, and altcoins struggle to get sustained traction. The mechanism links dominance to the index: falling dominance means altcoins are gaining share, which shows up as more of them outperforming Bitcoin, which lifts the Altcoin Season Index. The two metrics describe the same rotation from different angles.
The reason dominance matters so much is that it captures the flow of money, not just price. An altcoin can rise in dollar terms while Bitcoin rises faster, in which case dominance climbs and it is still Bitcoin season despite green candles everywhere. Only when altcoins outpace Bitcoin does dominance fall and rotation begin. That is why seasoned traders watch dominance alongside price: it strips out the illusion that a rising market is automatically an alt season.
The four phases of the cycle
Alt season does not appear at random; it tends to arrive at a specific point in a repeating cycle with four rough phases. The first is accumulation, when prices stabilize near the bottom of a downturn and early buyers quietly build positions while sentiment is still poor. The second is the Bitcoin-led rally, when fresh capital enters the market and flows first into Bitcoin, the primary on-ramp, pushing it up and often to new highs while altcoins lag.
The third phase is where alt season lives. After Bitcoin rallies hard and then consolidates, moving sideways, holders who have made gains start looking for higher returns elsewhere and rotate capital into altcoins. This rotation is usually sequential instead of simultaneous: money moves first into large-cap alts like Ethereum, then into mid-caps, and finally into small-cap and speculative tokens as risk appetite grows. The fourth phase is the top and unwind, when euphoria peaks, the last speculative money piles into the smallest and riskiest coins, and the cycle eventually reverses into a downturn.
Understanding this sequence explains why alt season has a prerequisite that is often missed: it typically follows a Bitcoin rally to new highs and a consolidation. Without Bitcoin first leading and then pausing, there is no pool of Bitcoin gains to rotate, and no stable backdrop for capital to move out along the risk curve. The phase is not just a mood; it is a specific stage that depends on what came before it.
Why alt season keeps not arriving in 2026
This is the question on every trader’s mind, and the answer is a convergence of factors instead of a single cause. The first is the most basic: alt season usually follows a Bitcoin rally to new highs and a consolidation, and in 2026 Bitcoin has done the opposite. It sits far below its record, in a bearish, drawn-out drawdown, so the precondition of a fresh Bitcoin high that seeds rotation has simply not been met. There are no large Bitcoin gains sitting around waiting to rotate into alts when Bitcoin itself is down.
The second factor is dominance. Bitcoin dominance has stayed elevated in the mid-to-high 50s, above the threshold analysts see as necessary for broad rotation, which means capital keeps concentrating in Bitcoin instead of spreading out. The third, and the most structurally interesting, is the ETF wall. Spot Bitcoin exchange-traded funds have pulled enormous institutional capital into Bitcoin through regulated products, but that money is largely confined to Bitcoin. Unlike the retail flows of past cycles, which moved freely from Bitcoin into thousands of altcoins, institutional capital that enters through a Bitcoin ETF tends to stay in Bitcoin, because those investors gain crypto exposure through the fund and do not rotate down the risk curve into individual tokens. The channel that once carried money from Bitcoin into alts is partly blocked.
There is a fourth factor: selectivity. Even where rotation is happening, it is narrative-driven and concentrated instead of broad. Institutional participation has made the market more discerning, so money managers favor altcoins with clear fundamentals, regulatory standing, and liquidity, while thousands of microcap tokens with no product and no revenue are left behind. The result is that even partial rotations lift a handful of sectors, real-world assets, AI infrastructure, blue-chip DeFi, instead of the whole market. A rising tide that once floated every boat now floats a chosen few, which is why the broad, everything-pumps alt season of past cycles keeps failing to materialize.
Historical alt seasons
The past shows what a real alt season looks like, and how the forces behind them change. The first major one ran through 2017 and into early 2018, driven by the initial coin offering boom. Hundreds of new projects raised money by issuing tokens directly to retail investors, flooding the market with new assets and speculators, and Bitcoin dominance collapsed from around 86% in late 2017 to under 40% at the start of 2018 as money poured into altcoins. It ended in a deep, prolonged bear market that erased most of the gains.
The second ran through 2020 and 2021, powered by different narratives: decentralized finance protocols, non-fungible tokens, new layer-one blockchains, and eventually meme coins. Capital rotated from Bitcoin into DeFi, then NFTs, then competing smart-contract chains, producing enormous gains across sectors. Institutional investors began entering crypto during this cycle, making the market larger but also beginning the shift toward the selectivity now visible in 2026.
The contrast between those cycles and the present is the whole lesson. Both past alt seasons ran on free-flowing retail capital that moved easily from Bitcoin into a wide field of tokens. The 2026 market has more institutional money, more regulation, and the ETF wall, all of which channel capital differently. The historical pattern is not broken, but the plumbing has changed, which is why the same triggers produce a weaker and more selective response than they once did.
The conditions that would trigger one
If alt season is late instead of dead, what would actually bring it? Analysts point to a set of conditions that, when several align, have historically preceded rotation within a quarter. The first and most important is Bitcoin making a new high and then consolidating, which creates both the gains and the stable backdrop that seed rotation. Until Bitcoin recovers and leads, the sequence cannot begin.
The second is a sustained break in Bitcoin dominance below the mid-50s, confirming that capital is genuinely leaving Bitcoin for alts instead of just lifting the whole market together. The third is expanding liquidity, often from central-bank rate cuts, because looser financial conditions push investors toward higher-risk, higher-beta assets, and altcoins are the highest-beta assets in crypto. The fourth is the Altcoin Season Index sustaining a move above roughly 40 to 50 with momentum, showing that outperformance is broadening instead of flickering.
The practical approach that follows from this is to watch the conditions converge instead of guessing a date. When three or more are present at once, the odds of rotation rise sharply. Until then, the index sitting in neutral is telling you plainly that this is not yet alt season, and the traders who override that signal to get in early are usually the ones left holding underperforming tokens while Bitcoin does the work.
The traps to avoid
Alt season is where fortunes are made and lost, and the losses usually come from two predictable mistakes. The first is chasing it late. Because the index is reactionary, by the time it confirms an alt season above 75, the largest and easiest gains have already happened, and entering then means buying near the top of a fast-moving, overextended market. The window is typically two to five months, and the last stretch is the most dangerous, when the smallest and riskiest coins spike and then collapse hardest.
The second mistake is rotating prematurely, moving fully into altcoins before Bitcoin has confirmed a new high and led the cycle. Every past alt season was preceded by Bitcoin leading first, so rotating early means holding depreciating altcoins while Bitcoin outperforms, the opposite of the intended trade. The index sitting in Bitcoin season or neutral is an explicit signal that the rotation has not started, and ignoring it to position early is a common and expensive error.
The deeper trap is treating alt season as a guaranteed event rather than a probability. It is not an on-off switch that must flip in every cycle; it is a phase that depends on conditions, and those conditions can fail to line up, as 2026 shows. The disciplined approach is to track the index and dominance daily, watch for the trigger conditions to converge, and add altcoin exposure selectively and gradually once the signals confirm, instead of betting the portfolio on a rotation that the data has not yet endorsed.
Where the money rotates first
If a rotation does begin, it does not lift every token at once, and knowing the order helps separate a real broadening from a narrow bounce. The sequence tends to follow the risk curve. Capital leaves Bitcoin first for the largest, most liquid altcoin, historically Ethereum, because it is the safest step out along the curve and the easiest for large money to enter. A sustained move in the ETH/BTC ratio is often read as the opening signal that rotation has started at the top of the market.
From there, money tends to move down the size ladder. After large-caps like Ethereum absorb the first wave, capital flows into mid-cap tokens with proven products and liquidity, then finally into small-cap and speculative names as risk appetite grows and traders chase higher percentage gains. This is why the late stage of an alt season is the wildest: the smallest and least proven coins move last and hardest, which is also why they fall the fastest when the phase ends. The order is a rough gauge of how far a rotation has traveled.
Sector leadership matters as much as size. In any given cycle, rotation concentrates in a few narratives instead of spreading evenly, and the leading sectors change from cycle to cycle. In 2026 the candidates most often cited include layer-two scaling networks, real-world asset tokenization, blockchain infrastructure for artificial intelligence, and blue-chip decentralized finance. Meme coins typically peak last and crash hardest, which makes their surge a late-stage signal more than an early one. Watching which sectors lead tells you what the market is actually rewarding, not just that alts are moving.
The selectivity point returns here with force. Because institutional capital favors tokens with fundamentals, liquidity, and regulatory standing, a modern rotation can lift a handful of quality names while thousands of microcaps stay flat, which looks nothing like the everything-pumps seasons of the past. A trader watching only a favorite microcap might conclude alt season never came, while large-cap and sector leaders quietly outperformed. Judging rotation by the leaders and the index, not by one held bag, gives a truer read.
The practical use of all this is sequencing your own attention. Track the ETH/BTC ratio for the first sign that money is stepping out of Bitcoin, watch whether strength broadens from large-caps into mid-caps as confirmation, and treat a frenzy in the smallest coins as a late-cycle warning instead of an invitation. Rotation is a process with an order, and reading that order is more useful than waiting for a single index number to flip.
Frequently Asked Questions
What is alt season in crypto?
Alt season, or altcoin season, is a sustained phase of the market cycle when most altcoins, meaning cryptocurrencies other than Bitcoin, significantly outperform Bitcoin. During one, many altcoins can double or triple while Bitcoin moves sideways or rises more slowly. It is defined by relative performance, altcoins gaining more than Bitcoin, and it produces some of the largest percentage returns of a cycle.
How is alt season measured?
The main tool is the Altcoin Season Index, which tracks how many of the top 100 altcoins, excluding stablecoins, outperformed Bitcoin over the previous 90 days, scored from 0 to 100. Above 75 confirms an alt season, below 25 signals Bitcoin season, and 25 to 75 is neutral. Traders also watch Bitcoin dominance, since a sustained decline signals capital rotating from Bitcoin into altcoins.
What is Bitcoin dominance and why does it matter?
Bitcoin dominance is Bitcoin’s share of the total crypto market capitalization. High dominance means Bitcoin holds most of the market’s value; a falling reading means capital is shifting into altcoins. A sustained break below the mid-50s is often flagged as the threshold for a real, broad rotation. Dominance captures the flow of money, so it can reveal Bitcoin season even when altcoin prices are rising.
Why has alt season not arrived in 2026?
Several factors have converged. Bitcoin is far below its record in a bearish drawdown, so the usual precondition of a fresh Bitcoin high has not been met. Dominance has stayed elevated. And the ETF wall keeps institutional money locked in Bitcoin through regulated funds instead of rotating into alts. Rotation that does occur is selective and narrative-driven instead of broad.
What is the ETF wall?
The ETF wall describes how spot Bitcoin exchange-traded funds pull large institutional capital into Bitcoin but largely keep it there. Unlike past cycles where retail money moved freely from Bitcoin into thousands of altcoins, investors who gain exposure through a Bitcoin ETF tend to stay in Bitcoin rather than rotating into individual tokens. This partly blocks the channel that historically carried money into alts.
What would trigger an alt season?
Analysts point to a set of conditions that, when several align, have preceded rotation: Bitcoin making a new high and consolidating, a sustained break in Bitcoin dominance below the mid-50s, expanding liquidity such as from rate cuts, and the Altcoin Season Index sustaining above roughly 40 to 50 with momentum. When three or more appear together, the odds of rotation within a quarter rise sharply.
Is the Altcoin Season Index a good timing tool?
Only partly. The index is built on a trailing 90-day window, which makes it reactionary. By the time it confirms an alt season above 75, much of the move has already happened, so it describes where the market has been better than where it is going. It is useful for context, but relying on it to time entries usually means arriving late, after the easiest gains have passed.
What mistakes do traders make around alt season?
The two most common are chasing it late, buying after the index confirms and the biggest gains are gone, and rotating prematurely, moving into altcoins before Bitcoin has led and confirmed a new high, which leaves them holding underperforming tokens while Bitcoin rises. A third is treating alt season as guaranteed rather than a conditional phase that can fail to arrive, as 2026 has shown.
Disclaimer: This article is for information and educational purposes only and does not constitute financial, investment, or trading advice. Cryptocurrency prices are highly volatile, and market cycles are unpredictable. Nothing here is a recommendation to buy or sell any asset. Always do your own research and consider consulting a licensed professional before making financial decisions. Figures such as the Altcoin Season Index and Bitcoin dominance are accurate as of July 1, 2026, and will change.

Crypto World
Cardano Price Prediction: ADA Is Stuck in a Tight Range While the “Ghost Chain” Label Keeps Circulating
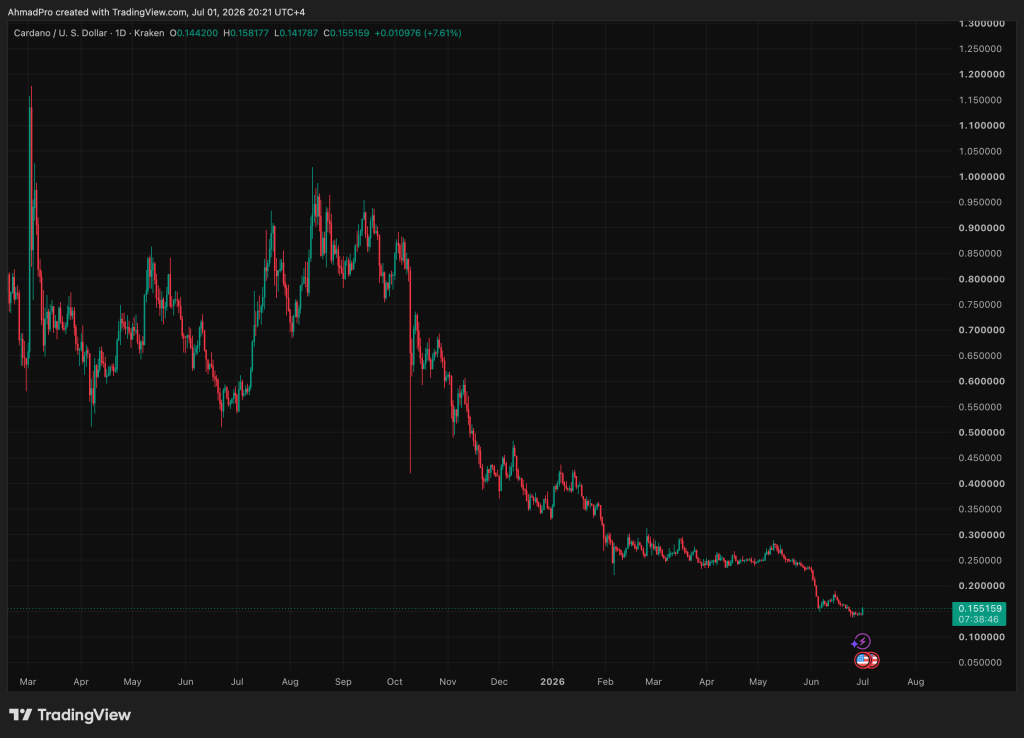
Cardano price is trading near $0.1448, down roughly 0.94% in 24 hours, the coin stuck in a tight consolidation band rather than anything directional.
The ghost chain label keeps surfacing in bear-cycle discourse, and with ADA rangebound for weeks, it’s worth examining whether the criticism holds or whether the chart is simply pausing before the next move. There’s a key resistance level that determines everything from here.
The “ghost chain” critique targets blockchains that are technically live but generate negligible real-world activity. Cardano has faced this charge repeatedly, given its deliberate, peer-reviewed development cadence, which critics read as stagnation.
The counterargument is in the on-chain data: the network continues to process transactions, its developer community remains active, and ecosystem upgrades have continued shipping.

Layer 1s don’t survive a decade on name recognition alone. Cardano has. The question is whether that’s enough to drive price.
Broader crypto sentiment is calm right now, which cuts both ways for ADA, no macro tailwind, but also no macro headwind shaking weak hands loose. The price action is a technical story, not a fundamental one, and the technicals are at a decision point.
Can Cardano Price Break $0.1489 Resistance This Week?
ADA is consolidating between $0.1366 and $0.1550 with the most actionable cluster sitting between $0.1489 and $0.1518 on the upside. CoinLore’s near-term ceiling sits at $0.1521 with a floor at $0.1344, a range tight enough that a single exchange-level catalyst resolves the trade in either direction.
Three support tiers sit below current price at $0.1428, $0.1395, and $0.1366. Price is holding above the first level, which is constructive but barely. Volume has been tepid with no confirmation of accumulation or distribution in either direction.
ADA clearing $0.1489 on volume compresses toward $0.1518 to $0.1550 and shelves the ghost chain narrative for another cycle.
Consolidation continuing in the $0.1395 to $0.1489 band through the near term makes CoinCheckup’s $0.1455 target for July 30 the soft ceiling for cautious models.
A break below $0.1366 brings the $0.1344 floor into play and makes Binance’s longer-range model at $0.09645 for 2027 look less like an outlier. Invalidation of the bull case is clean: a daily close below $0.1344.
Coinbase’s model diverges sharply bullish at $0.49 for 2026 and $0.59 for 2030. That is either a major unpriced catalyst or aggressive extrapolation. Treat it as a ceiling scenario, not a base case.
Maxi Doge Targets Early Mover Upside as Cardano Tests Key Levels
ADA’s range-bound structure makes patience the trade. Meaningful upside exists but it is conditional on a breakout that has not materialized yet. Traders who want crypto momentum without waiting on a technical resolution are rotating into earlier-stage plays where the entry price itself provides the asymmetry.
Maxi Doge is one presale drawing that rotation.
Built on Ethereum as an ERC-20 meme token, the project leans hard into gym-bro trading culture with a 240-lb canine mascot and the tagline “Never skip leg-day, never skip a pump.” The branding is intentionally loud but the mechanics underneath are more structured than the meme framing suggests.
Holder-only trading competitions with leaderboard rewards give the community something to compete for beyond price speculation. A Maxi Fund treasury is allocated to liquidity and partnerships. Dynamic staking APY rewards holders for staying in.
The presale is currently priced at $0.0002826 with $4.82 million raised to date. That number signals real capital commitment rather than a ghost project.
Meme tokens carry significant risk. Liquidity and post-launch price discovery are always the critical unknowns. But for traders looking for asymmetric exposure while ADA grinds sideways, the entry price here is doing a lot of the work.
For traders who’ve done the work, research Maxi Doge here.
The post Cardano Price Prediction: ADA Is Stuck in a Tight Range While the “Ghost Chain” Label Keeps Circulating appeared first on Cryptonews.


Strategy has received another Wall Street price target cut after Canaccord lowered its valuation on the company while maintaining that Bitcoin’s long-term investment case remains intact.
Summary
- Canaccord cut Strategy’s price target to $130 but said its long-term Bitcoin investment thesis remains unchanged.
- The brokerage believes Strategy’s Bitcoin-focused business model is still viable if Bitcoin posts moderate annual gains.
- Other analysts, including TD Cowen, Cantor Fitzgerald, and Benchmark, continue backing Strategy despite lowering or maintaining price targets.
Bitcoin outlook remains intact despite lower valuation
According to a research note from Canaccord, the brokerage reduced its price target for Strategy to $130 from $163, citing the company’s prolonged share price decline rather than any change in its long-term view on Bitcoin. The revision comes as Strategy stock has struggled for months, even though the firm said its underlying investment thesis for the cryptocurrency remains unchanged.
Strategy shares closed the previous trading session at $86.93, only slightly above their 52-week low of $81.81 and roughly 77% below where they traded a year ago. The stock later rebounded 8.12% to $93.96 after the company introduced its new Digital Credit Capital Framework.
Canaccord said Bitcoin continues to benefit from limited supply and growing adoption of blockchain technology. The brokerage added that the cryptocurrency has become more established within financial markets and is no longer facing the same uncertainty over whether it should be viewed primarily as a speculative asset or a long-term store of value.
The firm also maintained that Strategy’s Bitcoin-focused corporate model remains workable as long as Bitcoin delivers moderate annual appreciation. At the same time, Canaccord acknowledged that recent market performance has fallen short of those expectations.
“We think there is nothing broken here, either in the company’s model or in bitcoin, which suggests a pendulum swing back makes sense sometime over the medium term.”
Separately, data cited in the report showed Strategy’s Relative Strength Index has moved into oversold territory, while Fair Value analysis suggested the shares could be trading below their estimated intrinsic value.
Capital strategy continues to receive support from analysts
The latest revision follows another recent target cut from TD Cowen, which, as previously reported by crypto.news, lowered its price target on Strategy to $260 from $400 while keeping a “buy” rating. According to TD Cowen, the lower valuation was driven by a more conservative long-term Bitcoin price forecast rather than concerns about Strategy’s newly introduced Digital Credit Capital Framework.
TD Cowen said its revised target still implies roughly 200% upside from current trading levels. The brokerage also described the new capital framework as a constructive step that could improve Strategy’s financial flexibility, even after the stock surrendered part of its initial gains following the announcement.
In a regulatory filing dated June 29, Strategy disclosed that its Digital Credit Capital Framework allows the company to raise up to $1.25 billion through Bitcoin sales if needed. According to the filing, those proceeds may be used to maintain U.S. dollar reserves, fund preferred dividend payments, meet interest obligations, strengthen cash balances, and finance future share repurchases.
The same filing also authorized up to $1 billion in repurchases of the company’s Digital Credit Securities, including STRC, STRF, STRD, and STRK, when management determines buybacks would improve the firm’s capital structure. Strategy further disclosed that it has paused additional Bitcoin purchases while selling about $1.15 billion worth of MSTR shares as part of its capital management plan.
Elsewhere on Wall Street, Cantor Fitzgerald reaffirmed its Overweight rating and $212 price target, citing confidence in Strategy’s liquidity plans. Benchmark also reiterated its Buy rating and maintained its $570 price target, noting that although the company’s preferred shares have weakened in recent months, Strategy has continued adding Bitcoin to its balance sheet.
Crypto World
Ark Invest bought more than $75 million of COIN, CRCL, BLSH shares during June bloodbath


Ark Invest has a tendency to load up on shares in cryptocurrency companies when their prices are depressed, and June was no exception.
Bitcoin , the largest cryptocurrency, recorded its worst month in four years, and digital asset firms’ share prices suffered accordingly, which Ark read as a buying opportunity.
The St. Petersburg, Florida-based investment manager bought $44 million worth of shares in crypto exchange Coinbase (COIN), based on the closing prices of the days on which purchases were made. It purchased $25.25 million worth of equity in Circle Internet (CRCL), issuer of the world’s second-largest stablecoin USDC, and $8.2 million worth of crypto exchange Bullish (BLSH), the parent company of CoinDesk, according to emailed disclosures.
Shares of Circle slumped 40% in June, ending the month at $62.63. The decline included an 18% drop on June 30 following the debut of rival stablecoin Open USD, which is backed by more than 140 companies, including Coinbase, Stripe, Visa, Mastercard and BlackRock.
COIN ended June just under 20% lower at $146.19, while BLSH fell 27% to $23.43.


The Winklevoss twins have transferred about $67 million worth of Bitcoin and Ethereum to Gemini wallets, with Arkham Intelligence identifying the transactions as matching their usual selling pattern.
Summary
- Arkham Intelligence flagged the Winklevoss twins’ $67 million Bitcoin and Ethereum transfers to Gemini as matching previous selloff patterns.
- Bitcoin remains under pressure as Citigroup cuts its price target and ETF outflows continue weighing on market sentiment.
- Ethereum holds near key support despite continued treasury purchases from SharpLink and Bitmine failing to offset whale selling.
According to blockchain analytics firm Arkham Intelligence, Cameron and Tyler Winklevoss moved roughly $60 million in Bitcoin (BTC) and another $7 million in Ethereum (ETH) from custody to hot wallets linked to the Gemini crypto exchange on July 1. Arkham characterized the transfers as consistent with the twins’ previous selloff behavior, although the firm did not confirm that the assets had already been sold.
The latest transfers come as Bitcoin and Ethereum continue trading under pressure following quarter-end selling and persistent weakness in investor sentiment. Recent price declines have also coincided with reduced expectations that the CLARITY Act will pass this year after U.S. President Donald Trump disclosed a $1.4 billion crypto-related windfall, a development some market participants have linked to shifting legislative expectations.
Since accumulating Bitcoin in 2015, the Winklevoss twins have realized about $1.7 billion in profit, according to Arkham Intelligence. Despite the latest transfers, they still control more than $300 million worth of Bitcoin. The July movement also follows earlier transfers to Gemini, including about $67.5 million in Bitcoin during June and another $130 million moved in March.
Bitcoin continues to face selling pressure
Citigroup has turned more cautious on the two largest cryptocurrencies, lowering its 12-month Bitcoin price target to $82,000 from $112,000 while reducing its Ethereum forecast to $2,240 from $3,175.
Bitcoin fell as low as $57,747 over the past 24 hours before recovering to trade near $58,600. Trading volume rose about 9% during the same period, while June recorded roughly $4.5 billion in net outflows from U.S. spot Bitcoin exchange-traded funds, adding to the pressure on market sentiment.
Commenting on current market conditions, crypto analyst Ted Pillows wrote, “Sellers are still dominating, while Coinbase Bitcoin Premium is at its lowest level this cycle.” He added that losing the $57,000-$58,000 support region could expose Bitcoin to a deeper decline toward the $50,000 level.
Ethereum buyers continue accumulating despite weakness
Ethereum has also remained under pressure even as several companies continue adding the asset to their corporate treasuries. As previously reported by crypto.news, quarter-end selling, whale distribution, and weak institutional flows have kept Ether pinned near the $1,500 support area despite ongoing buying from public companies.
Corporate accumulation has nevertheless continued. SharpLink recently disclosed the purchase of another 10,000 ETH at an average price of $1,611, spending about $16.1 million to expand its treasury.
Separately, Bitmine acquired 27,084 ETH over the past week, increasing its holdings to more than 5.7 million ETH. According to crypto.news, those purchases have so far failed to offset continued selling by whales and institutional investors.
Ether was trading around $1,572 at the time of writing, down about 1% over the past 24 hours after moving between an intraday low of $1,549 and a high of $1,600. Trading volume also declined during the session.
Crypto.news reported earlier today that the $1,500-$1,510 region remains Ethereum’s most important support zone. A break below that level would invalidate the current consolidation structure and could open the door to declines toward $1,400 before attention turns to the $1,200 area identified by several market participants.

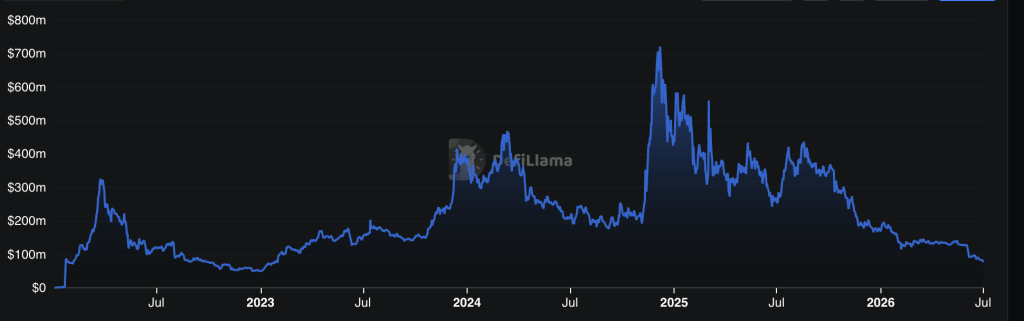
US spot Bitcoin ETFs continued to see money leaving the funds on June 30, as investors pulled out $223 million – for the last nine days in a row. In total, the ETFs saw $4.51 billion exit during June, their biggest monthly outflows since launching in January 2024.
Tim Sun, Senior Researcher at HashKey Group, said that while the ETF outflows certainly reflect a weakening of marginal buying pressure for Bitcoin, the core issue isn’t just that ETF funds are flowing out – it’s where those outgoing funds are actually headed.
Bitcoin ETF Exodus
In a statement to CryptoPotato, Sun said that if investors were simply moving their funds into cash or short-term bonds, it would indicate a temporary shift toward safer assets while markets waited for macroeconomic uncertainty to ease. Instead, the researcher said that fund flows since the beginning of the year suggest that institutional investors are reallocating capital to sectors such as artificial intelligence (AI), semiconductors, and the GPU supply chain.
“The market hasn’t completely lost its risk appetite; rather, it is re-selecting its preferred risk assets.”
Sun explained that Bitcoin and AI-related stocks share several characteristics, such as long duration, high volatility, and high narrative elasticity. However, institutional investors currently favor the AI supply chain because companies in that sector are able to turn revenue and capital spending into business results much faster than Bitcoin can deliver returns through its investment narrative.
As a result, he believes the current ETF outflows should be viewed as a sign that Bitcoin’s short-term appeal has weakened compared with AI and semiconductor investments, rather than evidence that the long-term investment case for crypto has disappeared. Sun described the trend as a “capital reallocation within risk assets: Bitcoin’s marginal attractiveness is temporarily weaker than that of AI and semiconductors.”
At the same time, he noted that Bitcoin could attract institutional capital again if the AI trade becomes overcrowded and experiences a correction or if macro liquidity improves.
The Strategy Crisis
ETF outflows aren’t the only headwind for Bitcoin. Strategy, the largest corporate holder of BTC, also faces growing challenges in maintaining its financing model. Sun acknowledged that downside risks remain significant. He said the market’s main concern is not any single development but the simultaneous weakening of the two major sources of marginal buying demand that previously supported Bitcoin’s rally.
On one side, ETFs have shifted from consistent inflows to outflows, while on the other, the market is re-pricing the financing capacity of Strategy. Even so, Sun stressed that the company’s biggest risk is not necessarily that it will trigger a broader market sell-off, but that its ability to keep purchasing BTC at the same pace could decline.
“What truly needs to be observed is whether it will be forced to alter its financing cadence, replenish cash reserves, slow down its buying pace, or even pause purchases altogether.”
If Strategy pauses its buying, Sun stated that it “might not necessarily be a bad thing, because it means the previous distortion of true supply and demand – caused by Strategy’s financial flywheel model – will be alleviated.” In that case, he added Bitcoin would have the opportunity to establish price support based on genuine market demand instead of relying primarily on ETF inflows and Strategy’s purchases.
The post The Vanishing Bitcoin Bid: Where Are the ETF Billions Going? appeared first on CryptoPotato.


Edel said it detected and contained the exploit, then paused all of its version-one contracts, which remain frozen, and warned users not to interact with them.
The team added it had traced the attacker’s transactions and is coordinating with exchanges, and that it has offered the attacker a whitehat settlement, a deal that lets a hacker return most of the funds in exchange for a fee and no legal pursuit, within a set window.
No depositor will take a loss, Edel noted, with the team absorbing the bad debt and restoring balances one for one. It is deploying a version two with a redesigned pricing setup meant to block this kind of manipulation, and promised a full technical breakdown to follow.
While the amount is small, the method sits in one of DeFi’s most persistent categories of exploit.
Manipulating the price a protocol reads, rather than breaking into it, ranks as the second most common smart-contract vulnerability in the OWASP Smart Contract Top 10 vulnerabilities for 2025, and security researchers at CertiK describe oracle price manipulation as one of the field’s most common attack vectors.
Alongside cross-chain bridges, which produced the year’s largest single thefts, including the $292 million drained from Kelp DAO in April, price manipulation is where much of the money keeps going, and in most of these, the code works as written.

Key Takeaways
- Shares of SanDisk tumbled 9.44% during Tuesday’s session even as Bank of America issued an optimistic price target increase
- Bank of America elevated its SNDK price objective from $2,100 to $2,500 while reiterating its Buy recommendation
- BofA’s Wamsi Mohan anticipates average selling prices could surge as much as 35%, while bit growth may increase 13% sequentially
- The memory maker has soared 800% in 2024 and an eye-popping 4,755% over the trailing year, reaching a $323 billion market capitalization
- Valuation concerns include a forward price-to-earnings ratio of 33 — exceeding both Nvidia and Micron — alongside troubling technical indicators
SanDisk shares experienced a steep decline on Tuesday, surrendering 9.44% of their value during the trading session. The selloff occurred paradoxically on the very day that Bank of America Securities announced an upward revision to its price target, moving from $2,100 to $2,500.
Bank of America’s equity analyst Wamsi Mohan maintained his Buy recommendation on the shares. His optimistic thesis centers on the persistent mismatch between NAND flash memory supply and demand, a condition he anticipates will persist through 2027.
Mohan’s research indicates SanDisk’s average selling prices could experience gains of up to 35%. Additionally, he projects bit growth — representing the total volume of memory units delivered — will expand by 13% on a sequential quarter basis.
Using these assumptions as a foundation, Bank of America now forecasts that SanDisk will report $9.1 billion in revenue for the June quarter alongside earnings per share of $37.01. These projections exceed the Street’s current consensus estimates of $8.35 billion in revenue and $34.26 in EPS.
For the subsequent quarter, BofA’s model anticipates revenue reaching $11.5 billion with EPS climbing to $48.55.
Multi-Year NAND Supply Deals Enhance Earnings Predictability
A critical element supporting Mohan’s optimistic outlook involves SanDisk’s strategic emphasis on securing long-term NAND supply agreements, referred to as NBMs. These multi-year commitments guarantee future revenue streams and provide greater clarity for investors modeling future profitability.
Bank of America anticipates widespread adoption of these contractual arrangements among cloud infrastructure providers and enterprise clients. The investment bank also highlighted that these agreements are designed to preserve gross margin levels within SanDisk’s established target parameters.
This strategic pivot has contributed significantly to SanDisk’s extraordinary market performance. The stock has skyrocketed 800% since the beginning of the year and an astonishing 4,755% over the past twelve months. This explosive growth has transformed what began as a Western Digital spinoff into a company valued at $323 billion.
The bullish sentiment extends beyond Bank of America. Mizuho Securities increased its target from $1,825 to $2,200. Cantor Fitzgerald established an even higher objective at $2,900. Susquehanna Financial Group represents the most aggressive bull case with a $3,250 price target.
The analyst community’s consensus rating stands at Strong Buy — featuring 14 Buy ratings, two Hold ratings, and zero Sell recommendations over the most recent three-month period. The mean price target across all analysts sits at $1,979.38, suggesting approximately 3% downside from present trading levels.
Growing Concerns About Valuation and Market Dynamics
Notwithstanding the widespread analyst enthusiasm, multiple risk factors deserve consideration — and Tuesday’s sharp decline serves as a cautionary reminder.
SanDisk’s forward price-to-earnings multiple has expanded to 33 times, surpassing Nvidia at 22 times and Micron Technology at 18 times. This valuation premium has begun attracting scrutiny from market participants.
Supply-side dynamics present another concern. Elevated memory pricing could incentivize rival manufacturers including Micron, Kingston Technology, and Kioxia Holdings to accelerate production capacity, which would ultimately exert downward pressure on pricing.
From a technical analysis perspective, the weekly chart reveals a bearish divergence in the Relative Strength Index. The RSI has been declining even as the stock price has continued advancing — a formation that frequently precedes price corrections.
The equity currently trades at $2,238, substantially above its 50-day moving average of $1,458.

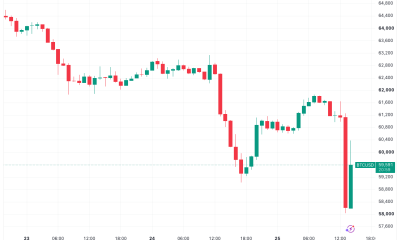
Bitcoin has climbed back above $60,000 after Federal Reserve Chair Kevin Warsh declined to signal the direction of future interest rate decisions during an ECB policy discussion.
Summary
- Bitcoin rebounded above $60,000 after Fed Chair Kevin Warsh declined to signal the future path of interest rates.
- CME FedWatch shows markets still expect rates to remain unchanged in July despite lingering inflation concerns.
- Polymarket continues to price in a chance of a 2026 rate hike, while Morgan Stanley expects rates to stay on hold this year.
According to data from crypto.news, Bitcoin (BTC) traded around $60,175 at the time of writing after rebounding about 3% from an intraday low below the key $58,000 level. The move followed comments from Warsh, who again avoided offering forward guidance on monetary policy while reiterating that future decisions will depend on incoming economic data.
Bitcoin rebounds as Warsh avoids policy signals
Speaking during an ECB Forum panel, Warsh declined to say whether the Federal Reserve would raise interest rates at the July Federal Open Market Committee meeting. Instead, he repeated the position he adopted after taking office that the central bank would not pre-commit to future policy moves and would continue responding to economic data as it becomes available.
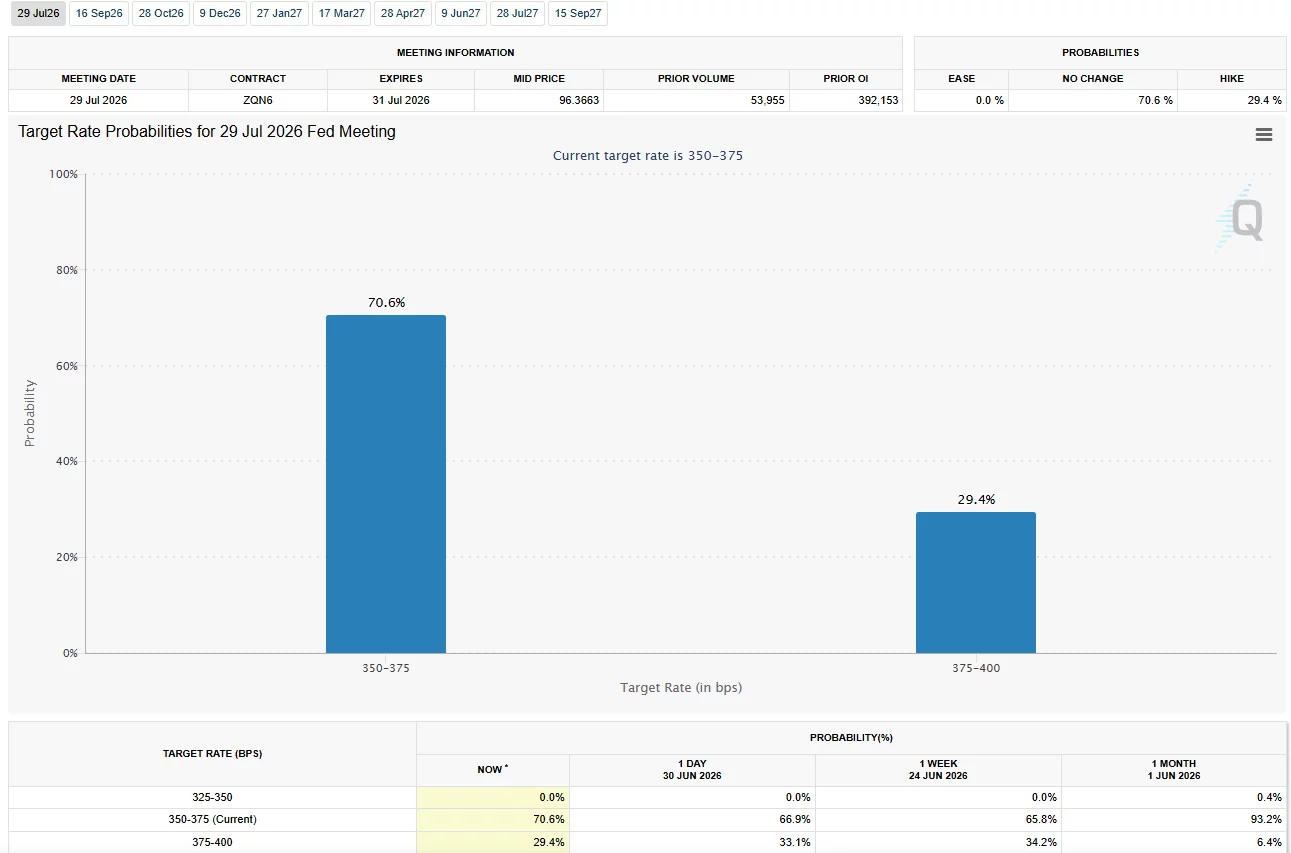
His remarks came as traders largely continued to expect no change in interest rates later this month. According to CME FedWatch data, markets currently assign a 70.6% probability that the Federal Reserve will leave rates unchanged at the July FOMC meeting.

Warsh also addressed inflation, saying expectations had declined during the first four weeks of the recent period despite concerns tied to the U.S.-Iran conflict. He added that inflation risks had eased while reaffirming the Federal Reserve’s commitment to returning inflation to its 2% target.
As crypto.news reported after the June FOMC meeting, Warsh also left rates unchanged at that gathering. Bitcoin fell to around $65,430 following the decision, while Ethereum traded near $1,770. The Federal Reserve’s updated projections at the time showed that nine policymakers expected at least one rate increase before the end of the year.
Those projections have continued to shape market expectations even after Warsh reiterated at the ECB Forum that future policy decisions would depend on incoming economic data.
Rate hike expectations continue to pressure crypto
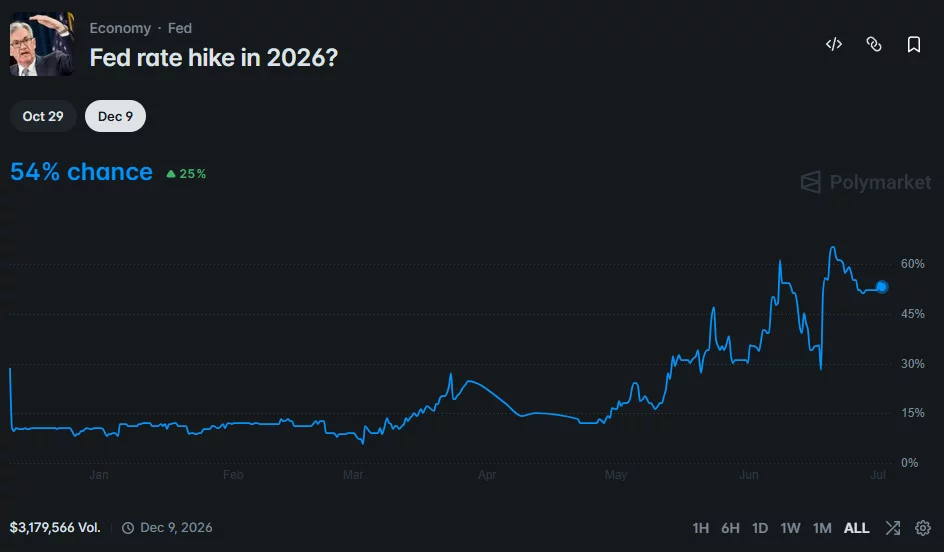
Although traders see little chance of a July rate increase, expectations for additional tightening later this year have not disappeared. According to Polymarket data, there is currently a 54% probability that the Federal Reserve will raise interest rates before the end of 2026.
Higher borrowing costs have generally remained a headwind for cryptocurrencies because elevated interest rates tend to support demand for cash and short-term fixed-income assets over riskier investments such as Bitcoin.
Separate reporting by crypto.news also noted that Morgan Stanley expects the Federal Reserve to keep rates unchanged through the rest of the year. The bank nevertheless warned that rate hikes could return if inflation remains persistent or if the unemployment rate falls further.
Outside monetary policy, another source of uncertainty for Bitcoin has come from corporate supply. As previously reported by crypto.news, the possibility that Strategy could sell as much as $1.25 billion worth of Bitcoin has remained one factor contributing to selling pressure in the market.
Political attention has also stayed on Federal Reserve policy. Before Warsh became chair, President Donald Trump repeatedly called for lower interest rates. After the June decision to keep rates unchanged, however, Trump responded without strong criticism and continued to praise the new Fed chair while receiving no timeline for future rate cuts.


The downgrade marks a sharp reversal from Citi’s previous outlook, which assumed passage of U.S. digital asset market structure legislation would spur adoption among financial advisors and traditional investors. The bank now believes that timeline has slipped, leaving the market without a meaningful catalyst.
Saunders said ETF flows continue to be the main force behind crypto prices, with recent demand turning negative as investors pulled back from risk.
According to the bank’s analyst, sentiment has also been hurt by concerns that digital asset treasury (DAT) companies could become net sellers of bitcoin. Recent corporate actions by Strategy amplified those fears despite involving relatively modest BTC sales.
The report noted that bitcoin and ether both remain below key technical levels, including their 200-day moving averages, while speculative capital has shifted toward AI-related investments.
The bank’s revised forecasts assume flat ETF flows in its base case. In its bull case, stronger retail and institutional adoption lifts bitcoin to $108,000 and ether to $2,932. Its bear case, based on recessionary macro conditions and continued ETF outflows, sees BTC falling to $53,000 and ETH to $1,094.
While the bank’s equity strategists have become more constructive on U.S. stocks, providing some support through crypto’s equity correlation, the report said that positive macro factors are insufficient to offset weakening flows.


A new independent non-profit, Ethereum Institutional, has launched with the goal of accelerating institutional adoption of Ethereum, its layer-2 networks and the broader ecosystem.
The organization is led by David Walsh, Marius Smith and Matthew Dawson. Walsh previously led the Ethereum Foundation’s enterprise efforts, while the organization said its leadership brings experience spanning institutional engagement, capital markets and Ethereum ecosystem development. It said its mission is to provide institutions with a neutral, independent point of contact as they evaluate Ethereum for tokenization, stablecoins and other onchain financial infrastructure.
In announcing the initiative on X, Ethereum Institutional said institutions need “a credible, independent front door” to the Ethereum ecosystem. While Ethereum’s neutrality is one of its defining strengths, the group argued, that neutrality has often left enterprises without a clear organization to engage as they make long-term infrastructure decisions.
The launch comes as the Ethereum Foundation continues to narrow its role to stewarding the core protocol, with ecosystem participants increasingly spinning up independent organizations focused on specific areas such as business development, institutional outreach and developer support. The shift follows broader changes at the foundation, including leadership restructuring and longstanding community calls for greater transparency.

Why delivering on infrastructure projects requires a broad approach

Basic financial concepts explained – Interest

Why VAR denied England a penalty vs DR Congo | Football


![BIS Just Gave XRP Holders Another Massive Clue! The XRP Connection Is Impossible To Ignore! [INSANE]](https://wordupnews.com/wp-content/uploads/2026/07/1782927079_maxresdefault-80x80.jpg)
-

 Fashion5 days ago
Weekend Open Thread: Staud – Corporette.com
-

 Politics5 days ago
The House | Manchesterism won’t survive the painful trade-offs unless it gets citizens on board
-

 Crypto World2 days ago
Strategy authorizes up to $1.25B in Bitcoin sales under new capital plan
-

 Politics6 days ago
Potential 2028er World Cup attendee leaderboard
-

 Business5 days ago
Asia stock markets slide as tech shares slump
-

 News Videos3 days ago
MAJOR BITCOIN & MARKET UPDATE!!!! (MUST WATCH ASAP!!!)
-

 Tech6 days ago
A Look At A Gaggle Of Transputer Boards
-
 Crypto World6 days ago
Dell (DELL) Shares Tumble Over 5% Following Analyst Downgrade to Hold
-

 Crypto World4 days ago
Coinbase, Circle Deepen Crypto Stock Losses Despite Resilient S&P 500
-

 Business2 days ago
Australia treasurer says alleged access of prime minister’s bank data ’incredibly concerning’
-

 Crypto World5 days ago
Kraken's xStocks Opens Bending Spoons IPO Registration to EEA Retail
-

 Sports5 days ago
FIH Pro League: India defeat Pakistan 7-1, register biggest win of campaign | Other Sports News
-
 Crypto World6 days ago
Bitcoin Sparks $600M Hourly Liquidations With $65,000 Set To Become Resistance
-

 Tech4 days ago
Bluekit phishing kit adopts browser-in-the-middle for login theft
-

 Tech4 days ago
Russian hackers now target Signal backup recovery keys
-
 Crypto World5 days ago
Hyperliquid Named on Singapore MAS Investor Alert Register
-

 Crypto World5 days ago
RTX holders must register wallets before token distribution begins
-

 Crypto World7 days ago
Ripple and SBI launch RLUSD in Japan after JFSA approval
-

 Tech2 days ago
Anonymous researcher drops 0-day ‘exploitarium’ repo
-

 Sports5 hours ago
Broncos roster: OL Ben Powers (No. 74) entering final year of contract
You must be logged in to post a comment Login