
Crypto World
What is Bitcoin dominance? How to read the BTC.D chart



Bitcoin dominance measures BTC’s share of total crypto market capitalization. It is the single most watched macro indicator for timing capital rotation between bitcoin and altcoins.
Summary
- Bitcoin dominance (BTC.D) is the ratio of bitcoin’s market capitalization to the total cryptocurrency market capitalization, expressed as a percentage.
- BTC.D peaked near 99 percent in 2013, fell to a record low of roughly 38 percent during the 2018 ICO bust, and has cycled in a 33 to 73 percent range since 2017.
- As of mid-2026, BTC.D sits in the mid to high 50s after retreating from a four-year high above 63 percent reached in mid-2025, driven largely by institutional ETF inflows concentrating in bitcoin.
- The Altcoin Season Index, which scores how many of the top 100 altcoins outperform bitcoin over 90 days, reads below 40 in August 2026, well short of the 75 threshold that confirms a broad altcoin season.
- Reading BTC.D in isolation is misleading; the metric must be cross-referenced with total market capitalization and volume to distinguish between four distinct market regimes.
Bitcoin dominance is one of those numbers that every crypto trader checks but few use correctly. The metric appears simple: divide bitcoin’s market cap by the total cryptocurrency market cap and multiply by 100. The result tells you what percentage of the market’s total value is held in bitcoin at any given moment.
The complication is that a single percentage can mean very different things depending on what the rest of the market is doing. A rising BTC.D during a rising total market cap signals something entirely different from a rising BTC.D during a falling total market cap. Understanding those distinctions is the difference between using dominance as a trading tool and using it as decoration on a dashboard.
How Bitcoin dominance is calculated
The formula is straightforward. BTC.D equals bitcoin’s market capitalization divided by the total cryptocurrency market capitalization, multiplied by 100. Market capitalization is calculated by multiplying the circulating supply of a coin by its current price.
Data providers like CoinGecko and CoinMarketCap track thousands of tokens, so the denominator, total market cap, includes everything from Ethereum to memecoins with three-figure market caps. This matters because the number of tracked tokens has grown from a few hundred in 2017 to over 15,000 today. Every new token added to the denominator dilutes BTC.D mechanically, even if bitcoin’s own market cap is growing.
Some analysts prefer to exclude stablecoins (USDT, USDC, DAI) from the denominator because stablecoins do not compete with bitcoin for speculative capital. A version of BTC.D that excludes stablecoins typically runs 3 to 5 percentage points higher than the standard metric. Both versions are available on TradingView.
The calculation carries an important caveat that affects how the number should be interpreted. Market capitalization is computed using circulating supply, but the definition of circulating supply varies by data provider. CoinGecko and CoinMarketCap use different methodologies to determine which coins are in active circulation, which means BTC.D can differ by one to two percentage points depending on the source. Traders who track dominance over time should use a single data source consistently to avoid comparing numbers calculated under different assumptions.
A second caveat involves the treatment of wrapped and bridged assets. Wrapped bitcoin (WBTC) on Ethereum, for example, represents real bitcoin locked in custody and reissued as an ERC-20 token. Data providers typically count both the native BTC and the WBTC in their total market cap calculation, which can produce a minor double-counting effect. As cross-chain bridging has grown, this issue has become more relevant, though it remains small relative to bitcoin’s total market cap.
A brief history of BTC.D
Bitcoin dominated the crypto market almost entirely in its early years. From 2009 through 2016, daily BTC.D averaged between 83 and 93 percent. There was simply nothing else of comparable size.
The first meaningful decline came during the 2017 ICO boom. Ethereum’s launch in 2015 created a platform for new tokens, and by January 2018, thousands of ICO projects had collectively dragged BTC.D down to its all-time low near 38 percent. That low marked the peak of ICO speculation, not the peak of a healthy altcoin market. Most ICO tokens lost 90 percent or more of their value within a year.
BTC.D recovered sharply through 2019, reaching 71 percent in September as the ICO bubble fully deflated and capital retreated to bitcoin. The DeFi summer of 2020 and the NFT mania of 2021 pulled dominance back down to the mid-40s, where it hovered through most of 2021.
The 2022 bear market saw BTC.D climb steadily as altcoins fell faster than bitcoin. By late 2024, bitcoin had reclaimed 60 percent dominance, and the approval of spot bitcoin ETFs in January 2024 concentrated new institutional capital almost entirely in bitcoin. Dominance hit a four-year high above 63 percent in mid-2025.
As of August 2026, BTC.D has pulled back to the mid to high 50s but remains elevated by historical standards. The Altcoin Season Index sits below 40, meaning fewer than 40 percent of the top 100 altcoins have outperformed bitcoin over the past 90 days.
The 2024 to 2026 period introduced dynamics that no previous cycle had produced. Spot bitcoin ETFs launched in January 2024 and attracted more than $30 billion in net inflows within their first year. Because these products buy and hold bitcoin exclusively, every dollar of ETF inflow increases bitcoin’s market cap without affecting altcoins. The mechanical result was a sustained push on the numerator of the BTC.D equation that altcoin rallies struggled to offset.
By March 2025, cumulative ETF holdings exceeded 1.1 million bitcoin, roughly 5.6 percent of the circulating supply. That concentration of supply in passive, long-only vehicles created a new source of structural demand that did not exist in the 2017 or 2021 cycles. Even when retail traders rotated into Solana, memecoins, and restaking tokens during brief speculative bursts in late 2024 and early 2025, the persistent ETF bid kept BTC.D elevated.
The pattern repeated during the first half of 2026. Bitcoin consolidated between $95,000 and $115,000 while altcoins staged several short-lived rallies. Each rally pulled BTC.D down by two to three percentage points before institutional buying absorbed the dip and pushed dominance back up. This sawtooth pattern, where dominance dips are shallower and recoveries faster than in previous cycles, is the signature of the ETF-era market structure.
The four market regimes
Identifying the current regime requires checking two data points at the same time: BTC.D direction and total market cap direction. TradingView makes this straightforward. Open a split chart with BTC.D on the top panel and the TOTAL ticker (total crypto market cap) on the bottom. If both lines are rising, the market is in Regime 1. If BTC.D is falling while TOTAL is rising, it is Regime 2. The other combinations follow the same logic.
Regime transitions tend to happen at inflection points in the bitcoin halving cycle. Historically, the first 12 to 18 months after a halving favor Regime 1, as new supply reduction draws attention and capital to bitcoin. The rotation into Regime 2, where altcoins outperform, typically begins 18 to 24 months after the halving, as traders seek higher beta returns once bitcoin’s rally matures. The April 2024 halving placed the expected altcoin rotation window around late 2025 to mid-2026, but ETF-driven structural changes have delayed and dampened the rotation compared to prior cycles.
Reading BTC.D requires looking at two variables simultaneously: dominance direction and total market cap direction. The combination produces four distinct regimes.
Regime 1: BTC.D rising, total market cap rising. Bitcoin is leading a broad rally. Money is entering the crypto market but flowing primarily into bitcoin. This is typical of early bull markets and was the dominant pattern from October 2023 through mid-2024, when ETF inflows powered bitcoin from $27,000 to $73,000 while most altcoins lagged.
Regime 2: BTC.D falling, total market cap rising. Capital is rotating from bitcoin into altcoins while the overall market grows. This is the textbook definition of altcoin season. It occurred in Q1 2021 and briefly in Q4 2021 when Solana, Avalanche, and other Layer 1 tokens surged while bitcoin consolidated.
Regime 3: BTC.D rising, total market cap falling. The market is contracting and altcoins are falling faster than bitcoin. Capital is not entering bitcoin; it is leaving altcoins. This is the bear market flight to relative safety and was the dominant pattern through most of 2022.
Regime 4: BTC.D falling, total market cap falling. Both bitcoin and altcoins are declining, but bitcoin is declining faster. This is rare and typically occurs during bitcoin-specific sell events, such as the Mt. Gox creditor distribution fears in mid-2024.
Without checking total market cap, a trader looking at a rising BTC.D cannot distinguish between Regime 1 (bullish) and Regime 3 (bearish). That distinction is why dominance alone is an incomplete signal.
How to read a BTC.D chart
BTC.D charts are available on TradingView (ticker: BTC.D), CoinGecko, and CoinMarketCap. The chart plots dominance as a percentage over time and supports standard technical analysis tools.
Support and resistance levels on BTC.D work similarly to price charts. The 38 percent all-time low from January 2018 has never been retested and represents the strongest historical support. The 55 to 57 percent zone has acted as both support and resistance multiple times since 2019. A sustained break below 55 percent has historically preceded altcoin rallies.
Trend lines and channels are useful for identifying the prevailing regime. BTC.D spent most of 2023 through early 2025 in a rising channel, with higher highs and higher lows. A break below the lower bound of that channel would be the first structural signal that dominance is reversing.
Moving averages provide context. The 200-day moving average smooths out noise and shows the primary trend. When BTC.D is above its 200-day moving average, bitcoin is gaining market share on a sustained basis. When it crosses below, the trend is shifting toward altcoins.
Volume is not directly available on BTC.D charts because dominance is a ratio, not a tradable asset. However, traders cross-reference BTC.D movements with open interest data on bitcoin perpetual futures to gauge the conviction behind dominance shifts. Rising open interest alongside rising BTC.D suggests new leveraged positions are being opened in bitcoin’s favor.
The Relative Strength Index (RSI) applied to BTC.D offers additional context. When BTC.D’s weekly RSI reaches overbought territory above 70, it historically marks periods where bitcoin’s outperformance is becoming stretched and a mean reversion toward altcoins is approaching. Conversely, a weekly RSI below 30 on BTC.D has coincided with peak altcoin euphoria, which has preceded sharp reversals back toward bitcoin. The RSI readings in mid-2026 sit in neutral territory near 55, consistent with a market that has not committed fully to either bitcoin dominance or altcoin rotation.
Comparing BTC.D against the Ethereum dominance chart (ETH.D) adds a second layer of analysis. In a classic altcoin season, ETH.D rises before smaller altcoins rally, because Ethereum often acts as the gateway between bitcoin and the broader altcoin market. When BTC.D is falling and ETH.D is rising simultaneously, it signals that capital is actively rotating down the risk curve. When BTC.D is falling but ETH.D is also falling, it suggests capital is skipping Ethereum entirely and flowing into higher-risk altcoins or memecoins, a pattern that tends to produce shorter and more fragile rallies.
Why institutional flows changed the game
The introduction of spot bitcoin ETFs in the United States in January 2024 altered the structural dynamics of BTC.D in ways that historical patterns did not anticipate.
Prior to ETFs, retail-driven capital rotated through a predictable cycle: bitcoin first, then Ethereum, then large-cap altcoins, then small-cap altcoins and memecoins. Each stage pulled dominance lower as capital flowed down the risk curve. This rotation powered the altcoin seasons of 2017 and 2021.
ETF capital does not rotate. Institutional investors buying bitcoin through BlackRock’s iShares Bitcoin Trust (IBIT) or Fidelity’s Wise Origin Bitcoin Fund (FBTC) are making an allocation to a specific asset class, not speculating on the crypto rotation trade. That capital enters bitcoin and stays in bitcoin. It does not flow into altcoins.
The result is a structural floor under BTC.D that did not exist in previous cycles. Even when retail traders rotate into altcoins, the persistent ETF inflows keep bitcoin’s market cap growing, limiting how far dominance can fall. This is why BTC.D has remained above 55 percent through mid-2026 despite several attempted altcoin rotations.
The Ethereum ETFs, approved in mid-2024, added a second institutional magnet but with far lower inflows than bitcoin ETFs. The concentration of institutional capital in just two assets, bitcoin and to a lesser extent Ethereum, has compressed the capital available for the rest of the market.
The asymmetry between bitcoin and altcoin ETF inflows reveals the depth of this structural shift. In the first 18 months of spot bitcoin ETF trading, cumulative net inflows exceeded $40 billion. Spot Ethereum ETFs, which launched in July 2024, attracted roughly $7 billion over the same period. No other cryptocurrency has a spot ETF in the United States as of mid-2026, meaning the vast majority of institutional capital entering crypto through regulated vehicles is directed exclusively at bitcoin.
This concentration has implications for dominance that extend beyond the raw numbers. ETF capital is sticky. Retail traders who buy altcoins on Binance or Coinbase can sell them in minutes during a panic. Institutional allocators who purchased bitcoin through an ETF as part of a portfolio allocation strategy typically rebalance quarterly, not reactively. The result is that bitcoin’s market cap declines more slowly during drawdowns than altcoin market caps, which mechanically pushes BTC.D higher during selloffs.
The second-order effect is on market maker behavior. As ETF-driven bitcoin volume has grown, market makers have concentrated liquidity in BTC pairs. Altcoin pairs on centralized exchanges have seen relative spreads widen and depth decline compared to 2021 levels. Thinner altcoin liquidity means larger percentage moves on smaller capital flows, which amplifies both altcoin rallies and altcoin crashes. This volatility asymmetry makes BTC.D movements faster and more pronounced during regime transitions than they were in pre-ETF cycles.
Common mistakes when reading BTC.D
Treating falling BTC.D as automatically bullish for altcoins. If total market cap is also falling (Regime 4), declining dominance means bitcoin is dropping faster than altcoins, not that altcoins are rallying. This happened briefly during the Mt. Gox distribution scare in July 2024.
Ignoring stablecoin market cap. When stablecoin supply grows, total market cap increases without any speculative capital entering bitcoin or altcoins. This mechanically pushes BTC.D lower and can create a false signal of altcoin strength.
Expecting historical cycles to repeat exactly. The 2017 and 2021 altcoin seasons occurred without ETFs, without institutional allocators, and with a much smaller total token count. The current cycle’s structural differences mean that BTC.D may not fall as far or as fast as it did in those periods.
Confusing BTC.D with bitcoin’s price direction. BTC.D can rise while bitcoin’s price falls (Regime 3) and can fall while bitcoin’s price rises (if altcoins are rising faster). Dominance measures relative performance, not absolute performance.
Using BTC.D for timing perpetual futures entries. Dominance shifts over weeks and months, not hours. Using BTC.D to time short-term leveraged trades adds a slow-moving indicator to a fast-moving decision, which rarely improves outcomes.
A sixth common error is anchoring expectations to round-number dominance levels without context. The belief that BTC.D “must” return to 40 percent because it did so in 2018 and 2021 ignores the structural changes introduced by ETFs, the growth of stablecoin market cap, and the expansion of the tracked token universe. Each of these forces exerts downward pressure on the absolute level of BTC.D independent of capital rotation, meaning the floor for dominance in this cycle may be materially higher than in previous ones. Adjusting expectations for structural shifts is as important as reading the chart itself.
What this article does not cover
This article does not cover specific altcoin analysis or recommendations. It does not cover the Ethereum dominance metric (ETH.D), which is a related but distinct indicator used for timing ETH-versus-altcoin rotations. It does not cover on-chain dominance metrics, which weight bitcoin’s share by transaction volume or active addresses rather than market capitalization.
Practical checks for using BTC.D
Always check total market cap alongside dominance. TradingView’s TOTAL ticker shows total crypto market cap. Use a split chart with BTC.D on top and TOTAL on the bottom to identify which of the four regimes the market is currently in.
Monitor the Altcoin Season Index. CoinMarketCap and Blockchaincenter.net publish real-time Altcoin Season Index scores. A reading above 75 confirms altcoin season. A reading below 25 confirms bitcoin season. Anything between 25 and 75 is neutral.
Track ETF inflows alongside dominance. Weekly ETF flow data from providers like SoSoValue and BitMEX Research shows whether institutional capital is reinforcing or counteracting dominance trends. Persistent weekly inflows above $500 million into bitcoin ETFs create a structural headwind for falling BTC.D.
Use the stablecoin-excluded version for cleaner signals. On TradingView, the ticker BTC.D with stablecoins excluded removes the noise introduced by USDT and USDC supply changes.
Set alerts at structural levels. A sustained daily close below 55 percent on BTC.D, combined with rising total market cap, has historically preceded the strongest altcoin rotations. Setting a TradingView alert at that level saves the effort of watching the chart continuously.
What is Bitcoin dominance?
Bitcoin dominance, abbreviated BTC.D, is the percentage of total cryptocurrency market capitalization that belongs to bitcoin. It is calculated by dividing bitcoin’s market cap by the total crypto market cap and multiplying by 100.
What does a rising BTC.D mean?
A rising BTC.D means bitcoin is gaining market share relative to the rest of the crypto market. This can occur because bitcoin is rallying faster than altcoins (bullish) or because altcoins are falling faster than bitcoin (bearish). Total market cap direction determines which scenario is in play.
What BTC.D level signals altcoin season?
There is no fixed threshold, but historically, sustained moves below 55 percent combined with rising total market cap have preceded broad altcoin rallies. The Altcoin Season Index score above 75 is the standard confirmation signal.
Why has BTC.D stayed high in 2025 and 2026?
Spot bitcoin ETFs, approved in January 2024, channel institutional capital directly into bitcoin without rotation into altcoins. This structural inflow creates a floor under BTC.D that did not exist in previous market cycles.
Does BTC.D include stablecoins?
The standard BTC.D calculation includes stablecoins in the denominator (total market cap). Some analysts use a stablecoin-excluded version for cleaner signals, which typically runs 3 to 5 percentage points higher.
How do I view BTC.D on TradingView?
Search for the ticker BTC.D on TradingView. The chart displays bitcoin dominance as a percentage over time and supports all standard technical analysis tools including trend lines, moving averages, and RSI.
Can BTC.D predict bitcoin’s price?
No. BTC.D measures bitcoin’s relative share of the crypto market, not its absolute price. Bitcoin’s price can rise while BTC.D falls (if altcoins rise faster) or fall while BTC.D rises (if altcoins fall faster). The two metrics answer different questions.
What was bitcoin’s lowest ever dominance?
Bitcoin dominance reached its all-time low near 38 percent in January 2018, at the peak of the ICO bubble. The rapid proliferation of thousands of new tokens pulled capital away from bitcoin before the subsequent bear market reversed the trend.
Disclaimer: This article is for informational purposes only and does not constitute financial, investment, or trading advice. Bitcoin dominance is a macro indicator, not a trading signal. Always conduct your own research before making any investment decisions. Published August 24, 2026.

Bernstein has maintained an Outperform rating and $140 price target on Circle Internet Group, implying about 59% upside after CRCL closed Friday at $87.98, as the brokerage expects USDC adoption to support the company even without passage of the CLARITY Act.
Summary
- Bernstein maintained its Outperform rating and $140 Circle price target, implying about 59% upside from Friday’s close.
- USDC supply increased by about $1.7 billion over the past week after nearly six months of largely flat growth.
- Adjusted stablecoin transaction volume is tracking at a $17 trillion annualized rate through July, according to Bernstein.
- Bernstein said Circle’s growth cycle can continue even if the CLARITY Act does not pass in September.
- Circle said more than 900 paid services use Agent Stack, with 99.3% of x402 agent payment volume settling in USDC.
Bernstein analysts led by Gautam Chhugani said in an Aug. 24 note that Circle’s next growth cycle does not depend on Congress passing the U.S. crypto market structure bill during the September session.
Circle shares gained more than 5% on Aug. 21 before closing at $87.98, according to Yahoo Finance data. The $140 target would put the stock about 59% above Friday’s closing price, although it remains below Bernstein’s previous $190 target from earlier this year.
Chhugani’s team tied its outlook to several sources of demand, including stablecoin payments, blockchain-based capital markets, tokenized assets and payments made by autonomous software agents.
The analysts also pointed to changes in global liquidity conditions. Bernstein said Bitcoin has benefited from demand for scarce assets while stablecoins have become another destination for dollars as the U.S. Treasury issues more short-term government debt.
USDC supply has started expanding again
After spending almost six months largely flat, USDC supply increased by about $1.7 billion during the past week, according to Bernstein.
The brokerage said USDC has become an important collateral asset across decentralized finance, tokenized equities, prediction markets and perpetual futures tied to real-world assets. Bernstein estimated that Circle’s stablecoin accounts for about 80% of decentralized exchange trading and finance volumes.
Stablecoin activity outside speculative trading is also expanding, according to the firm. Adjusted transaction volume, which Bernstein said excludes bots and high-frequency activity, reached about $11 trillion during 2025 and was running at an annualized pace of roughly $17 trillion through July 2026.
That pace represented an increase of about 60% from a year earlier, according to the brokerage.
Circle has also been expanding the institutional infrastructure through which businesses can use USDC. In July, crypto.news reported Circle received approval from the Office of the Comptroller of the Currency to establish Circle National Trust, a federally supervised national trust bank.
The approval allows the institution to provide digital asset custody services and could eventually place management of reserves backing USDC within the federally regulated entity, according to Circle.
Institutional access has expanded through banks and digital asset infrastructure providers as well. Circle said during its second-quarter results that Standard Chartered had introduced direct USDC minting and redemption access for institutional customers.
A separate July integration also brought USDC settlement through Fireblocks, allowing institutions to manage USDC balances across supported blockchains and route payments into local fiat currencies through Circle Payments Network.
Fireblocks said stablecoins accounted for 69% of transaction volume across its platform during the second quarter, while Circle said its Payments Network reached $14.7 billion in annualized transaction volume at the end of the quarter.
Circle sees agent payments as another USDC market
Machine-to-machine payments form another part of Bernstein’s Circle thesis, with the analysts pointing to USDC’s early lead in payments made through the x402 protocol.
Circle launched Agent Stack in May as infrastructure that allows software agents to hold assets, discover services and make programmable payments.
By the second quarter, Circle said the platform had more than 900 paid services, while 99.3% of x402 agent-payment volume was settling in USDC.
Independent data has also shown heavy USDC use in the category. A Keyrock report covered in May found that AI agents had settled $73 million across 176 million transactions over 12 months, with USDC handling 98.6% of those payments.
Circle has built Agent Wallets, an agent marketplace and nanopayment tools around the same use case. The company said Agent Stack lets developers set spending limits, allowlists and other controls while permitting agents to make USDC transactions without requiring a human to approve each payment.
For Bernstein, adoption of such services could create another source of stablecoin transaction demand outside cryptocurrency trading.
CLARITY Act outcome does not change Bernstein’s Circle thesis
Regulation remains one of the largest variables for Circle because U.S. lawmakers are still negotiating how stablecoin rewards and digital asset market structure should work.
Bernstein said the outcome of the CLARITY Act would not materially change its investment case.
“We believe, this growth cycle is independent of the Clarity Act passing in the September session,” the analysts wrote.
The brokerage said failure to secure Senate support during the expected Sept. 15 vote could prompt the Securities and Exchange Commission and Commodity Futures Trading Commission to take a larger role in providing regulatory guidance.
“We believe, the SEC/CFTC intervention would accelerate if the Senate does not support Clarity in the Sept. 15 vote,” Bernstein said.
Stablecoin rewards remain one of the contested parts of the legislation. Under the scenario outlined by Bernstein, failure of the bill would leave third-party reward programs operating under the existing model.
If the legislation passes, the analysts expect rewards to become more closely tied to customer activity instead of payments simply for holding an idle stablecoin balance.
Bernstein views either structure as workable for USDC.
Its view has remained consistent even as the language around stablecoin incentives has changed. In May, Bernstein backed Circle’s regulatory position after lawmakers advanced language that restricted deposit-like yield on passive stablecoin balances.
At the time, the brokerage said such restrictions could prevent stablecoin issuers from competing mainly by paying higher returns to token holders, reducing pressure on Circle to enter what the analysts described as an interest-rate competition.
Banking groups have since pushed lawmakers to tighten the rules further. Several U.S. banking organizations urged Senate leaders in July to revise provisions dealing with stablecoin rewards, arguing that some structures could still function like interest-bearing accounts.
Circle faces competition as payment infrastructure expands
Bernstein’s bullish call comes as Circle faces increased competition from other regulated stablecoin models.
Open USD has emerged as one challenge because its consortium structure distributes part of the reserve economics to participating companies, creating a different model from Circle’s approach of earning income from the assets backing USDC.
Mizuho downgraded Circle to Underperform in July and cut its target to $50, citing pressure that Open USD could place on Circle’s margins.
Circle President Heath Tarbert later defended the company’s position, arguing that USDC’s liquidity, existing integrations and regulatory infrastructure would be difficult for new competitors to reproduce quickly.
Circle has continued adding payment partners while competition develops. Its agreement with Japan’s JCB, announced in July, includes tests of USDC for corporate treasury transfers before possible use in merchant payments, while separate partnerships with Kakao and Toss are examining stablecoin settlement and programmable payments in South Korea.
USDC also entered BNY’s Digital Asset Custody platform in June, allowing institutional customers to mint, redeem, hold, and transfer the stablecoin through the bank.
Bernstein disclosed that Chhugani holds long positions in several cryptocurrencies and that the brokerage or its affiliates have maintained investment banking or other business relationships with Circle during the past 12 months.


Germany has extended its lead in European Union MiCA authorizations after six cooperative banks joined the latest register, taking the country’s total number of licensed crypto asset service providers to 79.
Summary
- Six German cooperative banks were added to ESMA’s latest MiCA register.
- Germany now leads the EU with 79 authorized CASPs, ahead of France with 35 and the Netherlands with 29.
- The EU’s total number of authorized crypto asset service providers has increased to 331.
- ESMA’s token and non compliant entity registers remained unchanged.
The European Securities and Markets Authority updated its interim Markets in Crypto Assets register on Friday, raising the number of authorized crypto asset service providers, or CASPs, across Europe to 331.
Compared with ESMA’s Aug. 12 update, all six newly added providers were German cooperative banks: Raiffeisenbank Aidlingen, Ihre Volksbank, VR Bank Mittelfranken Mitte, Volksbank Euskirchen, VR Bank Ried Überwald and Volksbank Backnang.
Germany now has more than twice as many authorized CASPs as France, which ranks second with 35, while the Netherlands follows with 29.
Germany’s MiCA lead has widened since June
Germany already held the top position before the latest additions. In late June, the country had 57 licensed providers, representing about 23% of the EU total at the time.
As crypto.news previously reported, ESMA’s register contained 244 valid MiCA licenses as of June 29, with Germany and France accounting for more than one third of the authorizations then issued across the bloc.
The latest count means Germany has added 22 authorized providers since that late June snapshot, while the overall European register has increased by 87.
Licensing continued after the July 1 end of MiCA’s transitional arrangements. By July 23, ESMA had recorded 309 authorized providers after another 15 CASPs entered the register.
Among that group were four German entries, including Raiffeisenbank Falkenstein Wörth, Spar und Kreditbank Rheinstetten, VR Bank Augsburg Ostallgäu and JT Technologies. BNY’s Belgian banking subsidiary also joined during the same update after receiving authorization for crypto custody and transfer services, according to previous register coverage.
Cooperative banks add to Germany’s MiCA count
The latest six approvals add another group of cooperative banks to a German licensing pool that already includes several institutions from the same banking network.
Germany’s cooperative banking sector has also started expanding direct access to cryptocurrencies for retail customers. A July report showed that DZ Bank had begun rolling out crypto trading through participating cooperative banks, allowing customers to buy and sell digital assets through their existing banking relationships.
DZ Bank had received BaFin approval under the MiCA framework in January for its meinKrypto platform following about a year of trials. The service was prepared with support for Bitcoin, Ethereum, Litecoin and Cardano, while Boerse Stuttgart Digital was selected to handle custody.
Through the setup, participating cooperative banks can provide crypto trading within their existing customer services instead of requiring users to open separate accounts with cryptocurrency exchanges.
Germany’s licensing numbers include institutions whose permitted crypto activities differ by authorization and business model, meaning the CASP total does not show how many providers offer the same set of services.
MiCA covers several categories of crypto activity, including custody, operation of trading platforms, exchange of crypto assets for funds or other crypto assets, execution of client orders, portfolio management and transfer services.
BaFin links Germany’s lead to its financial sector
Germany’s Federal Financial Supervisory Authority, BaFin, told Cointelegraph in June that the country’s high number of MiCA authorizations partly stems from the size of its financial sector and the number of credit institutions eligible to provide crypto services.
BaFin also pointed to Germany’s regulatory system before MiCA. Providers that had already operated under the country’s national licensing framework could, in some cases, use simplified procedures when seeking authorization under the EU rules.
Germany had classified crypto custody as a regulated financial service before MiCA became fully applicable, leaving the regulator with an existing supervisory framework for companies moving into the European regime.
MiCA introduced a common authorization system for crypto service providers across EU member states. Once approved by a national competent authority, a CASP can use passporting rights to provide covered services in other parts of the bloc after completing the required notification process.
The regulation entered full application at the end of 2024, although transitional arrangements allowed eligible companies operating under earlier national regimes to continue for a limited period.
Those arrangements reached their final deadline on July 1, 2026. Earlier reporting on the MiCA transition deadline found that providers without the required authorization could no longer rely on previous national registrations to continue covered services once their transition periods expired.
The authorization register consequently became an important reference for firms and customers checking which providers had secured permission under the common EU framework.
ESMA’s other MiCA registers remain unchanged
While the CASP list has continued to expand, ESMA made no changes in its latest update to the datasets covering asset referenced tokens, electronic money tokens and non compliant entities.
The asset referenced token register remained empty, while the electronic money token register continued to contain 43 entries.
ESMA’s list of non compliant entities also remained at 167.
The CASP register, by comparison, has continued climbing since late June. Authorized providers increased from 244 on June 29 to 309 by July 23 before reaching 331 in the latest update.
Regulatory work has also moved into supervision of companies that have already received licenses. In July, ESMA launched a review of MiCA authorized crypto custodians covering operational resilience, custody controls, key management, incident response procedures and risks involving third party service providers.
For the latest German additions, ESMA’s register identifies Raiffeisenbank Aidlingen, Ihre Volksbank, VR Bank Mittelfranken Mitte, Volksbank Euskirchen, VR Bank Ried Überwald and Volksbank Backnang as the six entries added since Aug. 12, leaving Germany with 79 authorized CASPs compared with France’s 35 and the Netherlands’ 29.


A margin call warns that your collateral can no longer support an open leveraged position. Ignore it and the exchange closes the trade for you.
Summary
- A margin call is a notification that a leveraged position’s equity has fallen below the exchange’s maintenance threshold, requiring additional collateral or a reduction in position size.
- Margin calls sit between healthy positions and forced liquidation; they are a warning, not an execution.
- On major exchanges such as Binance and Bybit, the maintenance margin rate for large-cap pairs like BTCUSDT starts at 0.5 percent of position value and rises with notional size.
- The October 2025 liquidation cascade wiped out roughly $19.3 billion in leveraged positions within 24 hours after traders ignored or could not meet margin calls fast enough.
- Understanding initial margin, maintenance margin, and liquidation price is the minimum knowledge required before opening any leveraged crypto trade.
A margin call is a concept borrowed from traditional finance that carries sharper consequences in cryptocurrency markets. In equities, a broker phones you (the origin of the word “call”) and gives you a day or two to deposit more money. In crypto, the process is automated, runs around the clock, and can escalate from warning to liquidation in minutes.
The distinction matters because crypto markets never close. A margin call that arrives at 3 a.m. on a Sunday gives a trader the same narrow window to respond as one that arrives at noon on a Tuesday. That permanent availability, combined with the volatility common to digital assets, is why margin calls in crypto deserve their own explanation rather than a footnote in a broader trading guide.
How margin trading works
Margin trading lets a trader control a position larger than the capital in the account. The trader deposits collateral, the exchange lends the rest, and the combined amount opens the position. If the trade moves favorably, profits scale with the full position size. If it moves against the trader, losses also scale with the full position size.
Two numbers govern the arrangement. The first is the initial margin, which is the deposit required to open the trade. At 10x leverage the initial margin is 10 percent of the position. A trader wanting to control $10,000 in bitcoin deposits $1,000.
The second is the maintenance margin, which is the minimum equity the account must hold to keep the position open. On Binance, the maintenance margin rate for a BTCUSDT perpetual position under two million USDT is 0.5 percent of position value. On Bybit, the same pair at the same tier carries an identical 0.5 percent rate. These figures rise as position size increases, a tiered structure designed to limit systemic risk from outsized bets.
The gap between initial margin and maintenance margin is the buffer zone. As long as account equity stays above the maintenance threshold, the position remains open. When equity falls into that gap, the margin call fires.
It is worth noting that the term “margin trading” covers two distinct products on most exchanges. Spot margin trading borrows the actual asset (bitcoin, ether, or stablecoins) and uses the trader’s portfolio as collateral. Futures margin trading uses collateral to open a derivatives contract that tracks the asset’s price without owning it. Both are subject to margin calls, but the mechanics of liquidation and the fee structures differ. Spot margin typically charges an hourly or daily borrowing rate, while futures margin involves funding rates exchanged between long and short holders every eight hours.
What triggers a margin call
A margin call fires when account equity falls below the maintenance margin requirement. The math is straightforward but the speed at which it happens in crypto markets is not.
Consider a trader who opens a 20x long position on bitcoin at $100,000 with $5,000 in collateral, controlling $100,000 in notional value. The maintenance margin at 0.5 percent is $500. That means the account can absorb a loss of $4,500 before the maintenance threshold is breached, which translates to a 4.5 percent decline in bitcoin’s price.
A 4.5 percent move in bitcoin can happen in under an hour during volatile sessions. On October 11, 2025, bitcoin fell from roughly $122,000 to under $105,000, a decline of more than 13 percent, in a matter of hours. Every trader holding a 20x long with less than 13 percent of position value as collateral was not just margin called but liquidated outright.
Three factors determine how quickly a margin call arrives: the leverage multiple, the volatility of the underlying asset, and whether the trader uses isolated or cross margin. A fourth factor, often overlooked, is the accumulated cost of funding rates. A trader holding a leveraged long position during a period of positive funding pays a percentage of the position value every eight hours. Over days or weeks, those payments silently reduce the equity cushion, pulling the account closer to the margin call threshold even when the price has not moved.
Isolated margin versus cross margin
Exchanges offer two margin modes and the choice directly affects when and how margin calls arrive.
In isolated margin mode, the collateral assigned to a position is fixed at the amount the trader allocates at entry. If that position moves against the trader, only the isolated collateral is at risk. The margin call and any subsequent liquidation affect only that one trade. Other positions and the remaining account balance are untouched.
In cross margin mode, the entire account balance serves as collateral for all open positions. This means a winning trade on one pair can subsidize a losing trade on another, delaying margin calls. The downside is that a single catastrophic loss can drain the entire account because the exchange will pull from all available equity before liquidating.
Most exchanges default to cross margin because it reduces the frequency of liquidations, which benefits both the trader and the exchange. However, cross margin also means that a margin call on one position is a warning about the health of the entire portfolio, not just a single trade.
The choice between modes carries practical consequences beyond risk management. In isolated mode, a trader can run multiple independent positions with separate risk profiles. A high-conviction, high-leverage trade on bitcoin can coexist with a conservative, low-leverage position on ether without the two interfering. In cross mode, a sudden spike in bitcoin volatility can drain the equity supporting the ether position, triggering a margin call on a trade that was performing well on its own.
What happens after a margin call
A margin call is not a liquidation. It is the step before liquidation. The trader has a narrow window to respond in one of three ways.
The first option is to deposit additional collateral. Adding funds to the margin account raises the equity above the maintenance threshold and cancels the margin call. In cross margin mode this can be as simple as transferring stablecoins from a spot wallet to the futures wallet.
The second option is to reduce the position. Closing part of the trade lowers the notional exposure, which reduces the maintenance margin requirement. A trader holding $100,000 in exposure who closes half now only needs to maintain margin on $50,000.
The third option is to do nothing and accept the risk of liquidation. If the price continues to move against the position and equity falls to the liquidation threshold, the exchange closes the trade automatically. The trader loses the margin posted to that position, and on some platforms, an additional auto-deleveraging mechanism may activate to settle imbalances.
The window between margin call and liquidation varies by exchange and by how quickly the price is moving. During calm markets it may last hours. During a cascade it can collapse to seconds. On some exchanges, the margin call notification arrives as an email, a push notification, or both. On others, the only signal is the changing margin ratio displayed on the trading interface. Relying on email notifications during a fast-moving market is unreliable because the price can breach the liquidation threshold before the email reaches the inbox.
How margin calls differ across exchanges
Each major exchange handles margin calls slightly differently, and understanding these differences matters when choosing where to trade.
Binance uses a tiered maintenance margin system. As position size grows, the maintenance margin rate increases in steps. A BTCUSDT position under $50,000 requires 0.4 percent maintenance margin. Between $50,000 and $250,000, the rate rises to 0.5 percent. Above $5 million, it reaches 5 percent. Binance sends margin call notifications via app push, email, and SMS when the margin ratio approaches the liquidation threshold.
Bybit uses a similar tiered structure and offers both unified and standard margin accounts. The unified margin account allows traders to use unrealized profits from one position as collateral for another, which can delay margin calls but also increases the blast radius of a single bad trade. Bybit also provides an auto-deposit function that transfers funds from the spot wallet to the derivatives wallet when the margin ratio falls below a user-configured level.
OKX implements a portfolio margin mode for larger accounts that calculates risk across all positions using a stress-testing model. Under portfolio margin, the maintenance requirement reflects the net risk of the portfolio rather than the sum of individual position requirements. This can significantly reduce the margin needed for hedged positions but requires a minimum account balance of $10,000.
Decentralized perpetual exchanges like Hyperliquid and dYdX operate differently. They have no margin call notification system. The on-chain liquidation engine simply closes positions when the margin ratio hits the threshold. There is no warning, no email, and no buffer period. The speed of liquidation depends on the blockchain’s block time and the efficiency of the liquidation bots monitoring the protocol.
Common mistakes that lead to margin calls
Reviewing the trading histories of liquidated accounts reveals patterns that repeat across market cycles. The most frequent mistake is treating leverage as a volume dial rather than a risk multiplier. A trader who profits at 5x leverage does not double their profits by moving to 10x; they double their exposure to liquidation while the market’s volatility remains unchanged.
The second most common mistake is ignoring unrealized losses. A trader holding a losing position often convinces themselves that the market will reverse before the margin call arrives. In traditional markets, where trading halts and circuit breakers provide cooling-off periods, this reasoning occasionally works. In crypto, where there are no circuit breakers and liquidity can evaporate in seconds during a cascade, waiting for a reversal is a strategy with no structural support.
A third pattern is overconcentration. Traders who place their entire margin account into a single leveraged position on a single asset have no diversification to absorb shocks. Even traders who use cross margin benefit from holding multiple uncorrelated positions, because a loss on one pair can be partially offset by a gain on another. A portfolio consisting solely of a 20x long on bitcoin is not a portfolio; it is a single bet with borrowed money.
The fourth mistake is failing to account for slippage during volatile periods. The liquidation price calculated at entry assumes that the exchange can close the position at exactly that price. In practice, during a cascade, the actual execution price can be significantly worse due to thin order books and rapid price movement. This slippage means the trader may lose more than the margin posted, particularly on less liquid altcoin pairs where the bid-ask spread widens dramatically during sell-offs.
Finally, many traders neglect the compounding effect of trading fees on their margin buffer. Opening and closing leveraged positions incurs maker or taker fees, typically 0.01 to 0.06 percent of notional value on major exchanges. At 20x leverage, a round trip (open and close) on a $100,000 notional position costs $20 to $120 in fees alone. For active traders executing multiple trades per day, these costs accumulate and silently reduce the equity available to absorb losses. A margin account that appears healthy at the start of a trading session can drift toward a margin call purely through fee erosion, without a single losing trade.
Liquidation cascades and why margin calls matter at scale
The reason margin calls matter beyond individual trades is the cascade effect. When a large number of leveraged positions receive margin calls simultaneously and traders cannot meet them, the resulting liquidations flood the market with forced sell orders. Those sell orders push the price lower, which triggers more margin calls, which triggers more liquidations.
The October 2025 cascade is the clearest example. Approximately 1.6 million traders were liquidated, and total forced closures reached $19.3 billion in 24 hours. Market makers estimated the true total approached $30 to $40 billion once undisclosed positions on less transparent venues were included. Over $560 billion in total market value was erased.
The pattern repeated in 2026. On January 20, more than 182,000 traders lost over $1.08 billion in a single day, nearly all of it long bitcoin and ethereum perpetual futures positions. On February 1, a session labeled “Black Sunday II” erased $2.2 billion in 24 hours, with ethereum longs alone losing $961 million.
These events share a common thread: leverage rebuilds after every cascade. Data from derivatives analytics platforms shows open interest recovering to pre-crash levels within two to four weeks after each event, setting the stage for the next round of margin calls. The speed of recovery suggests that many traders view liquidation as a cost of doing business rather than a signal to reduce risk, which virtually guarantees that cascades will continue to recur.
How to calculate your liquidation price
Knowing the liquidation price before entering a trade is the single most practical defense against an unexpected margin call. The formula differs slightly between isolated and cross margin, but the core logic is the same.
For a long position in isolated margin mode: liquidation price equals entry price multiplied by one minus one divided by the leverage multiple, adjusted for the maintenance margin rate. At 10x leverage with a 0.5 percent maintenance rate and a $100,000 entry, the liquidation price is roughly $90,450. At 20x leverage with the same parameters, the liquidation price rises to approximately $95,225. The difference between 10x and 20x is not just a wider or narrower buffer; it is the difference between surviving a routine pullback and getting wiped out by one.
For a short position, the formula inverts: liquidation price equals entry price multiplied by one plus one divided by the leverage multiple, again adjusted for the maintenance margin rate.
Every major exchange displays the estimated liquidation price when a position is opened. The number updates in real time as the price moves and as collateral is added or removed. Ignoring it is the most common mistake among new margin traders. A useful habit is to note the liquidation price immediately after opening a position and set a price alert at a level 20 percent above it (for longs) or 20 percent below it (for shorts). That alert serves as a personal margin call that arrives before the exchange’s automated one.
Margin calls in DeFi versus centralized exchanges
Margin calls on centralized exchanges like Binance or Bybit are managed by the exchange’s risk engine, which monitors positions and sends notifications. In decentralized finance, the process is handled by smart contracts and there is no notification.
On lending protocols like Aave or Compound, borrowers post crypto collateral and receive loans. Each position has a health factor, a ratio of collateral value to debt. When the health factor drops below one, the position becomes eligible for liquidation by any third party running a liquidation bot. There is no margin call in the traditional sense. The transition from healthy to liquidated can happen in a single block, roughly 12 seconds on Ethereum.
This difference means that DeFi margin management requires more proactive monitoring. Traders who use basis trading strategies across centralized and decentralized venues must account for the fact that their DeFi positions have no warning stage.
DeFi liquidations also carry an additional cost that centralized exchange liquidations do not: the liquidation penalty. When a position on Aave is liquidated, the liquidator receives a bonus (typically 5 to 10 percent of the collateral) as an incentive for performing the liquidation. This penalty is deducted from the borrower’s remaining collateral, meaning the borrower loses more than just the position. On centralized exchanges, the liquidation fee is typically a flat rate (0.5 to 1.5 percent) applied to the remaining margin. The DeFi penalty structure means that getting liquidated on a lending protocol is proportionally more expensive than getting liquidated on a centralized exchange.
Practical steps to manage margin risk
Managing margin risk is not about avoiding leverage entirely. It is about sizing leverage to survive the volatility that the chosen asset routinely produces.
Check historical drawdowns before choosing leverage. Bitcoin has produced intraday drawdowns exceeding 10 percent multiple times per year. At 10x leverage, a 10 percent move liquidates the position entirely. Running 10x on an asset that regularly moves 10 percent in a day is not trading; it is a coin flip with extra steps.
Set alerts at the maintenance margin level, not at the liquidation price. Most exchange apps and third party tools allow custom price alerts. Setting one at the price that would trigger a margin call gives time to act before the exchange acts for you.
Use isolated margin for directional bets. Isolated margin caps the damage to the collateral assigned to that specific trade. Cross margin is appropriate for hedged portfolios where positions offset each other, not for one-way speculative bets.
Keep a collateral buffer. Maintaining equity at least 15 to 20 percent above the maintenance threshold provides a cushion against sudden moves. Research from derivatives analytics platforms suggests that this buffer alone reduces the incidence of margin calls by more than 60 percent among active traders.
Know the funding rate. On perpetual futures contracts, a funding rate is exchanged between longs and shorts every eight hours. When funding is deeply negative, long holders pay shorts, which slowly erodes margin even when the price does not move. A position that looks safe on price alone can drift toward a margin call through accumulated funding payments.
Size positions to survive worst-case scenarios. Before opening a leveraged trade, ask one question: can this position survive the largest single-day drawdown the asset has experienced in the past 12 months? If the answer is no, the leverage is too high. This single test eliminates most margin call risk because it forces the trader to size for reality rather than for the best case.
What this article does not cover
This article does not cover the tax treatment of liquidation events, which varies by jurisdiction and requires professional advice. It does not cover the mechanics of options margin, which follows a different model based on Greeks and volatility surfaces. It also does not cover specific exchange interfaces or step-by-step trading tutorials, as those change frequently and are better served by exchange documentation.
What is a margin call in crypto?
A margin call is a warning from an exchange or lending protocol that a leveraged position’s collateral has fallen below the required maintenance threshold. It prompts the trader to deposit more funds or reduce the position to avoid forced liquidation.
How is a margin call different from liquidation?
A margin call is the warning stage; liquidation is the execution stage. The margin call notifies the trader that equity is dangerously low. If the trader does not respond and equity continues to fall, the exchange closes the position automatically through liquidation.
What is maintenance margin in crypto trading?
Maintenance margin is the minimum amount of equity that must remain in a margin account to keep a leveraged position open. On major exchanges, the maintenance margin rate for large-cap pairs like BTCUSDT starts at 0.5 percent of notional position value.
Can I get a margin call on a DeFi lending protocol?
DeFi protocols like Aave do not send margin calls. Instead, positions become eligible for liquidation by third-party bots when the health factor drops below one. There is no warning notification; the transition from healthy to liquidated can happen in a single blockchain block.
What is the difference between isolated and cross margin?
Isolated margin limits collateral to a single position, capping potential loss. Cross margin uses the entire account balance as collateral for all positions, which delays margin calls but exposes the full account to a single bad trade.
How much leverage is safe in crypto?
There is no universally safe leverage level because it depends on the asset’s volatility. For bitcoin, which routinely moves 5 to 10 percent in a day, leverage above 5x leaves very little room before a margin call. Many professional traders operate at 2x to 3x for directional positions.
What caused the October 2025 liquidation cascade?
The October 11, 2025 cascade followed President Trump’s announcement of a 100 percent tariff on Chinese imports. Bitcoin fell from roughly $122,000 to under $105,000 in hours, liquidating approximately 1.6 million traders and erasing $19.3 billion in leveraged positions within 24 hours.
How can I avoid getting margin called?
Keep leverage low relative to the asset’s typical volatility, use isolated margin for directional bets, maintain a collateral buffer of at least 15 to 20 percent above the maintenance threshold, set price alerts at the margin call level rather than the liquidation price, and monitor funding rate costs on perpetual futures positions.
Disclaimer: This article is for informational purposes only and does not constitute financial, investment, or trading advice. Margin trading and leverage involve substantial risk of loss. Always conduct your own research and consult a qualified financial advisor before making any trading decisions. Published August 24, 2026.


Etherscan is the most widely used Ethereum blockchain explorer. It turns raw on-chain data into searchable records of transactions, wallets, smart contracts, and gas costs.
Summary
- Etherscan is a free blockchain explorer and analytics platform that indexes every transaction, address, token transfer, and smart contract deployed on Ethereum since the network launched in 2015.
- Founded by Matthew Tan in 2015, Etherscan now operates explorers for more than 30 blockchains through its parent company Blockscan, including BscScan, PolygonScan, and the acquired Solana explorer Solscan.
- The platform processes data from over 2.8 billion cumulative Ethereum transactions and tracks more than 300 million unique addresses.
- Core features include a gas tracker, token approval checker, contract verification tool, and an API that serves over 500 million calls per day from wallets, portfolio trackers, and DeFi dashboards.
- Etherscan is not a wallet and cannot move funds; it is a read-only window into blockchain activity that anyone can use without creating an account.
Most people encounter Etherscan for the first time when a transaction takes longer than expected and they want to know what happened. They paste a hash into the search bar, see a wall of unfamiliar fields, and close the tab. That reaction is understandable because Etherscan surfaces raw blockchain data with minimal hand holding.
The tool is worth learning because every interaction with Ethereum leaves a permanent, public record, and Etherscan is the standard interface for reading those records. Whether the goal is confirming that a transfer arrived, inspecting a smart contract before approving a token spend, or checking whether current gas prices justify a swap, the answer lives on Etherscan.
How a blockchain explorer works
A blockchain explorer is a search engine for on-chain data. Ethereum nodes store the complete history of every block, transaction, and state change since the genesis block on July 30, 2015. That data is public but not easily readable in its raw form. An explorer like Etherscan runs its own Ethereum nodes, indexes the data into a searchable database, and presents it through a web interface.
The indexing process is what separates an explorer from a node. A standard Ethereum node can answer queries about specific blocks or transactions, but it cannot efficiently search across the entire chain. Etherscan builds and maintains database indexes that allow users to search by address, transaction hash, block number, token name, or ENS domain and receive results in milliseconds.
This architecture means Etherscan is a centralized service reading decentralized data. The blockchain itself remains trustless and permissionless, but the explorer layer is operated by a private company. If Etherscan went offline, the data would still exist on every Ethereum node. Users would simply need a different tool to read it. Alternatives like Blockscout (open source and self-hostable), Dune Analytics (SQL-based custom queries), and Tenderly (developer-focused debugging) exist, but none matches Etherscan in mainstream adoption or breadth of indexed data.
Reading a transaction on Etherscan
Every Ethereum transaction has a unique identifier called a transaction hash, a 66-character string starting with 0x. Pasting this hash into the Etherscan search bar opens the transaction details page, which displays several fields.
Transaction hash is the unique identifier. Status shows whether the transaction succeeded or failed. A failed transaction still consumes gas and is recorded on-chain. Block is the block number in which the transaction was included. Timestamp shows when the block was mined. From is the sender address. To is the recipient address, which can be a wallet or a smart contract.
Value shows the amount of ETH transferred. Transaction fee shows the total gas cost in ETH. Gas price shows the price per unit of gas in gwei, where one gwei equals one billionth of one ETH. Gas limit and usage shows the maximum gas the sender was willing to spend and how much was actually consumed.
For transactions that interact with smart contracts, an additional section called Input data shows the function call and its parameters. Etherscan decodes this data for verified contracts, translating hexadecimal input into human-readable function names and arguments. For unverified contracts, the input data appears as raw hexadecimal, which requires external tools to decode.
A detail that new users often miss is the internal transactions tab on the transaction page. When a smart contract calls another smart contract during execution, those nested transfers appear as internal transactions. They are not separate entries on the blockchain but sub-operations within the parent transaction. A single swap on Uniswap, for example, can generate multiple internal transactions as the router contract moves tokens between liquidity pools. Checking this tab is essential for understanding the full flow of funds in complex DeFi interactions.
Reading a wallet address
Searching for an Ethereum address on Etherscan opens the address page, which serves as a complete financial history of that wallet. The overview tab shows the ETH balance, the dollar value at current prices, and the total value of ERC-20 tokens held.
The transactions tab lists every ETH transfer sent or received by the address, ordered by time. The internal transactions tab shows transfers triggered by smart contract execution, which do not appear in the standard transaction list. The token transfers tab shows every ERC-20 and ERC-721 (NFT) movement associated with the address.
For addresses that are smart contracts, Etherscan displays additional tabs. The contract tab shows the source code if the developer has verified it. The read contract and write contract tabs allow users to interact with the contract’s public functions directly through the Etherscan interface, though writing requires connecting a wallet.
One practical use of the address page is checking whether a wallet has granted unlimited token approvals to smart contracts. The Token Approvals tool, accessible from the More menu, lists every contract that has permission to spend tokens on behalf of the wallet. Revoking unnecessary approvals is a basic security hygiene step that many users overlook.
Etherscan also labels known addresses. Exchange hot wallets, bridge contracts, and flagged scam addresses carry visible tags that appear next to the address. These labels are curated by Etherscan’s team and by community submissions. If an address you are about to interact with carries a warning label, stop and investigate before proceeding. The label system has identified thousands of phishing contracts and helped users avoid sending funds to malicious addresses.
The gas tracker
The Etherscan gas tracker is one of the most visited pages on the platform. It displays real-time gas prices in three tiers: low, average, and high. Each tier shows the estimated cost in gwei and the approximate confirmation time.
As of mid-2026, Ethereum mainnet gas prices have dropped dramatically following the Dencun upgrade and the migration of transaction volume to Layer 2 networks. Average gas prices in early 2026 fell to roughly 0.47 gwei, down from 1.67 gwei a year earlier. Mainnet transaction fees dropped approximately 95 percent to about $0.01 per transaction for simple transfers.
The gas tracker also shows the estimated cost in dollars for common operations: a simple ETH transfer, an ERC-20 token transfer, a Uniswap swap, and an NFT mint. These estimates update every few seconds and are useful for deciding whether to execute a transaction now or wait for a cheaper window.
Below the real-time tracker, Etherscan publishes historical gas price charts that show trends over days, weeks, and months. These charts reveal patterns such as lower gas during weekends and early morning hours in US time zones, which can inform timing decisions for non-urgent transactions. Understanding these patterns can save meaningful amounts on gas-intensive operations like deploying contracts or interacting with complex DeFi protocols, even with the lower base fees of 2026.
Verifying smart contracts
Contract verification is one of Etherscan’s most important features for security. When a developer deploys a smart contract to Ethereum, only the compiled bytecode is stored on-chain. Bytecode is machine-readable but not human-readable. Verification is the process of uploading the original source code to Etherscan so that anyone can read it and confirm that the bytecode on-chain matches the source code.
A verified contract displays a green checkmark on its Etherscan page. Users can read every function, check the logic, and verify that the contract does what the project claims. An unverified contract displays only raw bytecode, which requires specialized tools to decompile and is never as clear as the original source.
Before interacting with any DeFi protocol, checking whether its core contracts are verified on Etherscan is a minimum due diligence step. Unverified contracts are not necessarily malicious, but the inability to inspect the code removes a layer of transparency that verified contracts provide. Projects that refuse to verify their contracts after being asked should be treated with caution, as there is no legitimate reason to hide source code for a protocol asking users to deposit funds.
Using Etherscan for security and due diligence
Beyond basic transaction lookups, Etherscan is a powerful tool for investigating the legitimacy of tokens, contracts, and projects before committing funds.
Token holder distribution. Searching for a token contract on Etherscan reveals the Holders tab, which shows how the token supply is distributed across addresses. A token where a single non-exchange wallet holds 40 percent of the supply presents a concentration risk that the project’s marketing materials will not mention. Comparing the top holder addresses against known exchange hot wallets (which Etherscan labels) helps distinguish between genuine distribution and artificial concentration.
Contract creation history. The contract creator address and creation transaction are visible on every contract’s Etherscan page. Checking the creator address reveals whether the same deployer has launched other contracts, and whether any of those previous contracts were flagged as scams. A deployer address with a history of abandoned or rug-pulled tokens is a warning sign that no amount of marketing can override.
Transaction pattern analysis. Examining the transaction history of a contract over time can reveal suspicious patterns. A DeFi protocol that claims thousands of active users but shows only a handful of unique addresses interacting with it is misrepresenting its adoption. Similarly, a token with high reported trading volume but very few actual on-chain transfers may be the subject of wash trading on centralized exchanges.
Event logs. The Events tab on a contract page shows every event emitted by the contract. Events are structured log entries that contracts use to record significant actions (transfers, approvals, swaps, liquidations). Advanced users can filter events by type to track specific activity, such as all large transfers above a certain threshold or all ownership changes in a protocol’s governance contract.
Etherscan’s API
Behind the web interface, Etherscan operates an API that serves over 500 million calls per day. The API provides programmatic access to the same data available on the website: account balances, transaction lists, token transfers, contract ABIs, gas prices, and block data.
Free API accounts are limited to five calls per second. Paid plans increase the rate limit and add features such as higher throughput, priority support, and access to archival data. The API is the backbone of many third-party tools: portfolio trackers like Zapper and DeBank, wallet interfaces like MetaMask (for transaction history), and DeFi dashboards all pull data from Etherscan’s API.
Developers building on Ethereum use the API for tasks such as monitoring wallet activity, tracking token transfers, verifying contract deployment, and estimating gas costs. The documentation covers endpoints for accounts, transactions, blocks, tokens, gas, stats, and logs, with response formats in JSON. For applications that need real-time data, Etherscan also supports webhooks that push notifications when specific on-chain events occur, such as a deposit arriving at a monitored address.
Beyond Ethereum: Blockscan and multichain explorers
Etherscan started as an Ethereum-only tool, but the team recognized early that the multichain future would require explorers for every network. In June 2020, Matthew Tan launched Blockscan, a parent platform that now operates explorers for more than 30 blockchains.
The most prominent are BscScan for BNB Chain, PolygonScan for Polygon, Arbiscan for Arbitrum, and Optimistic Etherscan for OP Mainnet. Each explorer maintains the same interface conventions as the original Etherscan, so users who learn one can navigate them all.
In early 2024, the company acquired Solscan, the leading Solana blockchain explorer. The acquisition extended the Blockscan family beyond EVM-compatible chains for the first time, signaling an ambition to become the default explorer layer across the entire industry.
Blockscan also operates a multichain search engine that allows users to search an address or transaction hash across all supported chains simultaneously. This is useful for tracking assets that have been bridged between networks, where a single address may have activity on Ethereum mainnet, Arbitrum, and Polygon. The unified search eliminates the need to manually check each chain’s explorer when tracing cross-chain fund flows.
ENS domain lookups and name resolution
Etherscan integrates with the Ethereum Name Service (ENS), which maps human-readable names like vitalik.eth to Ethereum addresses. Searching for an ENS name on Etherscan resolves it to the underlying address and displays the same address page as a direct address search. This integration makes it possible to look up any ENS-registered wallet by name rather than memorizing or copying a 42-character hexadecimal address.
The ENS integration extends beyond simple lookups. Etherscan displays the ENS name alongside the address throughout its interface, including in transaction sender and recipient fields, token holder lists, and contract interaction logs. This contextual labeling makes transaction histories significantly easier to read, as “vitalik.eth” conveys more information at a glance than “0xd8dA6BF26964aF9D7eEd9e03E53415D37aA96045.”
ENS names can also reveal information about a wallet’s purpose or owner. Project treasury wallets, DAO multisigs, and known community members often register descriptive ENS names. When investigating an unfamiliar address, checking whether it has an ENS name associated with it is a quick first step that can provide immediate context.
Tracking whales and large transactions
Etherscan provides several tools for monitoring large-scale on-chain activity. The top accounts page ranks all Ethereum addresses by ETH balance, providing a real-time view of the largest holders on the network. The token holder pages for individual ERC-20 tokens offer the same ranking for specific assets.
For users who want automated monitoring, Etherscan’s address watch list feature (available to registered accounts) sends email alerts whenever a watched address sends or receives funds. This is commonly used to track exchange cold wallets for signs of large deposit movements (which can precede sell pressure), protocol treasury addresses for grant disbursements, and known whale wallets for position changes that may signal market direction.
The combination of labeled addresses, ENS names, and transaction history makes Etherscan the primary tool for on-chain researchers who track fund flows across DeFi protocols, bridge exploits, and exchange movements. When a major hack or exploit occurs, the first public analysis typically references Etherscan transaction links as evidence of how funds moved from the victim to the attacker and through subsequent laundering steps.
Common misunderstandings about Etherscan
Several misconceptions about Etherscan persist among both new and experienced users. The most common is the belief that Etherscan can reverse or cancel transactions. Once a transaction is confirmed on the Ethereum blockchain, it is permanent. Etherscan displays it but has no ability to modify, reverse, or cancel it. The only entity that could theoretically reverse a confirmed transaction is the Ethereum network itself through a hard fork, which has happened exactly once in its history (the 2016 DAO hack) and is extremely unlikely to recur.
A second misconception is that Etherscan shows all activity related to a wallet. While Etherscan is comprehensive for Ethereum mainnet, it does not display activity on Layer 2 networks like Arbitrum, Optimism, or Base. A wallet that appears inactive on Etherscan may have significant activity on L2 chains that requires checking the respective Blockscan explorer (Arbiscan, Optimistic Etherscan, or BaseScan) to see.
A third misconception is that “verified” on Etherscan means “safe.” Verification means the source code matches the deployed bytecode. It does not mean the code has been audited, that the contract is free of vulnerabilities, or that the project behind it is legitimate. Verified scam contracts exist. Verification is a transparency measure, not a safety certification. Users should still check whether the contract has been audited by a reputable security firm, whether the project has a track record, and whether the contract’s ownership and upgrade patterns are appropriate before depositing funds.
A fourth point of confusion involves pending transactions. When a transaction is broadcast to the network but not yet included in a block, it appears in Etherscan’s pending transaction pool (mempool viewer). Users sometimes mistake a pending transaction for a failed one and attempt to send a replacement, which can result in duplicate transactions if the original eventually confirms. Checking the status field (pending, success, or failed) before taking action prevents this costly mistake. If a transaction is stuck as pending due to a low gas price, the correct approach is to send a replacement transaction with the same nonce but a higher gas price, which Etherscan’s documentation explains in detail.
Finally, some users believe that Etherscan requires an account to function. The core features, including all transaction lookups, address searches, contract verification checks, gas tracking, and token holder analysis, work without any account. Creating a free account adds convenience features like address watchlists, private name tags, transaction notes, and API key generation, but the fundamental read-only explorer functionality is available to anyone with a web browser.
What this article does not cover
This article does not cover how to check Ethereum transactions step-by-step with screenshots, as interfaces change frequently. It does not cover alternative explorers such as Blockscout, which is open source, or Dune Analytics, which specializes in custom SQL queries against blockchain data. It does not cover the technical details of how Etherscan’s indexing infrastructure is architected.
Practical checks before trusting an Etherscan page
Confirm you are on the real site. Etherscan’s domain is etherscan.io. Phishing clones exist at similar-looking domains. Bookmark the real URL and use the bookmark, not search engine results, to navigate there.
Check the contract verification badge. A green checkmark means the source code has been uploaded and matches the on-chain bytecode. No checkmark means the contract is unverified and the code cannot be inspected.
Review token approvals regularly. The Token Approvals page lists every smart contract with permission to spend tokens from your wallet. Revoke approvals for contracts you no longer use.
Cross-reference gas estimates. The gas tracker shows real-time prices, but confirm against your wallet’s estimate before submitting. Gas conditions can change between loading the page and signing the transaction.
Use labels and tags. Etherscan labels known addresses (exchanges, bridges, scam addresses). If an address you are about to interact with carries a warning label, stop and investigate before proceeding.
What is Etherscan?
Etherscan is a free blockchain explorer and analytics platform for the Ethereum network. It indexes every transaction, address, token transfer, and smart contract on Ethereum and presents the data through a searchable web interface.
Is Etherscan free to use?
Yes. All core features, including transaction lookups, address searches, gas tracking, and contract verification checks, are free. Creating an optional account unlocks additional features such as private name tags, API access, and wallet activity alerts.
Can Etherscan access or move my funds?
No. Etherscan is a read-only tool that displays publicly available blockchain data. It cannot initiate transactions, access private keys, or move funds. Any site claiming to be Etherscan that asks for your seed phrase or private key is a phishing scam.
What is a transaction hash on Etherscan?
A transaction hash is a unique 66-character identifier (starting with 0x) assigned to every Ethereum transaction. Pasting it into the Etherscan search bar displays the full details of that transaction, including status, sender, recipient, value, and gas cost.
What does the gas tracker on Etherscan show?
The gas tracker displays real-time Ethereum gas prices in three tiers (low, average, high) along with estimated confirmation times and dollar costs for common operations such as ETH transfers, token swaps, and NFT mints.
What does it mean when a contract is verified on Etherscan?
A verified contract has had its source code uploaded to Etherscan and confirmed to match the compiled bytecode deployed on-chain. This allows anyone to read the contract’s logic, check its functions, and assess whether it behaves as the project claims.
Does Etherscan work for blockchains other than Ethereum?
Etherscan’s parent company, Blockscan, operates explorers for more than 30 blockchains including BNB Chain (BscScan), Polygon (PolygonScan), Arbitrum (Arbiscan), and Solana (Solscan). Each explorer follows the same interface design as the original Etherscan.
How do I check token approvals on Etherscan?
Navigate to the Token Approvals page (accessible from the More menu or by searching your address and clicking the token approvals link). The page lists every smart contract with permission to spend tokens from your wallet. You can revoke unnecessary approvals directly from this page by connecting your wallet.
Disclaimer: This article is for informational purposes only and does not constitute financial, investment, or security advice. Always conduct your own research before interacting with smart contracts or blockchain applications. Published August 24, 2026.


A public key is the cryptographic counterpart to a private key. Together they let you prove ownership of cryptocurrency without revealing the secret that controls it.
Summary
- A public key is a large number derived mathematically from a private key using elliptic curve multiplication, a one-way function that is fast to compute forward but practically impossible to reverse.
- Bitcoin and Ethereum both use the secp256k1 elliptic curve, which produces 256-bit private keys and 512-bit uncompressed public keys (or 257-bit compressed public keys).
- A wallet address is not the same as a public key; the address is a shorter, hashed version of the public key designed to be easier to share and more resistant to certain theoretical attacks.
- The private key signs transactions, the public key verifies those signatures, and the address receives funds. Losing the private key means permanent loss of access; sharing the public key or address carries no risk to fund security.
- The July 2026 Coldcard firmware vulnerability, which exposed weak private key generation affecting $116 million in bitcoin, underscores why proper key generation and storage remain the most critical aspects of self-custody.
Public key cryptography is the foundation of every cryptocurrency transaction, yet most users never interact with their public key directly. They see wallet addresses, scan QR codes, and confirm transfers without understanding the mathematical layer that makes trustless ownership possible.
That layer matters because understanding it changes how you think about security. A public key is not a password. It is not a secret. It is a number that you can share with anyone, and from which no one can derive the private key that controls your funds. That asymmetry, easy to go one way but impossible to go back, is what allows strangers on the internet to send each other money without trusting a bank, a government, or each other.
How key pairs work
Every cryptocurrency wallet is built on a key pair: one private key and one public key. The private key is a randomly generated number, typically 256 bits long, which means it is one of roughly 10 to the power of 77 possible values. For context, the estimated number of atoms in the observable universe is around 10 to the power of 80. The keyspace is large enough that guessing a specific private key by brute force is not a practical concern with current or foreseeable technology.
The public key is derived from the private key through elliptic curve multiplication. Bitcoin and Ethereum both use a specific curve called secp256k1. The private key is multiplied by a fixed point on this curve called the generator point, and the result is another point on the curve. That result is the public key.
The critical property is that this multiplication is a one-way function. Given a private key, computing the public key takes a fraction of a second. Given only the public key, computing the private key requires solving the elliptic curve discrete logarithm problem, which has no known efficient solution. This asymmetry is the entire basis of cryptocurrency security.
Public key versus wallet address
A common misconception is that a wallet address and a public key are the same thing. They are not. The address is derived from the public key through one or more rounds of hashing, a process that shortens the output and adds an extra layer of security.
In Bitcoin, the process works as follows. The 512-bit uncompressed public key (or 257-bit compressed public key) is run through SHA-256, then through RIPEMD-160, producing a 160-bit hash. A version byte is prepended, a checksum is appended, and the result is encoded in Base58Check format. The final output is the familiar Bitcoin address starting with 1, 3, or bc1.
In Ethereum, the process is simpler. The 512-bit public key is run through Keccak-256 (a variant of SHA-3), and the last 20 bytes (160 bits) of the hash become the address. A “0x” prefix and an optional EIP-55 checksum are added to produce the familiar Ethereum address.
The reason for hashing the public key into an address is partly practical (shorter strings are easier to share) and partly defensive. If quantum computers ever become capable of breaking elliptic curve cryptography, they would need the public key, not the address, to derive the private key. Addresses that have never been used to send a transaction have never had their public key exposed on-chain, adding a theoretical layer of quantum resistance.
How digital signatures prove ownership
When you send cryptocurrency, you are not moving coins from one location to another. You are creating a message that says “I authorize the transfer of X amount from my address to this recipient” and signing that message with your private key. The signature proves that the person who created the message controls the private key associated with the sending address, without revealing the private key itself.
The verification process uses the public key. Anyone running a node on the network can take the transaction message, the digital signature, and the sender’s public key, and run a mathematical verification that confirms the signature was produced by the corresponding private key. If the verification passes, the transaction is valid. If it fails, the transaction is rejected.
This is why losing a private key is catastrophic. No private key means no ability to produce valid signatures, which means no ability to authorize transactions from that address. The funds remain on the blockchain, visible to everyone, but permanently inaccessible. There is no “forgot password” recovery mechanism because there is no central authority that holds a backup.
The key generation chain
In modern wallets, individual private keys are not generated independently. Instead, a single master seed produces all keys in the wallet through a deterministic process defined by BIP-32 (hierarchical deterministic wallets) and BIP-39 (mnemonic seed phrases).
The process begins with entropy, a source of randomness. The wallet software or hardware device generates a random number, typically 128 or 256 bits. This entropy is encoded as a mnemonic phrase of 12 or 24 words drawn from a standardized list of 2,048 words. The mnemonic phrase, combined with an optional passphrase, is run through a key derivation function (PBKDF2) to produce a 512-bit master seed.
From the master seed, a hierarchical tree of key pairs is derived. Each branch of the tree can generate billions of unique private keys and their corresponding public keys and addresses. This is why a single seed phrase can recover an entire wallet with all its addresses: the seed deterministically regenerates every key pair in the hierarchy.
The security implication is that the seed phrase is the root of all keys. Anyone who obtains the seed phrase can regenerate every private key, every public key, and every address the wallet has ever used or will ever use. Protecting the seed phrase is equivalent to protecting every key pair in the wallet simultaneously.
Compressed versus uncompressed public keys
Early Bitcoin software used uncompressed public keys, which include both the x and y coordinates of the point on the elliptic curve. An uncompressed public key is 65 bytes: a 1-byte prefix (0x04) followed by 32 bytes for the x coordinate and 32 bytes for the y coordinate.
Because the elliptic curve equation means that for any given x coordinate there are only two possible y values (one even, one odd), it is sufficient to store just the x coordinate and a single bit indicating whether y is even or odd. This produces a compressed public key of 33 bytes: a 1-byte prefix (0x02 for even y, 0x03 for odd y) followed by 32 bytes for the x coordinate.
Compressed keys save space in transactions, which reduces fees. Since 2012, most Bitcoin software defaults to compressed public keys. Ethereum uses uncompressed public keys internally but strips the prefix byte in address derivation, using only the 64-byte x and y values.
The distinction matters for compatibility. A compressed and uncompressed public key derived from the same private key produce different addresses in Bitcoin. Importing a private key into a wallet that uses a different compression format than the original wallet will generate a different address, which can cause confusion if funds were sent to the other format’s address.
Real world key security failures
The theory behind public key cryptography is sound, but implementation failures have caused significant losses.
In July 2026, researchers discovered that the Coldcard hardware wallet had been generating weak private keys for five years. A build flag in the firmware told the device to skip its dedicated hardware randomness chip, resulting in predictable entropy. An attacker reverse-engineered the weakness and began draining wallets on July 30, emptying approximately $116 million in bitcoin before the vulnerability was publicly disclosed.
The lesson is that the security of a key pair depends entirely on the quality of the randomness used to generate the private key. A theoretically unbreakable 256-bit key is worthless if the random number generator is flawed, biased, or predictable. This is why reputable hardware wallets use dedicated true random number generators and allow users to add their own entropy (such as dice rolls) as an additional safeguard.
Other historical incidents include the 2013 Android SecureRandom vulnerability, which caused multiple Bitcoin wallets to generate duplicate random numbers, allowing attackers to compute private keys from transaction signatures. The Profanity vanity address generator was exploited in September 2022 when researchers discovered that its key generation used a 32-bit seed, reducing the effective keyspace from 2 to the power of 256 down to 2 to the power of 32, roughly 4 billion possibilities that could be brute-forced in minutes.
Public keys and smart contracts
On smart contract platforms like Ethereum, public key cryptography serves a dual purpose. It secures externally owned accounts (EOAs), the standard user wallets controlled by private keys, and it authenticates messages signed by those accounts when they interact with smart contracts.
When a user calls a function on a smart contract, the transaction includes the digital signature produced by the user’s private key. The Ethereum Virtual Machine verifies this signature against the sender’s public key before executing the function. This is how a smart contract knows that the person calling “transfer 100 USDC to address X” is actually the owner of the tokens being transferred.
Smart contract wallets (account abstraction wallets introduced by ERC-4337) can modify this model. Instead of relying solely on a single private key, a smart contract wallet can require multiple signatures, biometric authentication, social recovery, or spending limits enforced by code. The public key remains part of the system, but the rules governing what constitutes a valid authorization become programmable.
Custodial versus self-custodial key management
On a centralized exchange, the exchange holds the private keys and users access their funds through traditional authentication (username, password, two-factor codes). The user never sees a public key or private key. The exchange signs transactions on the user’s behalf.
In self-custody, the user holds the private key (or the seed phrase that generates it) and is solely responsible for its security. The public key and address are derived locally, and no third party has access to the signing capability.
The tradeoff is clear. Custodial solutions are convenient but introduce counterparty risk: if the exchange is hacked, insolvent, or freezes withdrawals, the user’s funds are at risk. Self-custody eliminates counterparty risk but introduces operational risk: if the user loses the seed phrase, misstores it, or falls victim to phishing, the funds are gone permanently.
Multisignature setups split the difference by distributing key management across multiple parties or devices. A 2-of-3 multisig requires any two of three private keys to sign a transaction, so losing one key does not result in permanent loss and compromising one key does not give an attacker control.
What this article does not cover
This article does not cover post-quantum cryptography schemes such as lattice-based signatures, which are being researched as replacements for elliptic curve cryptography in the event that large-scale quantum computers become viable. It does not cover the mathematics of elliptic curves beyond the conceptual level. It does not cover specific wallet setup guides, as those vary by product and change frequently.
Practical checks for protecting your keys
Never share your private key or seed phrase. No legitimate service, support agent, or airdrop will ever ask for them. Any request for these credentials is a scam without exception.
Verify address format before sending. Clipboard malware can replace a copied address with an attacker’s address. Always visually confirm the first and last several characters of an address after pasting it.
Use hardware wallets for significant holdings. Hardware wallets generate and store private keys on a dedicated chip that never exposes them to the internet-connected device. Research the manufacturer’s track record with entropy generation before purchasing.
Add your own entropy when possible. Some hardware wallets allow users to supplement the device’s random number generator with manually entered randomness such as coin flips or dice rolls. This mitigates the risk of a flawed hardware random number generator.
Keep seed phrase backups in multiple secure locations. A single copy stored in one location is vulnerable to fire, flood, or theft. Metal seed phrase backups resist environmental damage better than paper.
What is a public key in cryptocurrency?
A public key is a large number derived from a private key using elliptic curve multiplication. It serves as the cryptographic identity that verifies transaction signatures without revealing the private key. Anyone can see a public key, and sharing it does not compromise fund security.
Is a public key the same as a wallet address?
No. A wallet address is derived from the public key through one or more rounds of cryptographic hashing. The address is shorter and easier to share. In Bitcoin, the same private key can produce different addresses depending on whether compressed or uncompressed public keys are used.
Can someone steal my crypto if they know my public key?
No. The public key is designed to be shared. Deriving the private key from the public key requires solving the elliptic curve discrete logarithm problem, which has no known efficient solution with current computing technology.
What happens if I lose my private key?
The funds associated with that key become permanently inaccessible. There is no recovery mechanism because cryptocurrency networks have no central authority that stores backups. This is why seed phrase backups are critical for self-custody wallets.
What is the difference between a public key and a private key?
The private key is a randomly generated secret number used to sign transactions. The public key is derived from the private key and is used to verify signatures. The private key must remain secret; the public key can be shared freely.
How does a seed phrase relate to public and private keys?
A seed phrase (12 or 24 words) encodes the master entropy from which all private keys in a wallet are deterministically derived. Each private key produces a corresponding public key and address. Protecting the seed phrase protects every key pair the wallet will ever generate.
What elliptic curve do Bitcoin and Ethereum use?
Both Bitcoin and Ethereum use the secp256k1 elliptic curve. It produces 256-bit private keys and 512-bit uncompressed public keys (or 257-bit compressed public keys). The curve was chosen for its efficiency and well-understood security properties.
Could quantum computers break public key cryptography?
Theoretically, a sufficiently powerful quantum computer running Shor’s algorithm could derive a private key from a public key. However, no such quantum computer exists as of 2026. Addresses that have never been used to send transactions have not exposed their public key on-chain, adding a layer of protection. Post-quantum signature schemes are being researched as future replacements.
Disclaimer: This article is for informational purposes only and does not constitute financial, investment, or security advice. Cryptocurrency self-custody carries inherent risks. Always conduct your own research and follow current security best practices. Published August 24, 2026.

Crypto policy and payments developments across Asia are moving in multiple directions at once: some regulators are tightening rules for digital asset firms, while banks and institutions pursue faster rails for cross-border settlement. Meanwhile, exchange licensing and tokenized finance continue to expand in jurisdictions that are still calibrating how to oversee crypto.
Below is a consolidated look at the week’s key developments—from South Korea and Japan to Pakistan, the UAE, and beyond—focusing on what changed, why it matters, and what to watch next.
Key takeaways
- South Korea’s Jeonbuk Bank partnered with Ripple to use a blockchain-based cross-border payments system for business customers.
- South Korean lawmakers proposed expanding FIU powers so the Financial Intelligence Unit can investigate suspected violations by unregistered crypto firms.
- Japan granted Laser Digital authorization as a crypto asset exchange service provider under the Payment Services Act, marking the first such approval in four years.
- Pakistan opened its crypto licensing portal for exchanges and other VASPs, with an NOC submission deadline tied to continued operations.
- Singapore and Hong Kong are competing via tax policy changes aimed at attracting fund managers and related investment professionals.
South Korea: payments partnerships and a push to expand FIU oversight
In payments, South Korea’s Jeonbuk Bank said it has partnered with blockchain payments company Ripple to deploy its cross-border payment system for business customers. The service is intended for companies such as import-export firms, technology startups, and online content creators.
Ripple framed the change around remittance speed and cost, arguing that conventional transfers—often routed through intermediary banks using SWIFT messaging—can take several days. By contrast, Ripple said its system would enable faster and less expensive cross-border capabilities for the bank’s commercial clients, positioning blockchain settlement as an operational upgrade rather than a consumer-facing novelty.
Regulatory momentum is also building in South Korea, but in a more enforcement-oriented direction. A group of lawmakers introduced a bill aimed at amending the Act on Reporting and Using Specified Financial Transaction Information to expand the Financial Intelligence Unit’s (FIU) authority over unregistered crypto businesses.
According to the filing reported by Cointelegraph, People Power Party lawmaker Eom Tae-young and nine other lawmakers submitted the proposal. Under the bill, anyone could report suspected violations to the FIU, and the FIU would be able to investigate and analyze alleged breaches, file complaints with relevant authorities, request criminal investigations, or provide information to investigators.
For market participants, the practical takeaway is that oversight capacity could broaden beyond traditional reporting frameworks. If passed, the FIU’s role in gathering and escalating cases involving unregistered entities may increase compliance pressure across the domestic crypto ecosystem—especially for smaller businesses operating without formal registration.
South Korea also moves on market conduct, custody licensing, and virtual asset crime
Separately, South Korean regulators were reported to be scrutinizing Polymarket. The Korea Media and Communications Commission stated Polymarket’s structure and operations amount to illegal gambling, even though it is designed as noncustodial and uses smart contracts.
On the custody side, BitGo Korea reportedly secured VASP registration for institutional crypto custody. The registration was accepted on Tuesday, two days before stricter VASP entry requirements took effect—an important sequencing detail that could affect other firms assessing their compliance timelines.
South Korea also planned new investigative capacity. The Serious Crimes Investigation Agency is set to be formally established in October and will include 2,567 investigators across seven categories, with a dedicated unit aimed at combating phishing and virtual asset crimes. For businesses and users, a targeted unit indicates regulators may treat digital-asset-related fraud and impersonation as a specialized enforcement priority rather than a general cybercrime category.
Finally, the Korea Exchange is expected to open a new fractional investment market—Novel Securities Market—in November. Cointelegraph reported that it will support fractional investments and non-traditional securities such as artworks, real estate, and music copyright, expanding the range of asset types accessible through the exchange infrastructure.
Japan: fresh exchange authorization and more institutional token adoption
Japan remains one of the clearest examples in Asia of how regulated crypto can develop through licensing under the Payment Services Act (PSA). Nomura Group’s digital asset subsidiary Laser Digital received authorization to operate as a crypto asset exchange service provider under the PSA, which Cointelegraph described as the country’s first crypto exchange approval in four years.
According to the Financial Services Agency (FSA) list published on Friday, Laser Digital received the authorization as reported by Cointelegraph. The article noted the last platform to receive FSA authorization was Binance Japan in October 2022, underscoring the long gap between approvals.
For investors and traders, the significance is less about headlines and more about access and compliance: each newly authorized venue can increase choice for Japan-based market participants that prefer regulated counterparties. It also signals that, even after a period of slower licensing, Japan’s framework can still produce new approvals for qualified operators.
Beyond exchange licensing, the Japan coverage also highlighted broader treasury and retail-access experiments. Metaplanet reportedly expanded its Bitcoin treasury strategy to the US through a proposed arrangement with Nasdaq-listed Super League Enterprise, using existing Bitcoin rather than additional purchases. Separately, Cointelegraph reported that Toyota Finance opened tokenized bonds to retail investors via a mobile payment app, allowing applications for a 1 billion yen bond without a securities account and with perks delivered through Toyota’s app. While these are not identical to exchange approvals, they reflect continued movement toward regulated digital finance products and distribution channels.
Pakistan and the UAE: regulated market access expands while token distribution grows
Pakistan’s Virtual Assets Regulatory Authority (PVARA) opened its crypto licensing portal for crypto exchanges and other virtual asset service providers (VASPs) operating in the country. Cointelegraph reported that companies providing virtual asset services on or before March 5 must submit an application for a no-objection certificate (NOC) by Sept. 5 or cease operations.
On its licensing site, PVARA frames the portal as a pathway into a regulated market with standards covering consumer protection, governance, compliance, and market integrity—an approach that aims to make compliance expectations concrete rather than abstract.
In the UAE, Capital.com reportedly plans to offer spot crypto services after its affiliate, Capital Vault, secured a virtual-asset license from the country’s Capital Market Authority (CMA). Cointelegraph reported that once live, UAE clients would be able to buy and hold actual crypto through the Capital.com app, with Capital Vault responsible for execution, custody, and settlement.
In parallel, Bitcoin.com integrated the UAE-registered US dollar stablecoin USDU into a self-custodial wallet. Cointelegraph said the integration expands access to USDU beyond institutional distribution channels, suggesting more routing options for stablecoin users who want direct wallet-based custody rather than relying solely on exchange accounts.
Singapore vs Hong Kong: tax policy as a competition lever for fund managers
Singapore’s Monetary Authority unveiled tax exemptions for fund managers and family offices and expanded a scheme aimed at attracting investment professionals. The government also plans to launch a co-investment scheme for funds that base operations in Singapore, Cointelegraph reported.
The announcement comes as Hong Kong cuts its own taxes for fund managers, reinforcing a regional pattern: crypto-related finance and traditional asset management are now competing through fiscal policy as well as regulatory posture. For industry participants, these changes can affect where teams locate and where investment entities choose to incorporate or operate.
While these measures are not exclusively tied to crypto, they matter because many digital asset strategies sit within broader investment platforms—meaning tax advantages can influence staffing, fund structure decisions, and where compliance infrastructure is built.
With more licensing portals, more targeted FIU authority, and fresh exchange authorizations in play, the next questions are straightforward: which proposed South Korean rules make it through the legislative process, how quickly Japan’s newly authorized operator pipeline expands, and whether Pakistan’s licensing window results in continued market consolidation or a shift toward regulated-only services.


While stablecoin adoption has increased significantly in 2026, real payments still represent only a fraction of the trillions moving on-chain. In 2025, around 3.6% of adjusted stablecoin volume came from actual payments. Much of it has to do with something called the checkout problem.
Paying with a stablecoin can still mean a second screen, another identity check and a checkout run by a company the user did not choose. These extra steps are easy to overlook in transaction charts, but they are often where adoption stalls.
Some products are trying to address this gap with newer innovations. For instance, payments company Banxa launched Native on August 20. It gives wallets, exchanges and fintech apps a way to place fiat-to-crypto and crypto-to-fiat transactions inside their own interfaces.
Banxa handles the regulated rails underneath, including price quotes, compliance validation and settlement.
A Checkout That Stays Put
Imagine buying $200 of USDC inside a wallet. The app requests a live price, checks whether the user and payment method are eligible, and then opens an Apple Pay sheet without sending the customer to a Banxa webpage.
The same flow works with cards and Google Pay. Bank transfers can run through the API.
Platforms that already verify customers can also pass the identity data to Banxa. A returning user may move directly to payment rather than complete KYC again.
So, the platform keeps its branding and customer relationship, and Banxa remains in the plumbing.
“The user experience across crypto remains fragmented and unnecessarily complex. Our goal is to simplify this and having Banxa onboard means users receive a seamless experience by embedding compliant fiat crypto access directly into the user journey,” Felix Fan, CEO at Trust Wallet, said.
Invisible Has a Boundary
Banxa’s Native does not make every payment method disappear into the app. Its documentation says PayPal, iDEAL, Klarna, PIX, and several other local options still move the customer into its hosted checkout for the payment step.
Partners also need user accounts, a backend, and their own KYC process. This is infrastructure for established platforms, rather than a plug-in for any app.
The regulatory layer matters as much as the interface. OSL completed its acquisition of Banxa in January, folding the company into a wider stablecoin payments push.
Banxa says it has more than 400 platform integrations, has served over 10 million users and has processed more than $10 billion in cumulative volume. Its Dutch entity also holds a MiCA licence covering 30 EEA countries.
But Native now faces a practical test. Do fewer users abandon a purchase when the crypto checkout stops looking like a detour?
The launch offers a credible technical answer to an old user-experience problem. Proof will come from how people behave at checkout.
The post Banxa Wants to Make Stablecoin Payments Invisible appeared first on BeInCrypto.
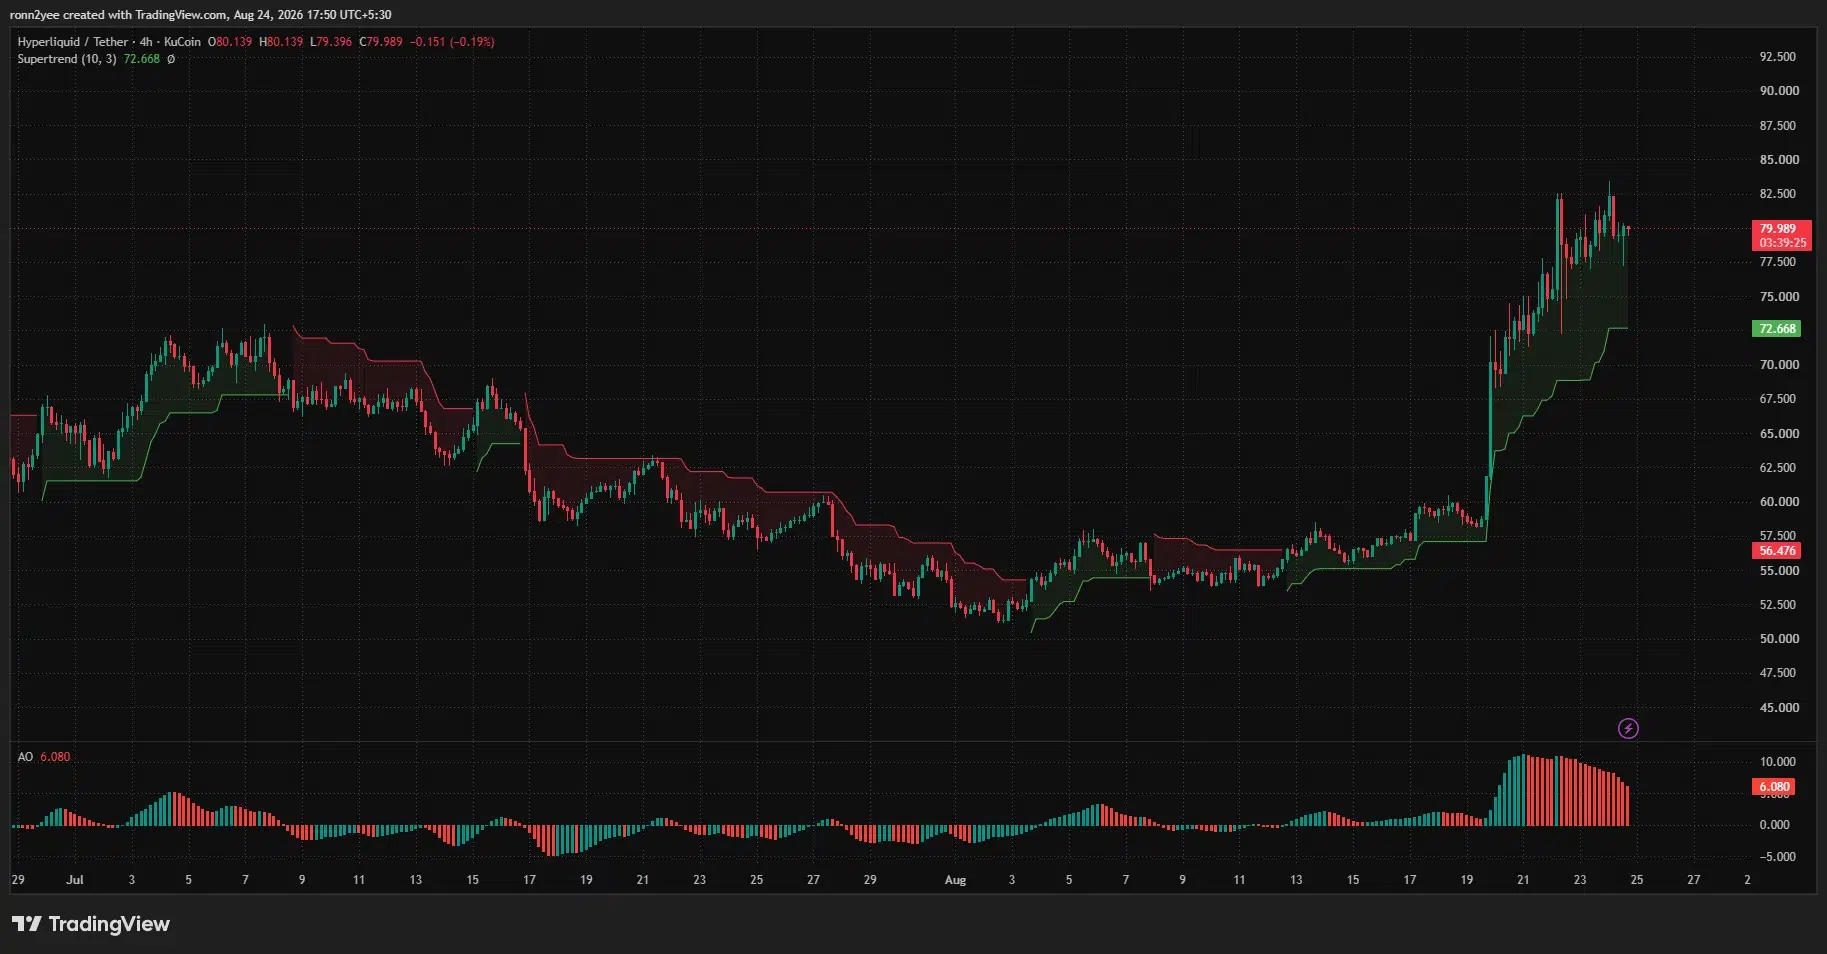
Hyperliquid price traded near $80 on Aug. 24 after reaching a record $83.27, as rising platform fees and a 32% weekly gain kept HYPE in price discovery.
Summary
- HYPE reached an all-time high of $83.27 before retreating toward $80.
- Hyperliquid generated $6.5 million in fees during a recent 24-hour period.
- Daily RSI reached 75.91, leaving the token overbought after its rapid advance.
- Liquidation data places the largest nearby liquidity cluster around $84.
Hyperliquid price consolidates below its record high
Hyperliquid (HYPE) price was trading at approximately $79.83 at the time of writing, down 1.15% over the previous 24 hours but up 32.3% over seven days. The token has also gained 35.8% over the past month.
HYPE reached an all-time high of $83.27 on Aug. 23, according to CoinGecko, before buyers encountered resistance between $82 and $84. Its market capitalization stood near $17.8 billion, placing it among the ten largest cryptocurrencies.
The 4-hour chart shows that the rally accelerated on Aug. 19, when HYPE climbed from below $60 to nearly $70 in a single session. Buyers then pushed the token through $75 and above $80 over the following four days.
Price remained close to $80 on Aug. 24 despite several attempts to take profits. The tight consolidation below the record high suggests buyers have not yet surrendered control, although the slowing momentum increases the risk of a short-term pullback.
HYPE also remained above the 4-hour Supertrend level at $72.67. A decisive fall below that line would weaken the current bullish structure and place the previous breakout area around $68 to $70 back in focus.
The Awesome Oscillator remained positive at 6.08, but its histogram declined after reaching a local peak. The change shows that bullish momentum is still present but no longer accelerating at the rate seen during the initial breakout.
Hyperliquid fees add support to HYPE demand
The price advance coincided with a surge in activity on Hyperliquid’s derivatives platform. Data cited by Token Terminal showed the protocol generated $6.5 million in fees over a recent 24-hour period, compared with $1.5 million for Pump.fun.
Hyperliquid also recorded about $5.6 million in revenue and 102,800 daily active users during the period. Increased leveraged trading during the broader crypto market rally contributed to the rise in fees.
The revenue matters for HYPE because the protocol directs most trading fees to its Assistance Fund. DefiLlama states that 99% of perpetual and spot trading fees, excluding certain builder fees, go to the fund for open-market HYPE purchases.
Hyperliquid generated $55.64 million in fees over the past 30 days, including $40.94 million in protocol revenue, according to DefiLlama. Sustained trading activity can therefore create recurring demand for HYPE, although lower volume would reduce the size of future purchases.
HIP-3 provides another source of demand by allowing builders to deploy their own perpetual futures markets. Under the official Hyperliquid documentation, a deployer must stake 500,000 HYPE and operate markets with independent order books, margin rules, and settings.
The framework has expanded the platform beyond crypto markets by supporting derivatives linked to commodities, equities, and foreign exchange. However, activity remains concentrated among a limited number of major deployers, making continued growth an important condition for the bullish fundamental case.
HYPE faces resistance at the $84 liquidity cluster
The daily chart shows HYPE trading above the upper Bollinger Band at $81.91 before pulling back. The middle band, represented by the 20-day simple moving average, stood at $62.43, showing how far price has moved above its short-term mean.
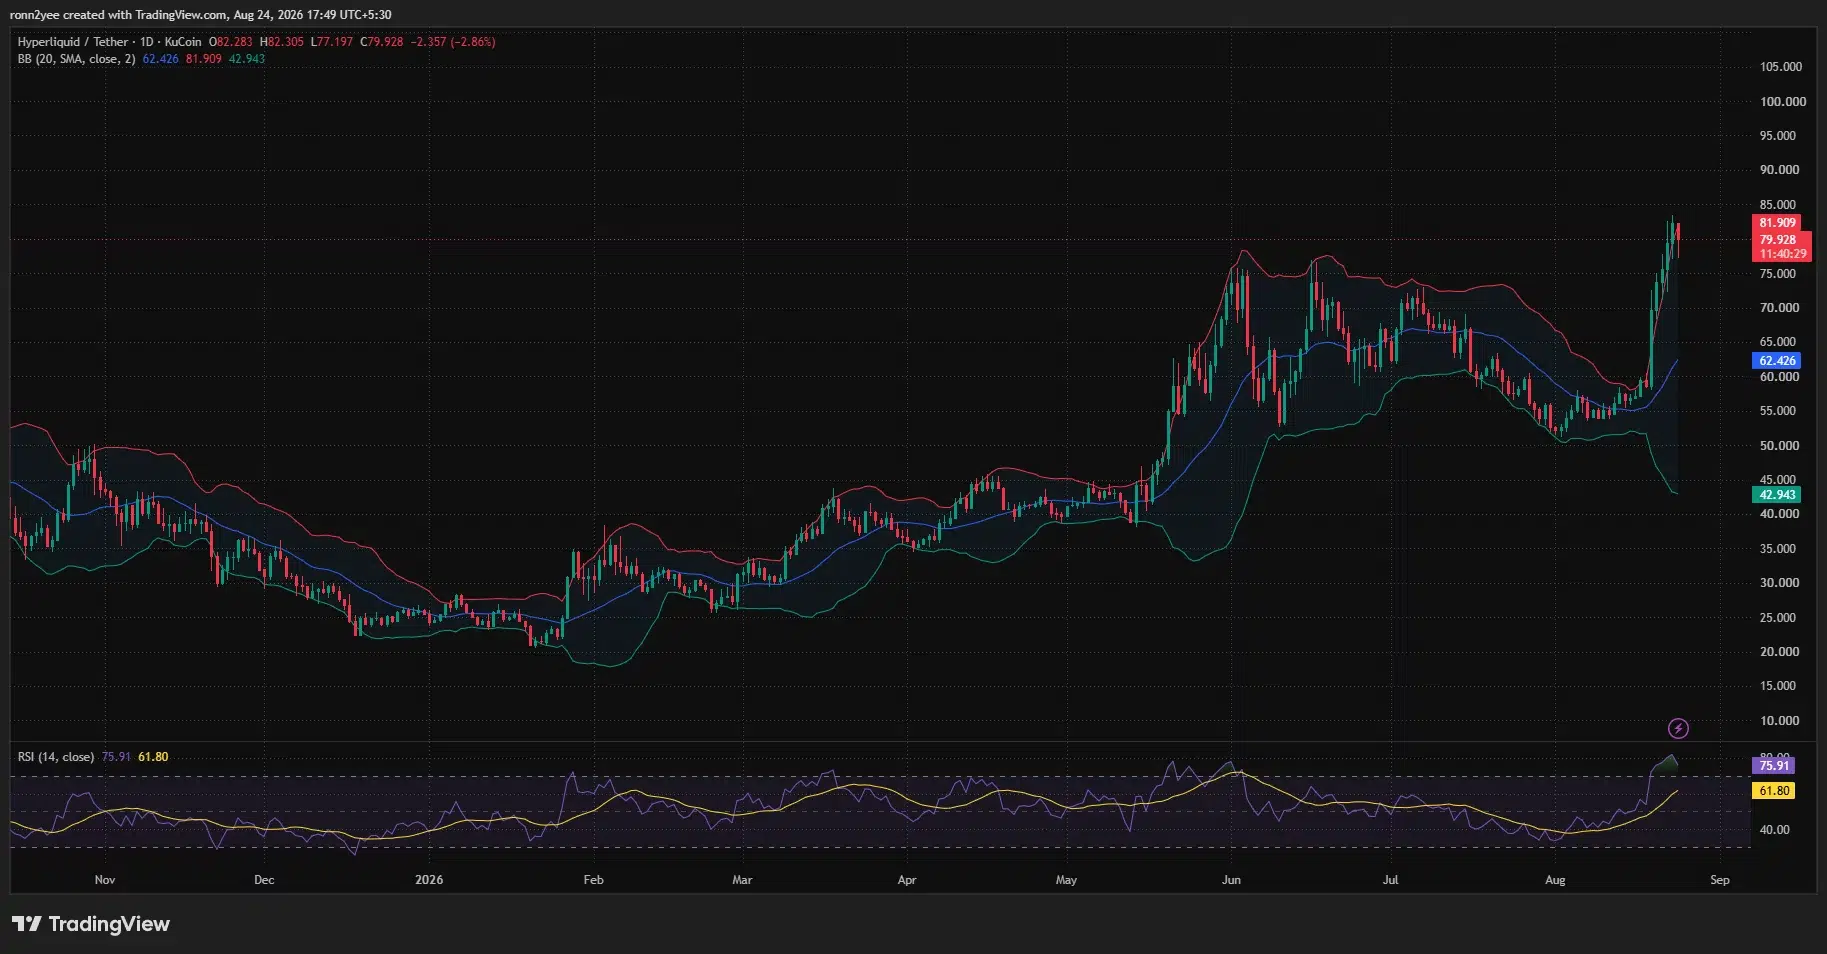
Daily RSI reached 75.91, well above the usual overbought threshold of 70. Its moving average was lower at 61.80. An overbought reading does not guarantee an immediate reversal, but it shows that the rally has become stretched and vulnerable to profit-taking.
The three-day CoinGlass liquidation heatmap identifies $84 as the strongest nearby concentration of leveraged positions. A clean break above that level could force additional short liquidations and reopen price discovery, with $86.30 forming the next visible upper boundary.
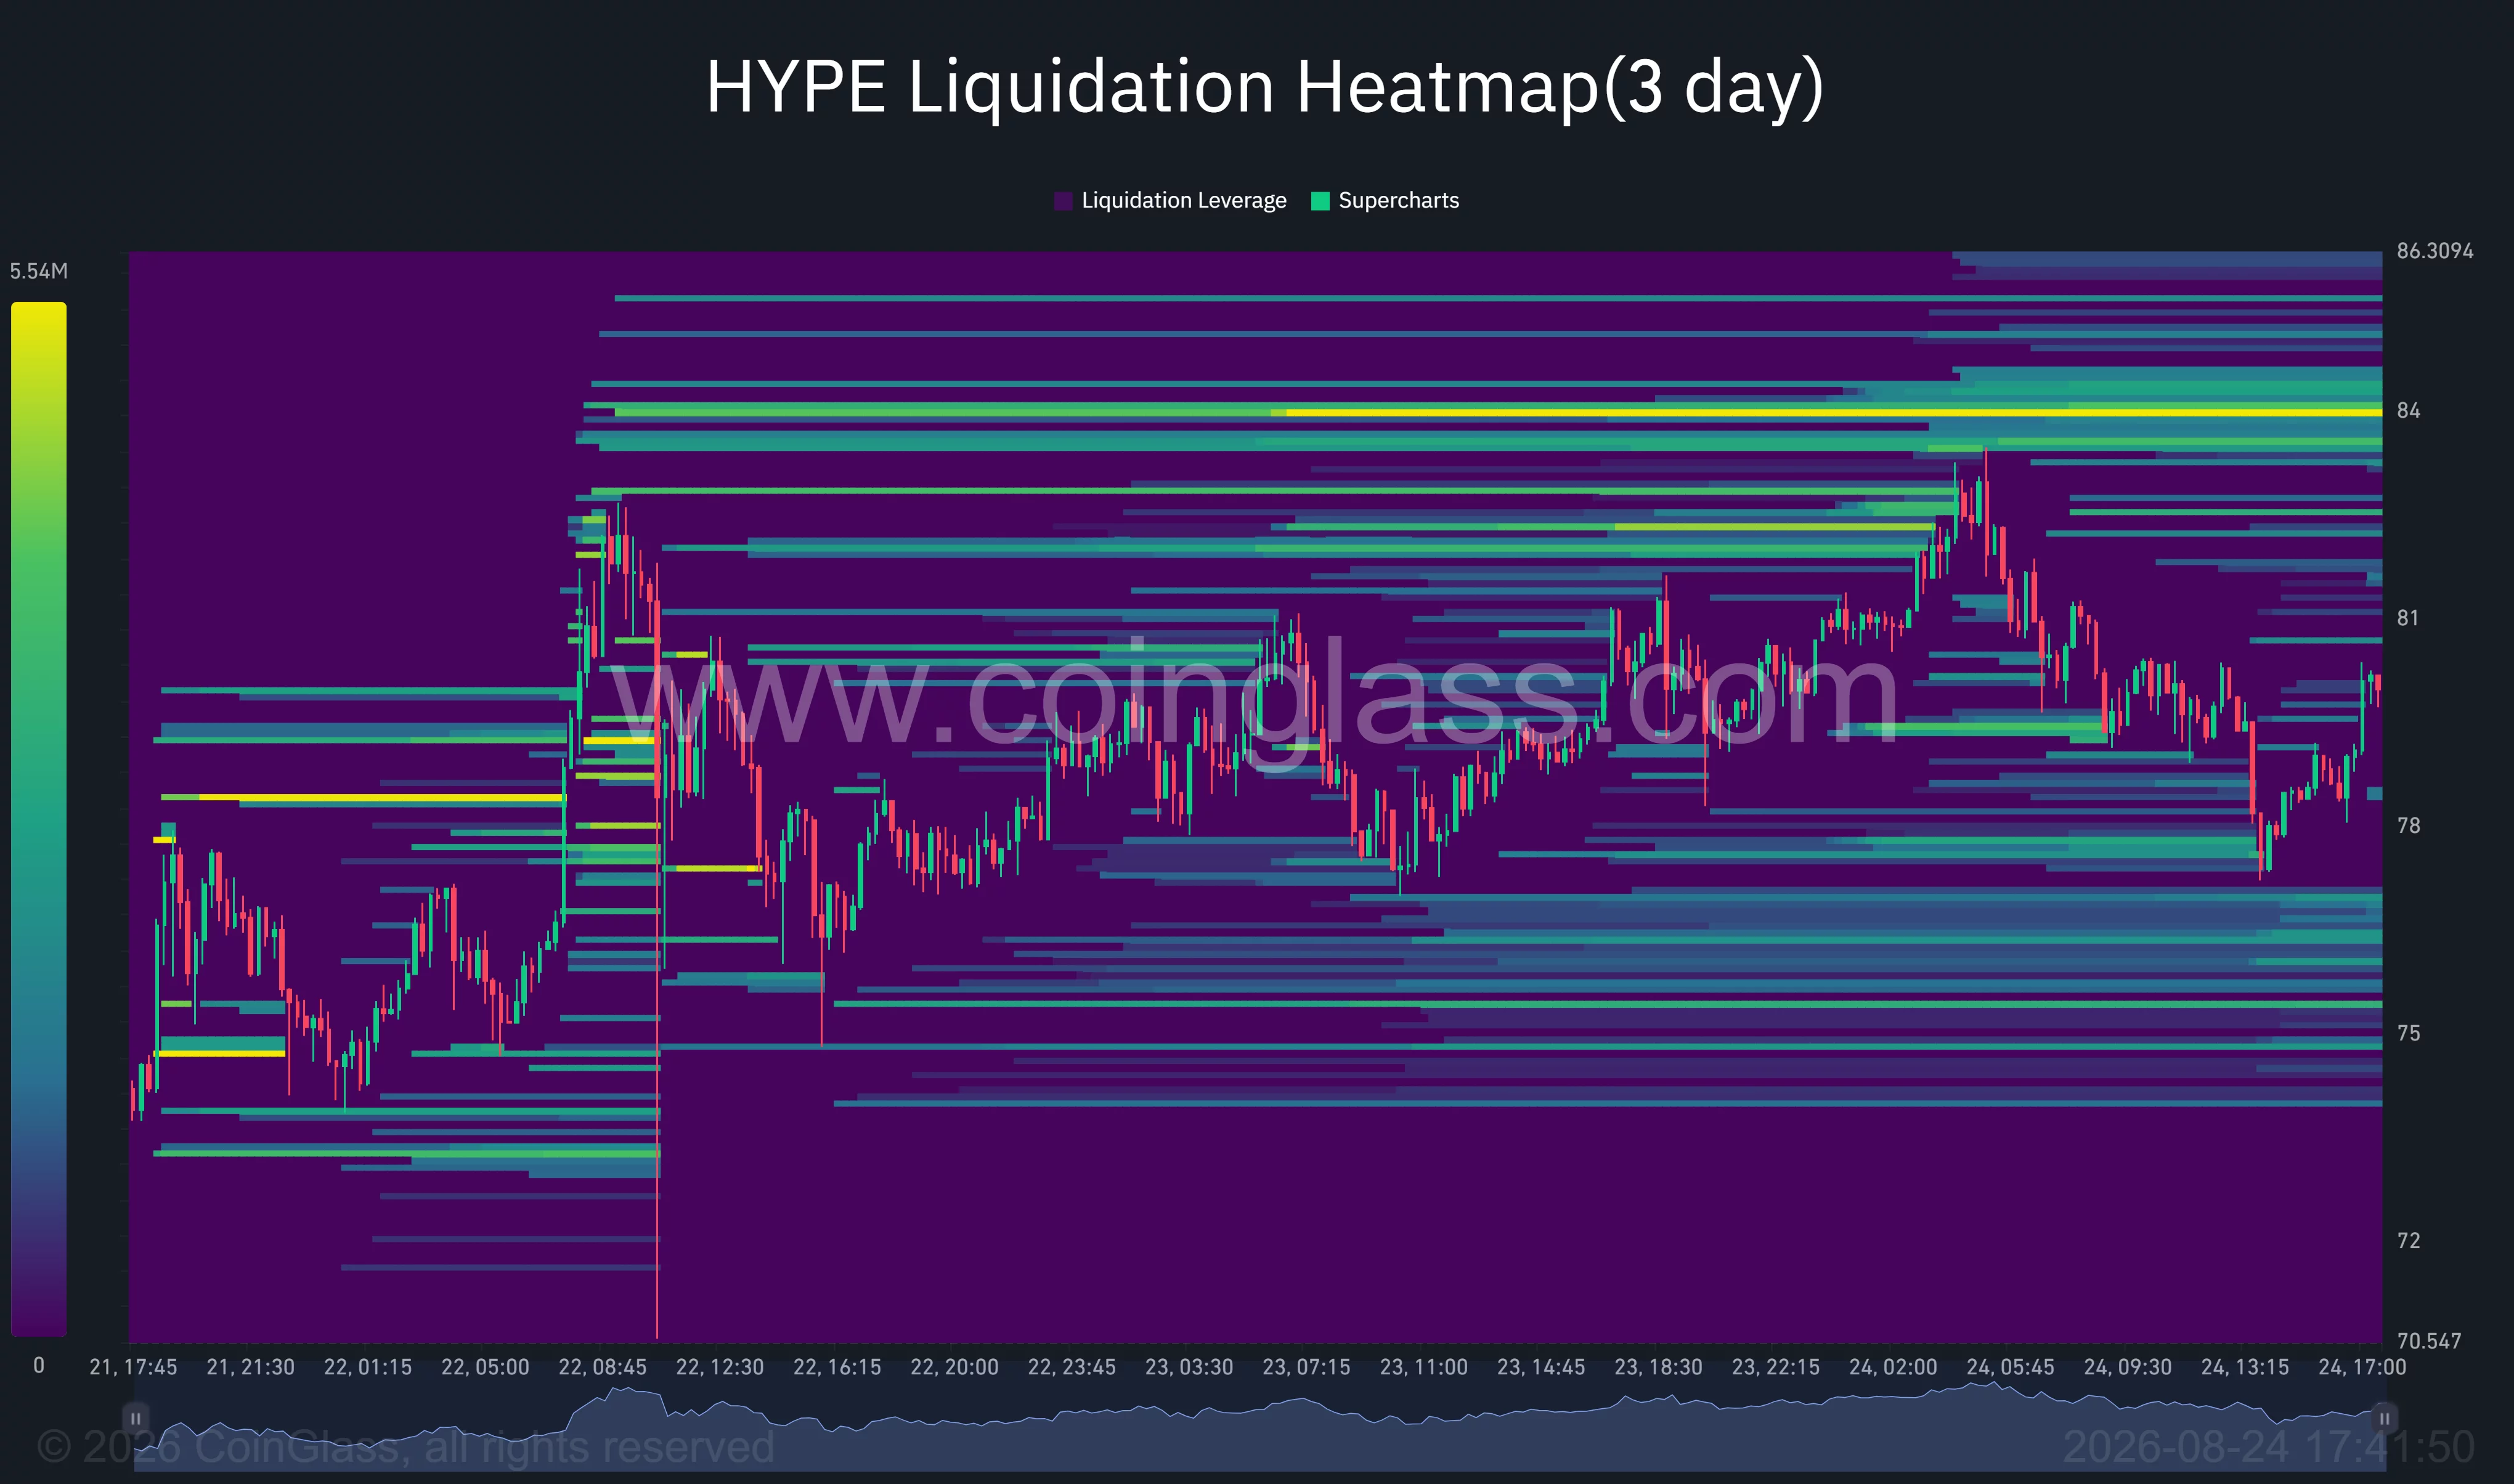
If HYPE fails to clear $84, the first support area sits between $78 and $79. The heatmap shows another concentration of positions near $77, while the broader chart places stronger support between $75 and $77.
A deeper correction could extend toward the 4-hour Supertrend at $72.67. Losing that level would raise the risk of a return to $68–$70, where the Aug. 19 breakout began.
Analysts watch for another expansion in volume
Pseudonymous trader Altcoin Sherpa said HYPE appeared to be approaching another breakout candle and suggested that a move toward $100 million in trading volume was becoming increasingly likely. The accompanying chart showed price holding near its highs while volume eased after the initial surge.
The bullish scenario requires HYPE to close above $84 with rising spot volume. Such a move would invalidate the immediate rejection and place $86.30, followed by the psychological $90 level, in focus.
The bearish scenario begins with a loss of $77. Falling below that level could trigger long liquidations and expose $75, followed by the Supertrend support near $72.67.
For U.S. investors, regulatory access remains an unresolved part of the outlook. Hyperliquid’s Policy Center says it is advocating for a legal route that would allow Americans to access decentralized markets, but no official White House or CFTC announcement was found confirming that the platform is being integrated into the U.S. market.
Disclosure: This article does not represent investment advice. The content and materials featured on this page are for educational purposes only.


Strategy has raised about $2 billion through common stock sales while leaving its Bitcoin holdings unchanged at 840,447 BTC and increasing its total cash position to $6.69 billion.
Summary
- Strategy raised about $2 billion by selling 18.26 million MSTR shares between Aug. 17 and Aug. 23.
- Total cash across its reserve and new cash account reached $6.69 billion.
- The company spent $136.4 million repurchasing about 1.43 million STRC preferred shares.
- Strategy made no Bitcoin purchases or sales, leaving its holdings unchanged at 840,447 BTC.
A Monday filing with the U.S. Securities and Exchange Commission showed the Bitcoin treasury company sold about 18.26 million MSTR shares between Aug. 17 and Aug. 23 through its at-the-market offering program.
Most of the proceeds were kept in cash after Strategy used $136.4 million to repurchase roughly 1.43 million shares of its STRC perpetual preferred stock. Another $300 million was transferred to the company’s existing U.S. dollar reserve, while about $1.59 billion went into a newly established U.S. dollar cash account.
The transactions left Strategy with $5.1 billion in its U.S. dollar reserve and $1.59 billion in the new cash pool as of Aug. 23, taking the combined balance across both accounts to $6.69 billion.
Strategy puts fresh MSTR proceeds into cash
Strategy said the new cash account gives management additional flexibility when deciding how to deploy capital under different market conditions.
Money held in the account can be used for Bitcoin purchases, preferred stock dividends, debt payments and repurchases of the company’s securities, according to the filing. The company did not commit the balance to any single purpose or provide a timetable for deploying it.
The latest increase extends a cash-building program that has accelerated since June. Crypto.news reported in July that Strategy had increased its dollar reserve to $3.75 billion by July 26 after adding $525 million during the week.
At the time, Strategy raised $544.5 million by selling about 5.43 million MSTR shares and used $25 million to repurchase STRC preferred stock. Its Bitcoin holdings remained unchanged during the period.
Another weekly filing covering Aug. 10 through Aug. 16 showed Strategy raising $333.7 million from roughly 3.46 million MSTR shares. Of those proceeds, $149.1 million was added to the dollar reserve, while $132.2 million funded STRC repurchases and $52.4 million went toward STRC dividends.
The dollar reserve stood at approximately $4.8 billion after those transactions, before the latest $300 million addition pushed it to $5.1 billion.
Strategy keeps its 840,447 Bitcoin unchanged
Despite raising about $2 billion last week, Strategy reported no Bitcoin purchases or sales between Aug. 17 and Aug. 23.
Its treasury therefore remains at 840,447 BTC, acquired for an aggregate $63.36 billion at an average price of $75,385 per Bitcoin, including fees and expenses.
Strategy arrived at its current Bitcoin balance after selling part of its holdings earlier this summer. The company held 847,363 BTC in late June before adopting a capital framework that gave management more options to use Bitcoin and cash for obligations linked to its securities.
Under that framework, the board authorized a BTC Monetization Program allowing up to $1.25 billion of Bitcoin sales to help fund the U.S. dollar reserve. The capital framework included separate $1 billion repurchase authorizations for common stock and preferred securities, alongside provisions covering dividend and interest payments.
Strategy then sold 3,588 BTC between June 29 and July 5 for about $216 million. The company said the proceeds were used for distributions on its Digital Credit securities and to replenish cash previously taken from its reserve.
The 3,588 BTC sale reduced Strategy’s holdings to 843,775 BTC and lifted its dollar reserve to $2.55 billion at the time.
Additional Bitcoin sales in August reduced the balance again. Between Aug. 3 and Aug. 9, Strategy sold 1,690 BTC for about $108.6 million and directed those proceeds toward repurchasing approximately 1.15 million STRC preferred shares.
Following that transaction, the company reported 840,447 BTC, the same balance it has maintained through the two subsequent weekly reporting periods.
STRC repurchases remain part of capital management
Preferred stock has become another major use of Strategy’s recently raised capital.
STRC, also known as Stretch, is a perpetual preferred security designed around a $100 reference value and a variable dividend rate. Strategy has used dividend adjustments, cash reserves and share repurchases as part of its efforts to manage the security.
During the week ended Aug. 23, the company spent another $136.4 million buying back approximately 1.43 million STRC shares.
The repurchase came after Strategy had already spent $132.2 million on about 1.39 million STRC shares during the previous week and $108.6 million on approximately 1.15 million shares during the week ended Aug. 9.
Earlier in July, Strategy CEO Phong Le tied future Bitcoin accumulation partly to conditions in STRC. As previously covered here, Le said the company planned to resume issuing STRC once the security returned to its $100 par value.
“We’ll continue to build that. And yeah, when Stretch gets back to par, we’ll issue more. We’ll buy more Bitcoin,” Le said at the time.
Strategy had already started directing common-stock proceeds toward liquidity during that period. Between July 13 and July 19, the company sold about 2.73 million MSTR shares for $263.5 million while keeping its Bitcoin holdings unchanged and increasing its dollar reserve to $3.225 billion.
Cash reserve has climbed from $1.44 billion
Strategy first established its U.S. dollar reserve in December 2025 with an initial balance of $1.44 billion.
The company created the reserve to fund preferred stock dividends and interest payments on outstanding debt, reducing its dependence on raising capital or selling Bitcoin whenever scheduled cash obligations came due.
By the end of May, the reserve had declined to about $900 million. Strategy began rebuilding it more aggressively in June as the company moved toward active management of its Bitcoin, common equity, preferred securities and cash obligations.
The balance subsequently rose to $2.55 billion by early July, $3 billion by July 12, $3.225 billion by July 19 and $3.75 billion by July 26.
Further additions brought the reserve to $4.65 billion on Aug. 9, and about $4.8 billion on Aug. 16 before the latest $300 million allocation increased it to $5.1 billion.
Strategy’s newly created $1.59 billion cash account sits separately from that reserve. According to the latest filing, management can deploy money from the account across Bitcoin purchases, debt obligations, preferred dividends, and securities repurchases depending on its capital requirements and market conditions.


Hyperliquid Policy Center has asked the SEC and CFTC to let qualifying equity perpetual contracts enter the U.S. as security futures after HIP-3 markets processed more than $480 billion in notional trading volume over their first 10 months.
Summary
- Hyperliquid Policy Center has asked the SEC and CFTC to recognize qualifying equity perpetual contracts as security futures.
- The proposal would place eligible equity perpetuals under an existing framework jointly overseen by the SEC and CFTC.
- HIP 3 markets have processed more than $480 billion in cumulative notional volume during their first 10 months.
- HPC wants regulators to keep perpetual contract classification consistent across asset types while preserving exchange listing flexibility.
Hyperliquid Policy Center said in an Aug. 24 comment letter that cash-settled equity perpetuals carrying the established characteristics of futures contracts should be eligible for classification as security futures, a category jointly overseen by the two U.S. regulators.
The filing responds to a joint request for comment from the Securities and Exchange Commission and Commodity Futures Trading Commission on how U.S. law should define swaps, security-based swaps and products that may fall outside those categories. HPC described the issue as a basic classification question that has remained unsettled even as perpetual contracts have expanded outside the United States.
Under HPC’s proposal, regulators would first look at the structure of a derivative and how it trades to decide whether it is a future or a swap. The asset referenced by the contract would then determine how regulatory authority is divided between the SEC and CFTC.
A perpetual contract on Bitcoin, crude oil or an individual stock should therefore receive the same initial product classification when each instrument has the same futures-like characteristics, the group argued. A contract tied to a single stock that qualifies as a future would fall into the security futures category and come under both agencies.
Hyperliquid group says equity perpetuals can qualify as security futures
At the center of HPC’s position is the structure of a perpetual contract, which has no predetermined expiration date but uses recurring funding payments to keep its price close to the asset it tracks.
When a contract trades above its reference price, long-position holders pay shorts. If the contract falls below the reference price, shorts pay longs. HPC said the mechanism creates a continuous incentive for the perpetual price to converge toward the underlying market, performing a function that expiration and final settlement serve in traditional dated futures.
HPC also cited features that courts and regulators have historically used when examining futures contracts, including standardized terms, fungibility, fixed unit quantities and the ability to close a position through an offsetting trade.
On Hyperliquid’s HIP-3 markets, positions open and close through a central limit order book, margin is maintained continuously, and contract prices are publicly available. Equity perpetual holders receive price exposure but do not obtain ownership, voting rights, or other claims attached to the referenced shares.
The lack of an expiry date does not automatically prevent futures classification, according to the filing. HPC cited federal court decisions finding that a specified future delivery or settlement date is not always required and that contracts of indefinite duration can still carry the futurity associated with a futures contract.
U.S. regulators have already applied that reasoning to crypto perpetuals. In May, crypto.news previously reported that the CFTC approved Kalshi’s Bitcoin perp as the first federally regulated Bitcoin perpetual futures contract in the United States. The May 29 approval classified BTCPERP as a futures contract even though it has no fixed expiration date.
Kalshi began offering the contract in June and subsequently expanded its regulated perpetual lineup to other cryptocurrencies. The CFTC said additional products would remain subject to review, leaving the treatment of contracts referencing other asset classes open to further regulatory analysis.
SEC and CFTC have yet to settle the classification question
Past enforcement cases have not produced a uniform answer for perpetual contracts.
HPC said earlier CFTC actions treated some perpetual products as swaps after examining parts of the Commodity Exchange Act’s swap definition without determining whether the instruments qualified for the statutory exclusion covering futures contracts. Other cases treated perpetual-style products as leveraged or margined retail commodity transactions subject to trading requirements similar to those applied to futures.
The SEC also used the term “perpetual futures” in its case related to the Mango Markets exploit while disputing that the products were futures contracts offered under regulated futures rules. According to HPC, neither an enforcement action nor a court had resolved the threshold question of whether the instruments themselves qualify as futures or security futures excluded from the swap definition.
The CFTC took a different approach with Kalshi in May, approving BTCPERP as a “contract for sale of a commodity for future delivery.” Its accompanying policy statement said perpetual contracts on other asset classes should undergo review and specifically identified equity-based products as an area where the CFTC and SEC should both be involved.
Disagreement over that interpretation has already reached federal court. CME Group later filed a legal challenge over perps, arguing that products such as Kalshi’s contract should fall under the swaps framework instead of being treated as ordinary futures. CME’s position contests the legal basis the CFTC used when approving the contracts.
Around the same period, the SEC and CFTC opened the definitions review that prompted HPC’s latest submission. The agencies sought public input on swaps, security-based swaps, exclusions from those definitions and emerging derivatives, including products that raise questions about the boundary between their jurisdictions.
HIP-3 volume puts $480 billion behind the regulatory debate
HPC tied its request to trading activity already taking place through Hyperliquid’s HIP-3 framework, where independent market operators known as deployers can create their own perpetual markets.
The protocol handles execution, price-time order matching, enforcement of margin requirements, funding transfers, clearing and settlement. Deployers control elements including the assets listed, contract specifications, oracle sources, leverage limits and open-interest caps.
HIP-3 markets now cover several traditional asset classes for users outside the United States, including crude oil, gold and other precious metals, foreign exchange, equity indexes, individual equities and exchange-traded funds.
Over the 10 months following HIP-3’s launch, those markets accumulated more than $480 billion in notional trading volume and maintained roughly $4 billion in open interest, according to the filing. Across Hyperliquid as a whole, markets processed nearly $3 trillion in notional volume during 2025 and more than $1.5 trillion during 2026 through Aug. 23.
Stock-linked products have become part of that expansion. A July examination of Hyperliquid equity perps detailed how the platform has hosted perpetual contracts tracking equities while giving traders synthetic price exposure without ownership of the underlying shares.
HPC said U.S. users currently cannot access Hyperliquid, meaning the liquidity and infrastructure described in its filing developed outside the country while regulated domestic access to perpetual contracts remained limited.
Security futures would put equity perps under both regulators
HPC proposed using the existing security futures framework for equity perpetuals that meet futures characteristics because the category already assigns oversight to both agencies.
Under the framework, a designated contract market regulated by the CFTC can list security futures after notice-registering with the SEC. A national securities exchange can cross in the other direction by notice-registering with the CFTC, while intermediaries have parallel registration routes.
Security futures have seen limited commercial activity since OneChicago closed in 2020, but the filing noted renewed interest this year. CME Group announced in June that it would launch single-stock futures beginning July 27, returning U.S. exchange activity to a product category that had been largely dormant.
HPC asked the agencies to confirm that cash-settled equity perpetuals carrying established futures characteristics may be listed as security futures, while allowing exchanges to retain flexibility when deciding how individual products should be classified.
The group also requested a consistent taxonomy between the two regulators and asked them to update the security futures framework so existing listing standards can accommodate new contract structures. HPC said classification should remain flexible enough for a bilateral, individually negotiated perpetual-style product to be treated as a swap or security-based swap when it lacks the fungibility, offset rights and multilateral execution associated with futures.
According to the filing, the SEC and CFTC could issue interpretive guidance, policy statements or staff-level guidance without waiting for a formal rulemaking. The agencies also have joint authority to modify security futures listing standards, which they previously used for American Depositary Receipts, ETFs, closed-end fund shares and debt securities.

Tim Bradley delivers verdict on Rolly Romero’s performance in Teofimo Lopez defeat

Buchardt Audio E50-S Bookshelf Speaker Offers a Different Take on the Acclaimed E50

Man Utd news: Lewis Hall transfer stance clear as defender ‘in talks’ over future





-

 Fashion3 days ago
Weekend Open Thread: Madewell – Corporette.com
-

 Business3 days ago
Musk’s Tesla, SpaceX Confirm $16.8 Billion ‘Terafab’ Chip Plant as World’s Largest Building in Texas
-

 Crypto World3 days ago
anatomy of crypto’s biggest liquidation event since 2021
-

 Business7 days ago
SMA Solar Technology AG (SMTGY) Q2 2026 Earnings Call Transcript
-

 Tech7 days ago
Qwen3.8-27B runs frontier-class coding agents and reasoning locally, no cloud API required
-

 Politics3 days ago
6 months on, Irish renters crushed by effects of government housing bill
-
 NewsBeat3 days ago
The ‘Lucky Dip Gang’ causing carnage for clicks: After five thugs were killed speeding in the wrong direction on a motorway, GUY ADAMS investigates a sick new trend… and why police aren’t even allowed to pursue them
-

 Tech6 days ago
GLM-5.3 hits the API at $1.4/$4.4 per million tokens
-

 News Videos5 days ago
Don’t Leave Your Financial Future To Chance | August 19, 2026
-

 Business2 days ago
Mystery AI Model ‘Ox Alpha’ Draws Developers With Free Access as Chinese Lab Origins Remain Debated
-

 Tech7 days ago
Keychron K8 Ultra 8K review: a great value keyboard with comfort issues
-

 Business4 days ago
Five Below: Kids Discount Retailer Reaps Rich Rewards
-

 Business7 days ago
Stock Market Today: Tech Futures Slide As Treasury Yields Jump; Nvidia, Micron, Sandisk Sell Off
-

 Business5 days ago
Marvell Shares Jump 7% as Google Chip Deal Confirms Custom AI Silicon Partnership, Analysts
-

 Tech7 days ago
Ken Okuyama’s Kode89 Supercar Features Three Pedals and a Choice of V12s
-

 Politics7 days ago
The House Opinion Article | Security means more than military spending
-

 Fashion7 days ago
The Dressier Side of Shorts
-

 Tech7 days ago
Payments giant Stripe is about to drop over $7 billion to become a gateway to AI token sales
-

 Business7 days ago
Nasdaq Ticks Higher as Wall Street Awaits Retail Earnings and Weighs Fed’s Next Move at Jackson Hole Meeting
-

 Crypto World7 days ago
Compound approves $52M institutional DeFi program
You must be logged in to post a comment Login