
Crypto World
What is Bitcoin dominance? How to read the BTC.D chart



Bitcoin dominance measures BTC’s share of total crypto market capitalization. It is the single most watched macro indicator for timing capital rotation between bitcoin and altcoins.
Summary
- Bitcoin dominance (BTC.D) is the ratio of bitcoin’s market capitalization to the total cryptocurrency market capitalization, expressed as a percentage.
- BTC.D peaked near 99 percent in 2013, fell to a record low of roughly 38 percent during the 2018 ICO bust, and has cycled in a 33 to 73 percent range since 2017.
- As of mid-2026, BTC.D sits in the mid to high 50s after retreating from a four-year high above 63 percent reached in mid-2025, driven largely by institutional ETF inflows concentrating in bitcoin.
- The Altcoin Season Index, which scores how many of the top 100 altcoins outperform bitcoin over 90 days, reads below 40 in August 2026, well short of the 75 threshold that confirms a broad altcoin season.
- Reading BTC.D in isolation is misleading; the metric must be cross-referenced with total market capitalization and volume to distinguish between four distinct market regimes.
Bitcoin dominance is one of those numbers that every crypto trader checks but few use correctly. The metric appears simple: divide bitcoin’s market cap by the total cryptocurrency market cap and multiply by 100. The result tells you what percentage of the market’s total value is held in bitcoin at any given moment.
The complication is that a single percentage can mean very different things depending on what the rest of the market is doing. A rising BTC.D during a rising total market cap signals something entirely different from a rising BTC.D during a falling total market cap. Understanding those distinctions is the difference between using dominance as a trading tool and using it as decoration on a dashboard.
How Bitcoin dominance is calculated
The formula is straightforward. BTC.D equals bitcoin’s market capitalization divided by the total cryptocurrency market capitalization, multiplied by 100. Market capitalization is calculated by multiplying the circulating supply of a coin by its current price.
Data providers like CoinGecko and CoinMarketCap track thousands of tokens, so the denominator, total market cap, includes everything from Ethereum to memecoins with three-figure market caps. This matters because the number of tracked tokens has grown from a few hundred in 2017 to over 15,000 today. Every new token added to the denominator dilutes BTC.D mechanically, even if bitcoin’s own market cap is growing.
Some analysts prefer to exclude stablecoins (USDT, USDC, DAI) from the denominator because stablecoins do not compete with bitcoin for speculative capital. A version of BTC.D that excludes stablecoins typically runs 3 to 5 percentage points higher than the standard metric. Both versions are available on TradingView.
The calculation carries an important caveat that affects how the number should be interpreted. Market capitalization is computed using circulating supply, but the definition of circulating supply varies by data provider. CoinGecko and CoinMarketCap use different methodologies to determine which coins are in active circulation, which means BTC.D can differ by one to two percentage points depending on the source. Traders who track dominance over time should use a single data source consistently to avoid comparing numbers calculated under different assumptions.
A second caveat involves the treatment of wrapped and bridged assets. Wrapped bitcoin (WBTC) on Ethereum, for example, represents real bitcoin locked in custody and reissued as an ERC-20 token. Data providers typically count both the native BTC and the WBTC in their total market cap calculation, which can produce a minor double-counting effect. As cross-chain bridging has grown, this issue has become more relevant, though it remains small relative to bitcoin’s total market cap.
A brief history of BTC.D
Bitcoin dominated the crypto market almost entirely in its early years. From 2009 through 2016, daily BTC.D averaged between 83 and 93 percent. There was simply nothing else of comparable size.
The first meaningful decline came during the 2017 ICO boom. Ethereum’s launch in 2015 created a platform for new tokens, and by January 2018, thousands of ICO projects had collectively dragged BTC.D down to its all-time low near 38 percent. That low marked the peak of ICO speculation, not the peak of a healthy altcoin market. Most ICO tokens lost 90 percent or more of their value within a year.
BTC.D recovered sharply through 2019, reaching 71 percent in September as the ICO bubble fully deflated and capital retreated to bitcoin. The DeFi summer of 2020 and the NFT mania of 2021 pulled dominance back down to the mid-40s, where it hovered through most of 2021.
The 2022 bear market saw BTC.D climb steadily as altcoins fell faster than bitcoin. By late 2024, bitcoin had reclaimed 60 percent dominance, and the approval of spot bitcoin ETFs in January 2024 concentrated new institutional capital almost entirely in bitcoin. Dominance hit a four-year high above 63 percent in mid-2025.
As of August 2026, BTC.D has pulled back to the mid to high 50s but remains elevated by historical standards. The Altcoin Season Index sits below 40, meaning fewer than 40 percent of the top 100 altcoins have outperformed bitcoin over the past 90 days.
The 2024 to 2026 period introduced dynamics that no previous cycle had produced. Spot bitcoin ETFs launched in January 2024 and attracted more than $30 billion in net inflows within their first year. Because these products buy and hold bitcoin exclusively, every dollar of ETF inflow increases bitcoin’s market cap without affecting altcoins. The mechanical result was a sustained push on the numerator of the BTC.D equation that altcoin rallies struggled to offset.
By March 2025, cumulative ETF holdings exceeded 1.1 million bitcoin, roughly 5.6 percent of the circulating supply. That concentration of supply in passive, long-only vehicles created a new source of structural demand that did not exist in the 2017 or 2021 cycles. Even when retail traders rotated into Solana, memecoins, and restaking tokens during brief speculative bursts in late 2024 and early 2025, the persistent ETF bid kept BTC.D elevated.
The pattern repeated during the first half of 2026. Bitcoin consolidated between $95,000 and $115,000 while altcoins staged several short-lived rallies. Each rally pulled BTC.D down by two to three percentage points before institutional buying absorbed the dip and pushed dominance back up. This sawtooth pattern, where dominance dips are shallower and recoveries faster than in previous cycles, is the signature of the ETF-era market structure.
The four market regimes
Identifying the current regime requires checking two data points at the same time: BTC.D direction and total market cap direction. TradingView makes this straightforward. Open a split chart with BTC.D on the top panel and the TOTAL ticker (total crypto market cap) on the bottom. If both lines are rising, the market is in Regime 1. If BTC.D is falling while TOTAL is rising, it is Regime 2. The other combinations follow the same logic.
Regime transitions tend to happen at inflection points in the bitcoin halving cycle. Historically, the first 12 to 18 months after a halving favor Regime 1, as new supply reduction draws attention and capital to bitcoin. The rotation into Regime 2, where altcoins outperform, typically begins 18 to 24 months after the halving, as traders seek higher beta returns once bitcoin’s rally matures. The April 2024 halving placed the expected altcoin rotation window around late 2025 to mid-2026, but ETF-driven structural changes have delayed and dampened the rotation compared to prior cycles.
Reading BTC.D requires looking at two variables simultaneously: dominance direction and total market cap direction. The combination produces four distinct regimes.
Regime 1: BTC.D rising, total market cap rising. Bitcoin is leading a broad rally. Money is entering the crypto market but flowing primarily into bitcoin. This is typical of early bull markets and was the dominant pattern from October 2023 through mid-2024, when ETF inflows powered bitcoin from $27,000 to $73,000 while most altcoins lagged.
Regime 2: BTC.D falling, total market cap rising. Capital is rotating from bitcoin into altcoins while the overall market grows. This is the textbook definition of altcoin season. It occurred in Q1 2021 and briefly in Q4 2021 when Solana, Avalanche, and other Layer 1 tokens surged while bitcoin consolidated.
Regime 3: BTC.D rising, total market cap falling. The market is contracting and altcoins are falling faster than bitcoin. Capital is not entering bitcoin; it is leaving altcoins. This is the bear market flight to relative safety and was the dominant pattern through most of 2022.
Regime 4: BTC.D falling, total market cap falling. Both bitcoin and altcoins are declining, but bitcoin is declining faster. This is rare and typically occurs during bitcoin-specific sell events, such as the Mt. Gox creditor distribution fears in mid-2024.
Without checking total market cap, a trader looking at a rising BTC.D cannot distinguish between Regime 1 (bullish) and Regime 3 (bearish). That distinction is why dominance alone is an incomplete signal.
How to read a BTC.D chart
BTC.D charts are available on TradingView (ticker: BTC.D), CoinGecko, and CoinMarketCap. The chart plots dominance as a percentage over time and supports standard technical analysis tools.
Support and resistance levels on BTC.D work similarly to price charts. The 38 percent all-time low from January 2018 has never been retested and represents the strongest historical support. The 55 to 57 percent zone has acted as both support and resistance multiple times since 2019. A sustained break below 55 percent has historically preceded altcoin rallies.
Trend lines and channels are useful for identifying the prevailing regime. BTC.D spent most of 2023 through early 2025 in a rising channel, with higher highs and higher lows. A break below the lower bound of that channel would be the first structural signal that dominance is reversing.
Moving averages provide context. The 200-day moving average smooths out noise and shows the primary trend. When BTC.D is above its 200-day moving average, bitcoin is gaining market share on a sustained basis. When it crosses below, the trend is shifting toward altcoins.
Volume is not directly available on BTC.D charts because dominance is a ratio, not a tradable asset. However, traders cross-reference BTC.D movements with open interest data on bitcoin perpetual futures to gauge the conviction behind dominance shifts. Rising open interest alongside rising BTC.D suggests new leveraged positions are being opened in bitcoin’s favor.
The Relative Strength Index (RSI) applied to BTC.D offers additional context. When BTC.D’s weekly RSI reaches overbought territory above 70, it historically marks periods where bitcoin’s outperformance is becoming stretched and a mean reversion toward altcoins is approaching. Conversely, a weekly RSI below 30 on BTC.D has coincided with peak altcoin euphoria, which has preceded sharp reversals back toward bitcoin. The RSI readings in mid-2026 sit in neutral territory near 55, consistent with a market that has not committed fully to either bitcoin dominance or altcoin rotation.
Comparing BTC.D against the Ethereum dominance chart (ETH.D) adds a second layer of analysis. In a classic altcoin season, ETH.D rises before smaller altcoins rally, because Ethereum often acts as the gateway between bitcoin and the broader altcoin market. When BTC.D is falling and ETH.D is rising simultaneously, it signals that capital is actively rotating down the risk curve. When BTC.D is falling but ETH.D is also falling, it suggests capital is skipping Ethereum entirely and flowing into higher-risk altcoins or memecoins, a pattern that tends to produce shorter and more fragile rallies.
Why institutional flows changed the game
The introduction of spot bitcoin ETFs in the United States in January 2024 altered the structural dynamics of BTC.D in ways that historical patterns did not anticipate.
Prior to ETFs, retail-driven capital rotated through a predictable cycle: bitcoin first, then Ethereum, then large-cap altcoins, then small-cap altcoins and memecoins. Each stage pulled dominance lower as capital flowed down the risk curve. This rotation powered the altcoin seasons of 2017 and 2021.
ETF capital does not rotate. Institutional investors buying bitcoin through BlackRock’s iShares Bitcoin Trust (IBIT) or Fidelity’s Wise Origin Bitcoin Fund (FBTC) are making an allocation to a specific asset class, not speculating on the crypto rotation trade. That capital enters bitcoin and stays in bitcoin. It does not flow into altcoins.
The result is a structural floor under BTC.D that did not exist in previous cycles. Even when retail traders rotate into altcoins, the persistent ETF inflows keep bitcoin’s market cap growing, limiting how far dominance can fall. This is why BTC.D has remained above 55 percent through mid-2026 despite several attempted altcoin rotations.
The Ethereum ETFs, approved in mid-2024, added a second institutional magnet but with far lower inflows than bitcoin ETFs. The concentration of institutional capital in just two assets, bitcoin and to a lesser extent Ethereum, has compressed the capital available for the rest of the market.
The asymmetry between bitcoin and altcoin ETF inflows reveals the depth of this structural shift. In the first 18 months of spot bitcoin ETF trading, cumulative net inflows exceeded $40 billion. Spot Ethereum ETFs, which launched in July 2024, attracted roughly $7 billion over the same period. No other cryptocurrency has a spot ETF in the United States as of mid-2026, meaning the vast majority of institutional capital entering crypto through regulated vehicles is directed exclusively at bitcoin.
This concentration has implications for dominance that extend beyond the raw numbers. ETF capital is sticky. Retail traders who buy altcoins on Binance or Coinbase can sell them in minutes during a panic. Institutional allocators who purchased bitcoin through an ETF as part of a portfolio allocation strategy typically rebalance quarterly, not reactively. The result is that bitcoin’s market cap declines more slowly during drawdowns than altcoin market caps, which mechanically pushes BTC.D higher during selloffs.
The second-order effect is on market maker behavior. As ETF-driven bitcoin volume has grown, market makers have concentrated liquidity in BTC pairs. Altcoin pairs on centralized exchanges have seen relative spreads widen and depth decline compared to 2021 levels. Thinner altcoin liquidity means larger percentage moves on smaller capital flows, which amplifies both altcoin rallies and altcoin crashes. This volatility asymmetry makes BTC.D movements faster and more pronounced during regime transitions than they were in pre-ETF cycles.
Common mistakes when reading BTC.D
Treating falling BTC.D as automatically bullish for altcoins. If total market cap is also falling (Regime 4), declining dominance means bitcoin is dropping faster than altcoins, not that altcoins are rallying. This happened briefly during the Mt. Gox distribution scare in July 2024.
Ignoring stablecoin market cap. When stablecoin supply grows, total market cap increases without any speculative capital entering bitcoin or altcoins. This mechanically pushes BTC.D lower and can create a false signal of altcoin strength.
Expecting historical cycles to repeat exactly. The 2017 and 2021 altcoin seasons occurred without ETFs, without institutional allocators, and with a much smaller total token count. The current cycle’s structural differences mean that BTC.D may not fall as far or as fast as it did in those periods.
Confusing BTC.D with bitcoin’s price direction. BTC.D can rise while bitcoin’s price falls (Regime 3) and can fall while bitcoin’s price rises (if altcoins are rising faster). Dominance measures relative performance, not absolute performance.
Using BTC.D for timing perpetual futures entries. Dominance shifts over weeks and months, not hours. Using BTC.D to time short-term leveraged trades adds a slow-moving indicator to a fast-moving decision, which rarely improves outcomes.
A sixth common error is anchoring expectations to round-number dominance levels without context. The belief that BTC.D “must” return to 40 percent because it did so in 2018 and 2021 ignores the structural changes introduced by ETFs, the growth of stablecoin market cap, and the expansion of the tracked token universe. Each of these forces exerts downward pressure on the absolute level of BTC.D independent of capital rotation, meaning the floor for dominance in this cycle may be materially higher than in previous ones. Adjusting expectations for structural shifts is as important as reading the chart itself.
What this article does not cover
This article does not cover specific altcoin analysis or recommendations. It does not cover the Ethereum dominance metric (ETH.D), which is a related but distinct indicator used for timing ETH-versus-altcoin rotations. It does not cover on-chain dominance metrics, which weight bitcoin’s share by transaction volume or active addresses rather than market capitalization.
Practical checks for using BTC.D
Always check total market cap alongside dominance. TradingView’s TOTAL ticker shows total crypto market cap. Use a split chart with BTC.D on top and TOTAL on the bottom to identify which of the four regimes the market is currently in.
Monitor the Altcoin Season Index. CoinMarketCap and Blockchaincenter.net publish real-time Altcoin Season Index scores. A reading above 75 confirms altcoin season. A reading below 25 confirms bitcoin season. Anything between 25 and 75 is neutral.
Track ETF inflows alongside dominance. Weekly ETF flow data from providers like SoSoValue and BitMEX Research shows whether institutional capital is reinforcing or counteracting dominance trends. Persistent weekly inflows above $500 million into bitcoin ETFs create a structural headwind for falling BTC.D.
Use the stablecoin-excluded version for cleaner signals. On TradingView, the ticker BTC.D with stablecoins excluded removes the noise introduced by USDT and USDC supply changes.
Set alerts at structural levels. A sustained daily close below 55 percent on BTC.D, combined with rising total market cap, has historically preceded the strongest altcoin rotations. Setting a TradingView alert at that level saves the effort of watching the chart continuously.
What is Bitcoin dominance?
Bitcoin dominance, abbreviated BTC.D, is the percentage of total cryptocurrency market capitalization that belongs to bitcoin. It is calculated by dividing bitcoin’s market cap by the total crypto market cap and multiplying by 100.
What does a rising BTC.D mean?
A rising BTC.D means bitcoin is gaining market share relative to the rest of the crypto market. This can occur because bitcoin is rallying faster than altcoins (bullish) or because altcoins are falling faster than bitcoin (bearish). Total market cap direction determines which scenario is in play.
What BTC.D level signals altcoin season?
There is no fixed threshold, but historically, sustained moves below 55 percent combined with rising total market cap have preceded broad altcoin rallies. The Altcoin Season Index score above 75 is the standard confirmation signal.
Why has BTC.D stayed high in 2025 and 2026?
Spot bitcoin ETFs, approved in January 2024, channel institutional capital directly into bitcoin without rotation into altcoins. This structural inflow creates a floor under BTC.D that did not exist in previous market cycles.
Does BTC.D include stablecoins?
The standard BTC.D calculation includes stablecoins in the denominator (total market cap). Some analysts use a stablecoin-excluded version for cleaner signals, which typically runs 3 to 5 percentage points higher.
How do I view BTC.D on TradingView?
Search for the ticker BTC.D on TradingView. The chart displays bitcoin dominance as a percentage over time and supports all standard technical analysis tools including trend lines, moving averages, and RSI.
Can BTC.D predict bitcoin’s price?
No. BTC.D measures bitcoin’s relative share of the crypto market, not its absolute price. Bitcoin’s price can rise while BTC.D falls (if altcoins rise faster) or fall while BTC.D rises (if altcoins fall faster). The two metrics answer different questions.
What was bitcoin’s lowest ever dominance?
Bitcoin dominance reached its all-time low near 38 percent in January 2018, at the peak of the ICO bubble. The rapid proliferation of thousands of new tokens pulled capital away from bitcoin before the subsequent bear market reversed the trend.
Disclaimer: This article is for informational purposes only and does not constitute financial, investment, or trading advice. Bitcoin dominance is a macro indicator, not a trading signal. Always conduct your own research before making any investment decisions. Published August 24, 2026.

Bitcoin’s price revival that began last Wednesday culminated, at least for now, a few hours ago when the asset soared past $80,000 for the first time since mid-May and tapped a multi-month peak above $81,000.
Analysts were quick to pick up the move and outline the next short-term targets of up to $88,000. BTC’s surge also led to an increase in liquidated short positions as the total value exceeded $260 million in the past 4 hours.
On a daily scale, the liquidations are up to $650 million, with the lion’s share coming from shorts again. Bitcoin is responsible for half of that amount, according to data from CoinGlass.
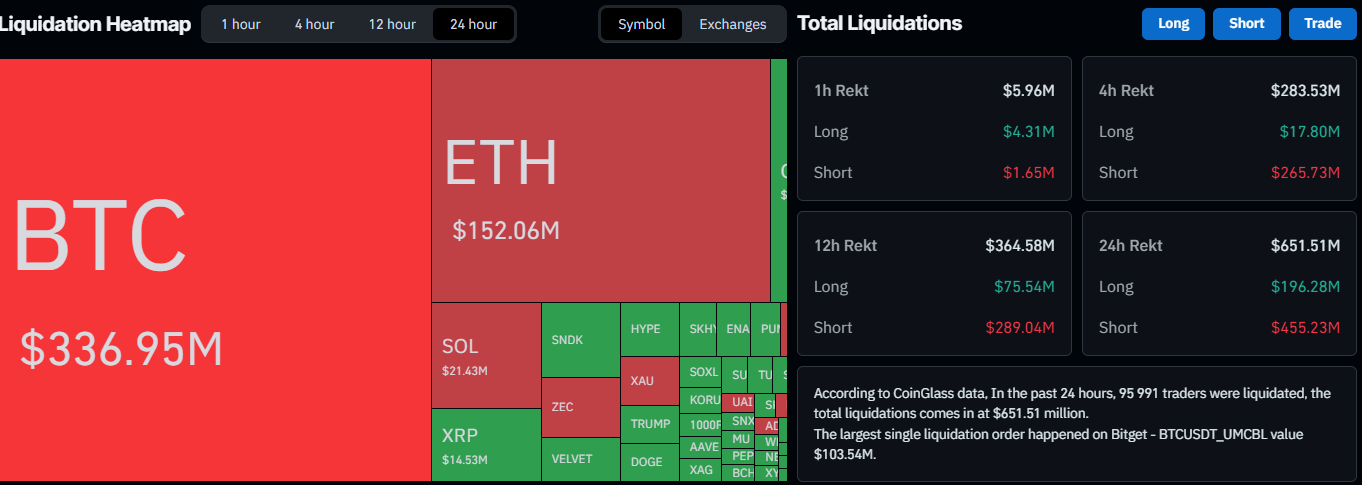
Thus, the primary cryptocurrency gained over $16,000 from its starting point of under $65,000 last Wednesday to just over $81,000 earlier today.
Some of the reasons behind this major resurgence include the US Treasury Department’s announcement from last week, the Crypto Summit in the White House, renewed ETF appetite, and Jim Cramer. Oh, wait, the last one might be a joke.
Some altcoins have followed BTC on the way up today, including ETH, which has neared $2,500 once again. Although the asset has soared by 32% in the past week, the $2,500 barrier appears too strong at the moment. XRP, on the other hand, fights for the $1.50 resistance.
SOL has surged the most from the larger-cap alts today, pumping by over 7.5%. It now trades above $100 for the first time in months as well.
The post Bitcoin Smashes $80K as $260M in Shorts Get Wiped Out: Here Are the Next Targets appeared first on CryptoPotato.


Cosmos Labs confirmed an ongoing security incident affecting users of the Cosmos EVM module. It advised chains in contact with it to ask validators to halt block production.
Three networks have now disclosed impact. KiiChain and TAC froze their chains after attackers drained accounts, while MANTRA restarted its mainnet.
3 Chains Traced Incidents to Cosmos EVM
Three networks disclosed security incidents within days of each other. All three named the Cosmos EVM module, a component that lets Cosmos SDK chains run Ethereum-style smart contracts.
MANTRA was first. BeInCrypto reported that the team halted the chain as a precaution amid a security incident in an upstream dependency. The team said two MANTRA-managed wallets were affected, and user balances were never impacted.
The network later informed users that the vulnerability was in the Cosmos-EVM module and that it had been fixed in version 8.4.0, allowing the network to resume normal block production.
Follow us on X to get the latest news as it happens
KiiChain then disclosed an exploit. The team said that on August 22, an attacker repeated the same technique 18 times, draining 148,326,583.15 KII before validators halted the chain at block 9355723.
“The vulnerability is in Cosmos code, not KiiChain code. It sits in the shared Cosmos EVM module (cosmos/evm), which KiiChain runs unmodified,” the team said.
The chain remains halted. KiiChain said the network will resume through a coordinated binary upgrade at a predetermined block height, with all validators applying the update simultaneously. The process will not require an on-chain governance proposal.
TAC halted the same day at block 24,671,475 after an attacker drained a single account. The team said the defect sits in the shared module rather than in TAC-specific code.
Cosmos Labs has pointed teams with questions to its security contact and said it will publish an incident report once the situation is resolved. It has not yet described the cause.
Subscribe to our YouTube channel to watch leaders and journalists provide expert insights
The post Cosmos Labs Confirms Cosmos EVM Incident as 3 Chains Disclose Impact appeared first on BeInCrypto.


The CFTC entered the criminal Polymarket case against U.S. Army soldier Gannon Ken Van Dyke on Aug. 24 after a federal judge granted the regulator permission to file an amicus brief.
Summary
- Judge Margaret Garnett allowed the CFTC to file its contested amicus brief on August 24.
- Van Dyke may answer new CFTC arguments through a ten-page filing due September 9, 2026.
- Prosecutors allege thirteen Polymarket wagers generated approximately $409,881 using classified information before Maduro’s capture.
- The defense argues geopolitical event contracts are bets rather than swaps governed by federal commodities law.
- CFTC civil proceedings remain stayed pending resolution of the related federal criminal prosecution in Manhattan.
Van Dyke’s lawyers had opposed the request. They argued that the CFTC was attempting to defend its regulatory authority through the criminal prosecution while its parallel civil lawsuit remained paused.
Judge Margaret Garnett rejected the request to exclude the brief but said the court would give the regulator’s arguments “appropriate weight.” Van Dyke has pleaded not guilty to charges arising from Polymarket wagers that allegedly generated $409,881.
CFTC can defend its Polymarket interpretation
The CFTC requested permission to address Van Dyke’s argument that the Venezuela-related Polymarket contracts were bets rather than swaps regulated under the Commodity Exchange Act.
The regulator argues that event contracts can qualify as swaps when their value depends on events carrying financial, economic or commercial consequences. The Maduro contracts could have related consequences for Venezuelan bonds, oil prices and the country’s currency, according to the CFTC’s civil complaint.
Van Dyke’s attorneys contend that this interpretation stretches the swap definition beyond its statutory limit. They say the contracts were straightforward geopolitical wagers with no underlying financial product or commercial exposure.
“The CFTC is no sheep ‘friend of the Court’ here,” the defense wrote, describing the regulator as a “regulatory wolf.” The language represents legal advocacy, not a court finding.
The defense also disputes whether CFTC Rule 180.1, which prohibits fraud connected with swaps, can support the commodities fraud charge under the circumstances alleged.
Judge gives Van Dyke until September 9
Garnett added the CFTC’s proposed amicus brief to the criminal record. The order does not decide whether the contracts qualify as swaps or whether the disputed charges will survive.
The judge gave prosecutors and Van Dyke until Sept. 9 to answer any CFTC argument not already addressed in their motion-to-dismiss filings. Each optional response may contain no more than 10 pages.
The deadline makes the regulator’s swap interpretation part of the court’s consideration before it rules on dismissal. A decision against the CFTC’s position could narrow how federal commodities law applies to prediction markets.
Van Dyke’s criminal trial remains tentatively scheduled for Dec. 7. A status conference is expected on Sept. 28, although disputes involving classified evidence or the dismissal motion could alter that schedule.
Soldier allegedly earned $409,881 from 13 bets
The Justice Department alleges that Van Dyke participated in planning and executing Operation Absolute Resolve, the U.S. military operation that captured former Venezuelan President Nicolás Maduro on Jan. 3.
According to the federal indictment, Van Dyke placed approximately $33,934 through 13 Polymarket trades between Dec. 27 and Jan. 2. The markets covered Maduro’s removal, U.S. forces entering Venezuela, a potential invasion and presidential war powers.
Prosecutors allege that the trades produced approximately $409,881 in profit after several contracts resolved in Van Dyke’s favor. They also accuse him of transferring proceeds through a foreign cryptocurrency vault and attempting to conceal accounts linked to the activity.
Those allegations remain unproven. Van Dyke faces charges including commodities fraud, wire fraud, misuse and theft of government information, and conducting a monetary transaction involving allegedly criminal proceeds.
Civil Polymarket case remains paused
The CFTC brought a parallel civil action on April 23, its first insider trading case involving prediction-market event contracts. The regulator is seeking restitution, disgorgement, financial penalties, trading bans and an injunction.
The agency’s complaint invokes the “Eddie Murphy Rule,” which prohibits certain uses of misappropriated government information when trading swaps.
A federal judge has paused the parallel CFTC lawsuit until the criminal proceeding ends. Van Dyke’s lawyers argue that the regulator should defend its legal interpretation in that lawsuit rather than enter the criminal matter.
The dispute reaches beyond one trader. In related coverage, the CFTC has been developing updated federal rules for prediction markets as courts consider whether event contracts fall under federal derivatives law or state gambling regimes.


Standard Chartered Bank Hong Kong became the first bank to distribute HKDAP on Aug. 24, giving eligible institutional clients and partners access to Hong Kong’s first live regulated local-currency stablecoin.
Summary
- Standard Chartered became HKDAP’s first bank distributor, extending access to eligible institutional clients and partners.
- Anchorpoint holds one of two stablecoin issuer licences granted by Hong Kong’s regulator in April.
- HKDAP launched through controlled beta access on Ethereum for institutions and professional investors this month.
- Standard Chartered plans tokenized money market fund subscription and settlement services during fourth quarter 2026.
- Anchorpoint reported 522,000 HKDAP circulating as of August 19 during the limited beta rollout period.
Anchorpoint Financial issues HKDAP, short for “HKD At Par,” under licence FRS01 from the Hong Kong Monetary Authority. Standard Chartered is Anchorpoint’s largest shareholder and established the company with HKT and Animoca Brands.
Hong Kong granted two stablecoin issuer licences in April, one to Anchorpoint and another to HSBC. That distinction is important: the regulator licensed two issuers, but HSBC had not publicly launched its stablecoin when Standard Chartered announced its distribution service.
Standard Chartered adds a bank channel for HKDAP
Standard Chartered joins HashKey Exchange and OSL as an authorized HKDAP distributor. HashKey and OSL began offering beta access earlier in August, before Standard Chartered became the first conventional bank to join the distribution network.
Eligible clients can use authorized distributors to convert Hong Kong dollars into HKDAP and redeem the tokens for fiat currency. Access remains limited to institutions, corporate customers and professional investors during the current phase.
As previously reported, Anchorpoint launched HKDAP through a phased institutional rollout. HashKey subsequently completed an initial minting and redemption transaction for approved clients.
HKDAP operates on Ethereum and is intended to maintain a value of HK$1 per token. Hong Kong’s Stablecoins Ordinance requires licensed issuers to maintain adequate reserves, segregate those assets and process redemptions at par.
Anchorpoint’s published figures showed 522,000 HKDAP in circulation as of Aug. 19. That limited supply reflects the project’s controlled beta status rather than broad consumer adoption.
HKDAP will target tokenized fund settlement
Standard Chartered plans to introduce subscription and settlement services for tokenized money market funds during the fourth quarter. The bank said it would work with international and Hong Kong asset managers.
A stablecoin can provide the cash side of a tokenized fund transaction on the same blockchain infrastructure used to record the fund units. This can reduce the timing gap between transferring an investment and completing its payment.
Standard Chartered said the service could support faster settlement, but the bank has not named participating managers or disclosed expected transaction volumes.
The project builds on the bank’s existing tokenization work. Standard Chartered already provides infrastructure for China Asset Management Hong Kong’s tokenized money market fund and previously tested tokenized deposit settlement through the HKMA’s Project Ensemble.
The bank will also test HKDAP for transfers between companies within its group. Further proposed applications include cross-border payments, treasury management and transfers outside conventional banking hours.
Those uses remain pilots or planned services. Standard Chartered has not announced a commercial launch date beyond the Q4 target for tokenized fund subscriptions and settlement.
Hong Kong licensed two stablecoin issuers
The HKMA awarded its first licences to Anchorpoint and HSBC on April 10 after receiving 36 applications. The regulator has said it will remain selective when considering further approvals.
Anchorpoint adopted a business-to-business-to-consumer distribution model. Instead of serving every holder directly, it works with regulated banks, exchanges and commercial partners that provide access and fiat conversion.
In related coverage, HashKey became an authorized distributor for institutional HKDAP access. OSL also provides distribution, liquidity and conversion services during the beta period.
The HKMA has warned investors about unrelated tokens using the HKDAP name. Its April warning said tokens carrying HKDAP or HSBC tickers were circulating without connections to the licensed issuers.
Users must therefore verify contract addresses and access the stablecoin through Anchorpoint’s authorized channels.
Independent review raises contract questions
Security researcher Yajin Zhou published an independent review of HKDAP’s Ethereum contract after its beta launch. The analysis questioned elements of its custom approval, upgrade and access-control architecture.
The review claimed some compliance controls did not operate as expected, but the findings were not an HKMA enforcement determination or confirmed exploit.
No theft or loss was identified in the review. Anchorpoint had not published a detailed public response to the findings at the time of writing.
The next measurable developments will be named asset-manager partnerships, actual fund settlement transactions and updated reserve disclosures. Anchorpoint has also said wider access, including a possible retail expansion, may arrive by the end of 2026, subject to market conditions and regulatory requirements.
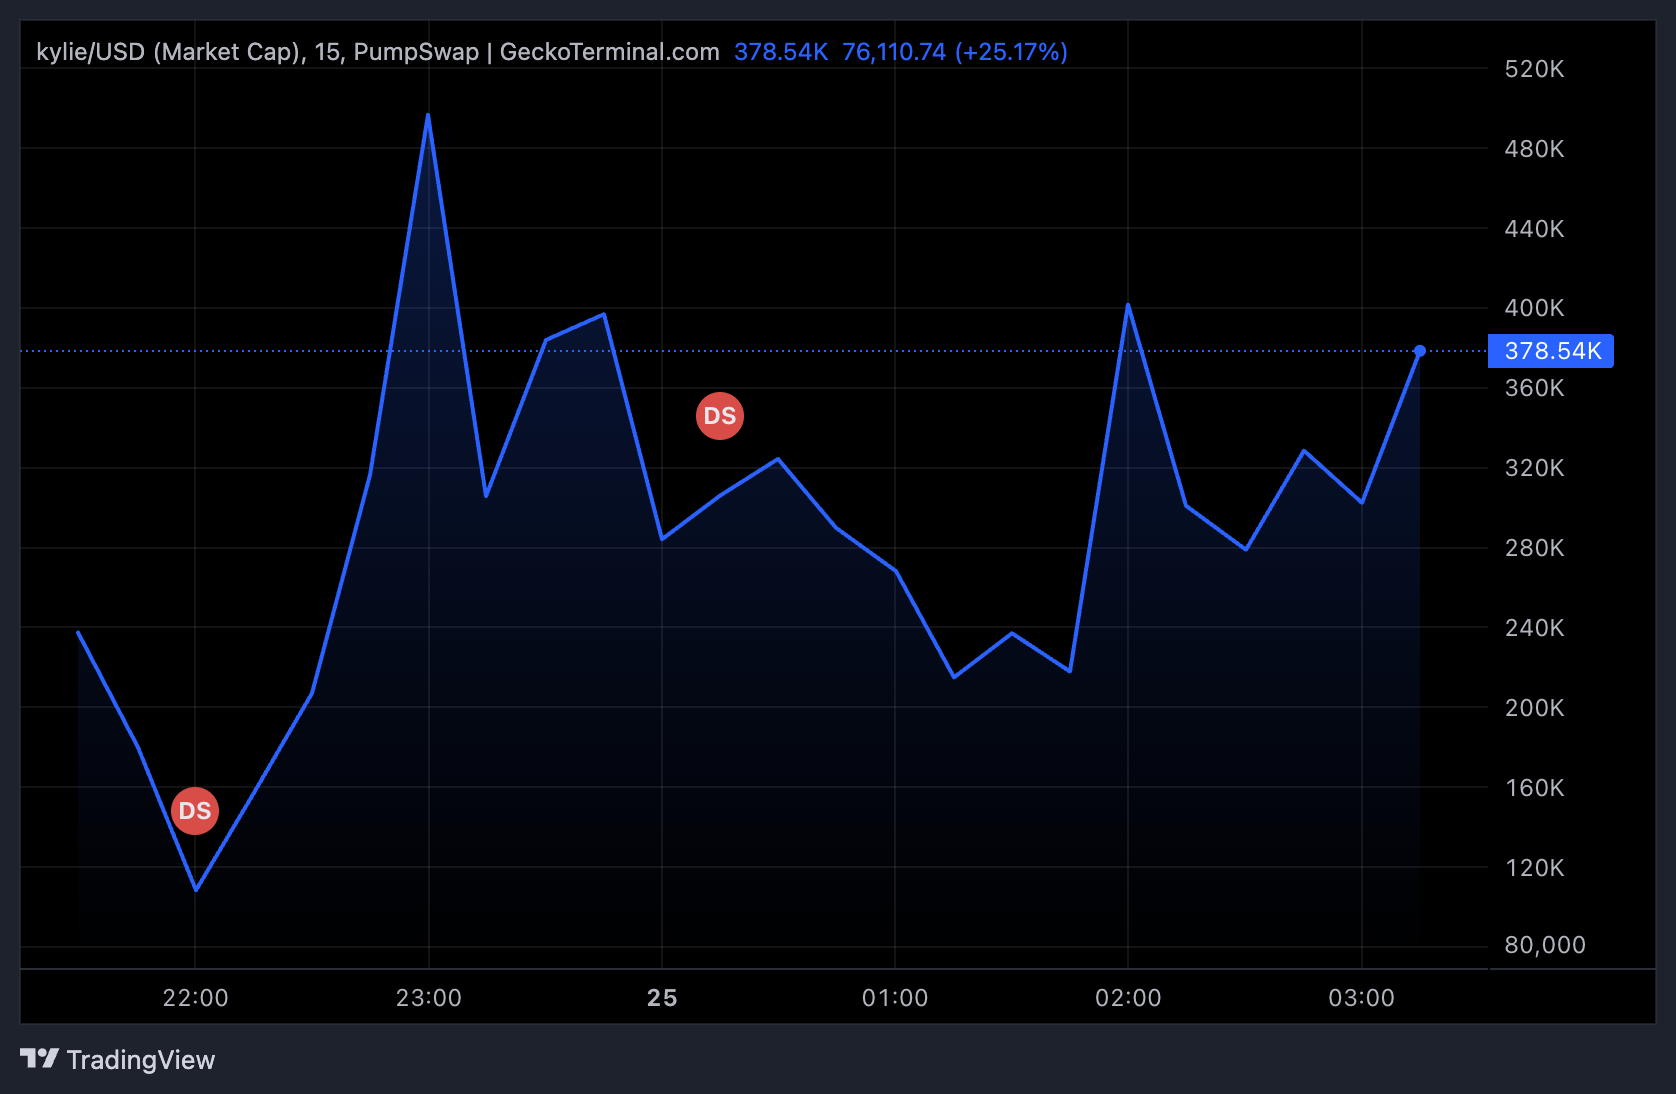
Kylie Jenner’s X account was reportedly hacked and used to promote a meme coin called kylie. The token’s market capitalization peaked at nearly $1.19 million before falling by roughly 68%.
The posts no longer appear on the account, which has 39.5 million followers. Several other kylie tokens are now trading on the Solana (SOL) network, each only a few hours old.
Deleted Posts Sent kylie Token Past $1 Million
The account first posted a casual message about trading, then pointed followers to a Pump.fun profile named cutekjenner. A second post carried the ticker and a contract address.
Follow us on X to get the latest news as it happens
The two posts drew roughly 50,000 and 33,000 views before deletion. Community accounts flagged the abrupt tone as a sign of compromise.
The token climbed to a $1.19 million market capitalization on PumpSwap, according to GeckoTerminal data.
At press time, its market cap stood near $378,500, with $6.1 million in 24-hour trading volume. Liquidity now sits near $58,900, held by roughly 3,700 holders.

Account Hacks Keep Turning Into Meme Coin Rug Pulls
The deleted posts left a trail of imitators behind them. Traders have minted a cluster of rival Kylie-themed tokens on Solana, most of them worth very little.
One rival kylie token, carrying the same profile image, reached a $1.04 million market cap on $6.72 million in trading volume. Others sit between $29,800 and $370,300. None had traded for longer than seven hours at the time of writing.

The playbook mirrors recent takeovers. Attackers used the SpaceX and Starlink accounts in July to push SCATMAN, netting around $125,000.
In late July, Robinhood CEO Vlad Tenev’s account was compromised, and the attacker cleared roughly $1.2 million through Vladhood.
Senator Cynthia Lummis’ compromised account then promoted a fake USA token, while actor Dean Norris disowned a DEAN coin in January 2025.
Subscribe to our YouTube channel to watch leaders and journalists provide expert insights
The post Kylie Jenner's X Account Reportedly Hacked to Push Meme Coin That Crashed 68% appeared first on BeInCrypto.

Strive, the Nasdaq-listed firm known for a corporate Bitcoin treasury program, bought 1,110 Bitcoin for roughly $81.5 million in the week of Aug. 17–Aug. 21, according to a filing with the US Securities and Exchange Commission. The purchases brought its total holdings to 21,356 BTC.
In the same filing, Strive said it paid an average of $73,409 per Bitcoin (including fees and expenses) for the tranche acquired during that period. Cash and cash equivalents increased by $17.1 million to $171.9 million, while its Class A shares outstanding rose by 3.65 million to 79.89 million.
Key takeaways
- Strive added 1,110 BTC between Aug. 17 and Aug. 21, lifting total holdings to 21,356 BTC.
- The company’s average purchase price was $73,409 per BTC (with fees/expenses), versus Bitcoin trading near the $79,000 level on Monday.
- Strive’s latest buying strengthens its position among public corporate Bitcoin holders, moving it into the top tier tracked by BitcoinTreasuries.NET.
- Strive also reported improvements in liquidity (cash up $17.1 million) alongside share growth during the same reporting window.
- Separately, Strive’s SATA preferred shares returned to the company’s $99–$101 target range after trading near $83.30 in late June.
Another tranche adds to Strive’s corporate Bitcoin stack
The latest treasury update underscores how Strive continues to pursue a steady acquisition cadence. The SEC filing details that Strive paid $73,409 per BTC on average for the 1,110 coins purchased between Aug. 17 and Aug. 21.
That average cost was below the approximate $79,000 Bitcoin price level referenced on Monday in the company’s disclosure context, meaning the new buys were made at a discount to the market price at the start of the week. While the filing does not frame the transactions as a hedging strategy, investors generally focus on the relationship between treasury purchase prices and the prevailing spot market as a signal of how aggressively a company is adding during different market regimes.
BitcoinTreasuries.NET ranks Strive among the largest publicly traded corporate holders. Based on that site’s data, Strive moved to the seventh-largest position behind Bullish and ahead of SpaceX.
Why investors track Strive alongside its asset management business
Strive’s corporate treasury is only one part of its broader footprint. The company operates a Bitcoin-focused treasury strategy alongside an asset management business that, according to its own overview page, manages nearly $3 billion across exchange-traded funds and a direct-indexing platform.
The combination matters because it ties the company’s market positioning to both Bitcoin holdings and recurring business activity in capital markets products. For public-market investors, that dual exposure can influence how the equity trades: sentiment about corporate Bitcoin accumulation can amplify interest, while performance expectations for the asset management segment can affect overall valuation.
In addition to Bitcoin, Strive reported holding 505,000 shares of Strategy’s STRC preferred stock valued at $48.6 million as of Aug. 21, reflecting the cross-ecosystem nature of corporate Bitcoin finance. The disclosure also offers a reminder that corporate Bitcoin holders often maintain diversified positions across preferred structures, not just spot-equivalent BTC exposure.
SATA preferred shares return to the $100 target band
Beyond Bitcoin purchases, Strive’s filing and market commentary also draw attention to SATA, the company’s variable-rate perpetual preferred stock. SATA closed at $100.01 on Friday, returning to management’s targeted $99-to-$101 trading range after having fallen as low as $83.30 in late June.
Strive previously narrowed the trading range from $95–$105 to $99–$101 in March. The company also stated that it would not issue SATA through at-the-market or follow-on offerings below $100, a term designed to limit dilution at lower price levels and to support the intended trading band.
The instrument launched in November 2025, initially selling 2 million shares at $80 each for $160 million in gross proceeds. SATA’s structure includes a stated amount and an initial liquidation preference of $100 per share.
Operationally, Strive positions SATA as an income-oriented product, with a variable dividend rate intended to help keep the shares near $100. In April, the firm raised the annualized dividend rate to 13% and began switching from monthly to daily dividend payments starting June 16, per Strive’s SEC filings.
On Monday, SATA performance suggested renewed stability after a period of weakness. That pattern is important for investors who treat preferred shares differently from common stock: preferreds typically attract buyers seeking income characteristics, but their market price still depends on interest-rate mechanics, dividend expectations, and confidence that the issuer will maintain the design guardrails.
Cross-comparison with Strategy’s STRC and its BTC pause
Because SATA is similar to STRC, the variable-rate perpetual preferred stock issued by Strategy, many traders compare their pricing and dividend behavior. Strategy’s STRC was trading near $97 on Monday, below Strategy’s $100 target, while Strategy reported no Bitcoin purchases for the week ended Aug. 23, according to earlier coverage.
That contrast highlights a potential asymmetry in corporate accumulation behavior: Strive continued buying into the Aug. 17–Aug. 21 window, while Strategy’s most recently reported week showed no purchases. Even without making assumptions about future timing, investors typically watch for whether pause periods broaden or remain temporary—especially because accumulation schedules can affect how markets price treasury companies’ future cash flows, dividend capacity, and balance-sheet momentum.
Strive’s SATA returning toward its target band adds another layer to those comparisons. When preferred instruments track toward their $100 reference points, it may reinforce confidence in the issuer’s dividend-setting framework, even as the underlying Bitcoin market fluctuates.
Looking ahead, investors should monitor two things closely: whether Strive’s BTC purchasing pace continues across the next reporting windows, and whether SATA sustains its return to the $99–$101 band as dividend mechanics respond to broader market conditions. The next few filings should also clarify if corporate accumulation and preferred-share stabilization remain aligned—or diverge.


BNB Smart Chain (BSC) activated its Pasteur hard fork on Tuesday, closing bridge verification and validator authorization gaps while introducing a new route intended to fit more transactions into each block.
In a Tuesday post, BNB Chain confirmed that Pasteur was live on the BSC mainnet. The team said the upgrade strengthens the network’s bridge, staking and governance security while giving blocks more capacity without changing its 450-millisecond block time.
The upgrade combines three BNB Evolution Proposals. BEP-682 rejects duplicate validator entries during cross-chain light-block verification, while BEP-695 tightens controls involving validator key rotation, slashing and governance voting. Furthermore, BEP-675 changes how specialist builders submit blocks to validators.
The upgrade prevents validators from being counted more than once in bridge approvals, removes authority from old validator keys and blocks restricted addresses from voting, while aiming to fit more transactions into blocks during busy periods.
Pasteur targets fuller blocks
Under BSC’s previous block-building route, a builder executed transactions before submitting a proposed block, and the validator executed them again before signing it. BNB Chain said the repeated work took time away from builders operating within the network’s 450-millisecond block window, sometimes leaving blocks underfilled.
BEP-675 allows builders to submit blocks they have already executed. Validators check the proposed block against consensus rules, sign and broadcast it, then complete full execution verification afterward. Builders can also continue using the previous route, under which validators execute transactions before signing.
Related: BNB Chain pursues legal action after ex-employee’s memecoin launch
In tests conducted on QANet, an internal environment designed to mirror BSC’s geographically distributed validators, the new route increased throughput by about 88%, from 1,237 to 2,324 transactions per second. Average gas used per block rose from 46.35 million to 84.15 million while the block interval and 100-million gas limit remained unchanged.
BNB Chain cautioned that the figures came from a controlled test workload and were not mainnet measurements.
Pasteur follows previous upgrades centered on reducing block times. BSC’s Maxwell hard fork reduced its average block time from 1.5 seconds to about 0.8 seconds in June 2025, while BNB Chain said the subsequent Fermi upgrade brought it down to 450 milliseconds.
Magazine: MiCA cracks down on USDT in Europe… but no one else cares


Blockchain Association asked five U.S. agencies to clarify that customer identification requirements under the GENIUS Act apply to direct issuer relationships, not independent peer-to-peer stablecoin transactions.
Summary
- Blockchain Association supports primary-market identity checks but opposes extending them to peer-to-peer stablecoin transfers downstream.
- Five federal agencies proposed joint identification standards for permitted payment stablecoin issuers in June 2026.
- Issuers would collect names, addresses, birth or formation dates and identification numbers from customers directly.
- Final rules would take effect twelve months after issuance under agencies’ proposed compliance timeline currently.
- GENIUS Act generally begins restricting unlicensed U.S. payment stablecoin issuance on January 18, 2027, nationwide.
The industry group filed its comments by the Aug. 21 deadline and summarized its position on Aug. 24. It supported the proposal’s main approach but requested clearer definitions, less duplicated compliance work and explicit flexibility for digital identity tools.
FinCEN, the Office of the Comptroller of the Currency, Federal Reserve, Federal Deposit Insurance Corporation and National Credit Union Administration jointly proposed the customer identification program in June.
Stablecoin identity checks focus on direct customers
The proposed rule would require a permitted payment stablecoin issuer to establish a written, risk-based customer identification program. The program would form part of the issuer’s wider anti-money laundering and counterterrorist financing controls.
An issuer would generally collect a customer’s name, address, date of birth or formation and identification number before opening an account. It would then use documentary or non-documentary methods to form a reasonable belief that it knows the customer’s identity.
Records containing the identification information would generally remain on file for five years after the account closes. Verification records would remain available for five years after their creation.
As previously reported, U.S. regulators proposed bank-style identification requirements for stablecoin issuers. The proposal follows the GENIUS Act’s decision to treat permitted issuers as financial institutions under the Bank Secrecy Act.
Blockchain Association wants a firm P2P boundary
Blockchain Association agreed that the program should apply when an issuer maintains a direct customer relationship. Examples include issuing, redeeming, converting, repurchasing or providing custody for a payment stablecoin.
The organization said the rule should not reach transactions between users when the issuer does not intermediate, facilitate or approve them.
“They should not extend to downstream, peer-to-peer stablecoin transactions,” the Association argued, although agencies have not finalized that boundary.
The agencies’ proposal largely follows that position. It says simply owning or controlling an issuer’s stablecoin does not establish an account. A transfer involving an issuer only through its smart contract would also generally fall outside the proposed definition.
The proposal calls these interactions secondary-market activity. Examples include transfers from self-hosted wallets, purchases from intermediaries, exchange trades and direct payments to vendors.
The agencies estimated that approximately 99% of stablecoin transaction activity occurs in secondary markets. They acknowledged that issuers have limited ability to obtain identities for people using tokens without interacting with them directly.
Digital identity and duplicate checks remain contested
Blockchain Association also asked regulators to preserve flexibility in how issuers collect and verify information. It specifically supported digital identity tools and interoperable verification technology.
The proposal already permits documentary and non-documentary verification. It asks whether the final text should explicitly address digital identities or verifiable credentials and seeks feedback about their benefits and risks.
The group also requested protection against duplicative compliance obligations. Stablecoin issuers frequently interact with banks, exchanges and other regulated institutions that already conduct customer checks.
Under the proposed rule, an issuer could rely on certain work performed by another federally regulated financial institution. That reliance must be reasonable, governed by a contract and supported by annual certification. The issuer would remain responsible for compliance.
Blockchain Association wants the final rule to clarify how this arrangement works across affiliates, intermediaries and state-regulated entities.
Agencies must now complete the GENIUS Act rules
The public comment period closed Aug. 21. Regulators will now review submissions and may modify the definitions of “account,” “customer” and “digital asset service provider” before issuing a final rule.
The proposal gives issuers 12 months after the final rule’s publication to comply. No final publication date has been announced.
The wider GENIUS Act framework is expected to begin restricting unlicensed payment stablecoin issuance in the U.S. on Jan. 18, 2027. In related coverage, regulators missed the law’s original rulemaking deadline, shortening the preparation period available before the licensing framework begins.
The final customer identification rule must still operate alongside separate proposals covering licensing, reserves, anti-money laundering programs, sanctions compliance and lawful orders. The treatment of direct redemptions, digital credentials and reliance on third parties will determine how much additional work issuers face.

Ethereum saw one of its biggest weekly moves in years after staging an impressive 30% rally. The altcoin crossed $2,500 briefly, then slipped back slightly below that level.
New data shared by crypto analyst Ali Martinez suggests that ETH could be on a path toward $5,000 if it clears a major resistance zone.
Growing Buying Pressure
On August 19, Ethereum’s MVRV Ratio formed a golden cross above its 160-day moving average. Martinez also pointed to stronger whale accumulation. The number of addresses holding more than 10,000 ETH has increased by 1.74%. In fact, 17 new whale addresses joined the network over the past week.
At the same time, the token supply is moving off exchanges. More than 180,764 ETH, which is worth about $440 million, has been withdrawn over the past week. Martinez said the trend supports the case for increasing buying pressure.
However, it still faces a major resistance zone between $2,722 and $2,970. URPD data shows that 16.70 million were previously acquired within this range, which makes it a major supply wall. If Ethereum breaks through the zone, the next major MVRV Pricing Band is near $5,363, at the 2.4 level. The analysts also noted that a rejection could first send the altcoin back toward the Realized Price near $2,235 before a potential move toward the 2.4 MVRV band.
Besides, Ethereum has once again reached its 200-week moving average, which happens to be the 11th such instance over the past five years, ‘The Long Investor’ found, who pointed to a repeated pattern in the crypto asset’s price history. Each time it has moved below the 200 WMA, it has later returned to the moving average.
The analyst therefore called any percentage below the level “free money” and said investors cannot lose.
Additionally, ETH’s 50-week and 200-week moving averages are now at the same level. This creates a confluence zone. If the asset turns that level into support, the analyst expects bulls to take it back to its all-time highs. ETH remains a buy.
ETFs Draw Fresh Capital
US spot Ethereum ETFs have attracted their biggest inflows since October 2025, as demand picked up sharply during the mid-week. Net inflows stood at $30.85 million on Monday and $71.47 million on Tuesday. The pace increased after Wednesday’s announcement from the US Treasury Department. The department said it would double the maximum size of liquidity-support buybacks for longer-dated government debt, lifting them from $2 billion to at least $4 billion per operation. Wednesday recorded a capital influx of $189.15 million.
The figure rose again to $220.77 million on Thursday, while Friday recorded another strong $185 million in net inflows.
The post $5,000 Ethereum? Analyst Identifies the Levels That Could Decide ETH’s Next Move appeared first on CryptoPotato.
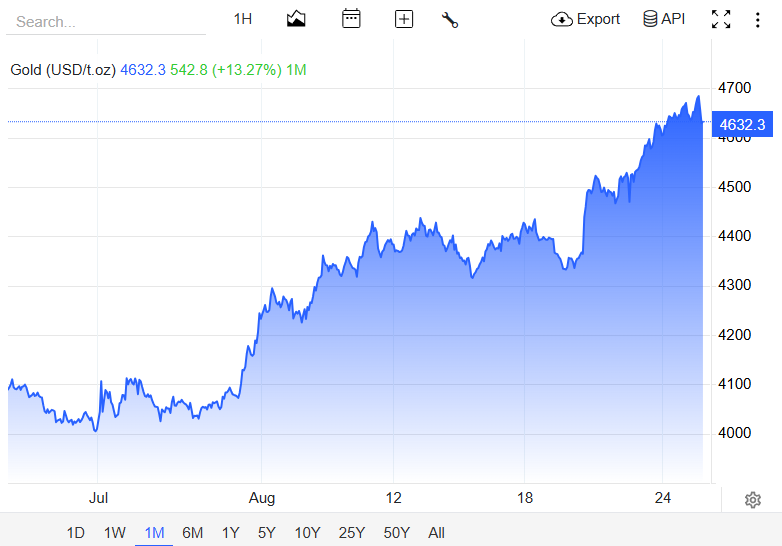
Bitcoin (BTC) climbed as high as $81,165 on Tuesday before easing to $80,792, up 4.5% in 24 hours, as gold pushed to its highest price in more than three months. Both assets are climbing on the same forces.
A weakening US dollar and falling bond yields are pulling money into both gold and Bitcoin at the same time. Investors are also watching for signals on where interest rates head next.
Gold Extends Its Rally Toward a 27-Year High
Spot gold gained 0.6% to $4,677.19 per ounce on Tuesday, its best level since mid-May, with the metal up around 13% so far this month. Gold futures also touched a three-month high near $4,720.

UOB analysts pegged the move as gold’s best monthly performance since 1999, based on data cited in the report. The last comparable monthly surge came in September 1999, when a group of European central banks agreed to cap their gold sales, ending a prolonged slide in prices.
This month’s rally has a different driver, with investors reacting to a weaker dollar and renewed concern over Fed independence rather than a central bank supply shock.
The Dollar and Yields Are Doing the Heavy Lifting
The US Dollar Index has fallen 0.8% this month, making dollar-priced gold cheaper for foreign buyers. Treasury yields have stayed elevated through most of August, but the government’s bond buyback plan has kept them roughly 3 basis points lower for the month, easing the opportunity cost of holding non-yielding bullion.
Bitcoin has moved in a similar direction. The asset briefly lost the $80,000 level last week as critics questioned the same Treasury buyback plan, before reclaiming it and pushing higher. A Strive executive recently pointed to Bitcoin’s breakout against gold as evidence the asset’s bear market has ended.

All eyes are now on Federal Reserve Chair Kevin Warsh, who speaks ahead of this week’s Jackson Hole symposium, an annual central bank gathering where officials often signal future policy direction.
A hawkish tone could stall both rallies. Citi analysts said a dovish surprise would instead push markets to refocus on the “debasement trade,” reflecting renewed concerns over Fed independence and US debt sustainability.
Bitcoin’s reaction to this week’s Fed signals remains an open question, given the asset’s history of diverging from traditional safe havens even when the macro setup looks aligned. Both markets are now pricing similar risks.
A softer dollar and capped yields have driven the rally so far, and the Fed’s next move could decide whether it extends or stalls.
The post Bitcoin Tops $81,000 as Gold Notches Its Best Month Since 1999 appeared first on BeInCrypto.
Why Andy Burnham’s plan to get rough sleepers inside this winter makes sense

Sebi drops Rs 3,912 crore probe against Max Financial, Axis Bank over disclosure lapses
Bitcoin Smashes $80K as $260M in Shorts Get Wiped Out: Here Are the Next Targets





-

 Fashion3 days ago
Weekend Open Thread: Madewell – Corporette.com
-

 Business3 days ago
Musk’s Tesla, SpaceX Confirm $16.8 Billion ‘Terafab’ Chip Plant as World’s Largest Building in Texas
-

 Crypto World3 days ago
anatomy of crypto’s biggest liquidation event since 2021
-

 Business7 days ago
SMA Solar Technology AG (SMTGY) Q2 2026 Earnings Call Transcript
-

 Politics3 days ago
6 months on, Irish renters crushed by effects of government housing bill
-
 NewsBeat3 days ago
The ‘Lucky Dip Gang’ causing carnage for clicks: After five thugs were killed speeding in the wrong direction on a motorway, GUY ADAMS investigates a sick new trend… and why police aren’t even allowed to pursue them
-

 Tech6 days ago
GLM-5.3 hits the API at $1.4/$4.4 per million tokens
-

 News Videos5 days ago
Don’t Leave Your Financial Future To Chance | August 19, 2026
-

 Business2 days ago
Mystery AI Model ‘Ox Alpha’ Draws Developers With Free Access as Chinese Lab Origins Remain Debated
-

 Tech7 days ago
Keychron K8 Ultra 8K review: a great value keyboard with comfort issues
-

 Business4 days ago
Five Below: Kids Discount Retailer Reaps Rich Rewards
-

 Business7 days ago
Stock Market Today: Tech Futures Slide As Treasury Yields Jump; Nvidia, Micron, Sandisk Sell Off
-

 Business5 days ago
Marvell Shares Jump 7% as Google Chip Deal Confirms Custom AI Silicon Partnership, Analysts
-

 Tech7 days ago
Ken Okuyama’s Kode89 Supercar Features Three Pedals and a Choice of V12s
-

 Politics7 days ago
The House Opinion Article | Security means more than military spending
-
 Business7 days ago
Walmart, Target, Home Depot, Housing, Fed Minutes, and More
-

 Crypto World7 days ago
Compound approves $52M institutional DeFi program
-

 Politics7 days ago
Ricky Gervais Denies ‘Snubbing’ BBC’s The Office Anniversary Special
-

 Sports2 days ago
Deshaun Watson fires back at Browns fans after being booed: ‘It’s a disrespectful thing’
-

 Tech7 days ago
Lock It Up: Android 17’s Latest QPR2 Beta Introduces a Built-In App Lock
You must be logged in to post a comment Login