
Crypto World
What Is cross-margining in crypto trading?



Cross-margining lets your whole account balance backstop every open trade, so a winning position can keep a losing one alive. It is more capital-efficient than isolated margin, and it can also wipe out your entire account in one bad move. Here is how it works.
Summary
- Cross-margining is a margin mode in which all the funds in your account act as shared collateral for all your open positions, so gains and spare equity in one position can support a losing one.
- It contrasts with isolated margin, where a fixed amount of collateral is locked to each position and losses are capped to that amount.
- Cross margin is more capital-efficient and can delay liquidation, but it puts your entire account at risk, because a large enough loss can be covered from the whole balance and trigger a portfolio-wide liquidation.
- Traders generally use cross margin for hedged, offsetting, or core positions, and isolated margin for speculative, high-risk, or single bets where they want a hard loss cap.
- The same principle scales to institutions, where prime brokers cross-margin positions across entire asset classes, using assets like stablecoins as shared collateral.
Cross-margining is a way of managing collateral in leveraged trading where your entire account balance backs all of your open positions at once, instead of each trade standing on its own. In practice, that means the profit or spare equity in one position can be used to support another that is losing, which can keep trades alive through volatility. The trade-off is that your whole account is exposed: a large enough loss draws on the entire balance and can liquidate everything. Cross margin is one of the two main margin modes offered on crypto trading platforms, the other being isolated margin, and understanding the difference is essential to managing risk. This explainer covers how margin trading works, how cross and isolated margin differ, a worked example, the pros and cons, and how the same idea operates at the institutional level.
Margin trading basics: leverage, collateral, liquidation
Cross-margining only makes sense once the basics of margin trading are clear. Margin trading means borrowing funds to open a position larger than your own cash balance would allow. The money you put up is the margin, and it serves as collateral for the borrowed funds. Leverage describes how much larger your position is than your own capital: at five-to-one leverage, a trader controls a position five times the size of their margin. Leverage amplifies everything, so both gains and losses grow in proportion to the position size instead of the smaller amount of capital actually committed.
Two thresholds govern a margin position. The initial margin is the collateral required to open the position. The maintenance margin is the minimum equity that must be kept to hold it open. As long as the position’s equity stays above the maintenance margin, the trade continues. If the market moves against the position enough that equity falls below the maintenance margin, the platform issues a margin call or, more commonly in crypto, moves straight to liquidation.
Liquidation is the forced closure of a position when its equity drops below the maintenance requirement. The platform’s liquidation engine closes the position at market prices, sometimes in partial steps, to prevent the account from going negative. Because leverage magnifies losses, liquidation can happen fast: at high leverage, a small adverse price move can wipe out the margin buffer entirely. This is the central risk of all margin trading, and the choice between cross and isolated margin is fundamentally a choice about how liquidation is calculated and how much of your account is exposed to it.
Cross margin versus isolated margin: the core difference
The two margin modes differ in one crucial respect: what pool of collateral backs each position. In cross margin, all the funds in your account form a single shared pool that backs every open position together. Unrealized profits and spare equity from one position can flow to support another that is drawing down, which can delay or prevent the liquidation of the losing trade. The account is managed as one book, and liquidation becomes a portfolio-level event that depends on the combined equity of everything you hold.
In isolated margin, collateral is ring-fenced to each position individually. You decide how much of your funds to assign to a specific trade, and that amount is the maximum you can lose on it. If the position is liquidated, only its allocated collateral is lost, and the rest of your account, including your other positions, is untouched. Isolated margin gives you a predictable, per-trade liquidation price and a hard cap on the damage any single idea can do, at the cost of not being able to draw on the rest of your balance to save a position.
The consequence is a clear trade-off between capital efficiency and risk containment. Cross margin uses your capital more efficiently, because idle equity and winning positions automatically backstop losing ones, and it tends to produce fewer forced liquidations on individual legs. But it places your entire account on the line, since a bad enough move can consume the whole balance. Isolated margin sacrifices efficiency for control: each position is walled off, so a single blow-up cannot spread, but you must actively manage collateral and accept more frequent single-position liquidations. Neither is inherently better; the right mode depends on the strategy.
A worked example
A concrete example makes the difference tangible. Imagine a trader with a $15,000 account who wants to open a leveraged long position on Bitcoin with an initial margin requirement of $5,000. Under cross margin, the entire $15,000 backs the position, giving a $10,000 buffer above the initial requirement. That large cushion makes liquidation far less likely on a normal pullback, because the whole account absorbs the drawdown. If the trader also holds other positions, profits on those can further support the Bitcoin trade. The catch is that if the combined account equity falls below the maintenance level, the liquidation engine can close positions and consume the full $15,000, not just a slice of it.
Now run the same trade under isolated margin. The trader allocates exactly $5,000 to the Bitcoin position and no more. If Bitcoin falls and the position is liquidated, the maximum loss is that $5,000, and the remaining $10,000 in the account is safe, available for other trades or simply preserved. The liquidation price is predictable and tied only to that position’s collateral. The downside is that the position has a much thinner buffer, so it will be liquidated sooner than the cross-margined version, since it cannot draw on the rest of the account to survive a dip.
The example shows the core tension. Cross margin gave the Bitcoin trade a bigger cushion and a better chance of surviving volatility, but it risked the entire $15,000. Isolated margin capped the loss at $5,000 but liquidated the position more readily. A trader who is confident and wants staying power, and who is comfortable risking the whole account, leans cross. A trader who wants a firm loss limit on a specific, uncertain bet leans isolated. The same $15,000 produces very different risk profiles depending on the mode chosen.
The pros and cons of cross-margining
Cross-margining has real advantages that explain its popularity among active and professional traders. Its main strength is capital efficiency: because all equity backs all positions, none of your capital sits idle behind a single trade, and winning positions automatically support losing ones. This produces a smoother equity curve and fewer forced exits on individual legs, which is especially valuable for hedged or offsetting strategies where one position is meant to counterbalance another. It is also simpler to monitor in one sense, since you watch a single account-level margin level instead of tracking collateral on many separate positions.
The disadvantages are equally real and more dangerous if ignored. The defining risk is that your entire account is exposed: once combined equity falls below the maintenance margin, liquidation can consume the whole balance, not a contained portion. This becomes acute when positions are correlated, which is common in crypto, where many assets move together. In a sharp, broad sell-off, several cross-margined positions can lose at once, draining account equity rapidly and triggering a cascade of liquidations across the book. A single violent move can therefore wipe out everything, where isolated margin would have contained the damage.
Cross margin also carries a psychological hazard. Because the shared pool makes positions feel more resilient, it can tempt traders to over-leverage, opening larger positions than they should because the buffer looks generous. That temptation, combined with the whole-account exposure, is how traders turn a manageable loss into a total one. The mode rewards discipline and punishes its absence. Used carefully within a hedged framework, cross margin is efficient and forgiving of ordinary volatility; used carelessly with correlated, over-leveraged bets, it is the fastest route to a blown-up account.
When to use cross versus isolated
The choice between the modes should follow the strategy rather than habit. Cross margin fits situations where positions offset or support one another. Hedging programs, basis trades, pairs trades, and market-making all benefit from a shared collateral pool, because a gain on one leg naturally cushions a loss on another, and pooling the collateral reduces the chance of an unnecessary single-leg liquidation. Core positions that a trader intends to hold through volatility also suit cross margin, since the deeper buffer provides staying power. In these cases, the whole-account exposure is an acceptable trade for the efficiency and resilience gained.
Isolated margin fits the opposite situations. Speculative, event-driven, or high-volatility bets, and single-ticket trades where the outcome is uncertain, are better ring-fenced, so that if the idea fails it cannot damage the rest of the account. A trader taking a focused shot on a volatile small-cap token, for instance, can cap the loss at a fixed amount and sleep easily knowing the rest of the balance is safe. Isolated margin also suits newer traders building discipline, because it enforces a hard maximum loss per trade and makes the risk of each position explicit.
Many experienced traders combine both in a core-satellite structure. They run cross margin on a core book of hedged or offsetting positions that benefit from pooled equity, while keeping speculative satellite trades in isolated buckets with fixed loss caps. This keeps the core capital-efficient without letting a single high-risk bet sink the whole account. The practical rule is to match the mode to the intent of each trade: shared exposure for positions designed to work together, walled-off exposure for standalone bets you want to contain. Some platforms even offer a smart cross margin that nets opposite-direction positions across products, further improving efficiency for hedged books.
Cross-margining at the institutional level
The same principle that governs a retail trader’s account scales all the way up to the largest institutions, and it is worth seeing the connection. When a hedge fund or trading firm operates through a prime broker, the broker cross-margins the firm’s positions across entire asset classes, netting exposures in digital assets, foreign exchange, derivatives, and fixed income so the firm posts collateral against the combined risk of its whole book rather than each position separately. This is cross-margining as a foundation of professional trading, and it is a major reason institutions value prime brokers: it frees up enormous amounts of capital that would otherwise sit idle.
Crypto has begun importing this institutional version. Prime brokers serving digital assets now let clients cross-margin crypto positions against traditional exposures, and stablecoins have started to play the role of shared collateral in that system. Ripple’s RLUSD, for example, has been positioned as a stablecoin that enables cross-margining between digital assets and traditional markets through institutional prime brokerage, letting a firm post the token as collateral recognized across both worlds. That is the same idea a retail trader meets in a cross-margin account, applied at the scale of institutional portfolios spanning many markets.
Seeing the two levels together clarifies what cross-margining really is: a method for treating a collection of positions as a single risk pool to use capital more efficiently. For a retail trader, the pool is the account balance backing a handful of trades. For an institution, it is a multi-asset book backed by cash and collateral like stablecoins across a prime broker. The mechanics and the stakes differ by orders of magnitude, but the core logic, and the core trade-off between efficiency and concentrated risk is identical.
The risks you must respect
Whatever the level, cross-margining demands respect for a specific set of risks, and ignoring them is how accounts are lost. The first is correlation risk. Crypto assets frequently move together, so a broad sell-off can push multiple cross-margined positions into loss simultaneously, draining shared equity far faster than a single position would. The very diversification that looks like safety can become a synchronized drawdown when markets turn risk-off together, and the shared pool that was meant to cushion individual losses instead absorbs many at once.
The second is liquidation and leverage risk. Because cross margin can make positions feel durable, it invites higher leverage, and higher leverage means a smaller adverse move can breach the maintenance margin. When that happens in cross mode, the liquidation is a portfolio-level event that can close multiple positions and consume the whole account. Flash crashes and liquidation cascades, where forced selling drives prices lower and triggers still more liquidations, are especially dangerous, and thin order books during such events can cause execution at prices far worse than expected. The market has seen sharp, leverage-driven cascades wipe out over-extended traders in minutes.
The disciplined response is to size positions conservatively, avoid over-leverage, and match the margin mode to the trade. Use cross margin for genuinely hedged or core positions where offsetting exposure justifies the shared pool, and isolate speculative or high-beta bets so a single failure cannot spread. Set alerts and plan collateral top-ups in advance instead of reacting during a crash. Cross-margining is a powerful tool for capital efficiency, but it concentrates risk at the account level, and the traders who use it well are the ones who never forget that the whole balance is on the line.
Frequently Asked Questions
What is cross-margining in simple terms?
Cross-margining is a margin mode where all the funds in your trading account act as shared collateral for all your open positions at once. Profits and spare equity from one position can support another that is losing, which can delay liquidation. The trade-off is that your entire account is exposed, so a large enough loss can be covered from the whole balance and liquidate everything.
How is cross margin different from isolated margin?
In cross margin, your whole account balance backs every position, so gains on one can cushion losses on another, but your entire account is at risk. In isolated margin, a fixed amount of collateral is locked to each position, capping the loss on that trade to the allocated amount and protecting the rest of your account. Cross is more efficient; isolated is more contained.
Which is better, cross or isolated margin?
Neither is universally better; it depends on the trade. Cross margin suits hedged, offsetting, or core positions that benefit from a shared collateral pool and staying power. Isolated margin suits speculative, event-driven, or single high-risk bets where you want a hard loss cap. Many traders use both, running cross margin on a core book and isolating speculative satellite trades.
What is the main risk of cross-margining?
The main risk is that your entire account is exposed. Once combined equity falls below the maintenance margin, liquidation can consume the whole balance rather than a contained amount. This is especially dangerous with correlated crypto assets, where a broad sell-off can push several positions into loss at once, draining shared equity quickly and triggering a portfolio-wide liquidation.
Can cross-margining cause bigger losses?
It can, because it puts the full account balance behind your positions. In a sharp, correlated downturn or a flash crash, multiple cross-margined positions can lose simultaneously and a portfolio-level liquidation can wipe out the entire account. Cross margin can also tempt traders to over-leverage because the shared buffer feels generous, which magnifies losses when the market turns.
What is a maintenance margin?
The maintenance margin is the minimum equity you must keep to hold a leveraged position open. As long as equity stays above it, the position continues. If the market moves against you and equity falls below the maintenance margin, the platform liquidates the position. In cross margin, this is calculated at the account level; in isolated margin, it is calculated for each position separately.
Do institutions use cross-margining?
Yes, at large scale. When institutions trade through a prime broker, the broker cross-margins their positions across entire asset classes, netting exposures in digital assets, foreign exchange, derivatives, and fixed income so the firm posts collateral against the combined risk of its whole book. Stablecoins such as RLUSD have started to serve as shared collateral in this institutional cross-margining system.
How can I use cross-margining safely?
Match the mode to the trade: use cross margin for hedged or core positions where offsetting exposure justifies the shared pool, and isolate speculative or high-volatility bets. Size positions conservatively, avoid over-leverage, set liquidation alerts, and plan collateral top-ups in advance. Always remember that in cross mode, your entire account is on the line, so discipline about leverage and position size is essential.
Disclaimer: This article is for information and educational purposes only and does not constitute financial, investment, or trading advice. Margin trading involves a high risk of loss, including the potential loss of your entire account, and is not suitable for all investors. Nothing here is a recommendation to trade or use any strategy. Always do your own research and consider consulting a qualified professional before trading on margin. Information is accurate as of July 2, 2026, and may change.

After several failed attempts to extend its recovery, Ethereum is beginning to show signs of exhaustion beneath the major100-day MA. The latest rejection from this zone has weakened short-term momentum and increases the probability of a broader pullback if key support levels fail to hold.
Ethereum Price Analysis: The Daily Chart
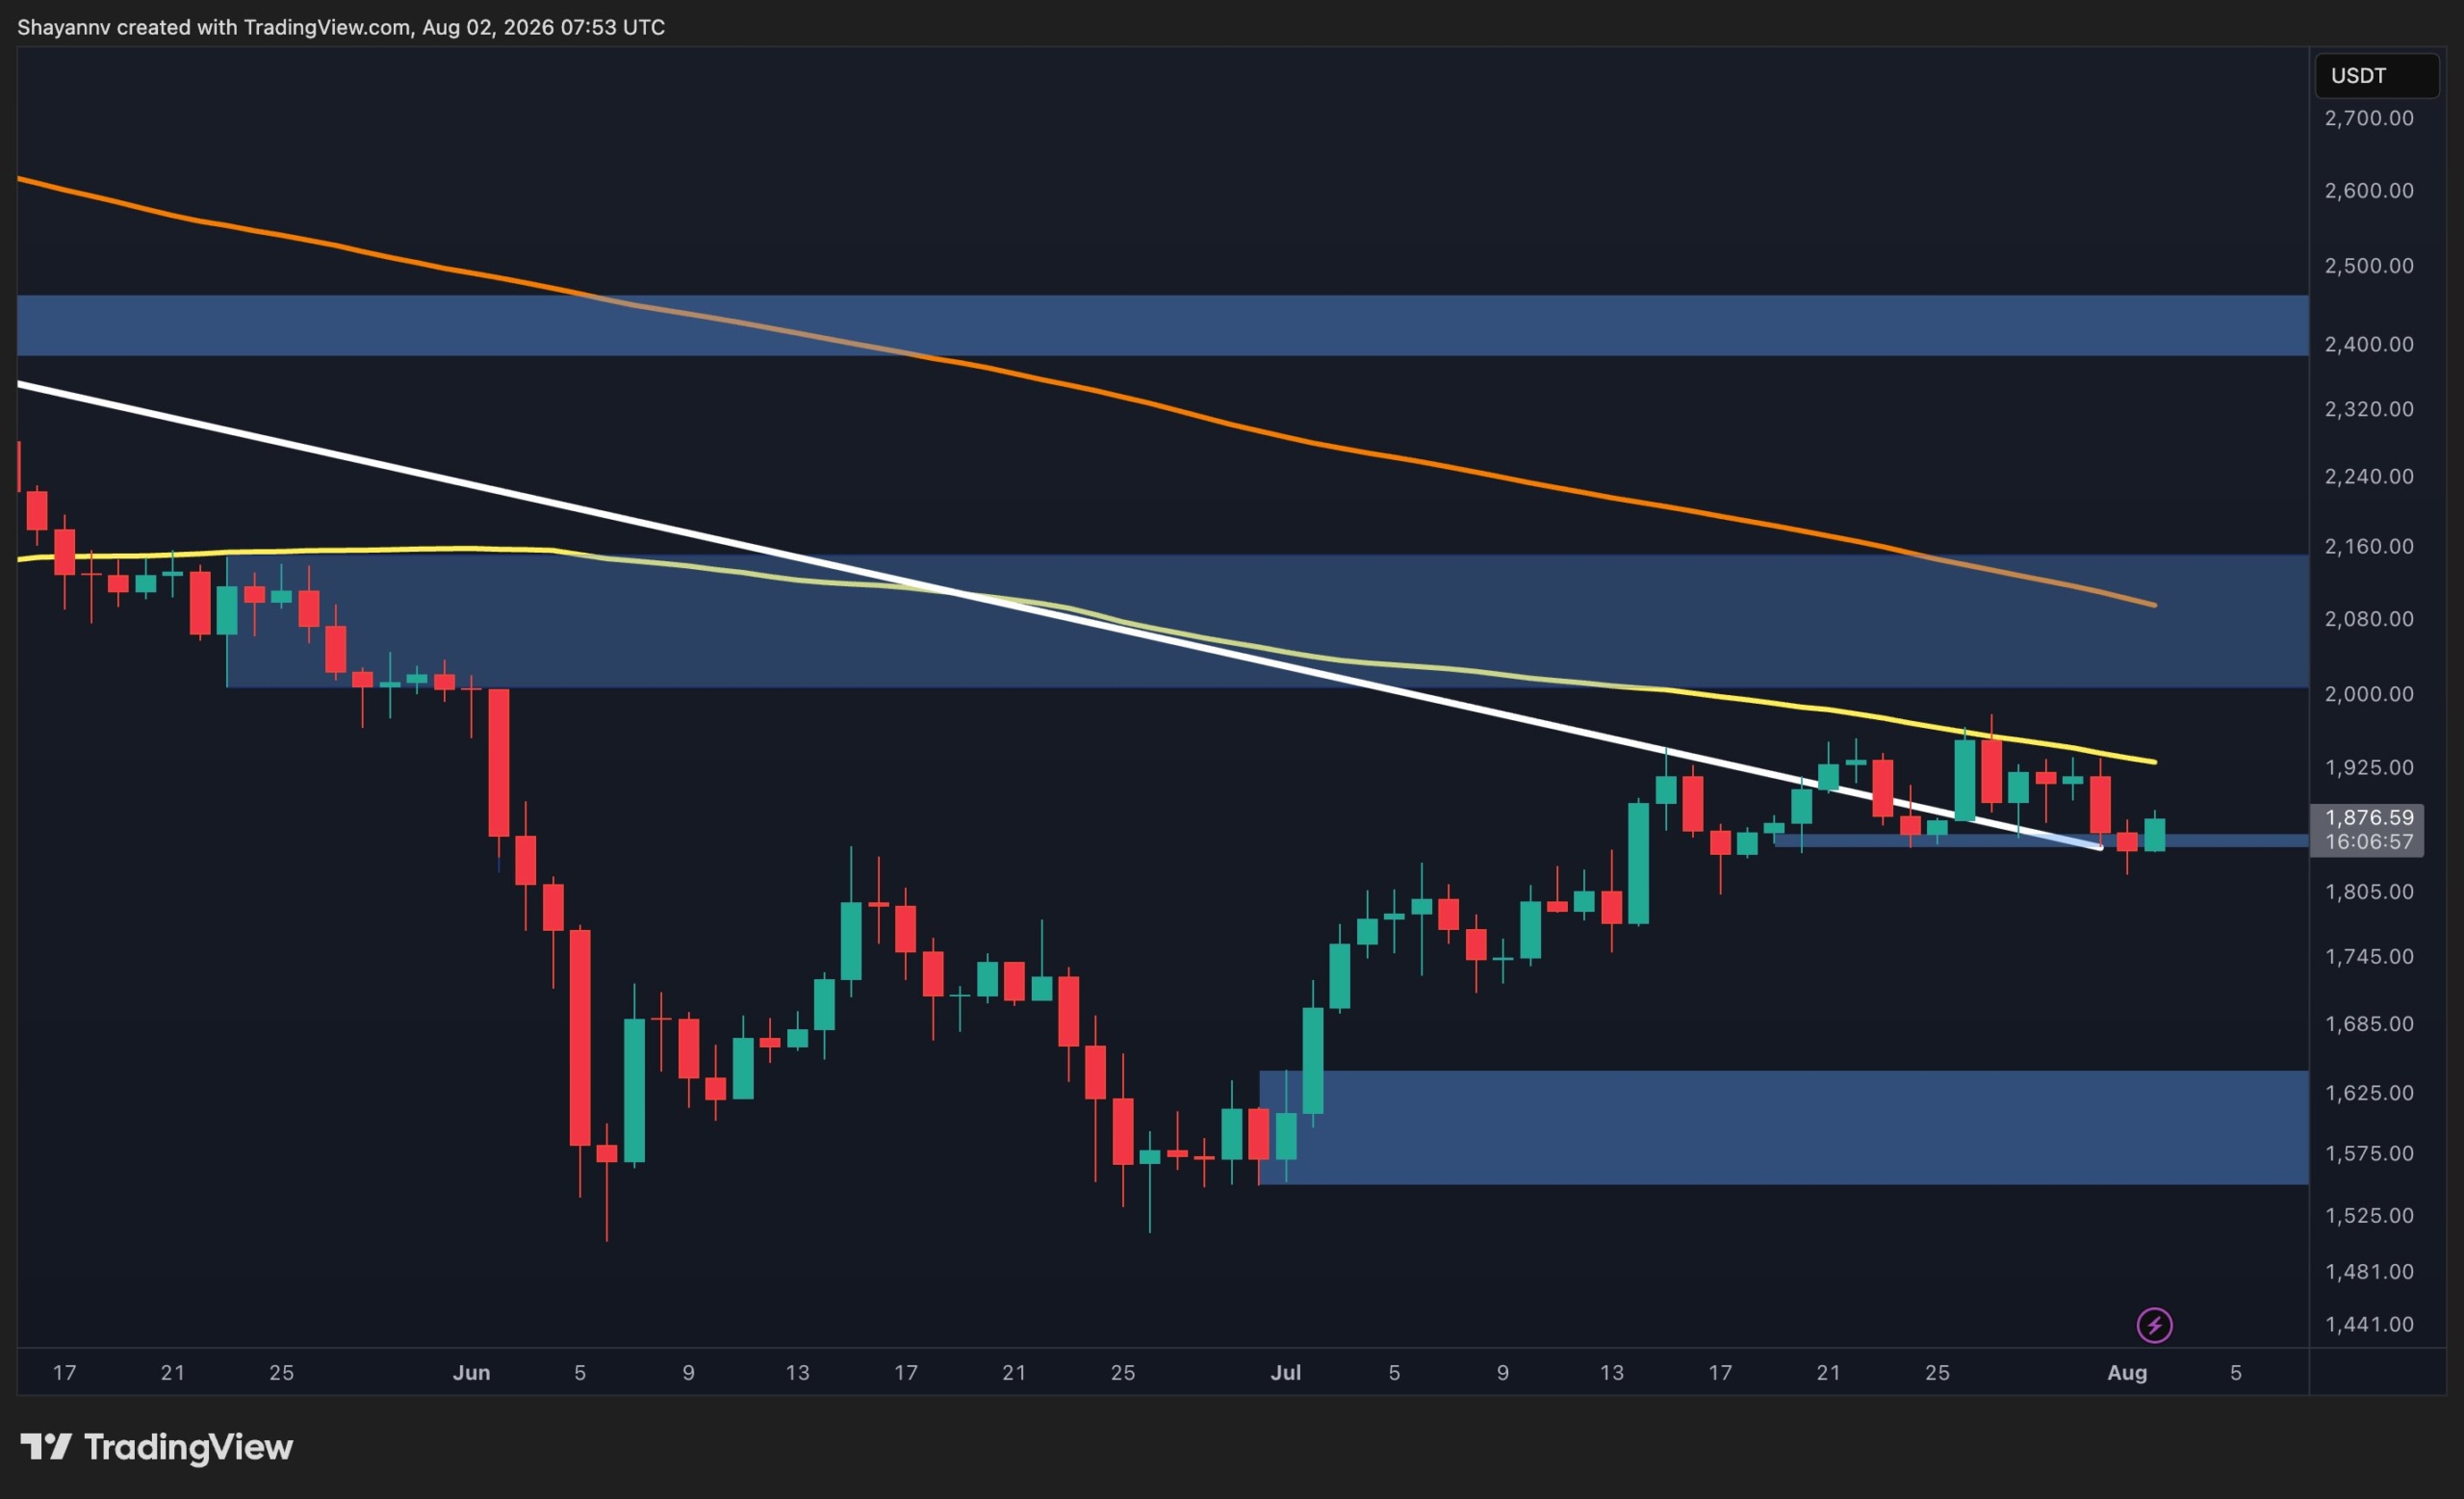
On the daily timeframe, ETH’s outlook is gradually shifting toward a bearish bias after multiple failed attempts to reclaim the 100-day moving average. The repeated rejection from this dynamic resistance around $1.95K, combined with the emergence of bearish daily candles, suggests buyers are losing momentum.
Meanwhile, Ethereum continues to struggle with the descending channel, with the upper boundary represented by the white trendline serving as the most critical support.
If sellers manage to push the price back inside this channel, it would confirm a bearish continuation and likely trigger a deeper decline toward the $1.56K to $1.64K demand zone. On the upside, bulls must first reclaim the $1.88K to $1.91K resistance area before attempting another move toward the 100-day MA near $1.95K.
ETH/USDT 4-Hour Chart
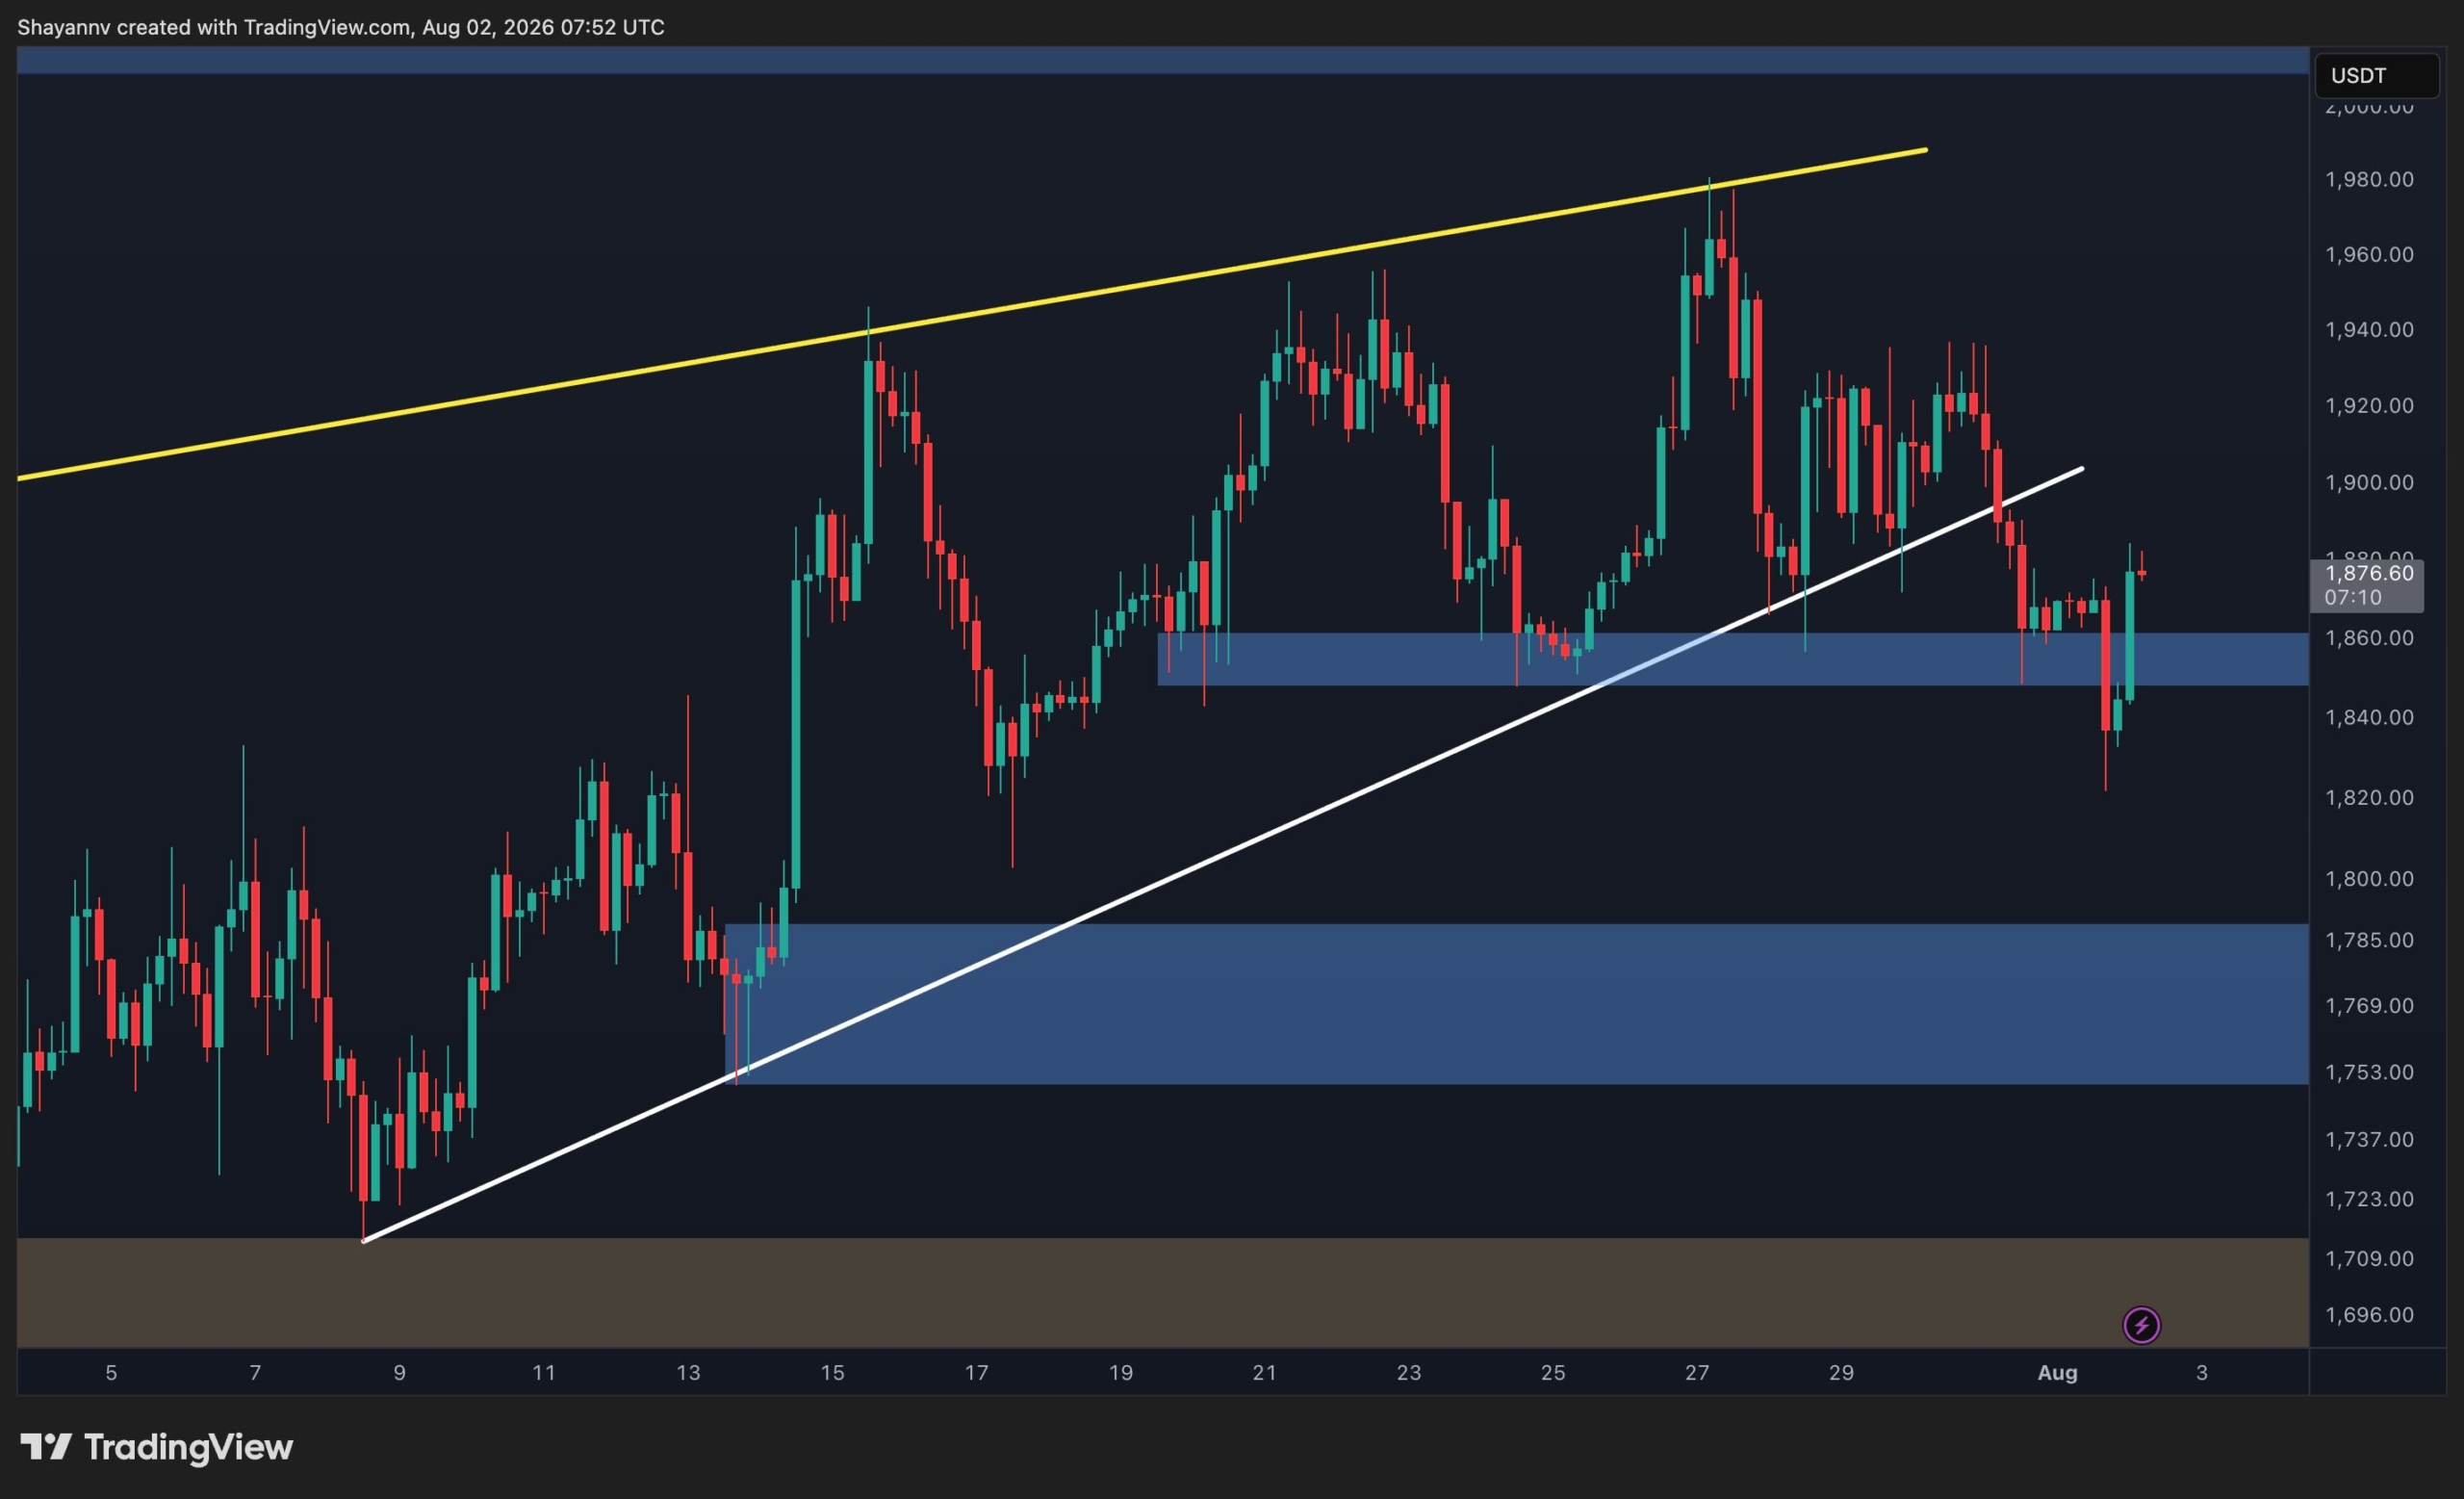
The 4-hour chart has turned more bearish after Ethereum broke below its ascending trendline, signaling that buyers have lost short-term control. This breakdown shifts the focus toward lower support levels unless bulls can quickly reclaim the broken structure.
The first support now lies within the $1.85K to $1.87K demand zone, where price is currently attempting to stabilize. Losing this area would likely accelerate the decline toward the next major demand zone between $1.75K and $1.79K.
On the other hand, the $1.88K to $1.91K supply zone has become the primary threshold for buyers. A successful reclaim of this region would invalidate the immediate bearish scenario and could allow Ethereum to challenge the descending resistance and the 100-day moving average once again.
Sentiment Analysis
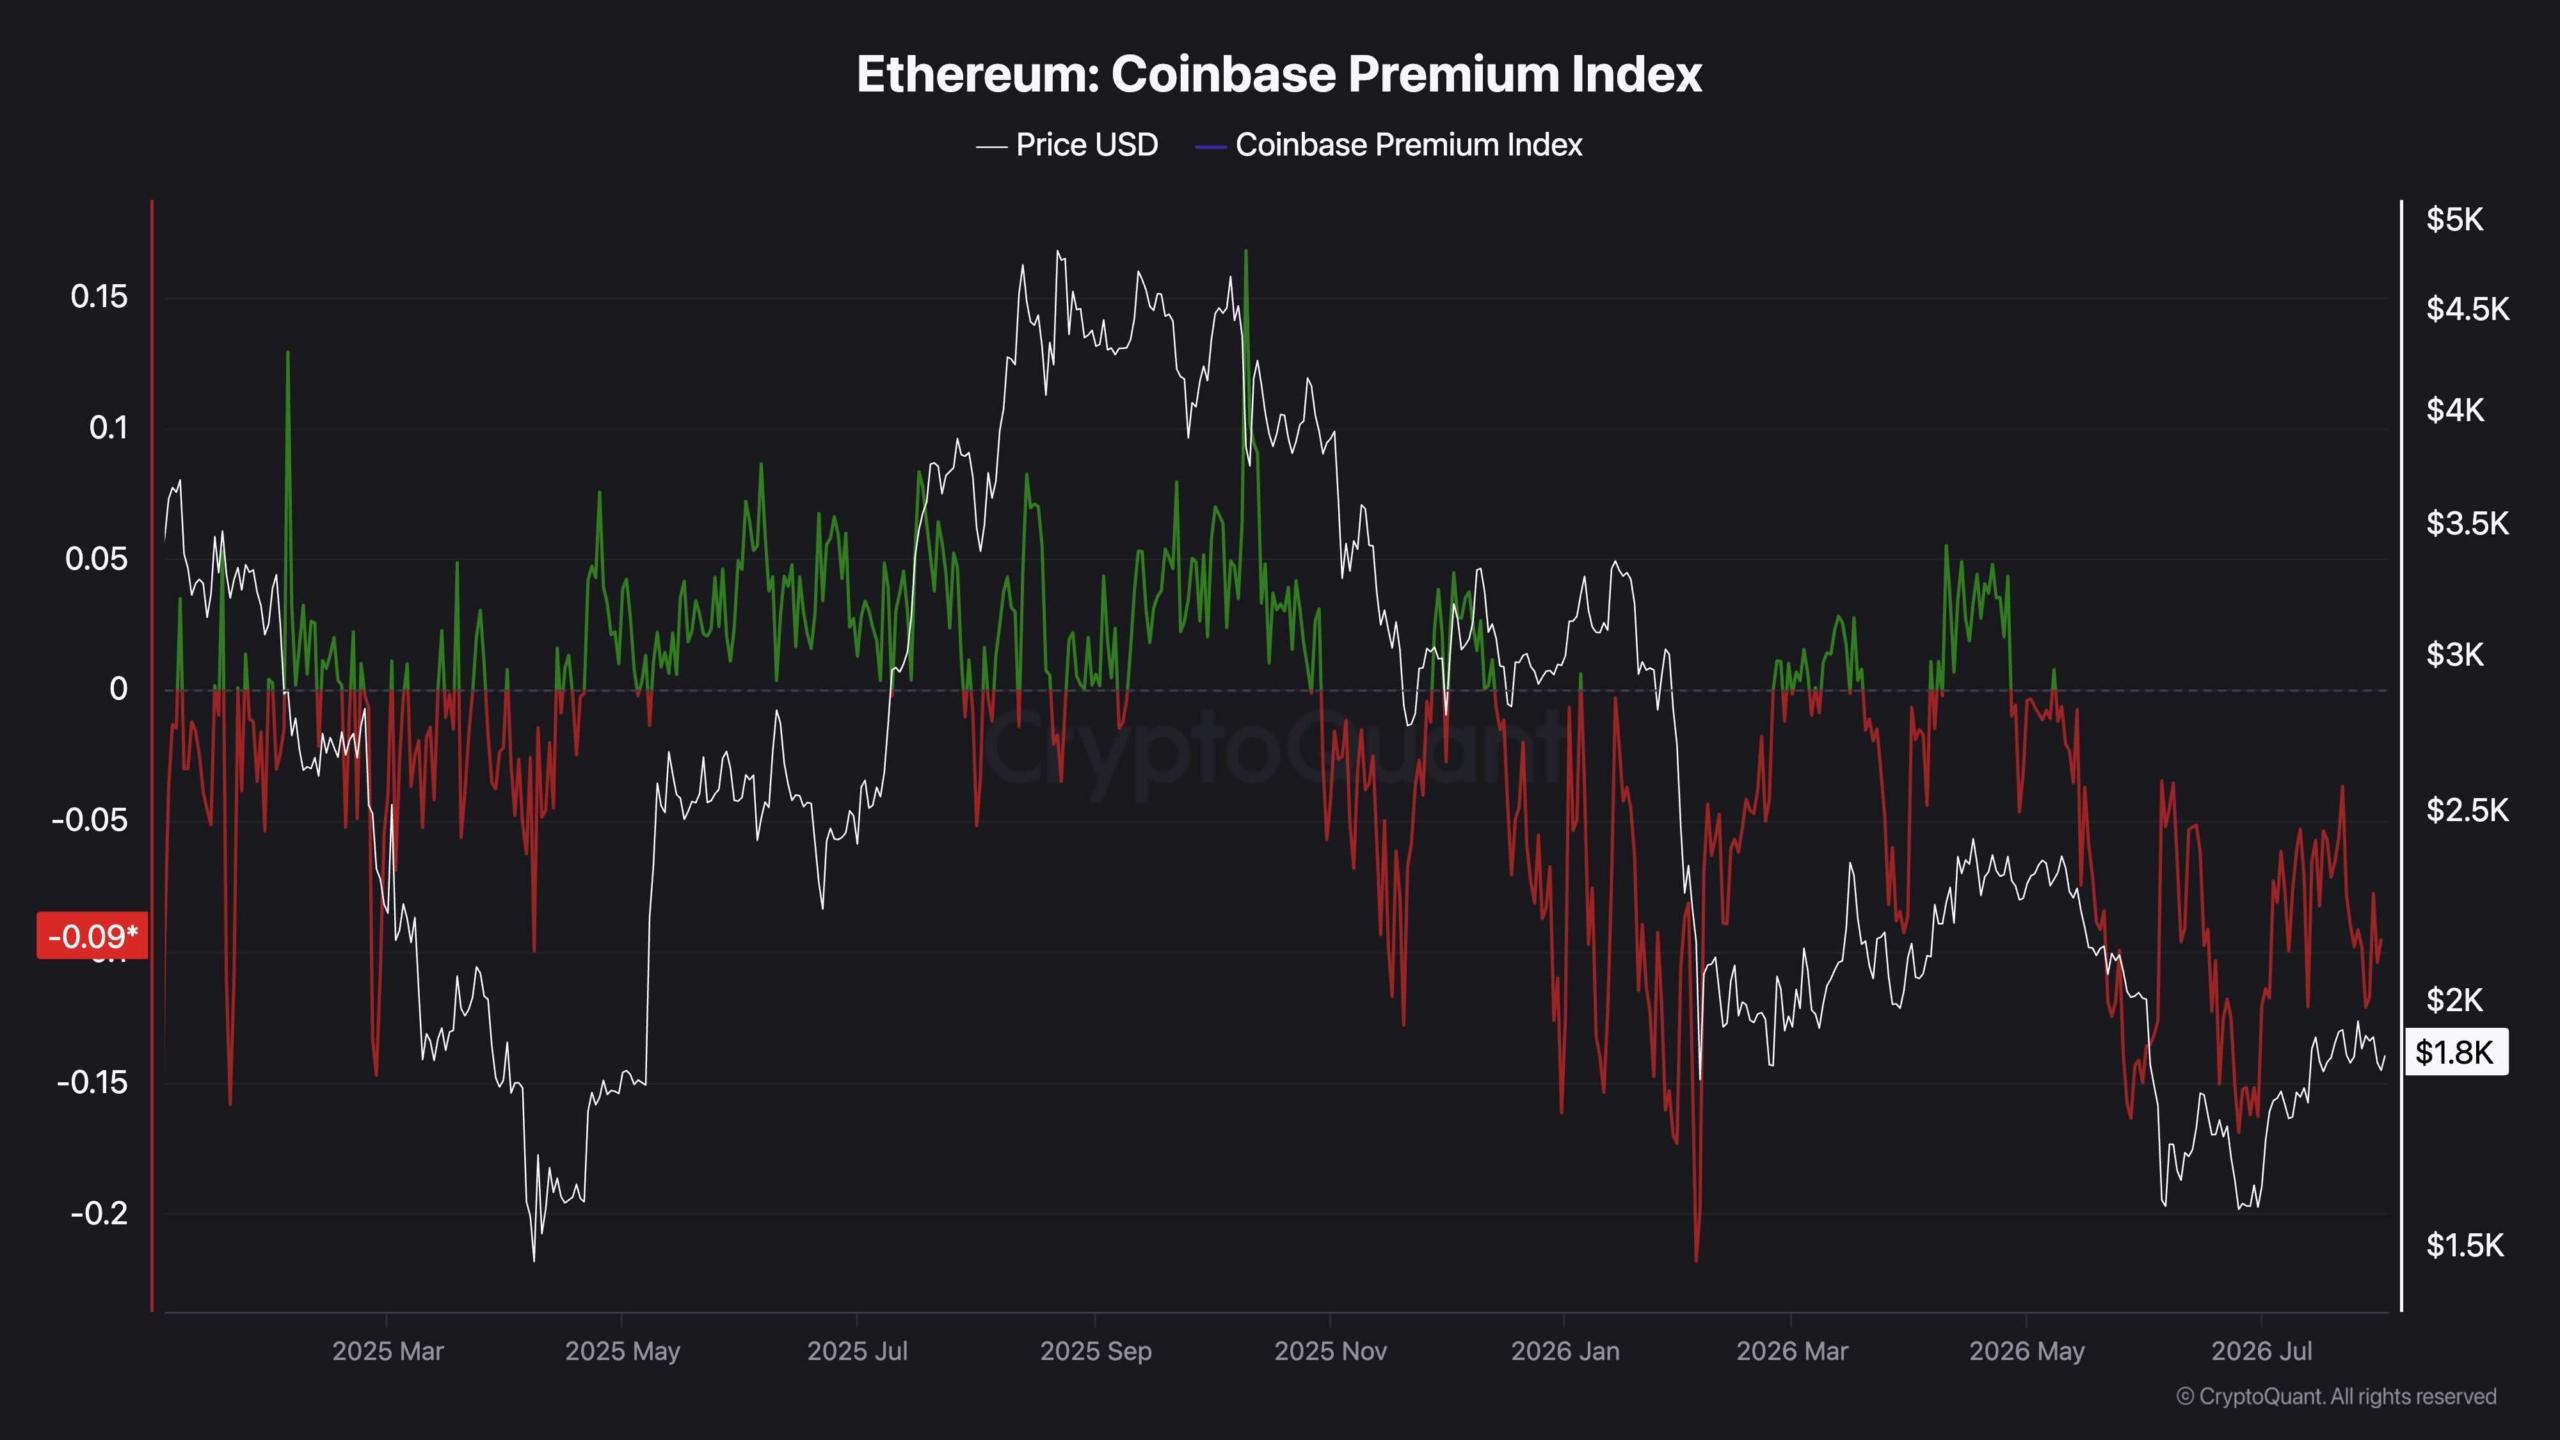
The Coinbase Premium Index remains in negative territory, indicating that Ethereum continues to trade at a discount on Coinbase relative to other major exchanges. This persistent negative premium suggests buying pressure from U.S.-based institutional participants remains relatively weak despite the recent recovery.
Historically, sustained positive readings have accompanied stronger bullish phases, whereas prolonged negative values often reflect cautious institutional sentiment. Until the premium returns to positive territory and remains there consistently, the current rebound may struggle to develop into a sustained uptrend, leaving Ethereum vulnerable to additional downside pressure if technical support levels begin to fail.
The post Ethereum Price Analysis: ETH’s Double Rejection at $2K Spells More Trouble Ahead appeared first on CryptoPotato.
Ripple’s XRP remains under steady selling pressure as the latest rebound attempts continue to lose momentum. The recent price action suggests sellers are maintaining control, while buyers are once again being forced to defend a critical support area.
Ripple Price Analysis: The Daily Chart
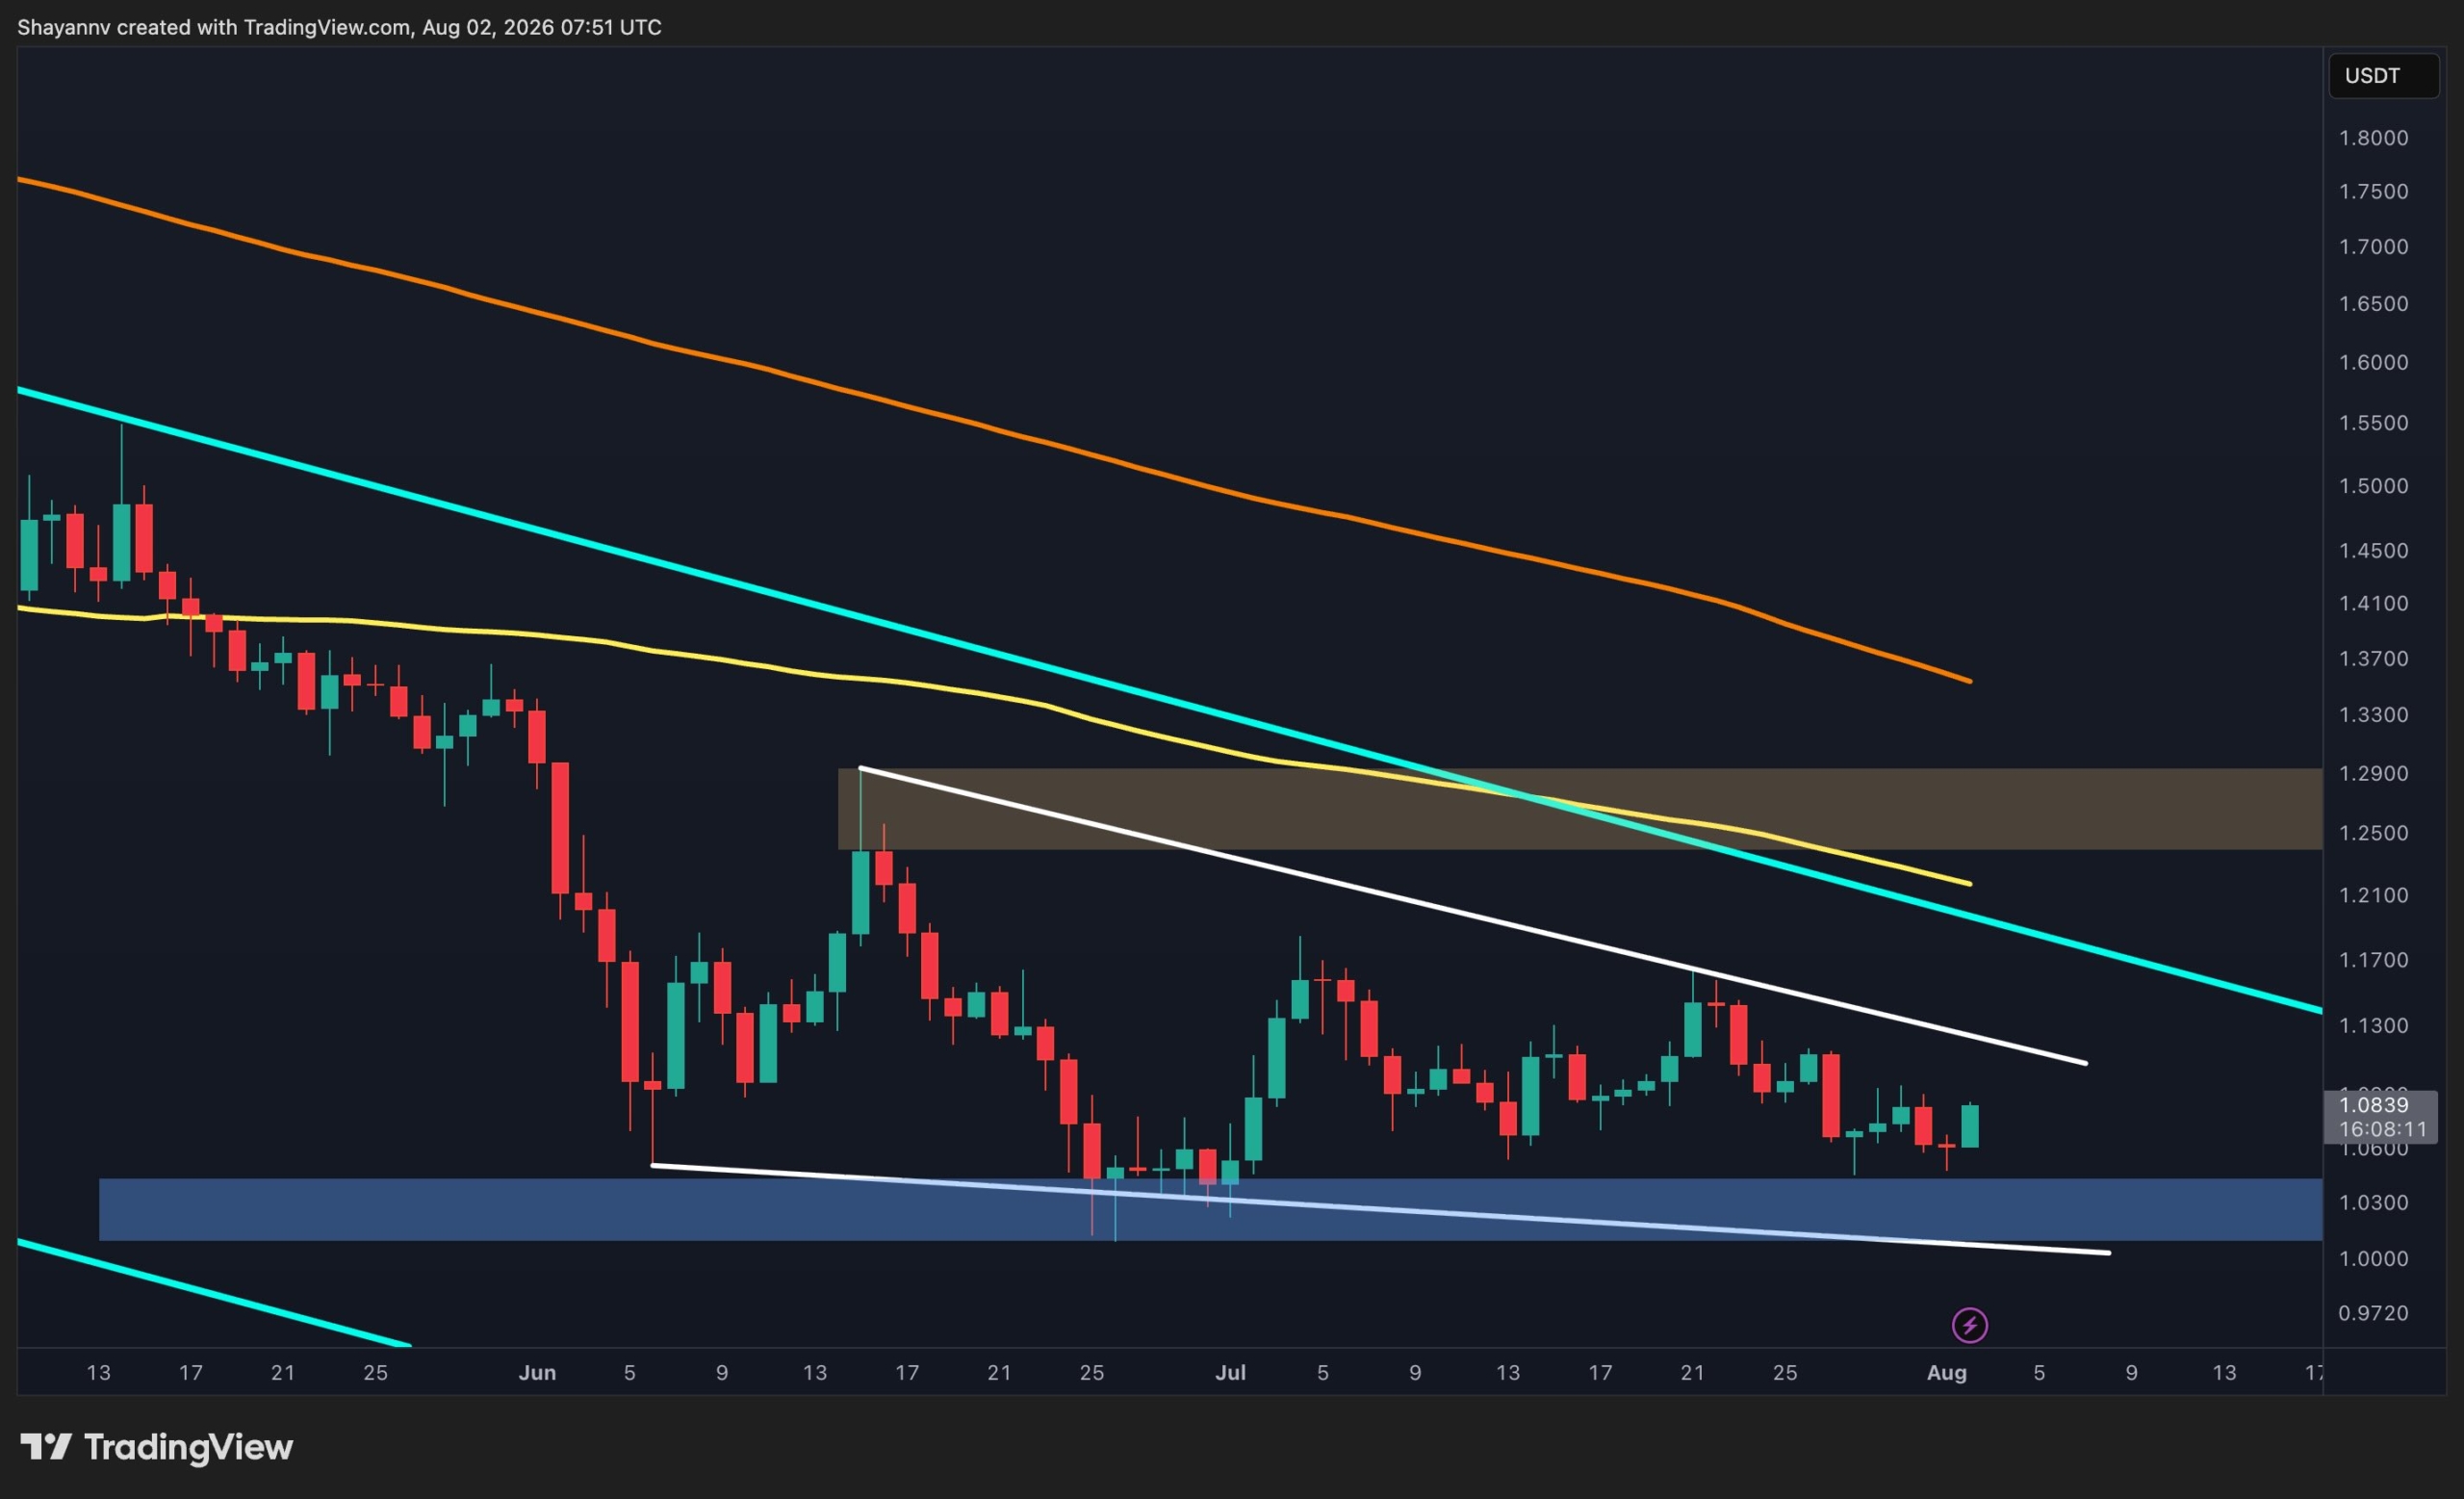
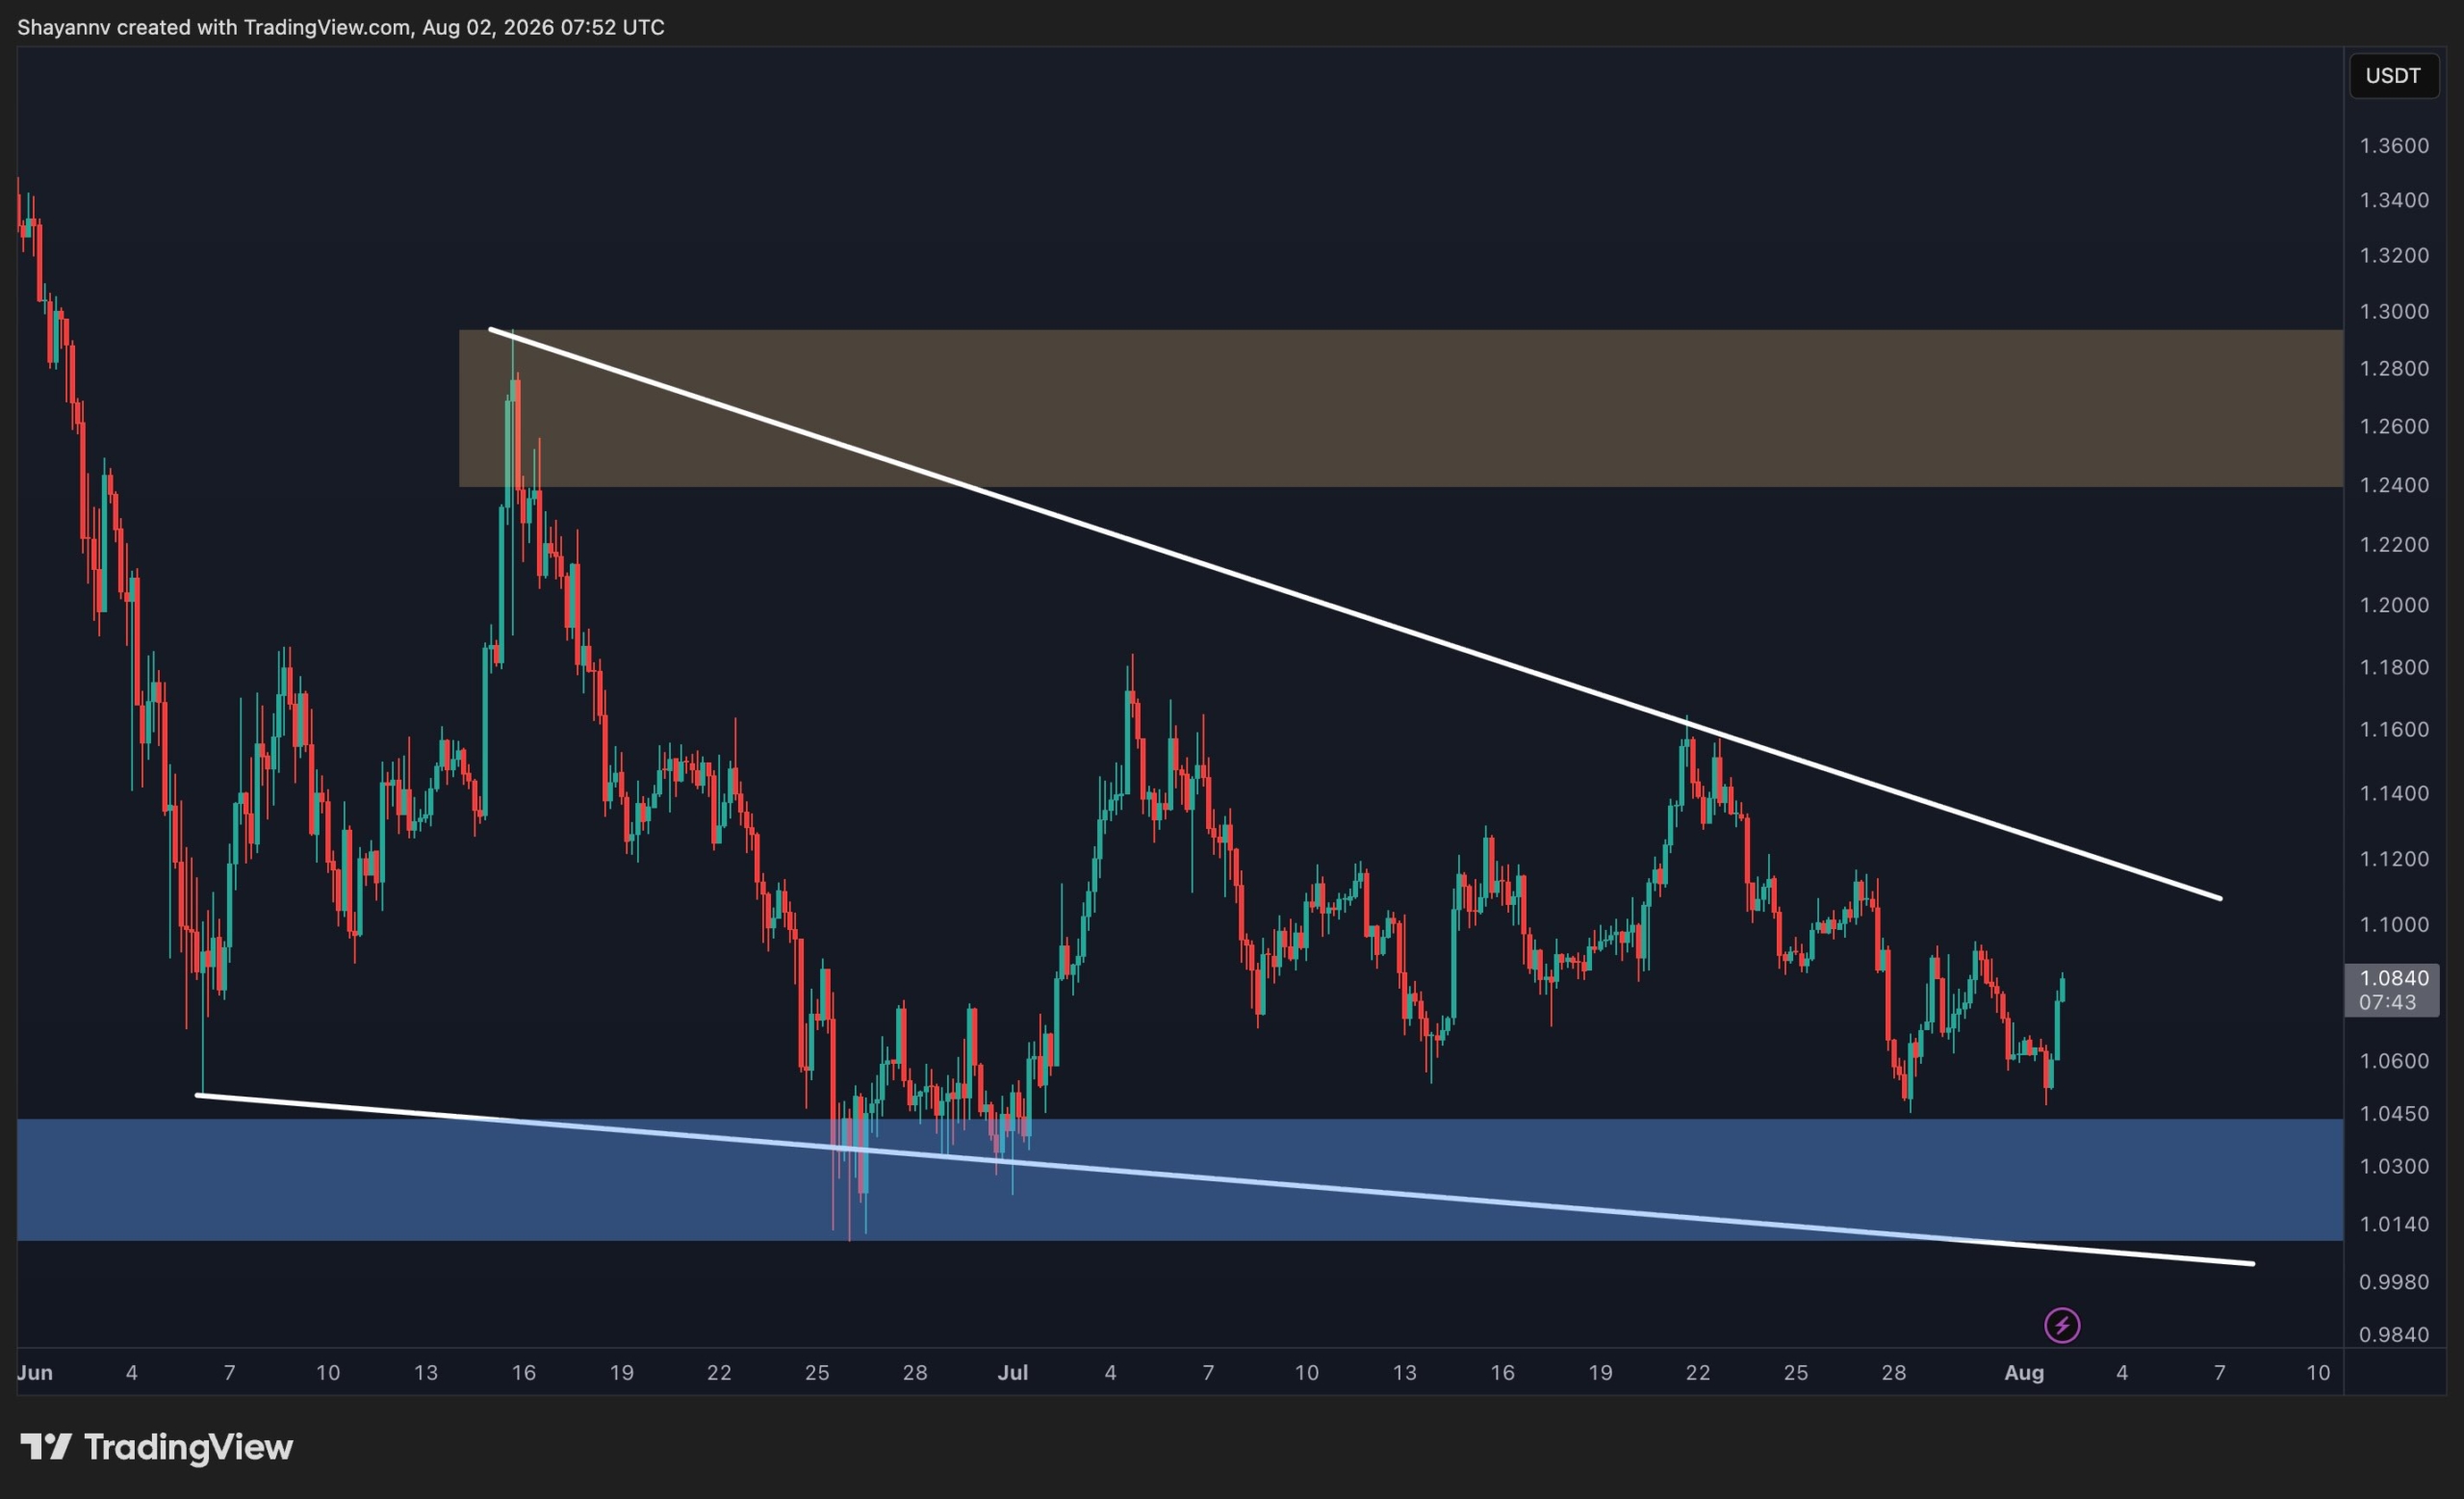
The daily chart shows little improvement compared to the previous analysis. The asset continues to trade beneath the descending resistance trendline while remaining well below the major moving averages, preserving the broader bearish market structure.
The latest candles indicate that sellers remain in control after another failed recovery attempt, pushing the price back toward the key demand zone around $1.01 to $1.04. This support has repeatedly prevented a deeper decline over the past several weeks, making it the most important level to monitor.
As long as XRP remains below the descending trendline and the main resistance between $1.24 and $1.29, the broader outlook favors continued weakness. A decisive breakdown below the $1.01 to $1.04 support zone would likely accelerate the decline toward the next major support around $0.89.
XRP/USDT 4-Hour Chart
On the 4-hour timeframe, rather than recovering from support, XRP has continued to print lower highs and lower lows while remaining capped by the descending resistance trendline.
The recent rejection near $1.09 was followed by another decline toward the $1.01 to $1.04 demand zone, showing that buyers have yet to regain control. This area remains the last significant short-term defense for the bulls.
If this support fails, the bearish momentum is likely to intensify and extend the decline toward lower levels. Conversely, buyers would first need to reclaim the descending trendline before any meaningful recovery toward the $1.24 to $1.29 resistance zone could be considered. Until then, rallies are likely to face selling pressure and remain corrective in nature.
The post XRP Price Analysis: Is a Drop Below $1 Inevitable as Sellers Stay in Control? appeared first on CryptoPotato.
Bitcoin continues to trade without a decisive directional bias as both buyers and sellers defend key technical levels. Until one side forces a confirmed breakout, the current environment is likely to remain dominated by range-bound price action and short-term liquidity grabs.
Bitcoin Price Analysis: The Daily Chart
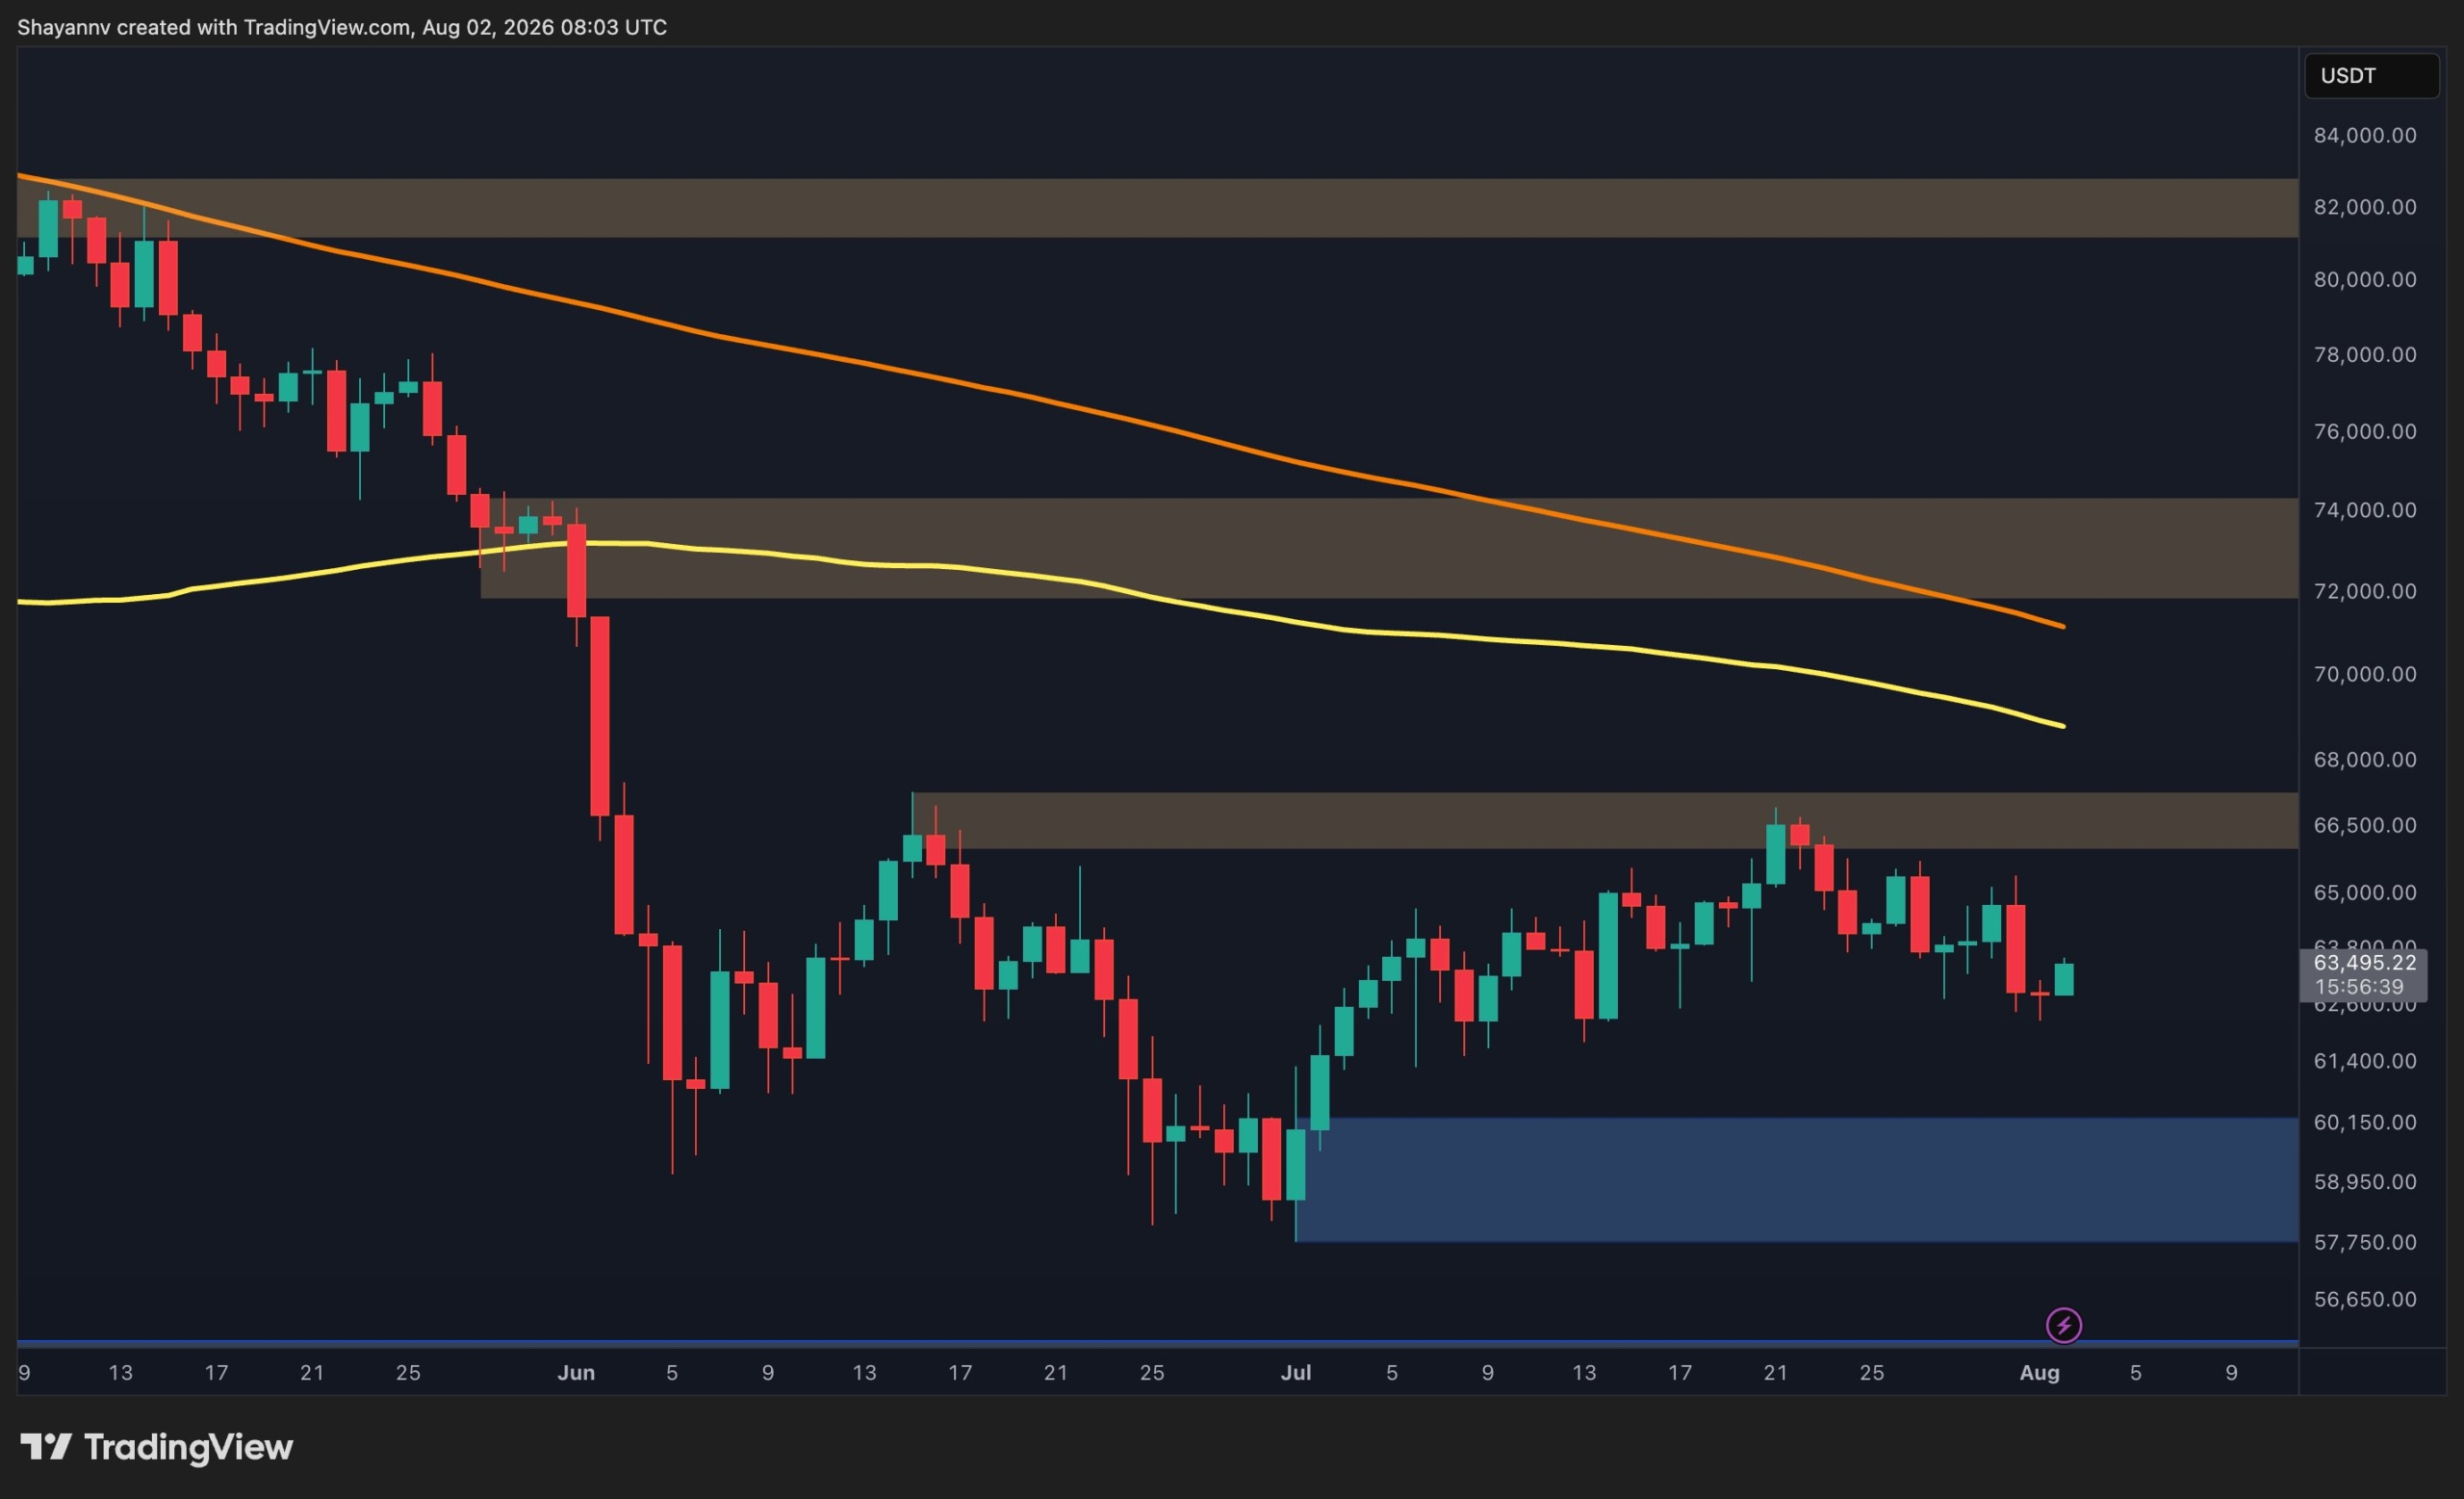
The daily chart suggests Bitcoin is still locked in a prolonged consolidation phase between the major support around $57.8K to $60.2K and the primary resistance at $66.2K to $66.8K. Despite several attempts by both buyers and sellers, neither side has managed to establish a sustained trend beyond these boundaries.
This type of market structure typically favors liquidity sweeps and stop hunts around local highs and lows before a genuine directional move develops. As long as the asset remains trapped between these two zones, traders should expect continued choppy price action rather than a sustained trend.
A confirmed breakout above the $66.2K to $66.8K resistance could trigger another leg toward the higher resistance around $72K to $74K. Conversely, losing the $57.8K to $60.2K demand zone would invalidate the current consolidation and expose Bitcoin to a deeper correction.
BTC/USDT 4-Hour Chart
On the 4-hour timeframe, Bitcoin is trading inside an even tighter range within the broader daily consolidation. Buyers continue defending the support region at $61.8K to $62.2K, while sellers repeatedly cap rallies below the resistance around $64.9K to $65.6K.
Holding above the buyers’ defense could allow another recovery attempt toward the upper boundary of this range. However, the recent sequence of lower highs indicates that sellers still hold a slight advantage, making a breakdown below the $61.8K to $62.2K support zone the more likely scenario if buying momentum continues to weaken. Such a move could accelerate selling pressure toward the lower boundary of the broader daily range.

Sentiment Analysis
The two-week liquidation heatmap shows a notable concentration of liquidity just beneath Bitcoin’s recent lows. This suggests futures market participants have been actively defending that area, with buyers stepping in to absorb selling pressure whenever the price approaches the lower liquidity cluster.
At the same time, a substantial pool of liquidity remains above the market around the $66K to $67K region, indicating that both sides still have attractive liquidation targets. As long as Bitcoin remains inside its broader consolidation, the price is likely to continue oscillating between these liquidity zones before a decisive breakout determines the next major trend.

The post Bitcoin Price Analysis: Will the Next Liquidity Sweep Push BTC Below $60K? appeared first on CryptoPotato.
A Canadian entrepreneur lost more than $1.6 million in Bitcoin (BTC) from a Coldcard hardware wallet in under seven minutes, part of a wave that may total 1,367.05 BTC.
The case exposes an uncomfortable truth about self-custody: doing everything right may not be enough.
How One Holder Lost 18 BTC in Seven Minutes
Cold storage means keeping private keys on a device that never touches the internet. Jonathan Goodman followed that principle carefully, storing his Coldcard in a safety deposit box.
His 18.25 BTC sat in wallets secured across multiple safes. He never shared his seed phrase and kept every device isolated from online exposure.
None of it mattered on July 29, 2026. Between 9:36 and 9:43 that evening, every wallet he controlled was emptied.
Follow us on X to get the latest news as it happens.
Goodman first heard about a broader problem while at his cottage.
Assuming it would not affect him, he checked the balances in the Wasabi wallet software and found a series of red withdrawal transactions.
The vulnerability traces back to 2021. A flaw in the code that generates seed phrases left certain devices exposed, and attackers allegedly used artificial intelligence to brute-force the affected seed phrases.
He is filing reports with the police and the Ontario Securities Commission. Recovery hopes remain slim, though he wrote that the hardest part was having done everything right.
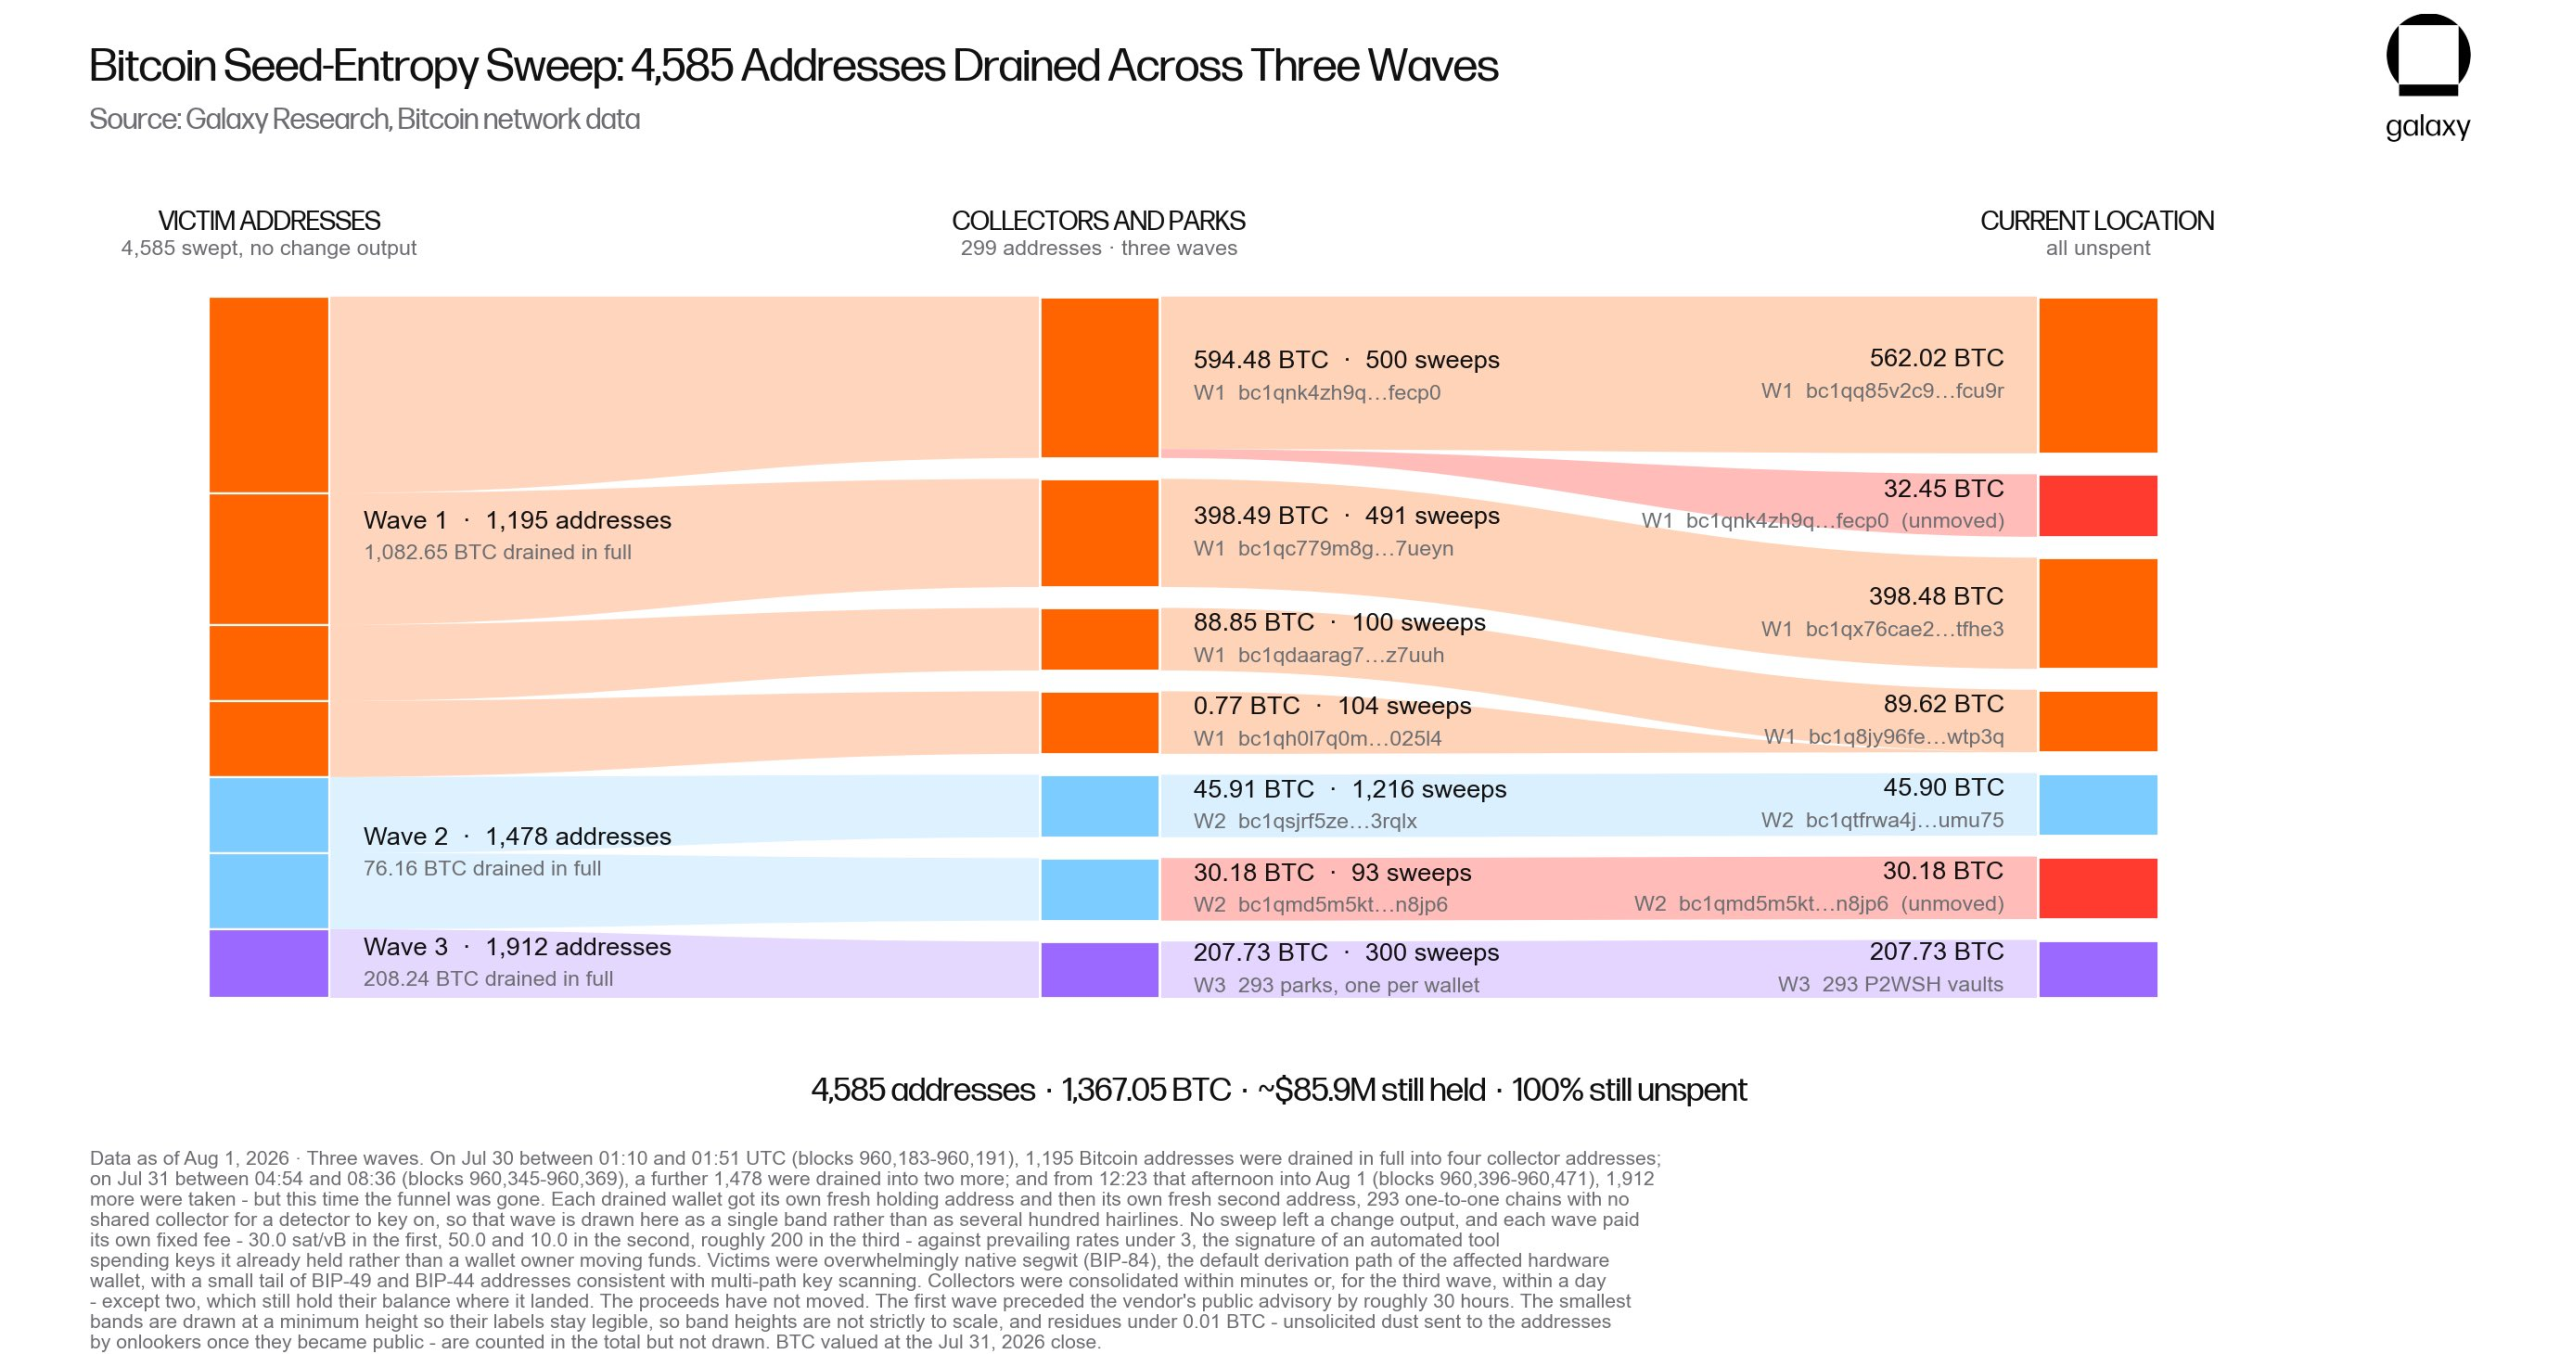
The scale extends far beyond one victim. Galaxy Research identified three suspected attack waves targeting addresses generated by Coldcard devices.
Those waves involved 4,585 source addresses and drained 1,367.05 BTC, worth roughly $88.6 million at the time of reporting.

What Galaxy Research Found in the Attack Data
Galaxy Research head Alex Thorn indicates that the attacks appear to be ongoing. He urged users who have not moved funds from potentially vulnerable setups to act immediately.
The first two waves showed similar transaction patterns and may share a common operator, though that remains unconfirmed. The third differed significantly, suggesting either updated tools or a separate actor exploiting the same key space.
The stolen Bitcoin remains in attacker-controlled addresses, with no further movement. Drained holdings had sat dormant for an average of 3.18 years, suggesting most victims were long-term holders rather than institutions.
Galaxy stressed an important caveat. Its findings rely solely on on-chain data and have not definitively confirmed insufficient randomness in the generation of the affected addresses.
“…this is a blow to bitcoin self-custody and we need to do better as a community: with security, with education, and with being realistic about complexity, expectations, and recommendations we make to friends, family, and the public…,” Alex Thorn said.
Analyst Shanaka Anslem Perera highlighted a deeper irony in Coldcard’s own documentation. The manual describes its default seed-generation method as the one it trusts most, while labeling it as low risk to users.
Subscribe to our YouTube channel to watch leaders and journalists provide expert insights.
Alternatives exist within the same device. Users can combine hardware output with dice rolls, or rely on dice alone, which the manual says removes all trust in the hardware. Most users likely followed the default path. That is precisely the method Galaxy Research now links to the losses.
The conceptual tension runs deeper. Reproducibility, prized for verifying firmware, becomes a liability in secret generation, since both weak and strong seeds produce valid 24-word phrases that appear identical.
Devices marketed under a “Don’t Trust, Verify” ethos can still harbor entropy flaws, leaving no visible trace. Affected users should assess their setups and migrate funds where necessary.
The post $1.6 Million Drained in a Blink: User Recounts His Dramatic Coldcard Wallet Hack appeared first on BeInCrypto.
Iran has denied President Donald Trump’s claim that a deal exists to reopen the Strait of Hormuz, the world’s busiest oil route. Oil jumped on the denial.
Bitcoin (BTC) barely moved. That gap says a lot about what crypto traders now choose to ignore.

Trump Says a Hormuz Deal Exists. Iran Says It Does Not
Trump posted on Truth Social early Sunday. He said he had canceled a planned strike on Iran.
He wrote that Iran and its neighbors asked him to hold off. The reason, he said, was that “the perimeters of a deal has been agreed to.”
That deal would open the Strait of Hormuz right away. It would also end Iran’s nuclear threat.
Iran answered within hours. Fars News Agency quoted a source close to the nuclear talks.
“There is no agreement regarding the reopening of the Strait of Hormuz, and the news published about it is false,” Fars News Agency, via CGTN.
Follow us on X to get the latest news as it happens
Iran’s acting defense minister, Seyyed Majid Ibn Al-Reza, called Trump’s words psychological warfare. Fars International called Trump’s terms a wish list.
None of this is new. An earlier pause in strikes in late July also went nowhere.
Talks did happen, though. Qatari mediators met Iran’s foreign minister, Abbas Araghchi, and US envoy Steve Witkoff on Saturday. Saudi Crown Prince Mohammed bin Salman urged Trump to cool things down.
Why Oil Jumped and Bitcoin Did Not
Start with the map. The Strait of Hormuz is a narrow sea lane between Iran and Oman.
About 20 million barrels of oil passed through it every day in 2024, EIA data shows. That is roughly a fifth of the oil the world uses.

Here is the problem. Only about 2.6 million barrels a day can go around it, through pipelines in Saudi Arabia and the UAE.
The rest has nowhere else to go. That is why one denial can move a market this big.
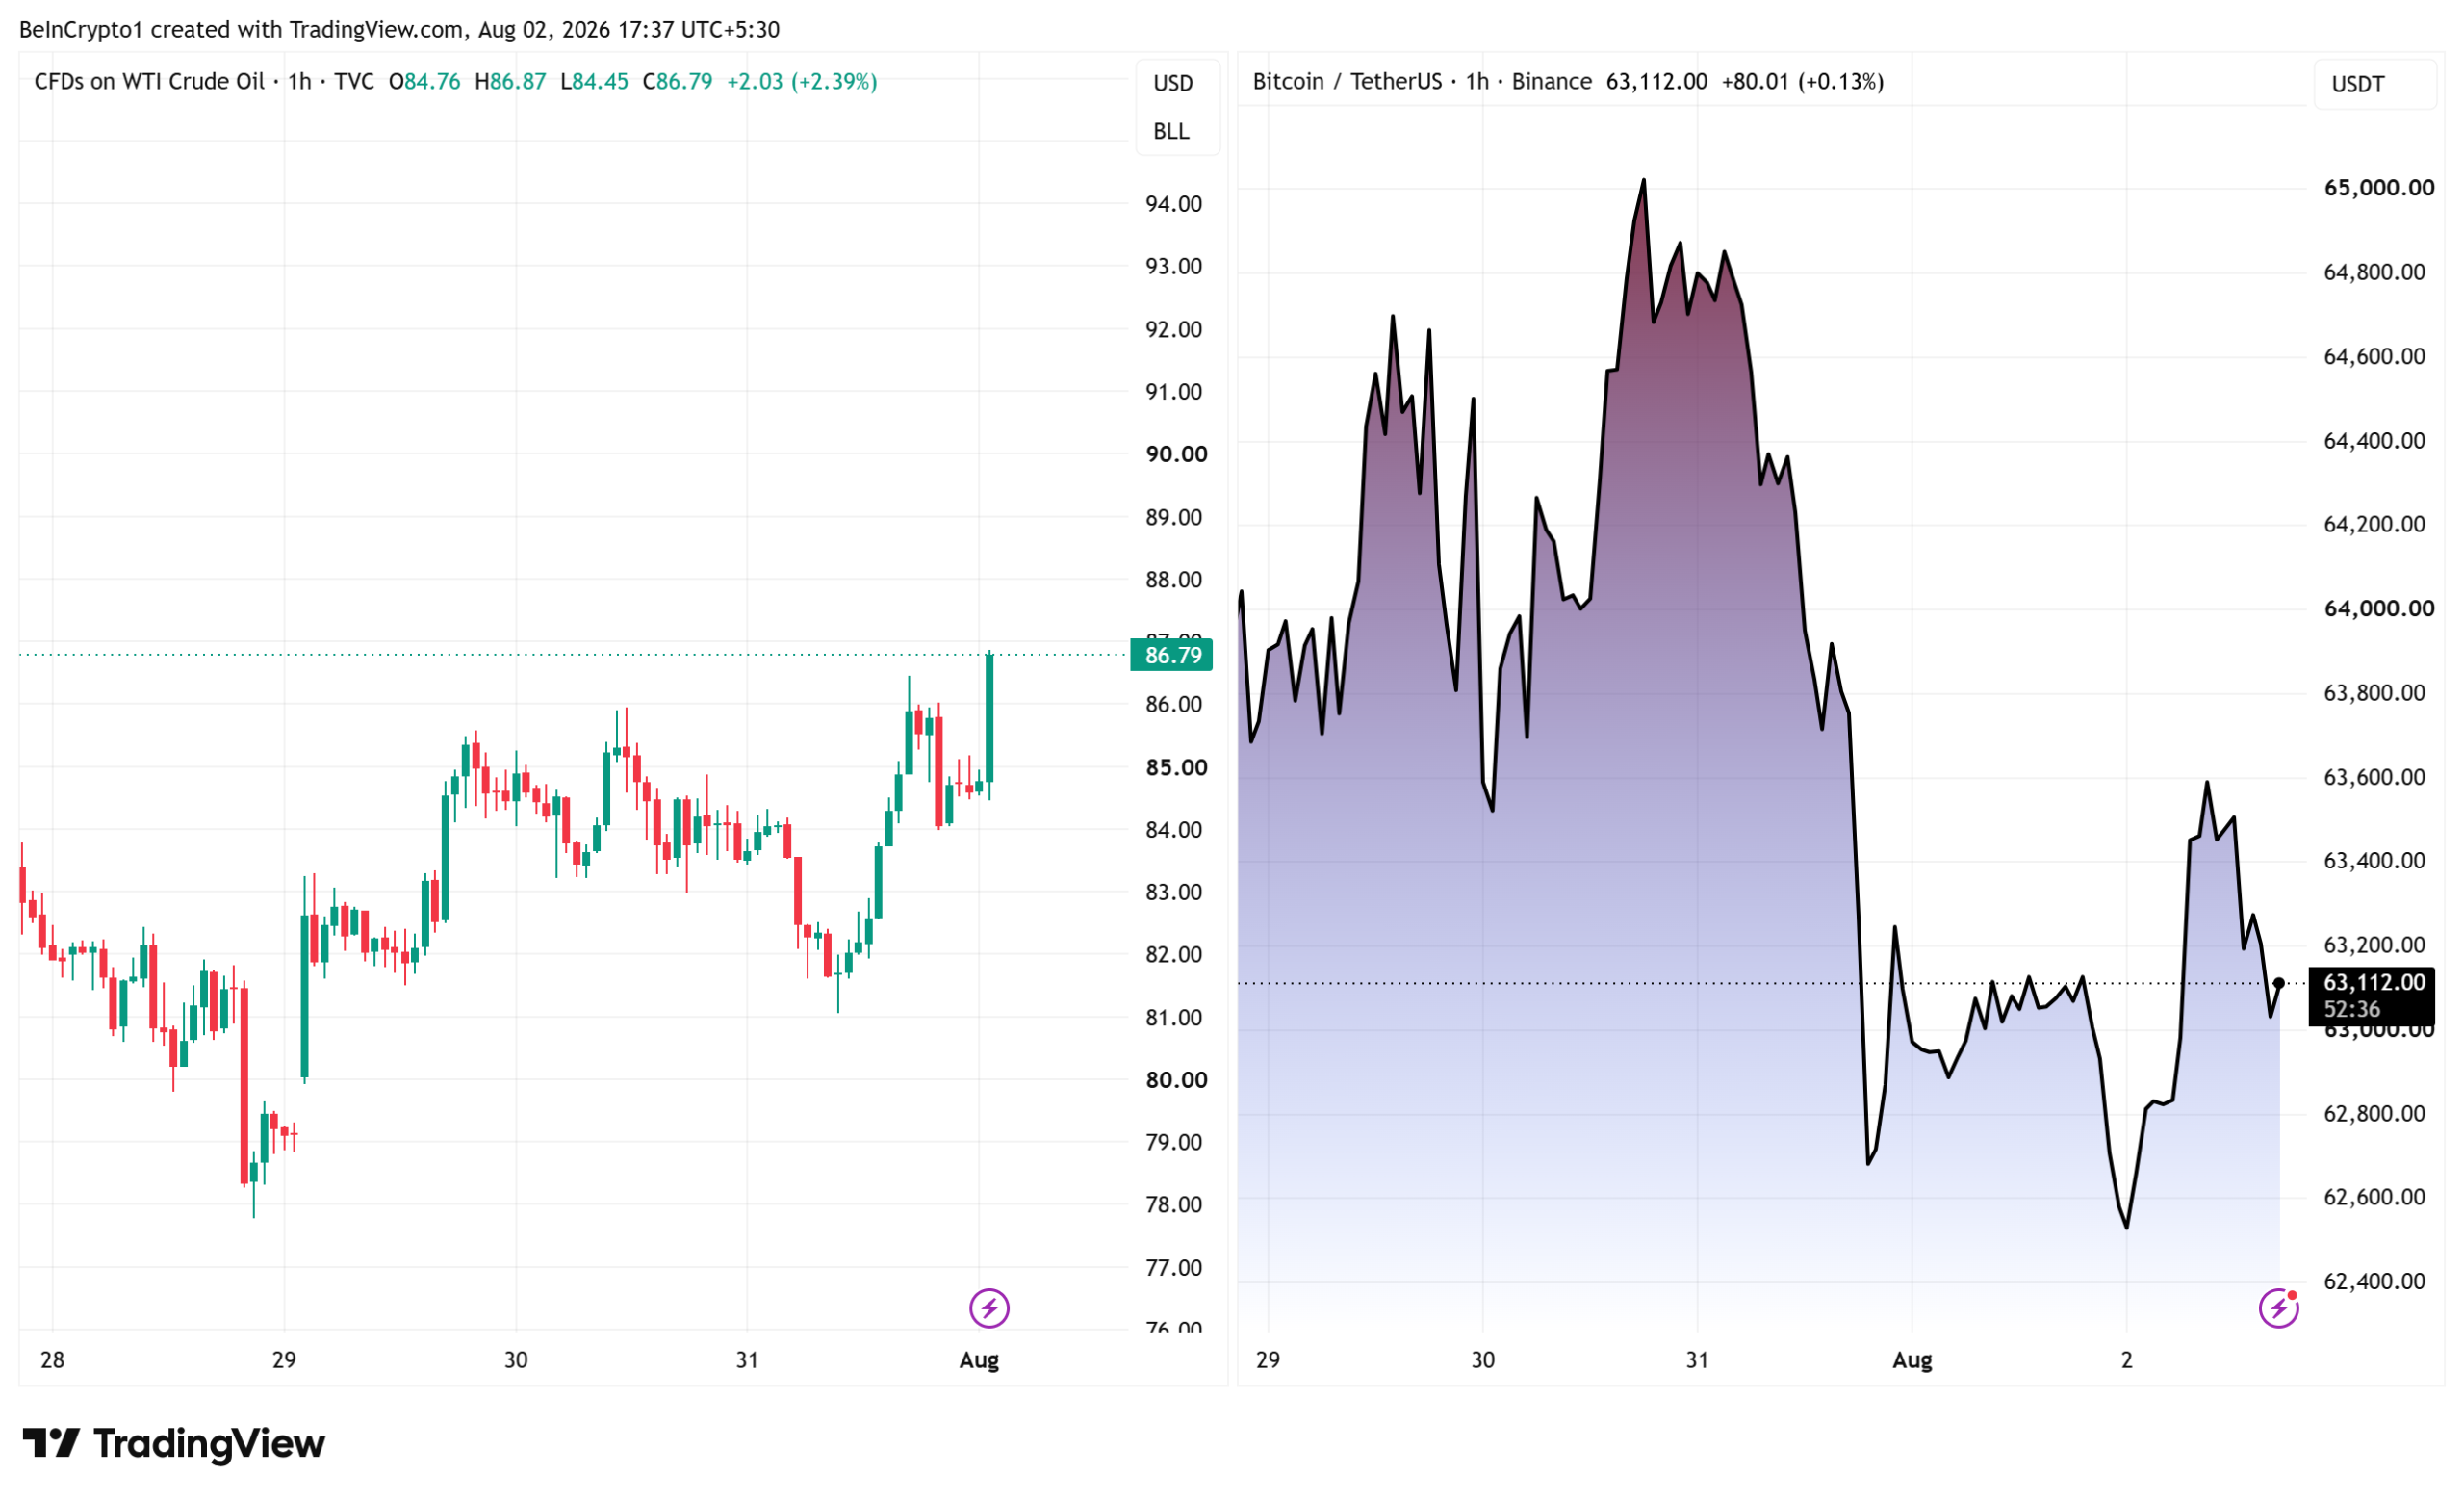
WTI crude, the US benchmark, closed at $84.67 on Friday. It then rose about 2.4% to trade near $86.79.

The denial also puts an official forecast in doubt. On July 7, the EIA cut its Brent crude forecast for this quarter by $27 a barrel, to $74. It cited the June US-Iran deal and busier traffic through the strait.
That June deal has since fallen apart. Analysts tracking Hormuz reopening timelines now expect the route to stay restricted into 2027.
Bitcoin did almost nothing. It added 0.08% in 24 hours and sat near $63,063.

It also trades about 50% below its record of $126,080, set on October 6, 2025. The muted Bitcoin price reaction suggests traders now ignore headlines that change nothing on the water.
What Happens Next
Oil matters to crypto for one reason. It feeds inflation.
June proved the link. US energy prices fell 5.7% that month, the steepest drop since April 2020.
The BLS said energy did most of the work. Headline prices fell 0.4% over the month. Annual inflation cooled to 3.5% from 4.2%.
Energy is still expensive over a full year, however. Gasoline is up 26.7%.
So a lasting jump in oil would undo that progress. That makes Federal Reserve rate cuts harder to justify. Rate cuts are what assets like Bitcoin want.
The next check comes August 12, when the BLS publishes July inflation.
Until ships can sail through Hormuz freely, oil keeps its war premium. Bitcoin keeps waiting.
The post Iran Denies Trump’s Hormuz Deal, Oil Jumps but Bitcoin Watches appeared first on BeInCrypto.


South Koreans sent $367 million more in stablecoins out of the country than they brought back in June. It was the 18th month in a row that money left.
The Financial Supervisory Service (FSS) handed those numbers to lawmaker Lee Jong-wook. The streak started in January 2025. Traders are chasing something they cannot get at home.
Why South Korea’s Stablecoin Outflows Keep Widening
Five exchanges handle almost all local crypto trading. They are Upbit, Bithumb, Coinone, Korbit, and Gopax.
In June, they sent roughly $1.8 billion in stablecoins to foreign platforms. About $1.44 billion came back. The gap was $367 million.
Local media reported that across the whole second quarter, close to $1.1 billion left.
Follow us on X to get the latest news as it happens
The size is what caught the attention of lawmakers. Koreans bought about $470 million of foreign shares in June, according to the Korea Securities Depository. The stablecoin outflow matched 77.6% of that figure.
A year earlier, the ratio sat near 20%. Crypto money now leaves the country almost as fast as stock money.
The trend held even as the local market shrank. Seoul confirmed a 22% crypto tax for 2027, and domestic trading volume fell nearly 55% in the first half.
One caveat belongs here. The FSS counts only the five licensed exchanges, so coins sent to private wallets first never show up.
What Foreign Exchanges Offer That Seoul Cannot
Korean platforms mostly offer plain spot trading. That is the whole problem.
Foreign venues offer far more.
- Crypto derivatives with heavy leverage
- Dollar-based real world assets (RWAs)
- Decentralized Finance (DeFi) protocols
- Staking rewards
Some also list Samsung Electronics, SK Hynix, and Hyundai Motor as tradable contracts. Leverage on those can run into the tens of times. A stablecoin transfer is the cheapest way in.
The same hunger shows up in regulated markets. Koreans put a net $1.28 billion into foreign leveraged exchange-traded funds (ETFs) in June. That was more than triple the May total.
Seoul did try to compete. Korea listed its first single-stock leverage ETFs on May 27. Less than a month later, FSS Governor Lee Chan-jin publicly criticized them.
A bigger fix is on the way. Four agencies published a plan on July 19 to legalize won-backed stablecoins. A separate bill would treat crypto as national wealth.
The Leverage Unwind Sitting Behind the Numbers
The regulator’s worry proved well founded. Fourteen leveraged ETFs track Samsung and SK Hynix. Their assets shrank from about $10.7 billion at the end of June to $6.3 billion by July 13.
Margin loans fell too. Korean brokerages held roughly $21.8 billion on July 30, down about $4.4 billion since June 24.
The Kobeissi Letter says $67 billion has drained from margin accounts across Korea, China, and Taiwan. BeInCrypto could not confirm that total.
The KOSPI lost 22.19% in July, its worst month since 1997. Then it jumped 17.91% on July 31, a record single day.
Economist Steve Hanke blames global fatigue with AI hype. That rebound, led by a 29.95% gain in SK Hynix, cuts against the idea. Asia’s unwinding AI trade has swung just as hard in Tokyo.
The stablecoin figures tell a steadier story. Korean money is not hiding. It is relocating, much as it did when Korean investors cashed out late last year.
Lee sits on the National Assembly’s finance committee for the People Power Party. He wants the government to act.
“As the ‘coin move’ from domestic to overseas spreads, funds are flowing abroad, and investors are being defenseless against high-risk derivatives on foreign exchanges,” local media reported, citing Lee.
Seoul can close the exits or widen the menu at home. That choice decides what month 19 looks like.
The post South Koreans are Sending Stablecoins to Foreign Exchanges at Record Rate appeared first on BeInCrypto.


Everything under one login
Round-the-clock trading is one part of the plans exchanges have for traditional assets. Coinbase and Binance want customers to trade crypto, stocks and other products through one account, a model both have described as an “everything exchange” or financial super app.
Coinbase is preparing to offer U.K. customers equities and derivatives alongside crypto after securing investment-services authorization from the Financial Conduct Authority under rules based on the Markets in Financial Instruments Directive, or MiFID.
The authorization allows Coinbase to offer traditional shares to retail customers and crypto, equity and commodity perps to eligible institutional and advanced traders, the company said.
“Perpetual futures are a core focus of what Coinbase is trying to bring to market,” said Keith Grose, U.K. CEO at Coinbase, in an interview with CoinDesk. “We’re really focused on being the ‘everything exchange.’”
Grose said the longer-term plan is to bring spot crypto, perpetual futures, traditional equities, and eventually tokenized versions of other assets into one place. That could allow customers to use positions across different markets as collateral or borrow against their equities.
Using stocks as collateral
Binance is testing another part of the model by allowing some high-net-worth clients to use tokenized stock positions as collateral for other trades.
“We recognize you could have Nvidia or SpaceX stock, a tokenized version,” Jan said. “You could actually have a tokenized stock put on our exchange, and we’ll use that as collateral for you to trade something else. It could be a crypto derivative.”

Trump Media-linked wallets transferred 2,628 Bitcoin, valued at about $165 million, to Crypto.com on Aug. 2, according to on-chain analysts Lookonchain.
Summary
- 2,628 BTC moved to Crypto.com, but no company filing has confirmed an outright sale yet.
- Trump Media reported 9,542.16 BTC in March, including 4,260.73 BTC pledged as secured convertible-note collateral.
- Lookonchain estimates realized and unrealized Bitcoin losses at $555 million after seven months of transfers.
The movement reportedly reduced the wallets’ remaining balance to about 4,261 BTC.Lookonchain described the movement as another sale and estimated that Trump Media had disposed of 7,281 BTC over seven months. However, neither Trump Media nor an SEC filing had confirmed the latest coins were sold as of Aug. 2. An exchange deposit can precede a sale, custody change, collateral arrangement or another internal transaction.
Trump Media transfer is not a confirmed sale
Lookonchain said the company originally acquired 11,542 BTC for about $1.37 billion, averaging $118,522 per coin. Its post stated, “It looks like Trump Media sold another 2,628 BTC,” wording that reflects uncertainty about the final transaction.
EmberCN separately traced the 2,628 BTC to Crypto.com and estimated that the linked wallets had transferred out about 7,281 BTC. The Arkham entity page identified two recent movements totaling roughly 2,628 BTC, including transfers of about 2,429 BTC and 198.9 BTC.

Source: Akham
Remaining Bitcoin nearly matches pledged collateral
Trump Media’s latest quarterly filing provides the strongest company-confirmed baseline. The company reported 9,542.16 BTC at March 31, with a cost basis of $1.131 billion and a fair value of $647.1 million. It recorded no change in the number of coins during the first quarter.
The SEC filing also said 4,260.73 BTC served as collateral for convertible notes and could not be withdrawn or distributed unless indenture requirements were met. The restrictions are scheduled to end no later than May 29, 2028.
The reported post-transfer balance of about 4,261 BTC almost exactly matches that pledged amount. This suggests the tracked wallets may now mainly contain restricted collateral, but the on-chain labels do not prove the accounting or legal status of each coin.
The $555M loss remains an outside estimate
Lookonchain calculated that the 7,281 BTC left the linked wallets at an average price of $74,855, generating about $545 million. It then estimated Trump Media’s combined realized and unrealized Bitcoin loss at approximately $555 million.
Those figures are not company-confirmed. The calculation assumes exchange transfers became sales near the observed market prices. It also combines estimated losses on transferred coins with the paper loss on the remaining balance. Trump Media’s March filing confirmed a lower fair value, but said the company had not realized material digital-asset losses at that reporting date.
Trump Media transferred 2,650 BTC worth about $205 million to Crypto.com on May 22. The coins remained in an exchange-linked wallet when that report was published, showing why a transfer should not automatically be reported as a completed sale.
Truth API launch adds separate regulatory scrutiny
The Bitcoin movement followed Trump Media’s Aug. 1 launch date for Truth API, a paid service providing institutional customers with low-latency access to influential Truth Social posts. The company said the product delivers posts in milliseconds and could create a recurring revenue stream. Its revenue expectations remain forward-looking claims.
U.S. Senators Adam Schiff and Elizabeth Warren asked the SEC to investigate whether the service could violate federal securities laws. Their letter raised concerns that paying firms could receive market-moving presidential posts faster than ordinary users. The request is not an SEC finding, and the agency had not publicly announced an enforcement action.
Crypto.news reported that Trump Media posted a $405.9 million first-quarter net loss, partly reflecting unrealized markdowns across Bitcoin, Cronos and securities.
The company’s next quarterly filing should clarify whether the May and August transfers were sales, custody movements or transactions linked to hedging and financing arrangements. No verified Bitcoin or DJT price movement can be attributed solely to the Aug. 2 transfer.


Bitcoin Improvement Proposal 110 can no longer reach its 55% voluntary miner threshold during the current difficulty period, according to blockchain signaling data and an Aug. 1 analysis from Strategy Executive Chairman Michael Saylor.
Summary
- 28 signaling blocks appeared among 1,108, leaving BIP-110 at 2.53% support as of Aug. 2.
- Saylor said all 24 initial signals came from DATUM miners sharing rewards through OCEAN’s system.
- Mandatory signaling starts at block 961,632, when enforcing nodes reject every non-signaling block as invalid.
Strategy’s official website identifies Saylor as the company’s executive chairman. At block 960,561, Saylor counted 24 signaling blocks among 946, equal to 2.54%. He said every signal came from miners using DATUM while sharing rewards through OCEAN, with none identified outside that system. By 11:13 UTC on Aug. 2, the public BIP-110 monitor had advanced to block 960,723 and counted 28 signals among 1,108 blocks, or 2.53%. Only 908 blocks remained.
BIP-110 cannot reach voluntary lock-in
The proposal needs 1,109 signaling blocks within one 2,016-block difficulty period to lock in voluntarily. Even if every remaining block in the current period signals, the total could reach only 936. Saylor therefore said the threshold was “mathematically unreachable” and argued that the observed count was “not miner consensus.”
The latest monitor supports that arithmetic. However, it does not independently establish Saylor’s attribution of every signaling miner. His pool claim applied to the 24 blocks examined at block 960,561. The monitor confirms that the overall rate remained almost unchanged after four additional signals appeared.
BIP-110 would restrict Bitcoin transaction data
BIP-110, formally called the Reduced Data Temporary Softfork, proposes seven temporary consensus restrictions. These include limiting most new output scripts to 34 bytes, capping OP_RETURN outputs at 83 bytes, restricting certain data pushes to 256 bytes and temporarily limiting several Taproot features. Outputs created before activation would remain exempt.
Supporters say the one-year rules would reduce arbitrary data storage and keep Bitcoin focused on monetary activity. Critics, including Saylor and Blockstream co-founder Adam Back, argue that consensus rules should not determine which currently valid transaction structures deserve block space. As previously reported, Saylor said fee markets and individual node policies offer a safer response to disputed data use.
Saylor questions OCEAN and DATUM’s role
Saylor also alleged that OCEAN made BIP-110 signaling the default on an existing endpoint. He called the initiative a “vertically integrated marketing campaign for Knots and OCEAN/DATUM.” That description represents his interpretation rather than a finding by an independent technical body.
The official BIP-110 installation guide directs users toward Bitcoin Knots and includes instructions for pointing rented hashpower at a DATUM node. OCEAN’s DATUM documentation says miners create block templates through their local nodes, while the pool coordinates reward splits instead of constructing mining work. Those documents confirm the technical relationship, but they do not independently establish Saylor’s claim about promotional intent.
Mandatory signaling becomes the next test
The current voluntary period ends at block 961,631. From block 961,632 through 963,647, software enforcing BIP-110 is designed to reject every block that does not signal bit 4. The proposal would then lock in at block 963,648 and activate at block 965,664, when its transaction restrictions would begin for 52,416 blocks.
Saylor warned that any 100% signaling reading during the mandatory window would reflect the software rule rather than a fresh vote of support. Foundry USA Pool has separately asked its mining customers to vote on whether the pool should signal, with its voting window scheduled to close near block 961,632. No verified result was publicly available by Aug. 2.
The next decisive evidence will come from major mining pools, exchanges, wallets and node operators before the mandatory period starts. Low voluntary signaling does not automatically cancel BIP-110 because its deployment includes mandatory signaling. However, enforcing nodes could follow a minority chain if most hashpower continues mining non-signaling blocks. Saylor and Back warned that enforcing the proposal without broad agreement could divide the network.

Bitcoin has seen a spike in very small transfers—moves of less than 1 BTC—that match the intensity last observed around the collapse of FTX. The renewed activity comes as researchers continue to track a suspected Coldcard wallet-related hack, underscoring how quickly users are reacting when self-custody tools appear compromised.
According to CryptoQuant head of research Julio Moreno, Friday recorded the highest daily level of sub-1 BTC transfers since November 2022, with 39,600 BTC moved. The total was just 300 BTC below 39,900 BTC transferred on Nov. 16, 2022, shortly after FTX filed for bankruptcy. Moreno framed the comparison as a sign of urgency and said users appear to be “taking action.”
Key takeaways
- Daily Bitcoin transfers below 1 BTC hit their highest level since November 2022, totaling 39,600 BTC, per CryptoQuant’s Julio Moreno.
- Galaxy Research says the suspected Coldcard incident caused estimated losses of 1,367 BTC across 4,585 addresses, after identifying a further 207.7 BTC taken in an additional wave.
- Galaxy’s Alex Thorn warned that the attack was still ongoing and urged affected users to move funds immediately from Coldcard-generated addresses.
- The incident is reigniting debate over whether self-custody is safer than relying on third-party platforms, with executives arguing the impact differs across user approaches.
Small-transfer surge echoes the post-FTX era
While large market moves often capture headlines, the current data point focuses on behavior at the granularity of everyday wallet operations: sub-1 BTC transfers. Moreno’s analysis suggests the market is seeing a level of small withdrawals not observed since the period following FTX’s bankruptcy filing.
The comparison matters because it points to reflexive user behavior—moving funds in smaller increments—rather than a single, coordinated “whale” action. In the wake of FTX, exchange-related uncertainty drove users toward faster, more defensive moves. Here, the catalyst is different: ongoing concerns tied to Coldcard-generated addresses.
Moreno’s observation that these transfers had not occurred at similar daily intensity since the FTX collapse suggests that the Coldcard incident may be triggering a comparable sense of immediate risk. That doesn’t prove equivalence in scale or cause, but it does show that user reaction can look similar even when the underlying event is distinct.
Galaxy Research details additional theft wave
Galaxy Research, part of Galaxy Digital, reported Saturday that it had identified another attack wave tied to the suspected Coldcard hack. In that wave, an additional 207.7 BTC was drained—valued at roughly $13.2 million at the time Galaxy cited.
Including the newly identified activity, Galaxy estimated total losses of 1,367 BTC, affecting 4,585 addresses. Galaxy’s reporting suggests the incident is not a single moment of exploitation, but an ongoing process where both victims and attacker infrastructure continue to emerge as investigators refine their tracking.
Galaxy also points readers to a Coldcard-focused tracking resource, “Coldcard Watch,” as part of the broader transparency around wallet activity connected to the suspected incident.
“Still ongoing” warnings push users toward immediate withdrawal
Alex Thorn, Galaxy Digital’s head of firmwide research, said in an X post on Sunday that the attack remained active. Thorn urged users to move funds from Coldcard-generated addresses immediately if they had not already done so.
Thorn added that his team continues to identify both new victim addresses and attacker addresses. He also noted that reports from users have helped investigators and authorities track stolen funds, reinforcing a practical implication for readers: in incidents where on-chain patterns are evolving, user-provided information can accelerate investigative work.
The warning is also a reminder that self-custody isn’t only about holding assets—it’s about operational readiness. When wallet-generated addresses are implicated, the “time to react” becomes part of the security model, whether users follow best practices or not.
Self-custody debate returns as commentators argue “failure” vs “risk control”
The suspected Coldcard hack has again pulled the conversation toward the long-running fault line in crypto security: self-custody versus third-party custody. Self-custody is a foundational principle in Bitcoin, emphasizing user control without dependence on intermediaries. Yet security incidents involving consumer-grade tools can complicate the narrative and raise fresh questions about usability and safety.
Nick Neuman, CEO of Bitcoin security company Casa, pushed back against claims that “self-custody is over.” He argued that because self-custody is distributed, users have time to respond as threats are identified. Neuman also estimated that potentially 10 times more Bitcoin was protected through self-custody than was stolen and identified so far in the attack.
That position reframes the debate from whether an incident can occur at all to how the system responds once the risk becomes visible. In Neuman’s view, the existence of ongoing victims does not negate the defensive advantage that self-custody can provide—especially when users monitor, verify, and act on warnings.
Others took the issue in a different direction. Eric Balchunas, a senior ETF analyst at Bloomberg, argued via X that Bitcoin exchange-traded funds may offer a safer and more convenient alternative for many users, pointing to the longer operating history of ETFs.
In contrast, critics of that argument say the Coldcard episode reflects a failure of a specific wallet provider or implementation rather than a fundamental breakdown of self-custody itself. The tension here is important for readers to recognize: “self-custody” is not a single technology—it’s a set of practices and tools—so incidents can be interpreted as either systemic or localized depending on what readers believe broke down.
What to watch next
With Galaxy saying the attack is still unfolding and continuing to identify new victim and attacker addresses, the next key signal will be whether transfer patterns and wallet-specific indicators stabilize as users move funds. For investors and builders, the bigger question is how quickly the broader community can validate affected addresses and coordinate response—because in cases like this, speed is part of the security outcome.

The Best Financial Strategies by Income: $40k, $75k, $100k+

Fishing lake up for sale in pretty Cambridgeshire village

Capital Power: Picking Up Stock After A Dividend Hike (TSX:CPX:CA)

Renter of Home in Anne Heche Crash Denies Settlement With Son

No Jackpot Winner as $257 Million Prize Rolls Over to $269 Million Monday Draw

Weekend Open Thread: Staud – Corporette.com
The Best Financial Strategies by Income: $40k, $75k, $100k+

Power of money||#shorts #ytshorts #sigma #motivational #trendingshorts #trending #inspire

Crypto Trading For Beginners | Bitcoin Trading for Beginners | Crypto Trading kaise kare | App India
-
 Sports7 days ago
Commonwealth Games boxing: Jadumani Singh seals dominant 5-0 win over Pakistan’s Sumama Rehman to enter quarter-finals | Commonwealth Games News
-

 Business4 days ago
Why Trees Belong on the Risk Register
-

 Fashion2 days ago
Weekend Open Thread: Wit & Wisdom
-

 Tech7 days ago
Intel is reversing course and bringing hyper-threading back to its server chips
-

 Politics2 days ago
Meta enters AI-training agreement with far-right ‘propaganda rag’ Newsmax
-

 Politics6 days ago
Luke Littler dismantles Gerwyn Price to retain title in Blackpool
-
 Crypto World24 hours ago
MicroStrategy Post-Earnings CLARITY Act Push Could Add New Catalyst for Its Stock
-

 Politics5 days ago
The Part of the Electric Transition Nobody Wants to Discuss
-
 Entertainment5 days ago
‘Stargate’ Creator’s New Sci-Fi Series Returns for Season 3 Tomorrow
-

 News Videos7 days ago
BITCOIN JUST ENTERED THIS CRITICAL ZONE…
-

 Business4 days ago
Major shareholder moves on Canyon
-

 News Videos3 days ago
Bitcoin Enters the 3rd Stage of the Bear Market
-

 Crypto World1 day ago
XRP Ledger v3.3.0 brings five institutional features
-

 Crypto World5 days ago
Kraken Enables Retail Access to Jersey Mike’s IPO via Tokenized Shares
-

 Tech6 days ago
New macOS Sequoia & Sonoma security updates for older Macs
-

 News Videos5 days ago
Claude: Build Financial Dashboards in Minutes (2026)
-

 Politics3 days ago
Luke Littler’s dominance sparks GOAT debate
-

 Sports3 days ago
Seema Kaliramna Wins Discus Throw Bronze, Takes India’s CWG Medals Tally To 17
-

 Business5 days ago
Johnson & Johnson agrees to $5.5B settlement over talc cancer claims
-

 Crypto World5 hours ago
Crypto PAC spending tops $2M in Michigan House race
You must be logged in to post a comment Login