

Crypto World
What is Robinhood Chain? The broker’s L2 explained



Robinhood launched its own blockchain in July 2026, an Ethereum layer 2 where tokenized stocks trade around the clock and plug into DeFi as collateral. This guide explains what Robinhood Chain actually is, how it works under the hood, what Stock Tokens are and who can use them, how the chain differs from Base and the other corporate networks, and what it means for users, builders, and the industry’s biggest open questions.
On July 1, 2026, one of the largest retail brokers in the United States switched on its own blockchain. Robinhood Chain launched its public mainnet at a London keynote, carrying 95 tokenized stocks that trade 24 hours a day, a suite of DeFi protocols live from day one, and access wired directly into the Robinhood Wallet used across 120 countries. Within a week the chain had processed roughly 4 million transactions, gathered over $240 million in deposits, and produced a launch statistic, $570 million of day-one volume against $21.68 million of liquidity, that made the entire industry look twice.
A brokerage running a blockchain would have sounded absurd for most of crypto’s history, and it now sounds inevitable: Coinbase runs Base, Stripe backs Tempo, and the era of consumer giants renting neutral rails is visibly ending. But Robinhood Chain is a distinct species within that trend, because it was built around one specific product no other chain ships: real-world equities as native, composable on-chain assets, the thing crypto has promised since the first tokenized-stock experiments and never delivered at brokerage scale.
This guide explains the chain from the ground up: what it technically is and how the Arbitrum-based architecture works, what Stock Tokens are and what holders actually get, the DeFi ecosystem that launched with it and why composability is the entire point, who can access what and where the regulatory lines sit, how the chain compares to Base and the corporate-chain field, the fee economics including the unusual revenue-sharing deal with Arbitrum, and the honest open questions, control, liquidity, and law, that will decide what the chain becomes.
The architecture: an Ethereum layer 2, built to order
Robinhood Chain is a layer 2 blockchain: a network that executes transactions on its own fast, cheap environment while posting records to Ethereum, inheriting the base chain’s security for its history. It is built using Arbitrum’s Orbit technology, the chains-as-a-service framework from the team behind Arbitrum One, which means Robinhood did not invent a blockchain so much as commission one: Orbit supplies the rollup machinery, proofs, data posting, Ethereum settlement, and Robinhood configures the network, operates its infrastructure, and decides what it is for.
Three design choices define it. First, it is permissionless: any developer can deploy contracts using standard Ethereum tooling, without Robinhood’s approval, which is why an uninvited memecoin economy appeared on day one and why first-tier DeFi protocols could arrive at launch. That openness distinguishes it sharply from the private bank chains of the last decade and puts it in the same public-network category as Base. Second, it is EVM-compatible: everything built for Ethereum ports over directly, wallets, contracts, developer tools, so the chain starts with the industry’s entire software ecosystem instead of an empty room. Third, it is purpose-tuned for real-world assets: fast block times via Alchemy infrastructure, Chainlink as the official oracle for prices, cross-chain messaging, and proof-of-reserve on Robinhood-issued assets, and BitGo integration on the custody side, the specific plumbing tokenized equities require and general-purpose chains bolt on as afterthoughts.
The trust profile follows from the architecture, and it is the standard corporate-chain bargain. User funds are secured by Ethereum: the sequencer that orders transactions cannot forge them or steal assets, and the chain’s history settles to the base layer. Access and ordering, though, run through infrastructure Robinhood operates, the centralized-sequencer chokepoint every major rollup currently carries, which means outages, ordering policy, and censorship capacity sit with one regulated company. For everyday users the distinction rarely surfaces; for anyone evaluating the chain seriously, it is the first line of the risk section.
Stock Tokens: the product the chain was built around
The headline asset class is Stock Tokens: on-chain representations of equities, NVDA, GOOG, AAPL among the 95 at launch, issued by Robinhood, priced by Chainlink feeds, and tradable every hour of every day, not just during exchange sessions. They are the chain’s reason for existing, and understanding precisely what they are, and are not, is the guide’s most practical section.
A Stock Token delivers price exposure to the underlying equity in a token that behaves like any other crypto asset: hold it in the Robinhood Wallet or self-custody, trade it around the clock on the chain’s exchanges, transfer it, and, most consequentially, use it inside DeFi. What it does not deliver is shareholder status: token holders do not vote, and corporate rights stay with the issuance structure, with dividend economics passed through per the product’s terms, the standard trade-off of every tokenized-equity model. The tokens descend from Robinhood’s 2025 European pilots, which tokenized exposure to private names like SpaceX and OpenAI as proof of concept, and the lineage matters: the legal wrappers were tested under European rules before the chain bet on them.
Availability is the sharpest edge. Stock Tokens ship through the Robinhood Wallet in more than 120 countries, and conspicuously not to United States users, where the line between a compliant synthetic instrument and an unregistered security remains undrawn. The result is one of the strangest compliance objects in crypto: a permissionless network, built by an American broker, whose flagship assets are geofenced away from Americans, with enforcement living at the issuance and app layers while the rails underneath stay open. Whether that architecture satisfies regulators, or attracts them, is among the chain’s defining open questions.
The 24/7 dimension carries its own mechanics worth knowing. When the underlying stock market is closed, nights, weekends, holidays, the tokens keep trading, drifting on expectation with no live reference price, then reconverging when the real market opens. Weekend token prices function as forecasts of Monday’s open, gaps can be violent when news breaks during the closure, and anyone using the tokens in leveraged or collateralized positions inherits that gap risk in full.
The DeFi layer: why composability is the point
Tokenized stocks existed before Robinhood Chain. What the chain adds, and what its launch ecosystem was assembled to prove, is composability: the tokens plug into open financial protocols as first-class assets, which converts a brokerage line item into a programmable building block.
The day-one roster was deliberately first-tier. Uniswap deployed a dedicated AMM as the chain’s core public liquidity venue; Arcus, built by the team behind dYdX, runs a zero-fee exchange purpose-built for the stock tokens; 1inch, Rialto, and Lighter round out trading, with Lighter adding perpetual futures and pledging $11 million of its token to Robinhood users; Pleiades operates a proprietary market-making AMM; and Morpho’s lending markets opened the loop that matters most: stock tokens as loan collateral. That last integration is the chain’s genuinely novel product, a holder borrowing stablecoins against tokenized NVDA, automatically, no paperwork, with liquidation machinery enforcing the loan against oracle prices, and it is also the chain’s most delicate engineering: equity collateral marked by feeds from a market that closes means health factors computed against stale or reconstructed prices for two-thirds of every week, gap-risk liquidations at Monday opens, and corporate-action handling no DeFi risk framework has stress-tested at scale.
The deposits that flowed in during week one, past $240 million, concentrated in exactly these venues, drawn by a 7% yield incentive and points programs, and the composition question, how much collateral is actually stock tokens versus recycled farm assets, is the single best indicator of whether the composability thesis is converting, the launch-week forensics this publication’s feature examined in depth.
Using the chain: access, wallets, and what a first session looks like
For a user, the chain’s front door is the Robinhood Wallet, the company’s self-custody app, which added native Robinhood Chain support at launch: bridging assets in from Ethereum and other networks, swapping tokens, and reaching the chain’s applications happen from inside an interface tens of millions of people already carry. That distribution is the launch’s real innovation, one tap from an existing consumer app to an on-chain economy, no seed-phrase ceremony, no network-configuration ritual, and it is why the chain gathered users at a pace organic launches never match.
Nothing about the chain requires Robinhood’s app, though, and the permissionless design means the standard crypto path works identically: add the network to any EVM wallet, bridge funds across, and interact with the protocols directly. A typical first session looks like any L2’s, bridge a stablecoin or ETH, pay negligible fees, swap or deposit into a venue, with two chain-specific wrinkles worth knowing in advance. The first is that asset availability depends on who you are and where: the DeFi protocols and general tokens are open, while Stock Tokens and certain products check jurisdiction at the issuance and interface layers, so two users on the same chain can see different shelves. The second is incentives literacy: the launch period’s yields and points programs are bootstrap subsidies with published terms and step-down schedules, and treating them as permanent rates is the classic new-chain mistake, since incentive-driven deposits reprice the day the programs do.
Builders face an even lower bar: the chain is standard EVM, deploys with familiar tooling, and offers what no other network can, proximity to a brokerage user base and an asset class, the stock tokens, that exists nowhere else as a composable primitive. The day-one protocol roster arrived for exactly that reason, and the open question for every subsequent builder is the same one the chain itself faces: whether the mission assets acquire the liquidity that makes building against them worthwhile.
The launch by the numbers, and how to read them
The chain’s opening week produced statistics worth recording precisely, because they will be the baseline every future assessment measures against. Day-one volume of $570 million against $21.68 million of total value locked, a 26-to-1 turnover ratio without precedent at scale, driven overwhelmingly by speculative memecoin trading rather than the stock tokens the chain was built for. Roughly 4 million transactions in the first week against about $57,000 of protocol revenue, deliberately subsidized throughput. Deposits growing past $240 million within days, concentrated in Morpho and Ethena strategies farming a 7% incentive. And an 8% rally in HOOD stock on launch, the equity market pricing the option the chain represents.
Read together, the numbers say the launch proved distribution and deferred everything else: the crowd arrived instantly, the crowd was the wrong crowd by the mission’s definition, and the company visibly did not mind, because speculative bootstrap is how every successful chain, Base included, actually started. The figures to watch from here are the boring ones, stock-token volume as a share of activity, collateral composition in the lending markets, deposit retention through incentive step-downs, and they will decide, over quarters rather than weeks, whether the launch statistics were a foundation or a fireworks show.
Fees, economics, and the Arbitrum deal
The chain’s business model is subsidy now, franchise later. Transaction fees are deliberately negligible, roughly $57,000 of protocol revenue against the first week’s 4 million transactions, because the chain is priced as customer acquisition: Robinhood monetizes the surrounding stack, wallet, custody, order flow, spreads, and the eventual financialization of assets its 28 million customers already hold. The structure echoes the company’s zero-commission brokerage playbook precisely.
The launch’s most consequential economic detail belongs to someone else: 10% of Robinhood Chain’s fees flow to the Arbitrum ecosystem, with 8% going directly to the treasury controlled by ARB token holders, confirmation that sent ARB up double digits. The deal matters twice over: it prices Orbit’s chains-as-a-service model with its biggest customer to date, and it sets the template every future corporate chain will negotiate against, the sell-shovels economics underneath the land grab, whose full competitive map this publication has drawn.
One further piece of the economics deserves its own paragraph because it inverts the usual chain-token question: Robinhood Chain has no token, and the company has signaled nothing about one. The network’s fees are paid in ETH-denominated gas, its incentives are paid in dollars and partner tokens, and the value the chain generates is designed to accrue to HOOD equity through the brokerage’s ordinary lines rather than to a new crypto asset. The choice is strategically legible, a token would add regulatory surface exactly where the company has least room, and it makes the chain a useful natural experiment: the corporate-chain model’s economics, tested without the token variable that confounds every other network’s numbers. It also concentrates the ecosystem’s token exposure in unexpected places, ARB through the fee-sharing deal, and the partner protocols’ tokens through their deployments, which is why the launch’s clearest market beneficiaries were assets Robinhood does not issue.
How it compares: Robinhood Chain versus the field
Against Base, the reigning corporate chain, the comparison clarifies both. Base is a general-purpose network that grew an economy organically, memecoins first, then consumer apps, then everything, monetized through sequencer margin at enormous scale; its differentiation is Coinbase’s distribution applied to an open playground. Robinhood Chain is a product-led network: the stock tokens are the anchor tenant, the DeFi roster was recruited around them, and the bet is that one asset class nobody else ships outruns a general platform’s breadth. Base runs on the OP Stack, Robinhood on Arbitrum Orbit, a meaningful choice mostly for the fee-sharing counterparty and the proving roadmap. Against Tempo, Stripe’s payments-first chain, the contrast is anchor product again, payments versus equities, and against the neutral L1s both compete with, the corporate chains share the same offer and the same objection: distribution no neutral chain can match, control no neutral chain would accept.
Where the chain came from: the two-year assembly
The launch’s polish reflects deliberate sequencing worth knowing, because it explains both the chain’s capabilities and its ambitions. Robinhood spent 2025 acquiring the pieces: Bitstamp, one of the oldest crypto exchanges, for trading and institutional infrastructure; WonderFi for Canadian licensing; and the European tokenized-equity pilots, including exposure products on private names like SpaceX and OpenAI, as legal and product rehearsal. Early 2026 brought the quiet phase: a public testnet from February that processed millions of transactions, and the European expansion of crypto perpetuals that became one of the company’s fastest-growing lines. The July launch composed the pieces into one architecture, assets tokenized on its own network, traded through its own wallet and partnered venues, financed through integrated lending, custodied through its own stack, and the composition, more than any single component, is the product: a vertically integrated on-chain brokerage, with each layer feeding the others.
The assembly also explains the chain’s geography. The launch happened in London, the stock tokens ship internationally first, and the European perps expansion runs under MiCA-era rules, because the regulatory groundwork was laid where frameworks exist. The United States, the company’s home market, receives the chain, the wallet, and the crypto products, and waits on the equity tokens until American classification law settles, a sequencing that reads as strange until it reads as strategy: build the global product under workable rules, and let the home market’s framework catch up to a working precedent instead of a proposal.
The honest open questions
Three questions will decide what the chain becomes, and none is answerable yet. Control: a permissionless network whose sequencing, issuance, and flagship interface all route through one regulated broker is decentralized at exactly one layer, and the pressure point regulators or litigants would reach for first is obvious. Liquidity: 24/7 equity trading and stock-collateral lending are only as real as their depth, and week-one depth in the mission assets was thin against the speculative noise; the products exist as listings and must become markets. And law: the geofence paradox, the CLARITY-era classification of the tokens, and the first serious corporate action or exploit on tokenized equities are all uncharted, and each is capable of reshaping the chain’s product overnight.
What is not in question is significance. A top American broker building a public blockchain around real-world assets, and populating it with DeFi’s first tier on day one, is the clearest single marker yet of traditional finance and crypto converging on shared rails, and whichever way the open questions resolve, the experiment’s data, on tokenized-equity demand, on corporate-chain economics, on regulated assets in permissionless systems, will shape what every institution builds next.
A short reader’s guide to following the chain closes the picture, because the story is young and the sources are all public. The chain’s explorer and the standard TVL dashboards carry the activity and deposit series; the incentive programs publish their terms and step-down dates; the stock-token venues report the volumes that measure the mission; and Robinhood’s quarterly disclosures will, over time, reveal what the company chooses to say about economics it is currently subsidizing in silence. The corporate-chain era is being decided by exactly this kind of unglamorous series, retention curves and collateral mixes, not keynotes, and Robinhood Chain, whatever it becomes, has committed to being graded in public. For a technology that spent a decade arguing about whether traditional finance would ever really arrive on-chain, the most informative thing about this chain may simply be its existence: the argument is over, the arrival is operational, and the remaining questions, control, liquidity, and law, are the practical kind that get answered by data, not debate.
And a sizing footnote for perspective: a week after launch, the chain’s deposits already exceeded what most of the previous cycle’s venture-funded L2s gathered in their lifetimes, and its flagship product had transacted less than its accidental memecoin economy, both facts true at once, which is the corporate-chain era in a single sentence.
The chain is a week old; this guide will age accordingly, and its framework, architecture, assets, access, economics, questions, is built to be refilled with each quarter’s numbers.
Disclaimer: This article is for educational purposes only and does not constitute investment advice. Digital asset markets are volatile and you can lose your entire investment. Product availability varies by jurisdiction, and details are current as of July 9, 2026, and changing quickly. Always do your own research.
Frequently asked questions
What is Robinhood Chain in simple terms?
Robinhood Chain is a public blockchain launched by the brokerage Robinhood in July 2026. It is an Ethereum layer 2 built with Arbitrum’s technology, designed for tokenized real-world assets: its flagship product is Stock Tokens, on-chain versions of equities like NVDA and AAPL that trade 24/7 and plug into DeFi applications. Anyone can build on it, and users access it primarily through the Robinhood Wallet.
Is Robinhood Chain its own blockchain or part of Ethereum?
Both, in the way all layer 2 networks are: it executes transactions on its own fast, cheap network, and it posts records to Ethereum, inheriting the base chain’s security for its history. It is built on Arbitrum Orbit, the same technology family as Arbitrum One, and is fully compatible with Ethereum wallets, tools, and smart contracts.
What are Stock Tokens and do they make me a shareholder?
Stock Tokens are Robinhood-issued tokens tracking specific equities, tradable around the clock and usable in DeFi as collateral. They deliver price exposure and pass through dividend economics per their terms, but holders are not shareholders of record: no voting rights, and corporate rights remain with the issuance structure. They are exposure instruments, not shares.
Can US users trade Stock Tokens on Robinhood Chain?
No. Stock Tokens are available through the Robinhood Wallet in more than 120 countries, with availability varying by jurisdiction, and the United States is excluded pending regulatory clarity on how such tokens are classified. US users can access the chain itself, which is permissionless, but not its flagship equity products.
What DeFi protocols run on Robinhood Chain?
The launch ecosystem included Uniswap with a dedicated AMM as core public liquidity, Arcus, a zero-fee stock-token exchange from the dYdX team, 1inch, Rialto, and Lighter for trading and perpetuals, Pleiades as a proprietary market-making venue, and Morpho for lending, where stock tokens can serve as loan collateral. Chainlink provides the oracle and cross-chain infrastructure throughout.
What happens to Stock Tokens when the stock market is closed?
They keep trading. With no live reference price overnight and on weekends, the tokens float on traders’ expectations of the next open and reconverge when the real market resumes, sometimes with sharp gaps if news broke during the closure. Anyone borrowing against stock-token collateral carries that gap risk, since positions can be liquidated against prices that jump at the open.
How is Robinhood Chain different from Coinbase’s Base?
Base is a general-purpose corporate chain that grew a broad economy organically and runs on the OP Stack. Robinhood Chain is product-led: built on Arbitrum Orbit specifically around tokenized real-world assets, with the stock tokens as anchor tenant and a DeFi roster recruited to serve them. Base sells an open playground with Coinbase’s distribution; Robinhood sells an asset class nobody else ships.
Who controls Robinhood Chain?
The network is permissionless to build on and its assets are secured by Ethereum, but Robinhood operates the core infrastructure, including the sequencer that orders transactions, issues the flagship assets, and controls the primary wallet interface. Funds cannot be stolen by the operator, but access, uptime, and ordering depend on it, the standard trade-off of the corporate-chain model.
Disclosure: This article does not represent investment advice. The content and materials featured on this page are for educational purposes only.


As analysts have predicted for July based on historical data, BTC is off to a strong start. The leading digital currency has rebounded from its most recent low of $57,700 to $64,000, a major support and pivot level.
According to the latest CryptoQuant weekly report, bitcoin’s rebound can be attributed to July’s positive seasonality and recovering demand. These factors are likely to contribute to a significant pump before the month runs out.
July Starts Strong, Bitcoin Sees Recovery
To substantiate the claims, CryptoQuant analysts cited past data that showed that the seasonal tailwind is strongest in July during bear markets. July has become bitcoin’s reliable positive month over the last decade. During previous bear cycles in 2018 and 2022, BTC closed the month with 20% and 17% surges, respectively.
So far this month, BTC has risen 11% from its lows of $57,700, trading above $64,000. The positive momentum witnessed in July usually happens regardless of how weak the broader market trend is. Since BTC entered July fresh off a bear market low, there is a higher chance of further upside, thanks to positive seasonality.
Moreover, total bitcoin demand is recovering and has climbed back towards neutral after its sharpest contraction since 2022. Analysts noted a recovery in 30-day total demand metrics after the indicator fell to -650,000 BTC in early June as the asset declined toward $58,000.
“It has since recovered to near neutral, with speculative futures demand turning slightly positive while spot apparent demand contracts at its slowest pace since mid-May. A move back into positive territory would confirm that the demand engine is re-igniting,” analysts explained.
Stronger Demand Still Needed
Furthermore, investor demand in the United States is improving, as seen in the Coinbase Premium Index, which has recovered from deeply negative readings to -0.062. The rebound was aided by BTC rebounding from the $57,000 level. It signals that selling pressure on U.S. trading platforms is easing and institutional appetite is stabilizing.
Unfortunately, market conditions are still extremely bearish despite these recent developments, as seen in the CryptoQuant Bull Score Index hovering at 20, which is the bearish zone. Even though BTC has reached short-term undervalued territory and more price recovery is possible, stronger demand is needed.
In fact, the Bull Score Index needs a reading above 60 for a sustainable rally. Until this happens, every rebound will be treated as a bear-market recovery, not a trend reversal.
The post Bitcoin’s Recovery Gains Momentum, Putting July Off to a Strong Start appeared first on CryptoPotato.

Kevin Warsh’s arrival at the Federal Reserve, renewed geopolitical tensions, and the AI investment boom have pushed stocks, gold, and Bitcoin onto sharply different paths this year, according to a new report from crypto trading firm BIT.
The report argues that investors are no longer responding to a single macro theme, with markets instead swinging between shifting catalysts that have repeatedly changed where capital flows.
Warsh, Iran, and a Fed That Won’t Budge
According to BIT, traditional relationships between equities, gold, and BTC have broken down as investors continuously reprice assets around changing macro narratives.
Its report noted that the S&P 500 has climbed 9% year to date, while gold has fallen 6% and Bitcoin has dropped 31%. Rather than moving together, the three assets have responded differently as expectations around monetary policy, geopolitical events and AI have taken turns dominating investor attention.
BIT traced the first major shift to expectations surrounding Federal Reserve policy. After President Donald Trump proposed Kevin Warsh to lead the central bank, markets abandoned earlier expectations of three interest rate cuts this year and instead began pricing in a more hawkish policy path. The June Federal Open Market Committee meeting reinforced those expectations, keeping pressure on assets that typically benefit from easier liquidity, including Bitcoin and gold.
Then there was Iran, which closed off the Strait of Hormuz following strikes against it by the United States and Israel, sending oil prices jumping and equities falling. Gold also fell, since, according to BIT, markets expected central banks in the Middle East to redirect funds toward financing reconstruction of infrastructure affected by the conflict instead of buying more bullion.
With all that happening, BTC hit a downward patch of its own, dipping below the $60,000 level and breaking what the crypto firm described as its previous resilience during geopolitical crises.
Once the Iran arc cooled, attention then shifted almost entirely to artificial intelligence, with Nvidia’s reported $2 billion stake in Marvell Technology and Anthropic’s annual revenue beating the $30 billion mark, ahead of the $20 billion OpenAI had previously reported. That combination made the AI market’s dominant investment theme, lifting tech shares while drawing capital away from other assets.
Where BIT Thinks This Goes
However, the enthusiasm around AI started fading around June, with what BIT called the “tokenmaxxing” trade losing steam as companies began to notice the true cost of AI tokens, while cheaper open-source models out of China added more pressure.
The report also noted that spot Bitcoin ETFs became heavy sellers during that period, cutting holdings by about $9 billion while BTC itself went from about $82,000 to near $63,000.
Gold, in the firm’s view, is already technically oversold, and Bitcoin is closing in on a cycle bottom somewhere between $50,000 and $55,000. But it believes the current divergence will not last, especially if the September FOMC meeting brings a change in the Fed’s hawkish stance and AI spending demand picks back up while inflation cools. In that scenario, gold, BTC, and AI trades could all turn higher together.
The post Report: AI, Warsh, and Geopolitics Break Bitcoin Correlation With Stocks and Gold appeared first on CryptoPotato.

Michael Saylor, Strategy’s founder and chairman, used social media Sunday to refine how investors should interpret his company’s latest Bitcoin-related messaging. In a post built around a chart from Saylortracker.com, he said the “orange dots” indicate only part of the story—an apparent attempt to frame what markets may be inferring from his prior signals.
That clarification comes as Strategy has shifted from its long-running “never sell Bitcoin” narrative to a more flexible approach. The company has disclosed Bitcoin sales used to support dividends for holders of its STRC preferred stock and to bolster its U.S. dollar reserves. For investors, the immediate question is whether Strategy’s communications reduce uncertainty around the likelihood of further large-scale selling that could weigh on Bitcoin sentiment.
Key takeaways
- Strategy’s recent SEC filing shows it sold $216 million worth of Bitcoin earlier this month, reducing holdings to 843,775 BTC.
- Saylor’s Sunday post—linking “orange dots” to only part of the picture—adds another layer to how traders interpret Strategy’s Bitcoin signaling.
- Standard Chartered’s Geoff Kendrick argues Strategy’s messaging has become “muddy” for Bitcoin near-term, mainly because it complicates expectations around selling.
- Kendrick believes better communication could reassure markets enough that Strategy may not need to sell more Bitcoin to support STRC.
- Strategy’s common shares and STRC preferred shares have both faced pressure over the past year, with the company scheduled to report earnings on July 30.
Saylor’s new “signal” and what it may change
Saylor’s Sunday message, posted alongside a chart from Saylortracker.com, referenced “orange dots” that, he said, “tell only part of the story.” According to the post, the chart is meant to contextualize Strategy’s Bitcoin-related actions and announcements that have historically followed similar social media updates.
In prior cycles, Saylor’s public posts have often been followed by announcements of Strategy Bitcoin purchases—typically the next day. This time, however, the context is different: the market is already reacting to evidence that Strategy is willing to sell Bitcoin when required for funding priorities tied to its preferred equity structure and cash management.
From “never sell” to monetization for dividends and reserves
In recent weeks, Strategy has moved away from a strict “never sell Bitcoin” stance. The company has indicated that selling may be necessary to fund dividends for holders of its STRC preferred stock and to replenish cash reserves.
Earlier this month, Strategy sold $216 million worth of Bitcoin, according to a July 6 filing with the U.S. Securities and Exchange Commission. The filing states that the sale reduced Strategy’s total Bitcoin holdings to 843,775 tokens. Alongside that disclosure, Strategy also earlier laid out a capital framework that authorizes Bitcoin sales as a mechanism to support dividends.
Just days before Sunday’s post, Strategy increased its annual dividend rate on STRC preferred stock to 12% and disclosed that its U.S. dollar reserve had grown to $2.55 billion. Taken together, those changes suggest Strategy is attempting to create a more repeatable funding path for shareholders—one that may involve Bitcoin monetization rather than treating holdings as purely “hold forever” collateral.
Standard Chartered: communications are “muddying the waters”
Standard Chartered’s Geoff Kendrick argued that Strategy’s recent actions—and the way they are being communicated—could be undermining confidence in Bitcoin’s near-term outlook. In a note to clients released on Friday, Kendrick said Strategy’s updated approach is “muddying the waters for BTC near-term.”
Kendrick’s central point is about signaling credibility. He suggested that investors need clarity on how Strategy intends to use Bitcoin to back its STRC preferred stock without implying frequent or “wholesale” selling of BTC. He wrote that effective communication of the new strategy—using Bitcoin to back STRC—is important to reassuring markets that wholesale selling is unlikely, which he said should support Bitcoin prices.
He also made a specific conditional argument: if the messaging works and is interpreted as credible by markets, it could reduce the need for Strategy to actually sell additional Bitcoin by supporting STRC’s price dynamics.
Why the “never sell” narrative is harder to maintain
According to Kendrick, the company’s earlier “never sell” posture limited how its Bitcoin holdings could be used—both operationally and in terms of how the market perceives their purpose. He said the main issue is that “never sell” frames BTC holdings as something the company cannot put to broader financial use, making it harder for investors to interpret changes when they eventually occur.
Kendrick noted that Strategy has sold Bitcoin twice and has announced a BTC monetization program, implying the communications have been shifting for “several months” rather than just recently. For traders, this sequence matters: once markets begin to price in monetization as a regular tool for funding, the burden shifts to management messaging to explain when sales are likely versus when holdings will remain intact.
Even so, Kendrick expects the messaging—and therefore market signaling—will improve, and he anticipates that the clearer communication will improve the outlook for Bitcoin. Standard Chartered continues to maintain a $100,000 year-end forecast for Bitcoin, per the analyst’s note.
Equity pressure ahead of earnings
Strategy’s equity markets have not reflected a smooth acceptance of the narrative shift. Investors who bought into the “Strategy story” have faced losses over the past year, and the preferred stock and common stock structures have both shown stress.
The STRC preferred shares were originally designed to hold a par value of $100, but shareholders saw that par value fall last month to the lowest level since the preferred stock was introduced a year ago. Meanwhile, Strategy’s common shares—trading under the MSTR ticker—have declined sharply. The stock closed at $94.64 per share on Friday, down from a 52-week high of $457.22 and down more than 70% since July 2025.
Looking ahead, Strategy is scheduled to report second-quarter earnings on July 30. Yahoo Finance data cited in the source article points to a consensus expectation of $4.28 per share. Separately, Fintel.io data indicates earnings have missed analyst forecasts in six of the last eight quarters, including a 33.76% negative surprise in the first quarter of 2026.
With the earnings date approaching, investors will likely focus on whether Strategy’s dividend funding plan and Bitcoin sales approach align with the market expectations built around its communications—especially after Sunday’s attempt to clarify what certain chart cues are meant to represent.
For now, the key watch items are how markets interpret Saylor’s “orange dots” framing, whether Strategy’s next disclosures add detail to the monetization plan, and what management signals ahead of July 30—particularly regarding the balance between supporting STRC and minimizing further Bitcoin selling pressure.
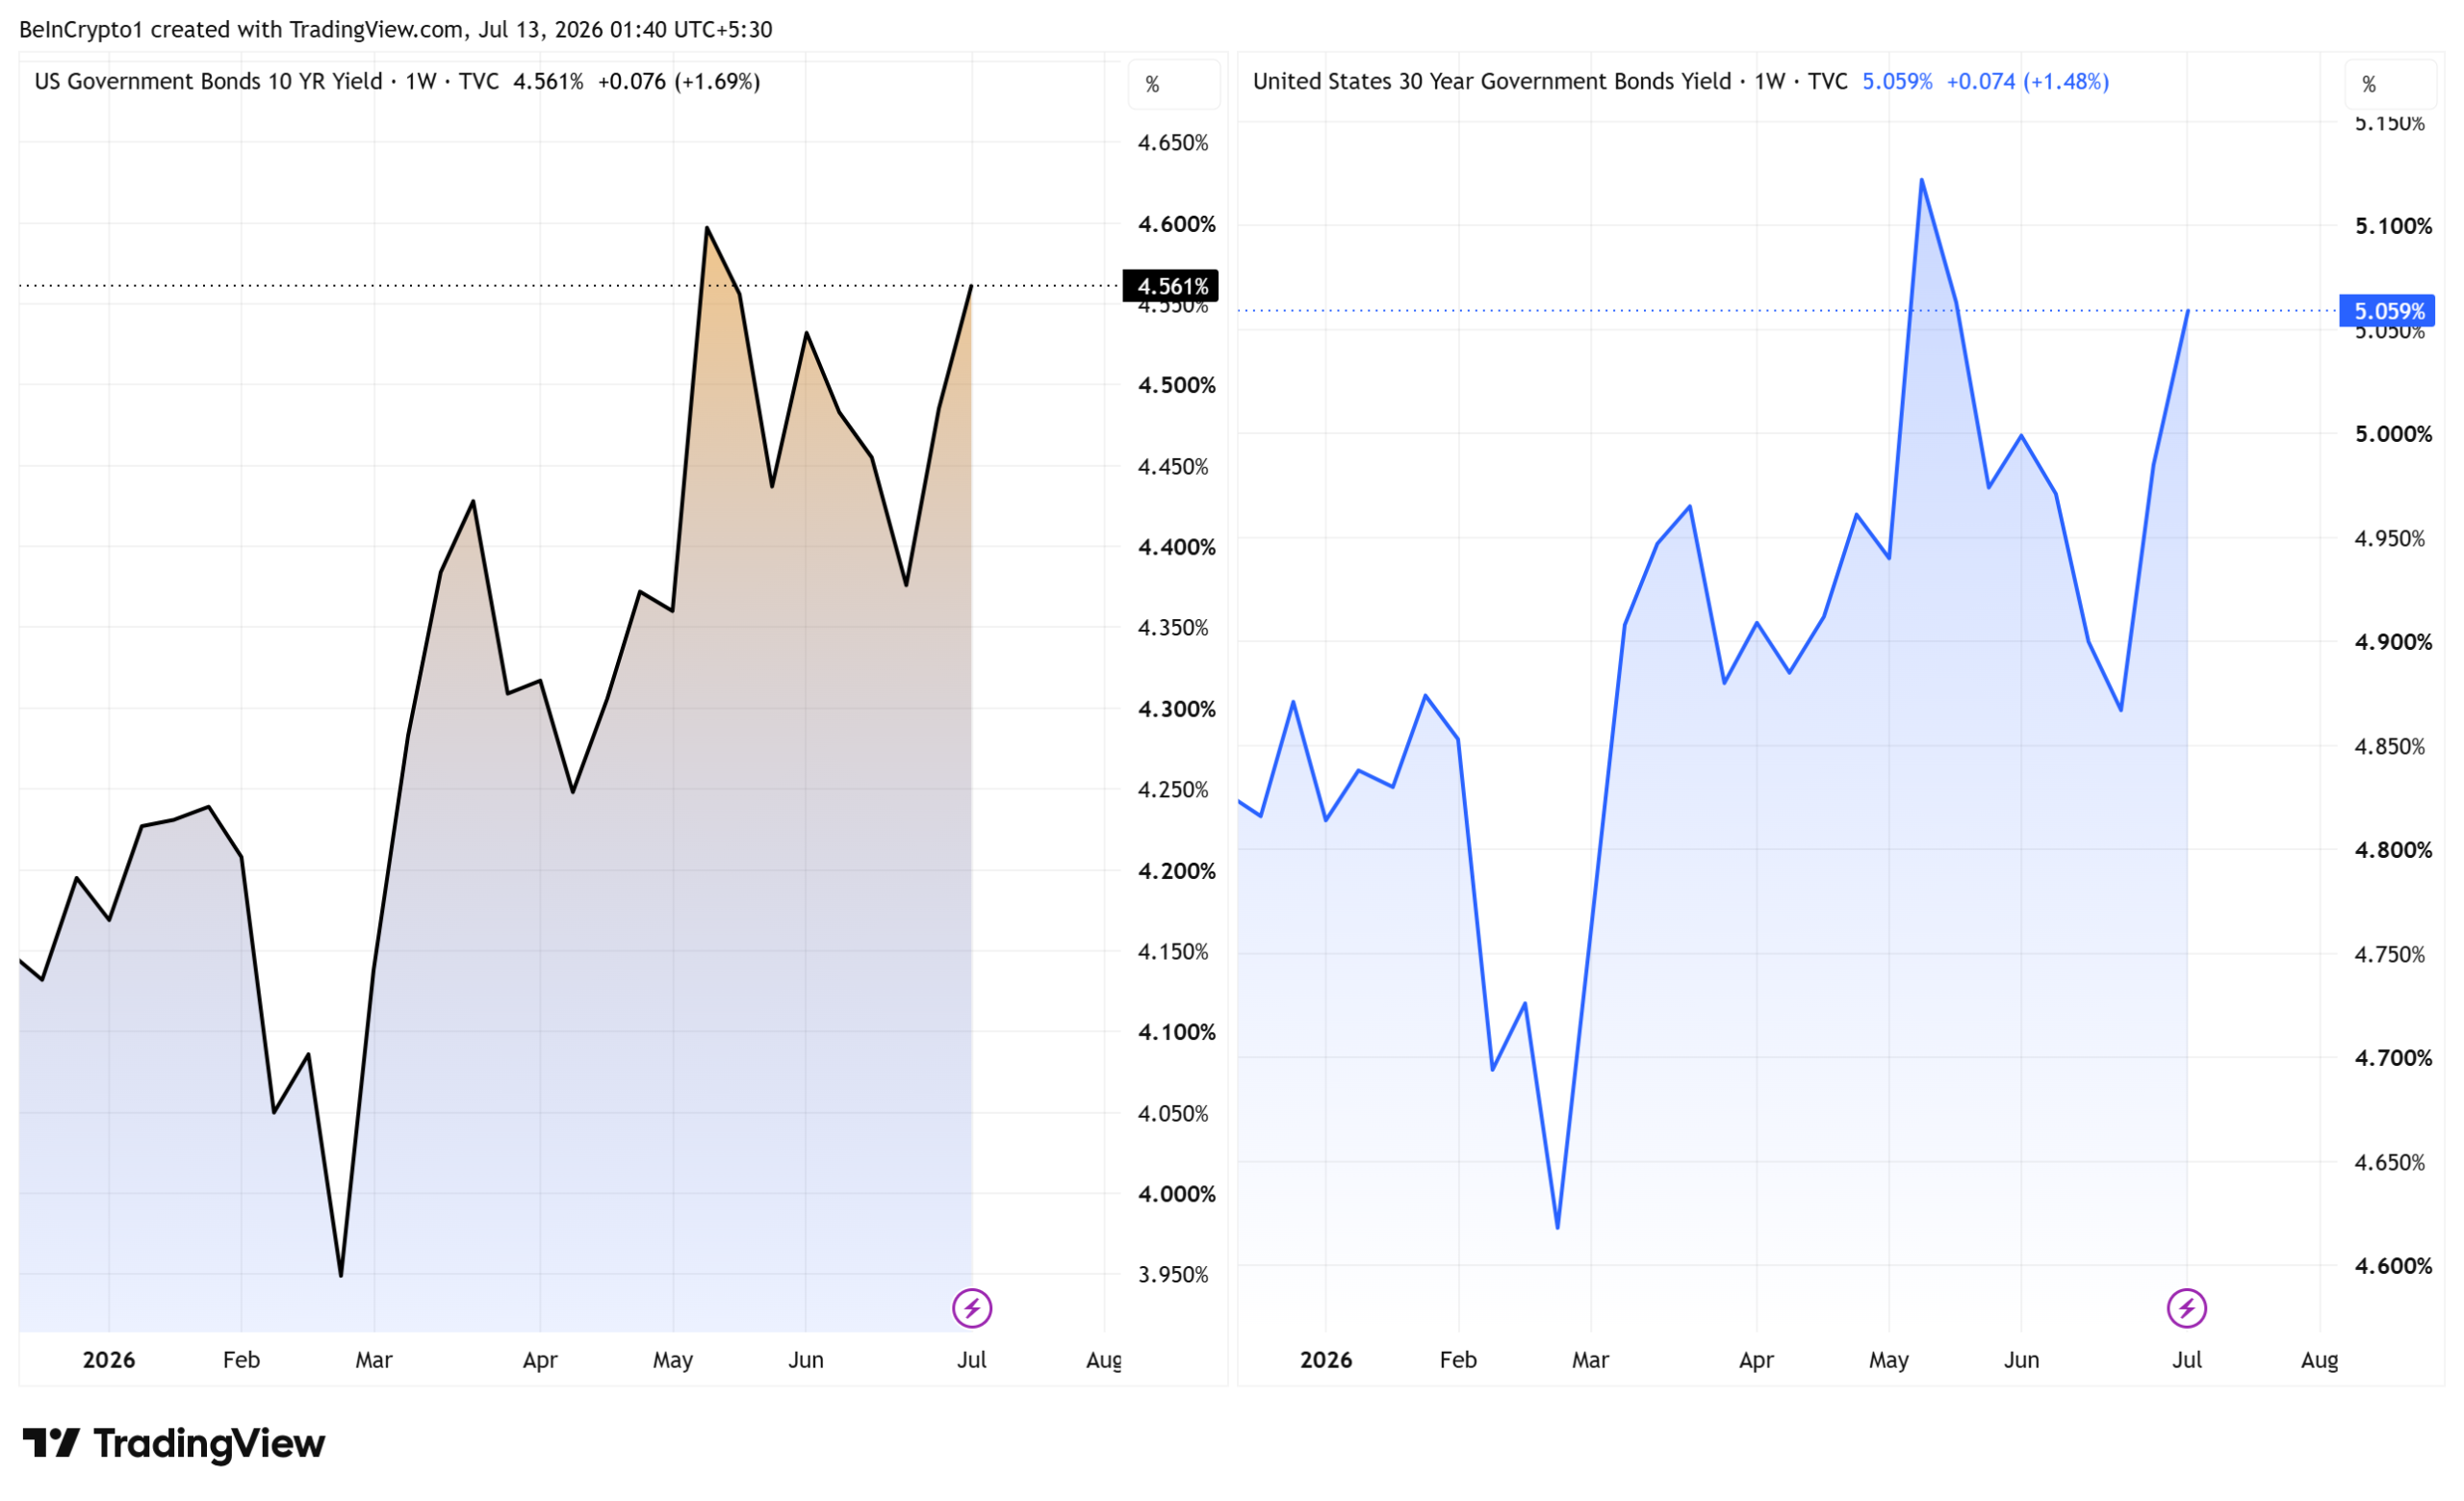
Peter Schiff says the next major market crash will begin in the bond market, not in Bitcoin (BTC). The longtime gold proponent argues that rising U.S. Treasury yields, not crypto volatility, pose the real threat to global markets.
On his latest podcast, Schiff warned that a breakdown in Treasuries could ripple through stocks, housing, and cryptocurrencies. He expects investors to eventually flee into gold as those risk assets unwind together.
Why Schiff Says the Market Crash Starts With Bonds
The warning centers on a bond market that Schiff says has already begun to break. The 10-year Treasury yield sits near 4.5%, while the 30-year has climbed toward 5%, according to Treasury figures. He expects both to head sharply higher.

Rising yields lift borrowing costs everywhere. Schiff argues that this would pressure stocks, deepen a housing affordability problem, and slow growth. The average 30-year mortgage already sits at 6.49%, according to Freddie Mac’s weekly survey, a level that keeps many buyers away.
A deeper housing slump would then force the Federal Reserve to step in, he says. That would mean more money printing and higher inflation.
Both outcomes, in his view, favor precious metals. Gold now trades above $4,100 an ounce, having recovered after it slipped below $4,000 in June.

Why He Says Bitcoin Won’t Be Spared
Bitcoin has held up better than many of Schiff’s critics expected. The token trades near $64,200, with a market cap around $1.29 trillion. Even so, it sits roughly 49% below its record of $126,080 from October 2025.
That drawdown, Schiff argues, already shows Bitcoin does not behave like a safe haven. He expects it to fall further when stocks drop, rather than hold firm like gold.
“Although I believe that when tech stocks go down, Bitcoin will be correlated. It just doesn’t go up when tech stocks go up. But when tech stocks go down, it’s gonna go down a lot more,” he said in the podcast.
He also doubts Wall Street’s public optimism. Major banks still hold bullish Bitcoin targets, yet the weak performance of Strategy’s preferred shares suggests investors privately question those calls.
The strain runs deeper at MicroStrategy itself. Michael Saylor’s firm is the largest corporate holder, with more than 840,000 BTC.

It has started selling Bitcoin to fund dividends on those securities. Schiff has long warned the model would buckle, including a controversial call for a steeper decline to $20,000.
“I do believe that the precious metals market is setting up for a major move up and the stock market is setting up for a major move down,” he stated.
Whether the bond market cracks the way he predicts remains far from certain. Many analysts still expect yields to ease if inflation cools.
In the meantime, however, his thesis hands investors a clear signal to watch. The next few weeks of Treasury moves may test it.
The post Peter Schiff Says the Biggest Market Crash Will Not Start With Bitcoin, But Here appeared first on BeInCrypto.
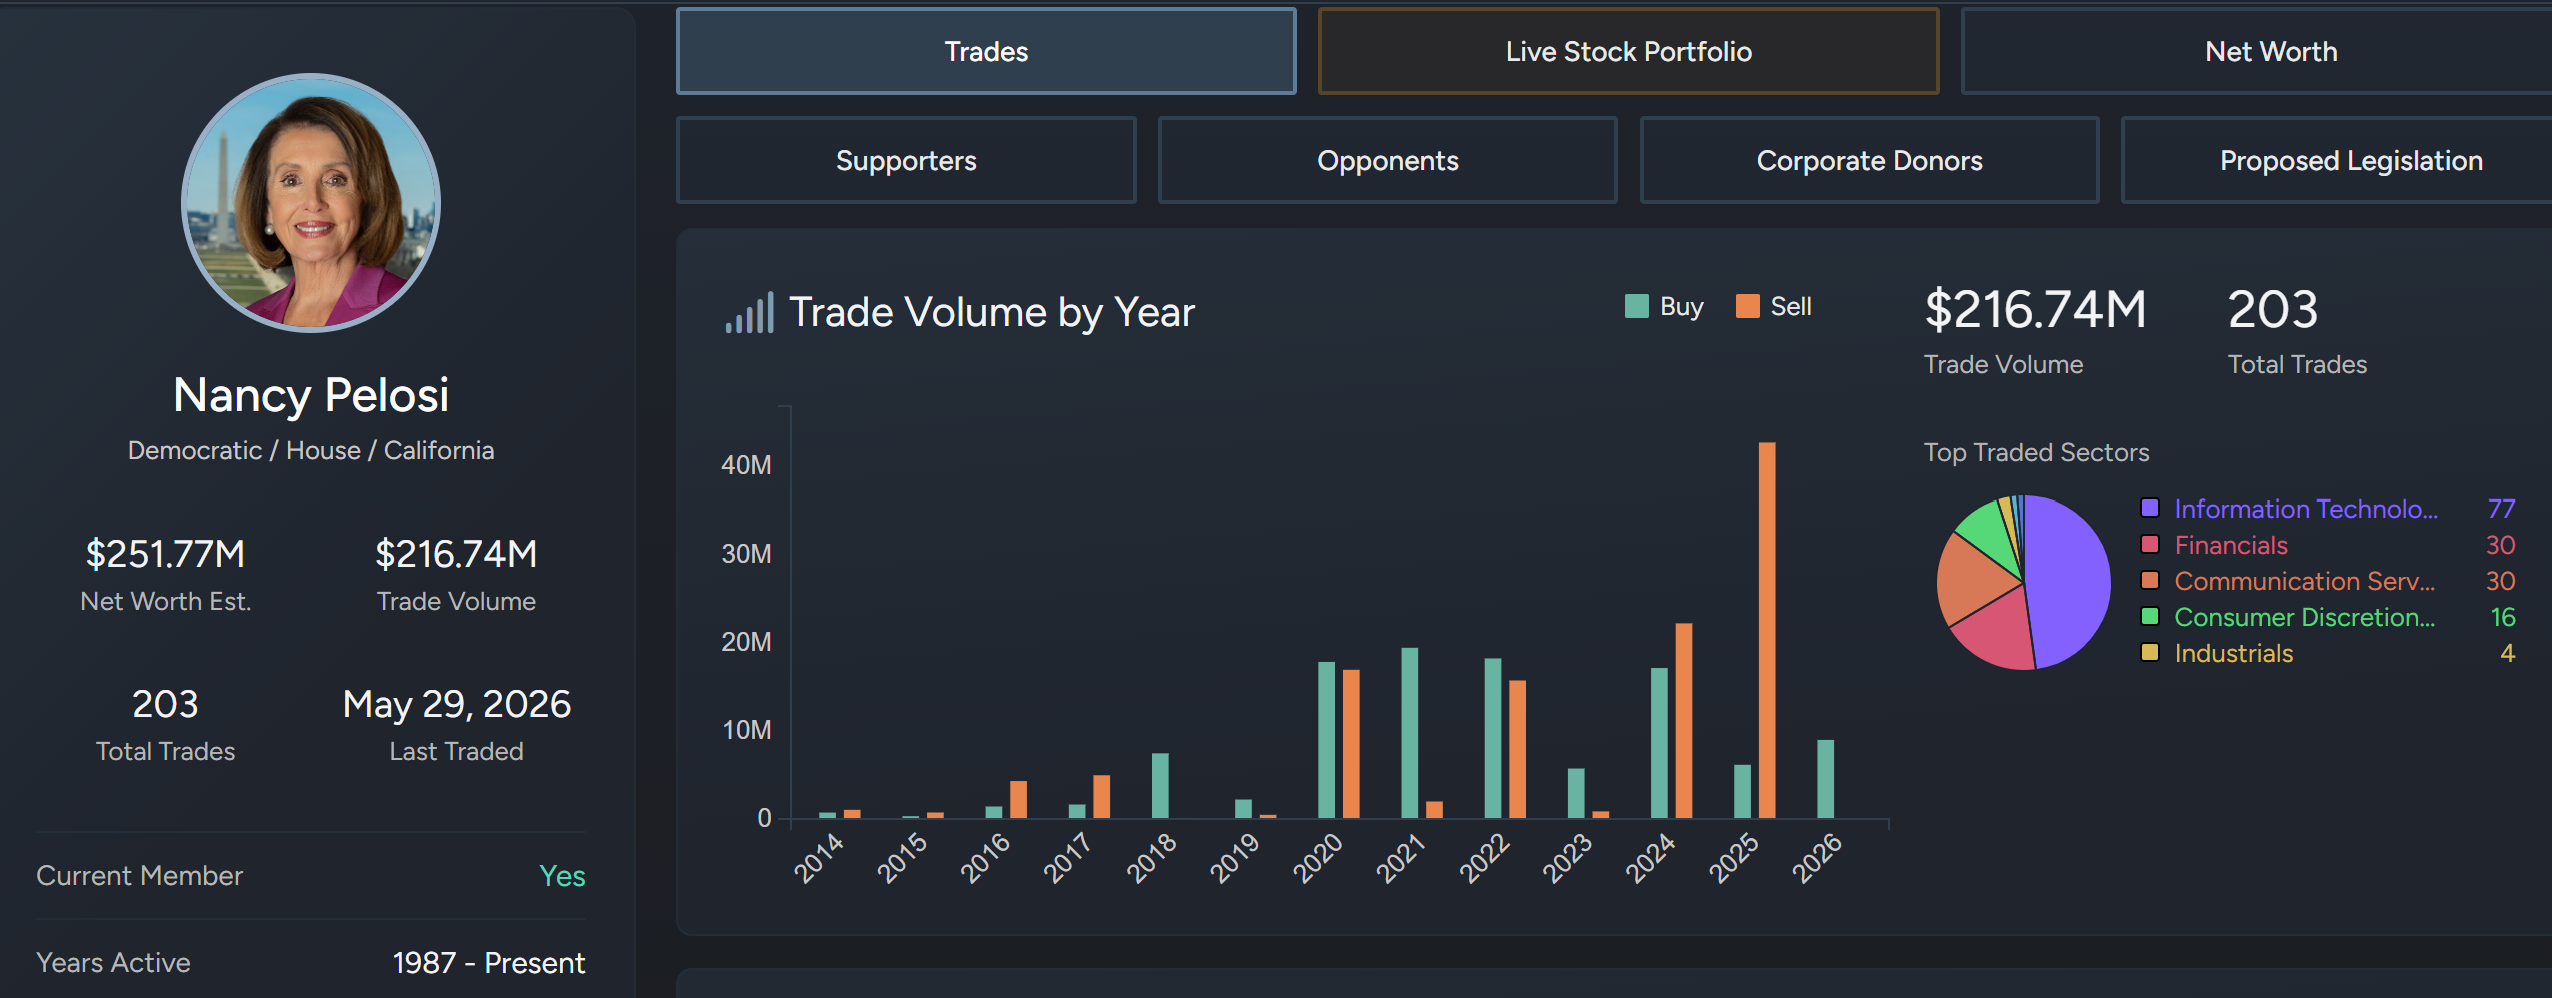
Nancy Pelosi and Cathie Wood rank among the market’s most-watched stock pickers. They time their bets in opposite ways, and a decade of data shows one clearly ahead.
This month made the contrast concrete. ARK bought Circle stock one day before the company won a landmark bank charter.
Pelosi vs Cathie Wood by the numbers
Quiver Quantitative runs a hypothetical “Nancy Pelosi” strategy that rebuilds a portfolio from her family’s disclosed filings. As of mid-July 2026, it had compounded near 21% a year since May 2014.

That figure is a backtest, not a live account, and it recalculates daily. At the same date, the model showed a win rate close to 73% across 731 trades. Its maximum drawdown was near 37%.
ARK’s flagship fund, the ARK Innovation ETF (ARKK), returned about 13.4% annualized since its October 2014 launch. Its total gain since then tops 300%.
On Quiver’s math, the Pelosi backtest more than doubles that figure. It also outpaces the S&P 500 over the same span.

How Paul Pelosi’s Trades Keep Winning
Nancy Pelosi does not place the trades herself. Her husband, Paul Pelosi, a longtime investor, runs the account.
His method is consistent. It centers on call options in large technology companies.
The results have been hard to ignore. In 2024, Pelosi’s portfolio rose about 70.9%, by Unusual Whales’ estimate, against a 24.9% gain for the S&P 500.
The report singled her out as a standout options trader. Even so, only about half of Congress’s active traders beat the market that year.
The edge is not new, either. A 2011 study found a portfolio copying House members’ buys beat the market by about 6% annually. That analysis covered 1985 to 2001.
The evidence is not one-sided, though. A 2022 paper found no proof that members beat the market once the STOCK Act forced disclosure.
There is a catch for anyone hoping to copy it. The STOCK Act lets lawmakers disclose trades as late as 45 days after the fact.
By the time filings appear, the entry price is often gone. Other well-timed congressional stock buys have kept the same debate alive.
ARK’s Transparent Bets and the Circle Call
Cathie Wood built ARK in 2014 and made her name with an early, outsized bet on Tesla. The firm publishes every trade the day it happens and stakes its name on public conviction.
Circle (CRCL) is the latest test. The stock is barely a year old. It closed 168% above its $31 IPO price on its June 2025 debut, then slid.
On July 9, ARK bought about 217,900 Circle shares, worth close to $13.7 million, per its daily disclosures. That day it also sold about $9.8 million of Robinhood stock. One day later, Circle secured final OCC approval to form a national trust bank.
The stock climbed roughly 15% in pre-market trading on the news. Circle CEO Jeremy Allaire framed the charter as a turning point.
“OCC approval to establish Circle National Trust marks a defining step in bringing blockchain technology and digital assets into the core of the U.S. financial system,” Allaire said in the announcement.
Transparency cuts both ways, though. ARKK rode the 2020 growth boom, then lost about 67% in 2022 as rates rose. Circle’s post-IPO swings show how quickly the mood can flip.
The Verdict
The two are not a clean match. One is a concentrated, options-heavy strategy rebuilt from delayed filings. The other is a diversified fund priced in real time.
Both lean on the same technology and crypto themes. That shared tilt powered much of the edge during a long bull market.
On the raw numbers, the Pelosi strategy still wins. Its options leverage, though, is hard for a small investor to copy.
The real divide is access. ARK’s moves are public within hours, while Pelosi’s surface weeks later.
That gap may soon matter less. Pelosi will retire when her term ends in January 2027, which would end one of the market’s most-watched disclosure trails.
Her trades also face a political clock. Senator Josh Hawley’s bill, first branded the PELOSI Act, cleared a Senate committee in 2025. There it was renamed the Honest Act and widened to cover presidents. It would bar lawmakers and their spouses from holding individual stocks.
The pressure is bipartisan. Treasury Secretary Scott Bessent has urged Congress to curb congressional stock trading.
For now, the scoreboard favors Pelosi on returns and Wood on transparency. The next year may decide whether the comparison even survives.
The post Nancy Pelosi vs Cathie Wood: Whose Trades Timed It Better? appeared first on BeInCrypto.

Michael Saylor, the Strategy founder and long-time Bitcoin advocate, posted a new chart on Sunday meant to reinforce how investors should interpret his firm’s latest moves. The message—“Orange dots tell only part of the story”—drew attention because it follows a shift at Strategy toward using Bitcoin to support dividends and maintain cash reserves, an approach that differs from its earlier messaging.
The debate matters for markets because Strategy’s Bitcoin treasury has often served as a proxy for broader institutional demand. But in a note to clients, Standard Chartered’s Geoff Kendrick said Strategy’s evolving communications are “muddying the waters” for Bitcoin in the near term—particularly regarding whether or not the company is likely to sell large amounts of BTC.
Key takeaways
- Strategy’s recent filings and disclosures show a move away from strict “never sell” messaging, including BTC sales to fund dividends and replenish cash.
- Standard Chartered’s Geoff Kendrick argues the company’s market signaling lacks clarity and can weigh on Bitcoin sentiment in the short term.
- Kendrick believes clearer messaging tied to backing STRC with Bitcoin could reduce pressure for wholesale BTC selling.
- Strategy’s STRC preferred shares and common stock have underperformed sharply over the past year, adding pressure ahead of its July 30 earnings report.
Saylor’s latest post and the question of what investors should infer
Saylor’s Sunday post shared a chart via Saylortracker.com, continuing a pattern in which similar messages have preceded announcements of Strategy’s Bitcoin purchases. In this case, however, the context is different: Strategy has recently signaled that Bitcoin may be sold when needed for shareholder dividends and corporate liquidity.
According to a July 6 filing with the U.S. Securities and Exchange Commission, Strategy sold $216 million worth of Bitcoin earlier this month. The filing also states that the company’s total holdings declined to 843,775 tokens.
That development comes after Strategy introduced a capital framework earlier in the month that contemplates Bitcoin sales as part of funding dividends. The same initiative included an increased annual dividend rate on Strategy’s STRC preferred stock to 12% and reported U.S. dollar reserves of $2.55 billion.
Standard Chartered: the “never sell” story is no longer straightforward
In Standard Chartered’s view, the central issue is not only what Strategy does, but how investors interpret what it does. Kendrick argued that Strategy’s older “never sell” framing limited how the market could understand—and therefore price—the economic role of its Bitcoin treasury.
“The problem with the ‘never sell’ approach is that it limits what MSTR’s BTC holdings can do—or, perhaps more importantly, what they are perceived to be doing,” Kendrick wrote in a Friday client note. He added that Strategy has already begun changing how it communicates this strategy in recent months, pointing to two BTC sales and the disclosure of a BTC monetization program.
Kendrick’s concern is that ambiguous signals may cause near-term uncertainty about whether BTC sales are an infrequent backstop or an ongoing feature of the business model. That ambiguity can, in turn, affect how investors gauge Bitcoin’s near-term demand picture, especially when Strategy is viewed as one of the most prominent corporate Bitcoin holders.
Why the messaging shift could still matter for Bitcoin prices
Despite his critique, Kendrick also suggested there could be a constructive path forward if Strategy communicates more clearly how STRC’s structure connects to Bitcoin economics. In his note, he said the market needs reassurance that wholesale selling is unlikely.
He argued that “effective communication” of Strategy’s new approach—specifically using Bitcoin to back STRC—could help remove the market’s incentive to assume large-scale sales are the only way the dividend mechanism works. Kendrick said that if the signaling is effective, it should support Bitcoin prices, and it may even reduce the need for Strategy to sell BTC by helping maintain STRC’s value through price support.
Standard Chartered also reaffirmed that it maintains a $100,000 year-end forecast for Bitcoin, though the bank framed the immediate concern as about interpretation and clarity rather than a direct change to its outlook.
Strategy shares face pressure ahead of earnings
Investors who have followed Strategy’s Bitcoin narrative have not been met with a smooth ride. The STRC preferred shares were initially structured with a $100 par value, but that par value effectively fell out of focus last month, reaching the lowest level since the preferred stock was introduced a year ago.
Meanwhile, Strategy’s common shares (trading under the MSTR ticker) have declined dramatically over the past year. The stock closed at $94.64 per share on Friday, according to the article’s figures, down from a 52-week high of $457.22—representing more than a 70% loss since July 2025.
With expectations also a concern, Strategy is scheduled to report second-quarter earnings on July 30. Consensus for earnings per share is $4.28, based on Yahoo Finance data. The company has missed analyst forecasts in six of the last eight quarters, Fintel.io data shows, including a 33.76% negative surprise in the first quarter of 2026.
For traders and long-term investors alike, the combination of earnings risk and evolving treasury policy is likely to keep attention on both Strategy’s disclosures and the way Saylor frames them publicly—especially after Sunday’s chart post reminded markets that interpretation remains contested.
Going forward, readers should watch whether Strategy’s next communications become more explicit about how its Bitcoin-backed dividend strategy reduces the likelihood of large sales, and whether the July 30 earnings report offers additional signals on cash flows and execution—areas that could sharpen the market’s understanding of the “orange dots” narrative.


South Korea’s crypto trading volume hit a two-year low, dropping below 10 trillion won ($6.7 billion) for the first time since September 2023.
The slump coincides with a dramatic collapse across the country’s stock markets.
Is South Korea Losing Its Crypto Market?
Trading volume measures the total value of assets bought and sold across exchanges over a set period. Weekly volume across South Korea’s five main fiat exchanges hit a two-year low, signaling a sharp cooling in overall market activity.
The five platforms include Upbit, Bithumb, Coinone, Korbit, and Gopax. In the week of July 3 to July 10, combined volume reached roughly 9.97 trillion won ($6.65 billion). Furthermore, that marks a 25.75% drop from the prior week’s 13.4 trillion won total ($8.9 billion).
The decline deepens over time. The current volume is about 43.5% below early June levels, according to WuBlockchain.
It marks the fifth consecutive weekly drop, reflecting a broad retreat in retail speculation nationwide.
Follow us on X to get the latest news as it happens.
Structural challenges add to the pressure. During the first quarter of 2026, combined volume had already fallen notably, with Bithumb dropping over 30%.
Furthermore, an operational error at Bithumb earlier this year damaged trust among cautious retail investors.
Tighter regulation compounded the caution. New limits on exchange ownership stakes reinforced a defensive mood. Consequently, many retail traders pulled back from the major platforms, deepening the multi-week slide in overall trading activity.
Why Are Crypto and the KOSDAQ Falling Together
The synchronized decline is no coincidence, given how South Korean investors move between tech stocks and crypto. Many traders speculate across both markets, so a decline in risk appetite in one quickly spreads to the other.
The KOSDAQ index has crashed 31% over the past 9 weeks, erasing nearly a full year of gains. That correction rivals the 2020 crash, when it fell 32% in five weeks.
Meanwhile, the KOSPI dropped 20% over three weeks, entering technical bear-market territory.
The AI trade sits at the center of the turmoil. Optimism around artificial intelligence is fading, especially after doubts over chip and semiconductor spending. Samsung and SK Hynix, along with leveraged ETFs, account for over 70% of traded market value, amplifying volatility.
Regulators are now watching closely. South Korea’s finance minister announced tighter oversight of leveraged single-stock ETFs, acknowledging the sector’s risk concentration.
As a result, that intervention adds pressure and pushes capital toward more defensive positions.
Analysts see the contraction as a reallocation, not an exit. Some activity may be migrating toward smaller platforms, DEXs, or traditional assets.
However, lower liquidity on major exchanges means wider spreads, higher volatility, and pressure on platform fee revenue.
The post South Korea Crypto Volume Hits a Two-Year Low Amid the KOSDAQ Crash appeared first on BeInCrypto.
Ethereum has continued its recovery from the June lows and is now approaching a major technical inflection point. While the recent rally has improved short-term sentiment, the asset is still trading beneath a confluence of long-term resistance levels.
Interestingly, the liquidation landscape aligns closely with these technical barriers, suggesting that ETH could first target overhead liquidity before the market decides whether a larger trend reversal is underway or another corrective leg lower remains ahead.
Ethereum Price Analysis: The Daily Chart
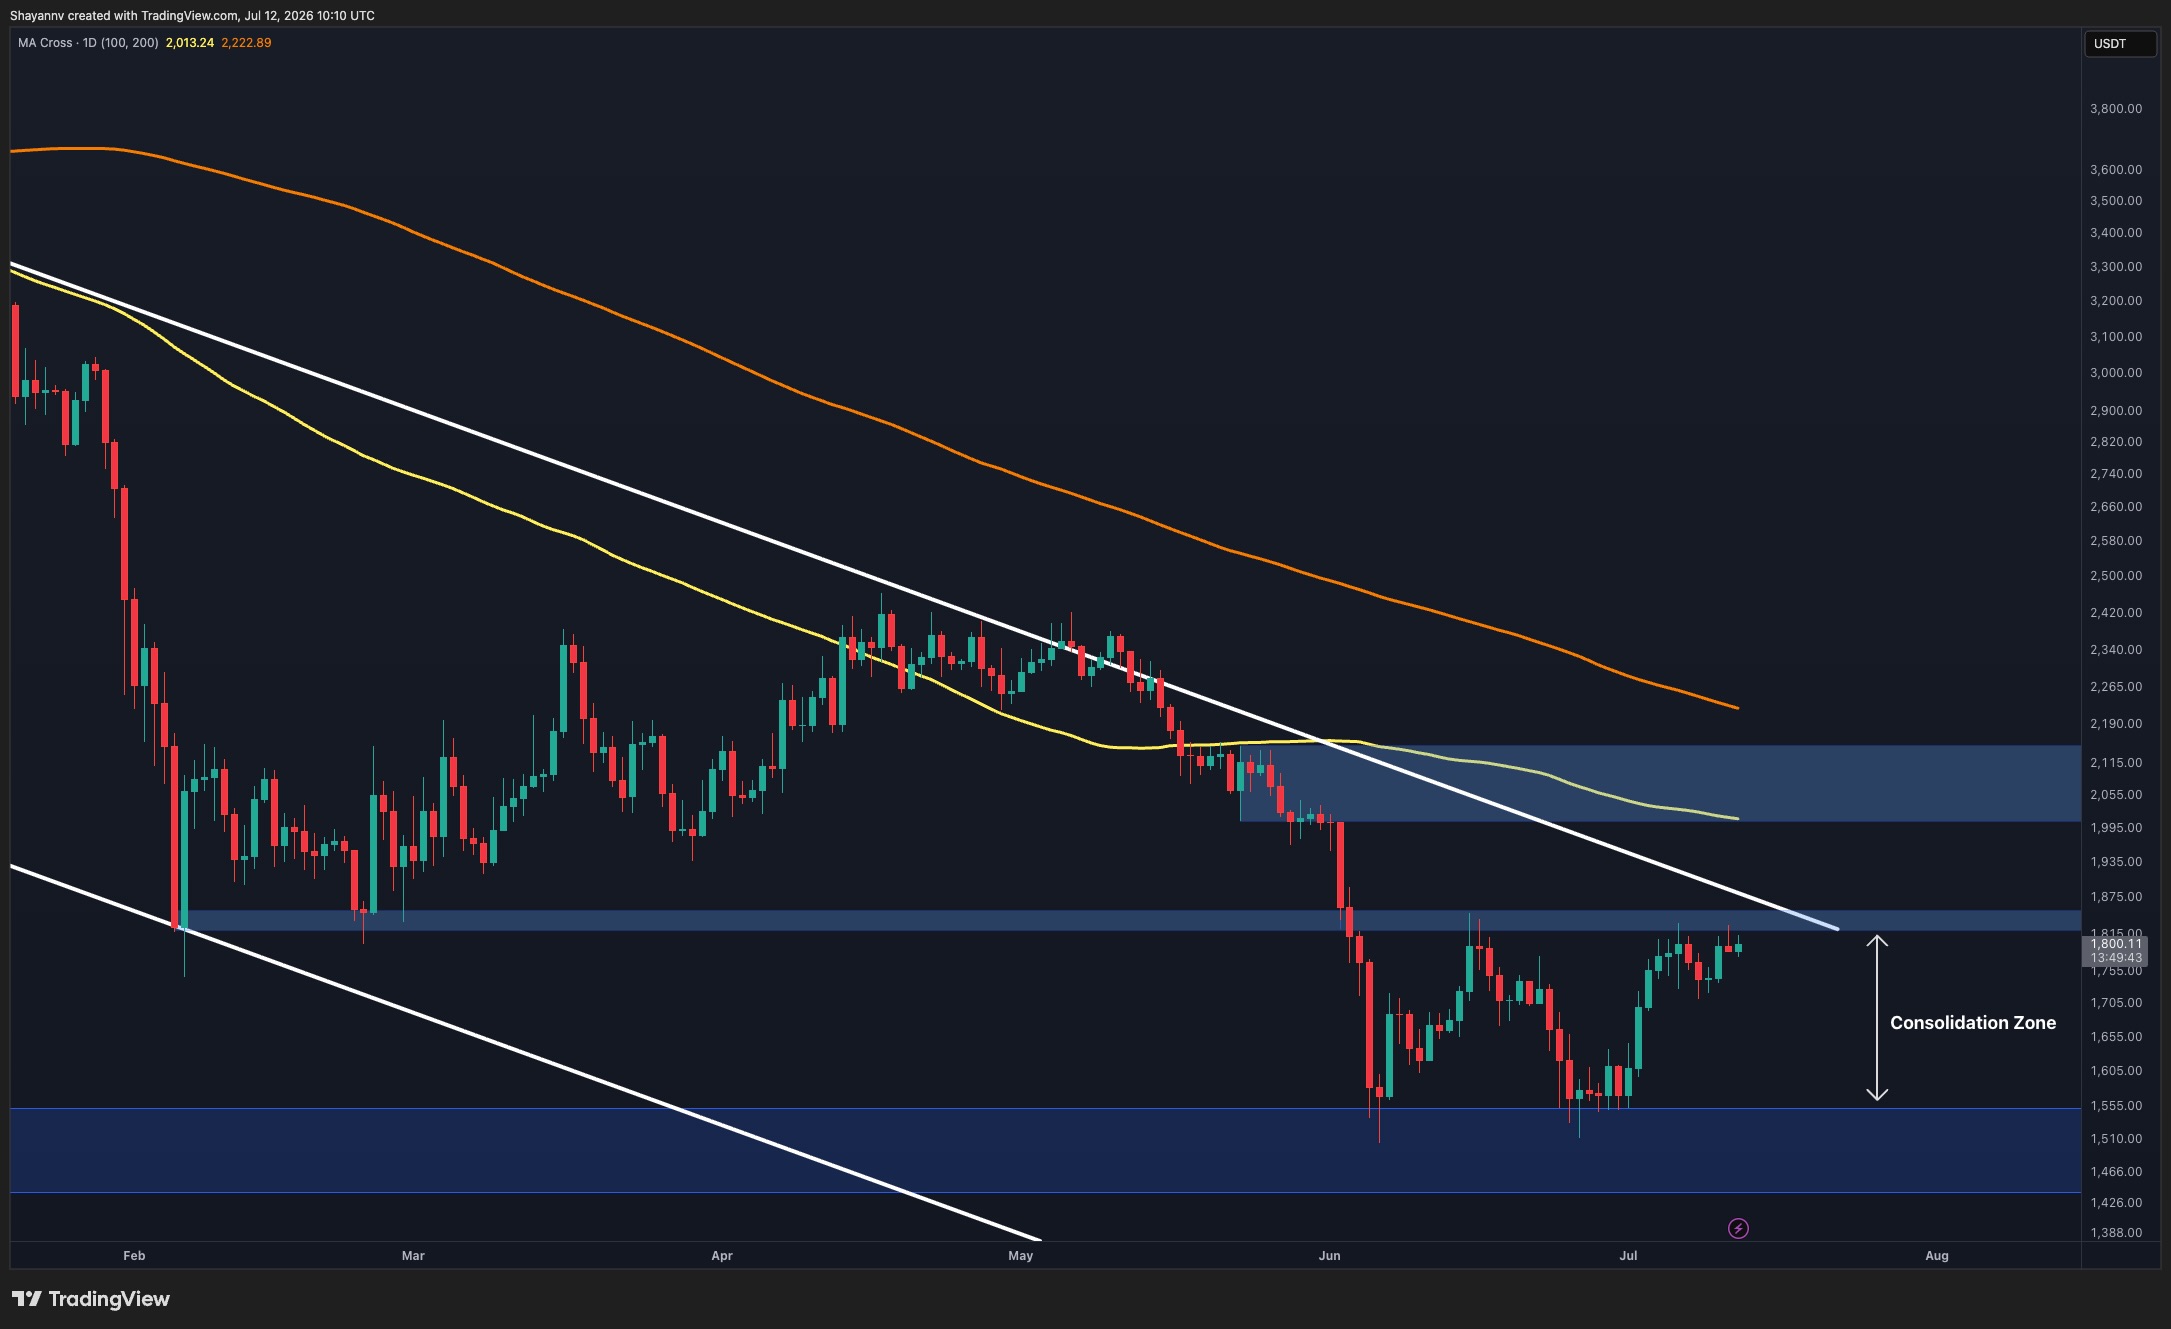
On the daily timeframe, ETH remains within a broader descending structure in place since the beginning of the year. It has recovered strongly from the major demand zone around $1.45K-$1.55K and is currently testing the key resistance region around $1.80K-$1.85K.
This area is particularly significant because it coincides with the descending trendline that has capped price action since May. The level also represents a major horizontal resistance that previously acted as support before the June breakdown.
Despite the recent strength, ETH remains below the 100-day and 200-day moving averages, both of which continue to trend lower. The 100-day MA is positioned around the $2K-$2.1K resistance zone, while the 200-day MA remains considerably higher near $2.2K, reinforcing the broader bearish market structure.
As long as ETH remains below the descending trendline and the $1.80K-$1.85K resistance zone, the current move can still be viewed as a recovery rally within a larger downtrend. A decisive breakout above this area would shift focus toward the next major resistance at $2K-$2.1K.
ETH/USDT 4-Hour Chart
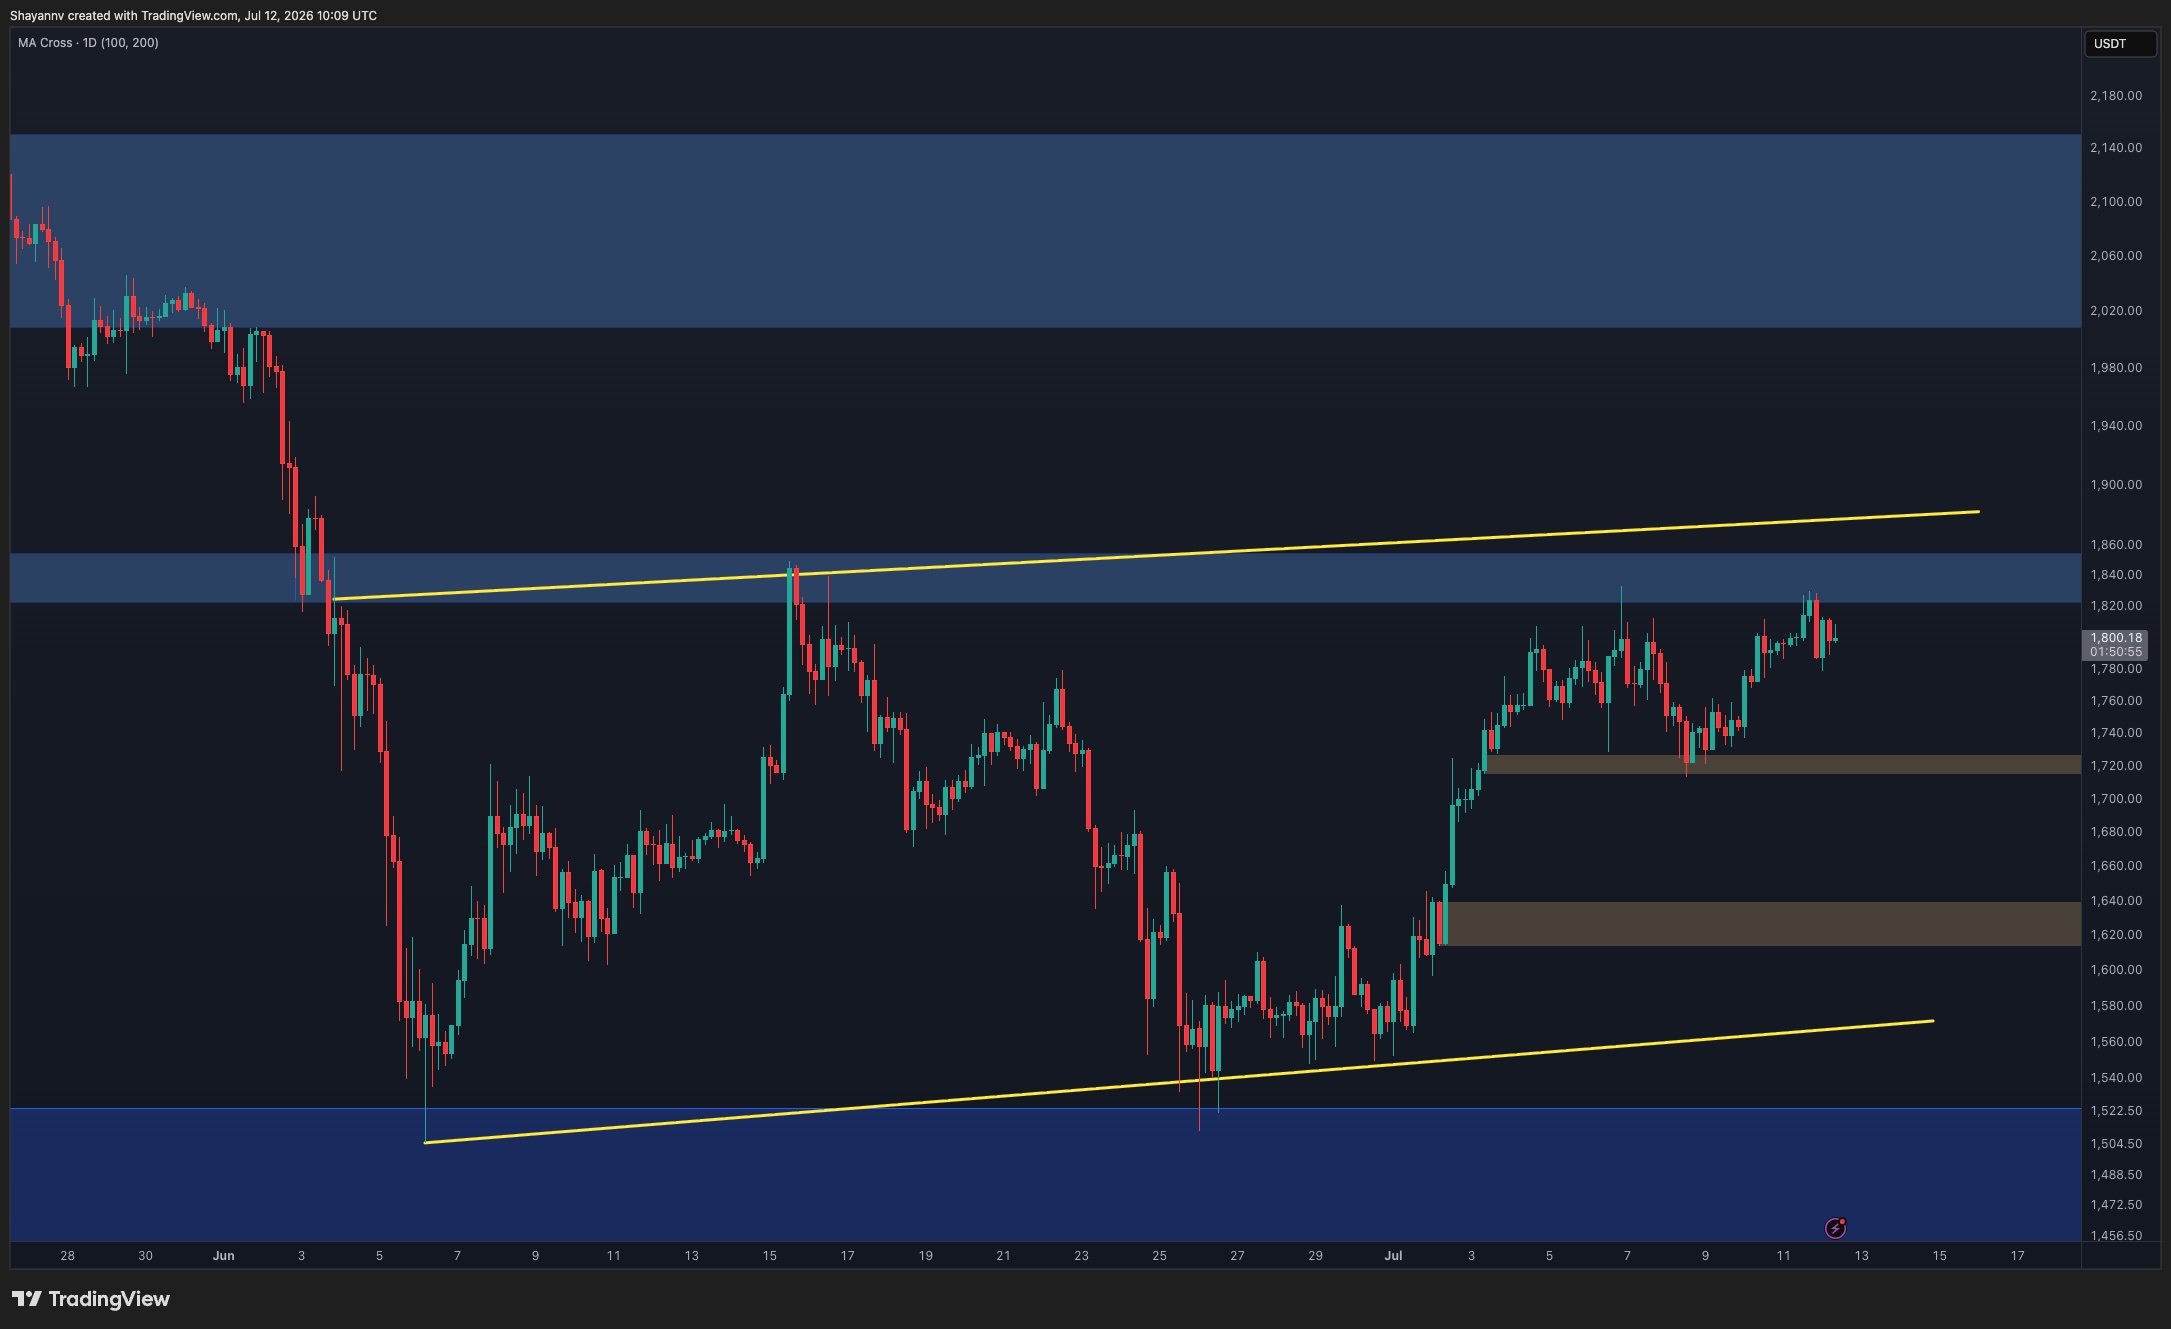
The 4-hour chart highlights a clear ascending structure that has developed since the late-June low. Price has respected the rising channel boundaries while forming higher highs and higher lows, reflecting improving short-term momentum.
The market has already reclaimed the $1.62K-$1.64K demand zone and subsequently established another support area around $1.72K-$1.74K. These zones have repeatedly attracted buyers during pullbacks and continue to define the short-term bullish structure.
However, the rally is now approaching the upper boundary of the channel and the major resistance band around $1.83K-$1.85K. This creates a natural area where profit-taking and seller activity could emerge.
From a structural perspective, ETH remains constructive above the $1.72K-$1.74K support region. Losing this level would be the first sign that bullish momentum is fading and could expose the lower channel boundary and the broader support zone around $1.55K.
Sentiment Analysis
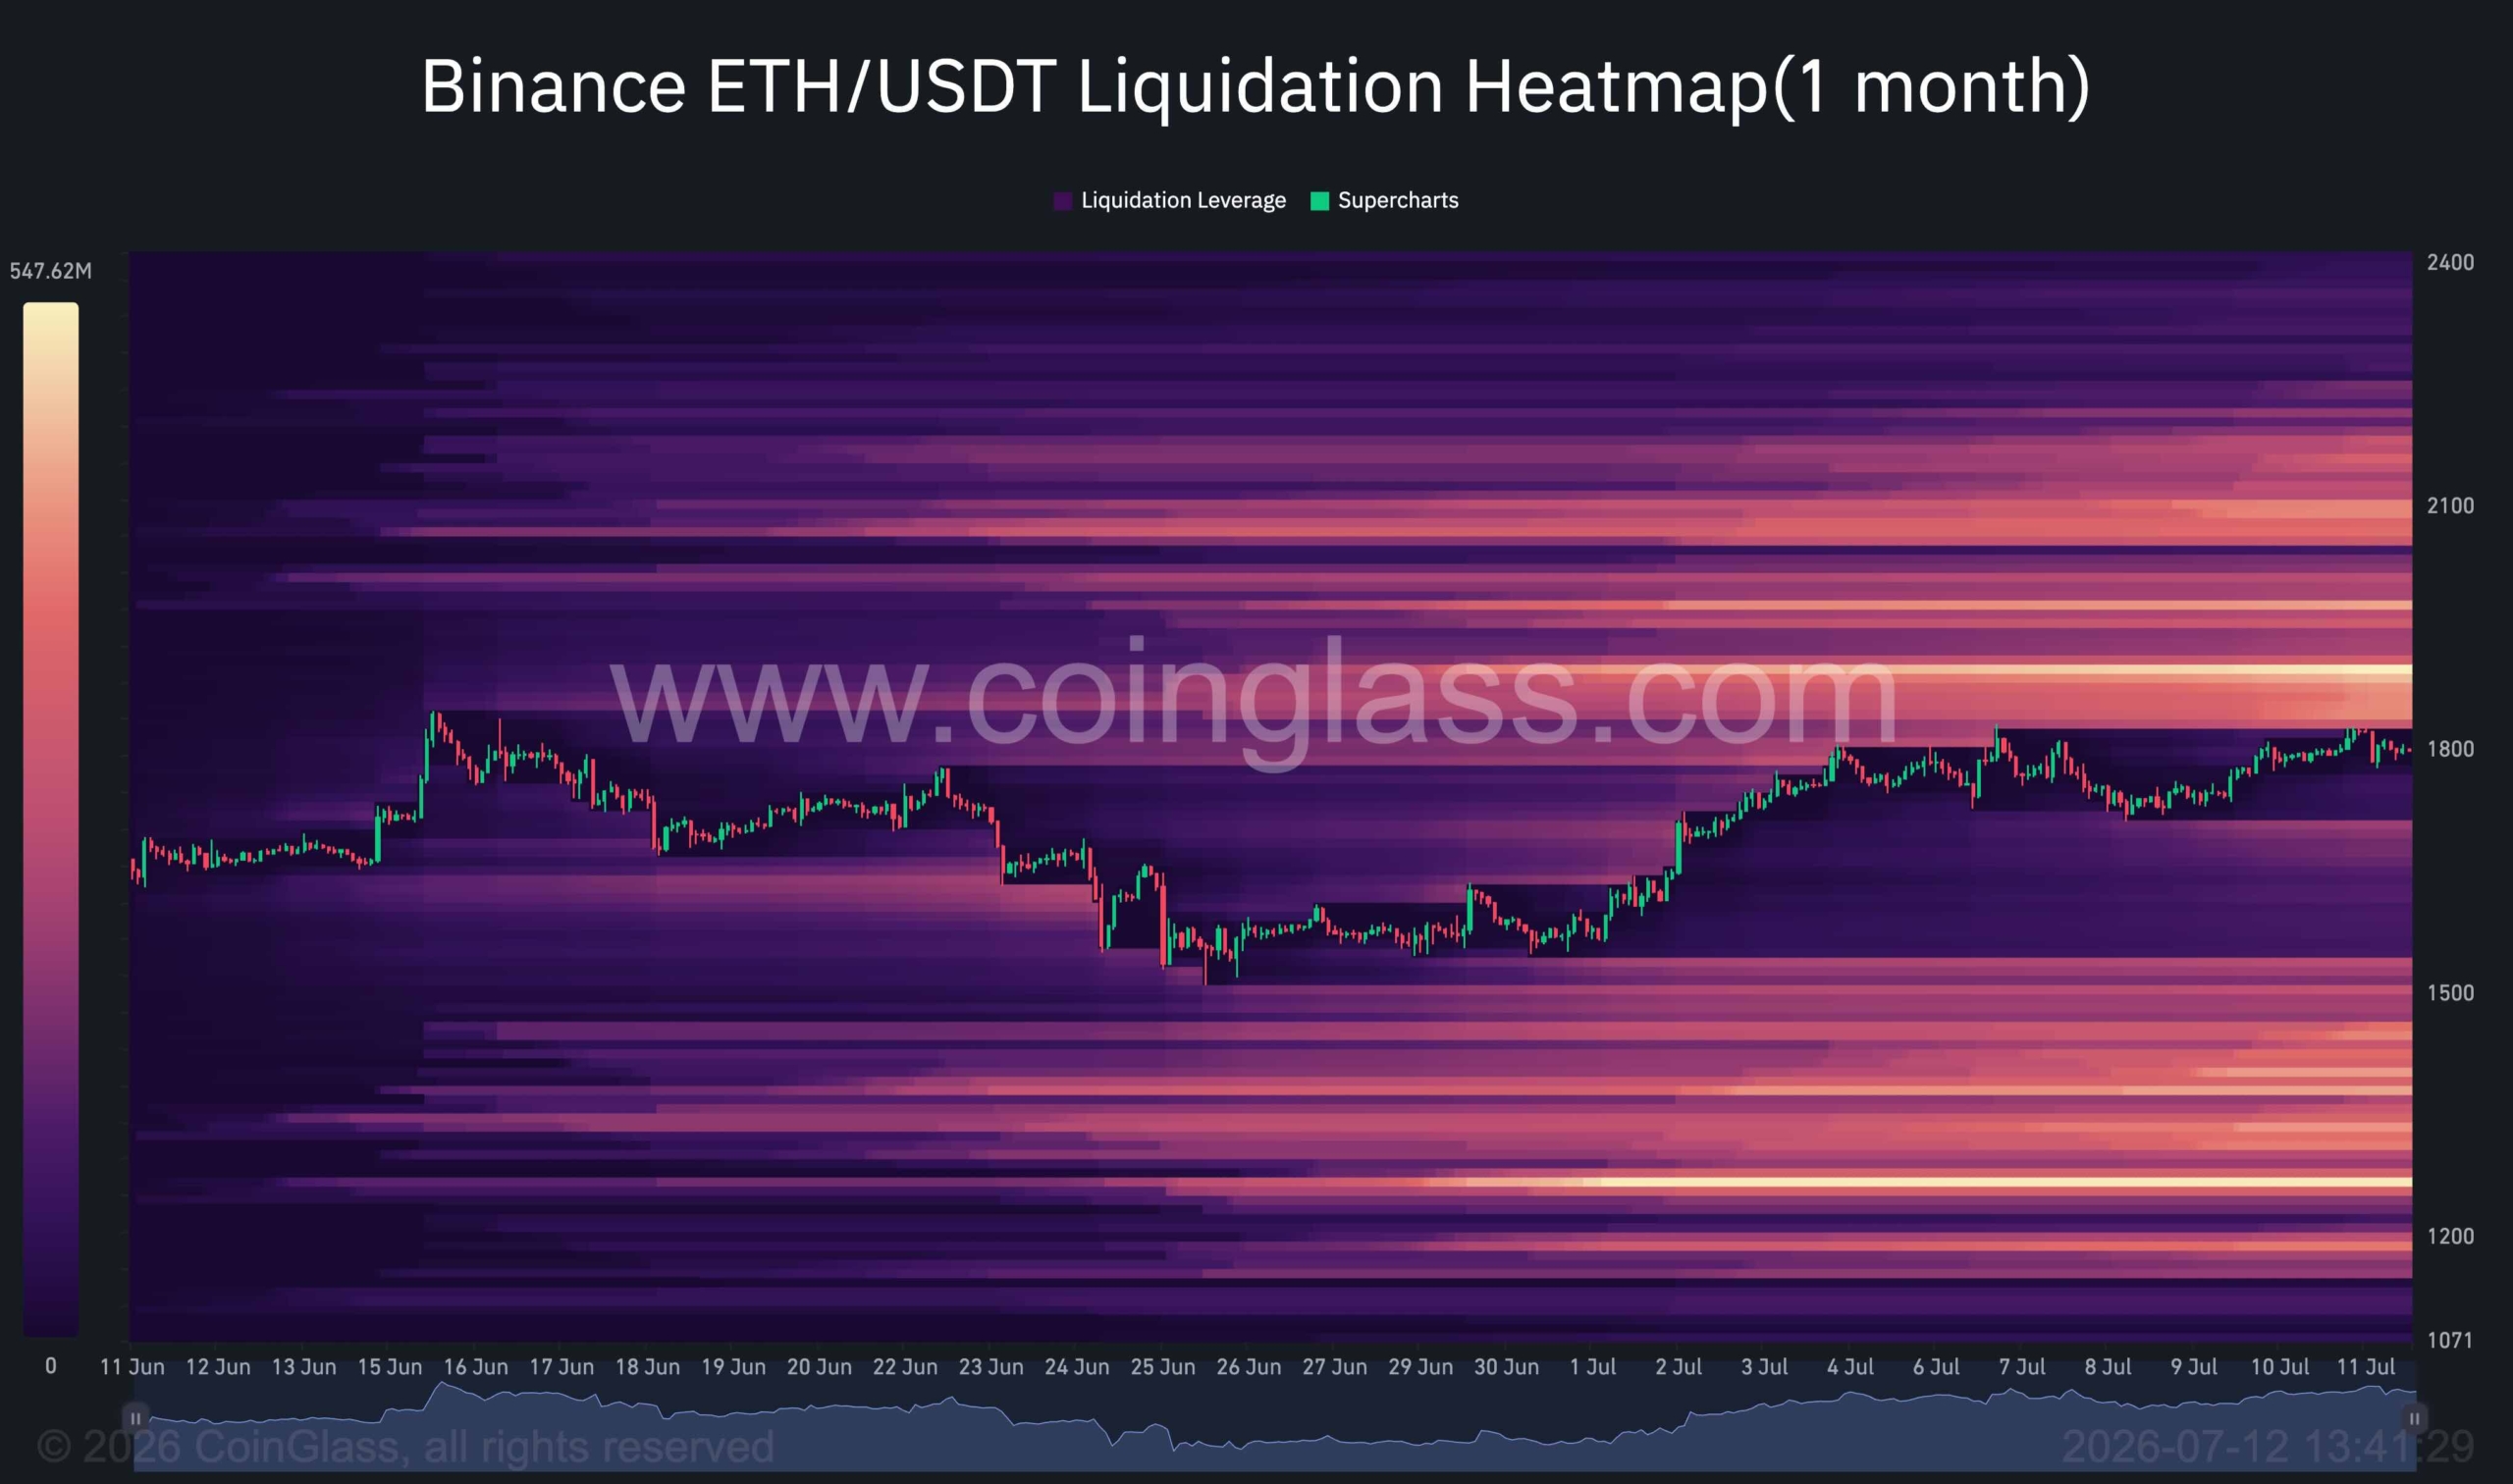
The Binance ETH/USDT liquidation heatmap provides an important clue regarding the next likely move.
The most significant concentration of short-side liquidity sits above the current market price, particularly within the $1.95K-$2.1K region. This cluster aligns remarkably well with the daily chart resistance zone, the 100-day moving average, and the broader supply area visible on the higher timeframe.
Meanwhile, substantial liquidity pools remain below the market around the $1.45K-$1.55K region, which corresponds closely with the major daily demand zone that has supported ETH throughout the recent recovery.
The alignment between the liquidation map and the technical structure suggests that the market may first be drawn toward the overhead liquidity cluster. A move into the $2K-$2.1K area would effectively sweep a large concentration of short liquidations while simultaneously testing one of the most important resistance zones on the chart.
The reaction at that region will likely determine the next major directional move. If buyers manage to reclaim the $2K-$2.1K resistance area and establish acceptance above it, the recovery could evolve into a broader bullish trend reversal. However, if the liquidity sweep is followed by strong selling pressure and rejection from resistance, ETH could enter another notable decline, potentially targeting the large liquidity pools resting beneath the market around the $1.45K-$1.55K support zone.
The post Ethereum Price Analysis: ETH Reaches Its Biggest Obstacle on the Road to $2K appeared first on CryptoPotato.
Strategy founder and chairman Michael Saylor again took to social media on Sunday to offer his latest signal to investors as one analyst sees Saylor’s messaging as needing more clarity to help Bitcoin regain its momentum.
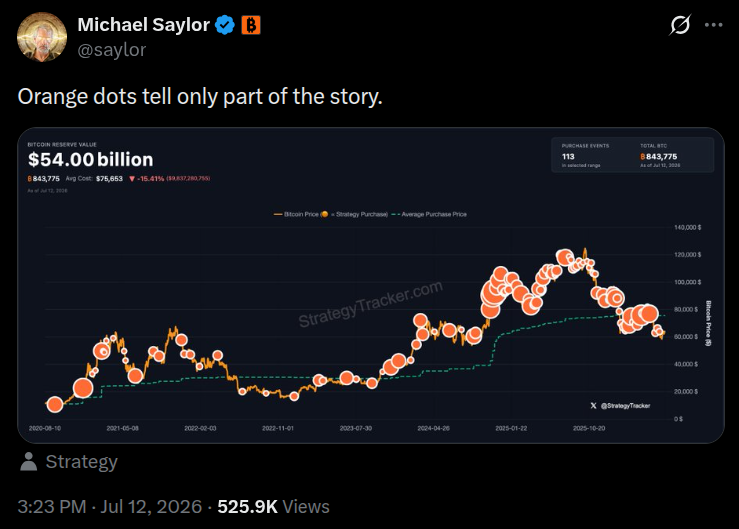
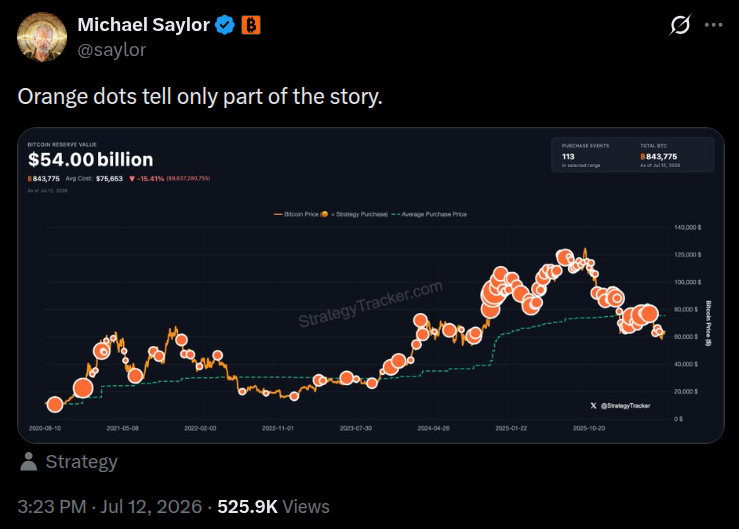
“Orange dots tell only part of the story,” was Saylor’s message on Sunday in a post that accompanied a chart from Saylortracker.com, similar to previous social media messages that have preceded news of Strategy’s Bitcoin (BTC) purchases, typically announced the day after his posts.
In recent weeks, the largest digital asset treasury company and a major BTC holder, has moved away from its long-time “never sell Bitcoin” approach to a willingness to sell the biggest crypto as needed to fund dividends for holders of its STRC preferred stock and to replenish its cash reserves. Earlier this month, Strategy sold $216 million worth of Bitcoin, reducing its total holdings to 843,775 tokens, according to a July 6 filing with the US Securities and Exchange Commission.
“Orange dots tell only part of the story.” Source: Michael Saylor
Days earlier, Strategy unveiled a capital framework allowing Bitcoin sales to fund dividends, increased the annual dividend rate on its STRC preferred stock to 12%, and disclosed that its US dollar reserve had grown to $2.55 billion.
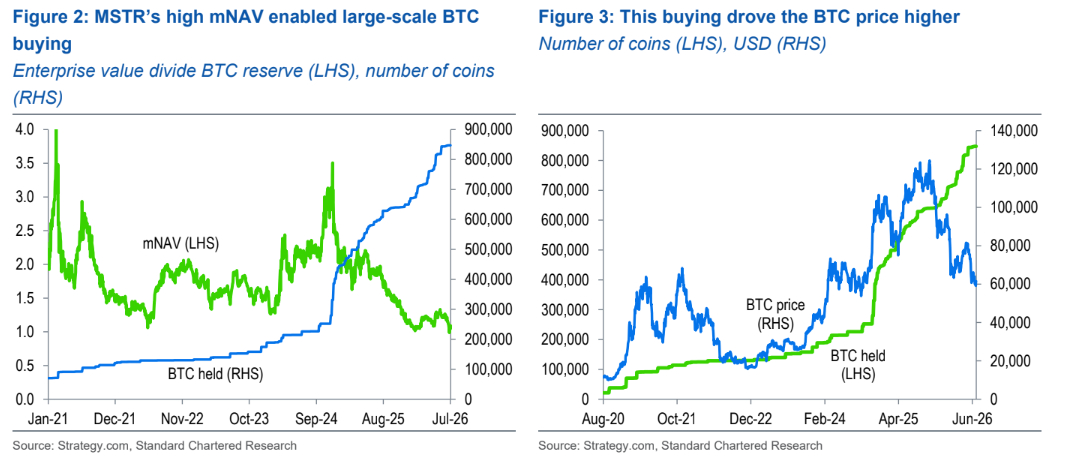
Standard Charter’s global head of digital assets research, Geoff Kendrick, believes recent Strategy’s actions — and Saylor’s manner of communicating them — “are muddying the waters for BTC near-term.”
“We think effective communication of MSTR’s new strategy (using BTC to back STRC) is key to reassuring markets that wholesale selling is unlikely; this should in turn support BTC prices,” Kendrick wrote in a note to clients on Friday. “Indeed, if this signalling proves effective, it should remove the need for MSTR to actually sell any BTC by supporting STRC’s price,” he said.
Related: Crypto Biz: Did Michael Saylor buy the Bitcoin bottom for once?
StanChart sees inconsistencies in “never sell” approach
Kendrick said that Strategy’s long-held “never sell” approach limited what the company could with its industry-biggest digital asset treasury.
“The problem with the ‘never sell’ approach is that it limits what MSTR’s BTC holdings can do — or, perhaps more importantly, what they are perceived to be doing,” the StanChart analyst said. “MSTR has started to shift its communication strategy on this in recent months. It has sold BTC twice and recently announced a BTC monetization program.”
Source: Standard Chartered Bank
Still, he sees Strategy’s “market signaling” will improve soon. He expects that to bring clarity to the outlook for Bitcoin, on which StanChart maintains its $100,000 year-end forecast.
Shares struggle from year low ahead of earnings report
Investors who bought into the Strategy narrative have not had an easy time in the past 12 months. The STRC preferred shares were formulated to hold a price of $100 apiece. Shareholders saw that par value fall to the wayside last month, to the lowest value since the preferred stock was introduced a year ago.
The common shares, trading under the MSTR ticker, have lost more than 70% of their value since July 2025, closing at $94.64 per share on Friday, down from a 52-week high of $457.22.
The company is slated to report second-quarter earnings on July 30, with analysts consensus of $4.28 per share, according to Yahoo Finance data. Earnings have fallen short of analyst forecasts in six of the last eight quarters, according to Fintel.io data, including a 33.76% negative surprise in the first quarter of 2026.
Magazine: Will the crypto lobby’s $189M campaign get CLARITY over the line?


HDFC Bank ended the March financial year with 3,343 fewer employees, a major contraction for India’s biggest private lender.
Total headcount stood at 211,178 as of March 31, down from 214,521 a year earlier. The lender said it is steadily moving routine processing onto digital and automated systems.
AI Automation Hits Back-Office Jobs Hardest
The greatest impact fell on operational staff. Non-supervisory employees, classified as workmen or clerical, and subordinate staff fell by more than 8,000 to 162,797. New hiring also slowed, dropping by 3,811 across the period.
Higher tiers moved the other way. Middle-level headcount rose by 1,252, junior-level by 3,543, and senior management added 15 roles.
The bank tied the shift to strategy. The report said it is steadily shifting routine tasks, such as cash deposits, to Cash Recycler Machines and other automated channels.
That effort runs on Neev, the bank’s in-house AI platform for model access, governance, and workflow integration. Chief Executive Officer Sashidhar Jagdishan said the bank is “consciously redeploying talent from backend functions” toward customer-facing roles as technology takes over routine work.
“As we accelerate the transformation toward becoming a technology-led, customer-centric bank, employees need to keep pace,” he said.
Follow us on X to get the latest news as it happens
Banks Worldwide Lean on AI to Trim Staff
HDFC Bank is not alone. Standard Chartered plans to trim 15% of corporate function roles by 2030 as it scales automation. The trend is now evident in the data. AI drove 38,579 US job cuts in May, roughly 40% of the monthly total, according to Challenger, Gray & Christmas.
However, not every leader shares the gloom. Jeff Bezos argues AI will lift productivity and living standards rather than erase work.
For HDFC Bank, the math already favors fewer hands. Profit after tax rose 10.9% to ₹74,671.3 crore, about $7.83 billion, in FY26, even as the workforce shrank.
Subscribe to our YouTube channel to watch leaders and journalists provide expert insights
The post India’s Largest Private Bank Lost Over 3,000 Employees to AI appeared first on BeInCrypto.

I, Jack Wright viewers taken by surprise just minutes into BBC drama

Teen Speaks On Argument, New Pic Surfaces

The locations where Blue-Green algae has been reported this year in Northern Ireland


-

 Fashion6 days ago
Open Thread: What Great Books Have You Read Recently?
-

 News Videos6 days ago
Whats Hidden Inside This Cash Register? #treasure #reselling #money
-

 Fashion4 days ago
Loro Piana Fall 2026 Enters Houston’s Art Scene
-

 Fashion2 days ago
Weekend Open Thread: Nutriplenish Leave-In Conditioner
-
 Tech6 days ago
Anthropic’s new “J-lens” reveals a silent workspace inside Claude that mirrors a leading theory of consciousness
-

 Crypto World6 days ago
$1,000 Credit Alert! BlockDAG X Exchange Pre-Registration Now Officially Open, Polkadot Dips & Zcash Rebounds
-

 Business6 days ago
AXT Shares Jump Nearly 14% as Semiconductor Materials Maker Rebounds on AI-Linked Indium Phosphide Demand
-

 Sports5 days ago
Joshua Pacio ‘more complete’ ahead of ONE rematch vs Malachiev
-
 Sports3 days ago
2026 Genesis Scottish Open Thursday TV coverage: Round 1
-

 News Videos6 days ago
Best Time to Enter Small Caps Right Now? Another Bull Run? | Financially Free
-

 Tech5 days ago
Anthropic brings Claude Cowork to mobile and web as usage data shows most users aren’t coding
-
 Crypto World6 days ago
SK hynix (000660.KS) Stock Dips as $28B Nasdaq ADR Offering Drives AI Memory Expansion
-

 News Videos6 days ago
Avoid entering in FOMO #bitcoin #cryptocurrency #trading #scalping
-

 Sports3 days ago
Super Eagles star Moses Simon opens up on Liverpool transfer regret
-
Sports5 days ago
We have punished the disrespect
-

 Crypto World6 days ago
Binance lists Strategy’s STRC stock as company expands Bitcoin funding
-

 Tech3 days ago
Character.AI enters the microdrama arena with its own productions, but there’s a twist
-

 Tech6 days ago
9 Best Keyboards (2025), Tested and Reviewed
-

 Business6 days ago
Enbridge: AI Tailwind Priced In (Rating Downgrade)
-

 News Videos6 days ago
“What’s going on?!” Carl Froch discusses Floyd Mayweather Jr financial issues
You must be logged in to post a comment Login