SpaceX is trading below its $135 IPO price. Marathon Digital is down 34% year to date. Coinbase has outperformed both. The math on which tech bet delivers risk adjusted returns has not been done until now.
Summary
SpaceX stock (SPCX) trades at approximately $131 as of mid August, 3% below its $135 IPO price from June 2026, after peaking at $225.64 and declining 48% from that high, giving early investors a negative return two months into the listing.
Coinbase (COIN) has returned roughly 18% year to date through August 2026, outperforming SpaceX, Marathon Digital, Riot Platforms, and every other publicly traded crypto company, driven by exchange volume and stablecoin custody revenue rather than bitcoin price appreciation alone.
Marathon Digital (MARA) and Riot Platforms (RIOT) have declined 34% and 29% respectively in 2026, tracking bitcoin’s flat to negative price action while absorbing rising energy costs and post halving margin compression.
A dollar invested in bitcoin on January 1, 2026 would have returned approximately 4% by mid August, while a dollar invested in MARA would have lost 34 cents, meaning the underlying asset outperformed the company that mines it by 38 percentage points.
ARK Invest has deployed over $475 million into SpaceX stock since the IPO despite the price decline, while simultaneously reducing its COIN position, creating a measurable bet that SpaceX will outperform crypto equities over the next 12 months.
The largest IPO in history arrived in June 2026 and immediately became the most traded stock in the world. SpaceX priced at $135, opened above $190, touched $225.64 within two weeks, and then fell 48% to a post IPO low of $119.79 before stabilizing near $131. Two months after listing, buyers at the IPO price are underwater. Buyers at the peak have lost nearly half their position.
During the same period, the crypto industry’s publicly traded companies followed their own trajectory. Coinbase gained 18% year to date. Marathon Digital lost 34%. Riot Platforms lost 29%. MicroStrategy, which rebranded to Strategy and now holds over 500,000 bitcoin on its balance sheet, moved roughly in line with bitcoin itself. The performances diverge sharply enough to raise a question that retail investors have been asking without receiving a rigorous answer: which of these bets actually pays?
Advertisement
The question matters because SpaceX and crypto stocks are competing for the same capital. They attract the same cohort of retail investors who seek asymmetric returns in technology. They trade on the same platforms. They appear in the same ARK Invest portfolios. And they share a common vulnerability: both are priced on narratives that have not yet been validated by sustained cash flow, which means the math on returns, volatility, and risk adjusted performance determines which narrative deserves the premium.
The SpaceX return that was not
SpaceX reported $7.8 billion in second quarter revenue, exceeding Wall Street estimates. The company completed a $60 billion stock based acquisition of Anysphere, the company behind the Cursor coding platform, adding an AI business to its rocket and satellite operations. Starlink, its satellite internet division, crossed 5 million subscribers. By every operational metric, SpaceX is performing.
The stock is not. At $131, SPCX sits 3% below its IPO price. The gap between operational strength and stock weakness has a specific cause: the 911.5 million insider shares that became eligible for sale in early August. The lockup expiration created a supply overhang that the market has not yet absorbed.
Cathie Wood’s ARK Invest responded by buying more. The firm has deployed over $475 million into SPCX since the IPO, purchasing through the decline and adding $52.1 million in a single week in mid July. Raymond James set an $800 price target, the highest on Wall Street, implying a 510% return from current levels.
Advertisement
But the return that matters for comparison purposes is the one investors have actually received: negative 3% over two months for IPO buyers, negative 42% for buyers at the $225 peak, and negative 11% for the median entry price across the first month of trading. The SpaceX IPO has been, for most participants, a losing trade.
The crypto stock scorecard
The publicly traded crypto sector offers a wider range of outcomes than SpaceX, and the dispersion reveals which business models are working and which are not.
Coinbase (COIN): Up approximately 18% year to date. The exchange benefits from trading volume that scales with market volatility rather than market direction. Stablecoin custody revenue, institutional prime brokerage fees, and the Base L2 network’s transaction revenue have diversified the company beyond pure exchange commissions. COIN is the only major crypto stock that has consistently outperformed bitcoin in 2026.
Marathon Digital (MARA): Down 34% year to date. The largest publicly traded bitcoin miner by hash rate has been squeezed by the April 2024 halving, which cut block rewards from 6.25 to 3.125 BTC. Energy costs in Texas, where Marathon operates its largest facilities, have risen 12% year over year. The company mines bitcoin at an all in cost of approximately $43,000 per coin, leaving thin margins at current prices near $58,000.
Advertisement
Riot Platforms (RIOT): Down 29% year to date. Similar dynamics to Marathon, with the additional pressure of a protracted proxy fight that diverted management attention through the first half of the year. Riot’s Corsicana facility in Texas is the largest single mining site in the world by capacity, but capacity does not equal profitability when the bitcoin price is flat and energy costs are rising.
Strategy (formerly MicroStrategy, MSTR): Roughly flat year to date, tracking bitcoin. The company holds over 500,000 BTC on its balance sheet, making it a leveraged proxy for bitcoin price. Its stock trades at a persistent premium to net asset value, which is a bet that the company will continue acquiring bitcoin at favorable terms. The premium has compressed from over 100% in late 2024 to roughly 40% in August 2026.
CleanSpark (CLSK): Down 22% year to date. The company has focused on acquiring distressed mining facilities at discount prices, building hash rate more cheaply than Marathon or Riot. The strategy is sound on paper, but the stock has not rewarded it because the market is pricing all miners on the same metric: bitcoin price minus energy cost, and both variables are working against the sector.
The arithmetic nobody performed
Here is the comparison that matters and that no coverage has assembled in one place. Consider a hypothetical investor with $10,000 on January 1, 2026, choosing among five options: buy bitcoin directly, buy COIN, buy MARA, buy RIOT, or wait for the SpaceX IPO and buy at the $135 listing price.
Advertisement
Bitcoin directly: $10,000 becomes approximately $10,400. A 4% return with no management fee, no dilution risk, and no operational leverage. The holder owns the asset and bears only price risk.
COIN: $10,000 becomes approximately $11,800. An 18% return, reflecting Coinbase’s diversified revenue and its position as the primary institutional on ramp for U.S. crypto markets.
MARA: $10,000 becomes approximately $6,600. A 34% loss, despite Marathon mining a total of approximately 6,700 bitcoin in the first half of 2026. The company produced the asset but destroyed shareholder value relative to simply holding it.
RIOT: $10,000 becomes approximately $7,100. A 29% loss, with similar dynamics to Marathon.
Advertisement
SpaceX (from IPO): $10,000 becomes approximately $9,700. A 3% loss over two months, with a maximum drawdown of 48% from the peak.
The result is stark. The best performing option is a crypto company that does not mine, hold, or produce bitcoin. The worst performing options are companies whose entire business model is producing bitcoin. And the underlying asset itself outperformed three of the four equities tied to it, despite returning only 4%.
This pattern has repeated in every bitcoin cycle since mining stocks became publicly traded. Miners underperform bitcoin during flat or declining markets because their costs are fixed in dollars while their revenue is fixed in bitcoin. When bitcoin rises sharply, miners outperform because of operational leverage. But the periods of underperformance are longer and deeper than the periods of outperformance, which means a buy and hold investor in mining stocks has historically been better served by holding bitcoin directly.
Advertisement
What SpaceX and crypto stocks have in common
The comparison is not arbitrary. SpaceX and crypto stocks share structural characteristics that make them substitutes in retail portfolios.
Both are narrative driven. SpaceX is priced on the Starlink subscriber trajectory, the Starship program’s success rate, and Elon Musk’s ability to execute on a vision that includes Mars colonization. Crypto stocks are priced on bitcoin’s next cycle, Ethereum’s fee revenue, and the assumption that regulatory clarity will unlock institutional capital. In both cases, current cash flows do not justify current valuations. The premium is a bet on a future that has not arrived.
Both attract the same investor cohort. Retail trading platforms report that SpaceX and crypto stocks are among their most traded instruments. ARK Invest, which is the largest institutional holder of both COIN and SPCX, treats them as part of the same “disruptive innovation” thesis. The capital that flows into SpaceX on IPO day is capital that does not flow into COIN or MARA that week.
Both are accessible through synthetic instruments on crypto rails. Hyperliquid’s SPCX perpetual future tracked the IPO tick for tick, hosting a $14 million leveraged short that no brokerage would have offered. The existence of equity perps on crypto venues means that the distinction between “stock” and “crypto” is blurring for the traders who move the most volume.
Advertisement
And both are vulnerable to the same macro risk. With the CLARITY Act’s passage odds falling to 10% and regulatory certainty fading, the political tailwind that crypto stocks relied on is weakening. Higher interest rates compress the valuation multiples of unprofitable or marginally profitable growth companies. SpaceX’s AI spending hit $15.8 billion in the second quarter, raising questions about burn rate. Mining companies face rising energy costs that erode already thin margins. If the Fed holds rates higher for longer, both sectors suffer.
Where they diverge
The differences matter as much as the similarities.
SpaceX generates real revenue from real customers. Starlink’s 5 million subscribers pay monthly fees. Government launch contracts provide predictable income. The Cursor acquisition adds AI revenue. SpaceX’s revenue base is diversified across industries that have nothing to do with each other. This is not true of any crypto stock: every publicly traded crypto company derives the majority of its revenue from a single source (bitcoin mining, exchange volume, or token holdings).
SpaceX has a capital structure problem that crypto stocks do not. The 911.5 million insider shares that unlocked in August represent roughly 30% of the company’s outstanding stock. This supply overhang will take months to absorb. Crypto stocks have their own dilution issues (MARA has repeatedly issued shares to fund mining equipment purchases), but none faces a single lockup expiration of this magnitude.
Advertisement
Crypto stocks offer direct exposure to an asset class that SpaceX does not touch. A bet on COIN is partly a bet on bitcoin, partly a bet on Ethereum, partly a bet on stablecoin adoption, and partly a bet on DeFi volume. A bet on SpaceX is a bet on rockets, satellites, and AI. The correlation between these bets is low, which means they serve different portfolio functions even if they attract the same investors.
The ARK Invest signal
ARK Invest’s portfolio moves provide a measurable signal about how at least one major institutional investor is weighing these bets. Cathie Wood has bought SpaceX aggressively through the decline while reducing her COIN position during its rally. The trades imply a view that SpaceX is cheaper relative to its growth potential than Coinbase is.
The logic is not unreasonable. At $131, SpaceX trades at roughly 17 times trailing revenue, compared to Coinbase at approximately 12 times trailing revenue. But SpaceX’s revenue is growing faster (estimated 40% year over year versus Coinbase’s 25%), and its addressable market (global internet access, government launch, AI infrastructure) is arguably larger than Coinbase’s (U.S. crypto trading and custody).
NEW: Hyperliquid sees SpaceX pre-IPO perpetuals drop 45% in minutes from ~$2,280 to $1,280, liquidating over $1.5M in longs pic.twitter.com/g48TN8iCfg
The counterargument is that SpaceX’s valuation was set by a controlled IPO process in which demand was artificially constrained, while Coinbase’s valuation has been set by three years of public market price discovery. The IPO price may simply have been too high, and the current decline is a correction to fair value rather than a buying opportunity.
ARK’s bet will be judged over 12 to 36 months, not two. But the size of the position ($475 million and growing) means that ARK’s performance in 2027 will be materially affected by whether SpaceX recovers from its post IPO decline. If it does, the SpaceX bet will look prescient. If it does not, the opportunity cost of not holding COIN or bitcoin directly will be significant.
What to watch
SpaceX insider selling volume. The 911.5 million unlocked shares represent the largest near term risk to the stock. Watch weekly SEC filings for the pace and size of insider sales. If selling decelerates before September, the supply overhang is being absorbed.
Bitcoin mining profitability after the halving. Marathon and Riot report all in mining costs quarterly. If costs exceed $50,000 per bitcoin and the price stays below $60,000, expect further share price declines and potential consolidation in the mining sector.
Advertisement
Coinbase revenue diversification. Base L2 transaction revenue, stablecoin custody fees, and international exchange volume are the metrics that determine whether COIN continues to outperform. Watch the Q3 earnings report in November.
Equity perps volume on Hyperliquid. If synthetic stock trading on crypto venues grows, it creates a feedback loop: more crypto native capital flows into stock exposure, potentially reducing demand for crypto stocks as a proxy for traditional market access.
ARK Invest rebalancing. Any reduction of the SpaceX position or increase in COIN would signal a shift in Wood’s relative conviction and would move both stocks given ARK’s position size.
Advertisement
Why compare SpaceX stock to crypto stocks?
SpaceX and crypto stocks compete for the same pool of retail capital seeking asymmetric returns in technology. They trade on the same platforms, appear in the same institutional portfolios, and share structural characteristics including narrative driven valuations and sensitivity to interest rate changes.
Has SpaceX stock been a good investment since its IPO?
No, as of mid August 2026. SPCX trades at approximately $131, below its $135 IPO price, after peaking at $225.64 and declining 48%. Most retail buyers who purchased in the first month of trading are underwater.
Which crypto stock has performed best in 2026?
Coinbase (COIN) has returned approximately 18% year to date, outperforming every other major publicly traded crypto company. The outperformance reflects diversified revenue from exchange commissions, stablecoin custody, institutional services, and the Base L2 network.
Why do bitcoin mining stocks underperform bitcoin?
Mining stocks have fixed dollar costs (energy, equipment, labor) and revenue denominated in bitcoin. When bitcoin’s price is flat or declining, miners face margin compression that does not affect holders of the underlying asset. This structural mismatch causes mining stocks to underperform bitcoin during sideways and bearish markets.
Advertisement
Can you buy SpaceX stock on crypto platforms?
Not directly, but Hyperliquid and other decentralized venues offer perpetual futures contracts that track SpaceX’s stock price. These synthetic instruments provide leveraged exposure without equity ownership, dividends, or voting rights.
How much has ARK Invest put into SpaceX?
ARK Invest has deployed over $475 million into SpaceX stock since the June 2026 IPO, purchasing through the price decline. The firm has simultaneously reduced its Coinbase position, signaling a relative preference for SpaceX’s growth potential.
Is it better to hold bitcoin or bitcoin mining stocks?
Historically, holding bitcoin directly has outperformed holding mining stocks on a buy and hold basis. In 2026, bitcoin returned approximately 4% while Marathon Digital lost 34% and Riot Platforms lost 29%. Mining stocks offer leveraged upside during strong bull markets but deeper drawdowns during flat or bearish periods.
What is the biggest risk to SpaceX stock right now?
The 911.5 million insider shares that became eligible for sale in August 2026. This supply overhang represents roughly 30% of outstanding shares and could suppress the stock price for months as insiders gradually sell their positions. This is educational analysis, not investment advice.
Advertisement
Disclaimer: This article is for informational purposes only and does not constitute financial, legal, or investment advice. Stock and cryptocurrency investments carry significant risk. Always conduct your own research before making investment decisions. Information is accurate as of August 19, 2026.
The warehouse facility gives Ethena another source of returns for the assets backing USDe while channeling onchain capital into overcollateralized institutional loans.
A new batch of GTA VI leaks are being used by an X user to pump their crypto as part of a “secret project.”
The user, who goes by the name “CyberLeek,” shared GTA VI gameplay footage alongside the ticker for a crypto called $CYBERLEEK yesterday.
It included details about GTA VI’s map and footage of free-roam gameplay that, at the time of writing, are no longer viewable on X following a copyright strike from the game’s creator, Rockstar Games.
CyberLeek is raising funds for ‘secret project’
CyberLeek created their token to raise funds for a “secret project” that they claim cannot be revealed, as “showing the cards to the big corporations would only give them time to build their defenses.”
Advertisement
Onlookers have speculated that a new gas meter and morality system have been revealed in CyberLeek’s posts.
They said, “Let it be absolutely clear: this is not a cash grab. Funding is directed toward the infrastructure needed to strike, as well as the security and protection required to withstand the inevitable corporate counterattacks.”
Their posts pushed the token’s market cap up almost 5,800% within an hour to $3.46 million. Its market cap is $1.5 million at the time of writing.
Advertisement
What are CyberLeek’s motives?
According to CyberLeek’s website, the leaks stem from their grievances with anti-consumer practices within the video game industry.
CyberLeek claims they will target any gaming company that sells digital pre-orders, locks single-player content behind a paywall, and doesn’t strive to preserve long-term offline access to single-player content.
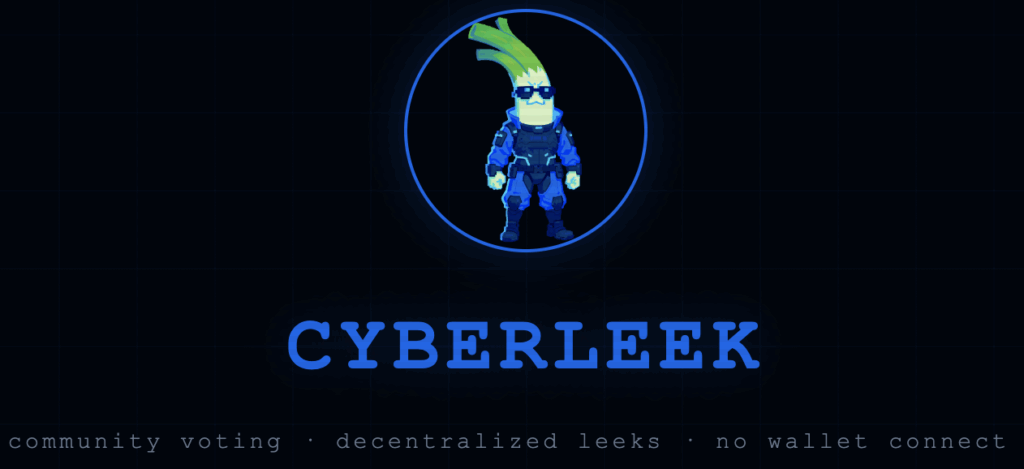
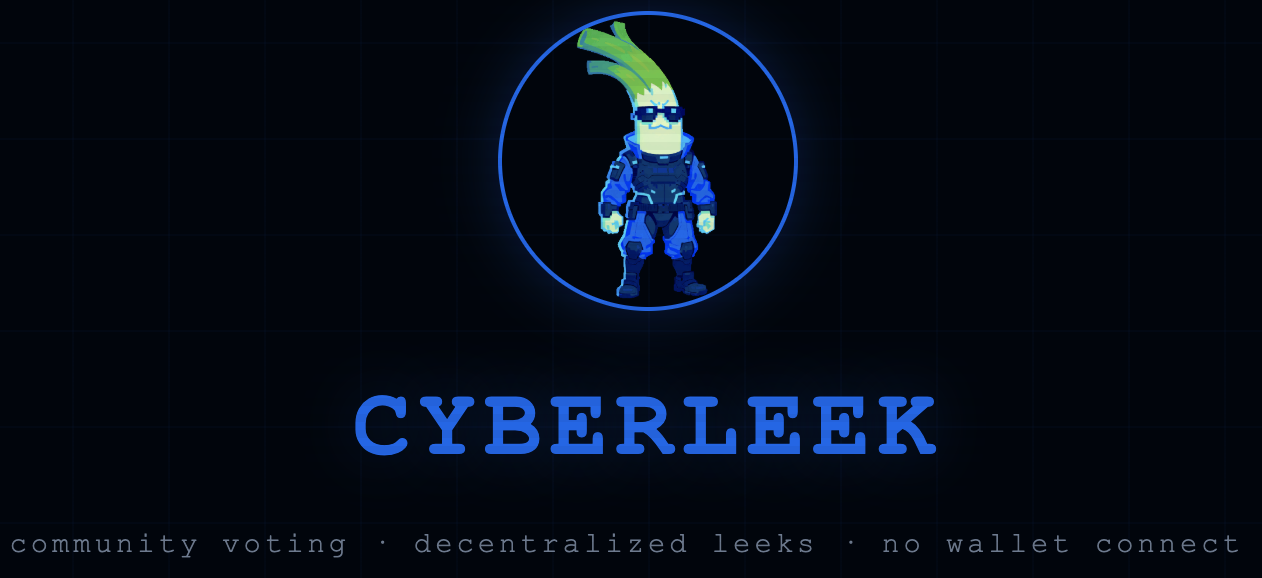
CyberLeek’s mascot.
For instance, they claim pre-orders “were created because physical discs had manufacturing limits. In digital distribution, there is no inventory. There is no stock shortage. A digital copy cannot sell out. Yet publishers kept the preorder system and stripped away its only consumer benefit.”
CyberLeek has threatened to leak more footage unless Rockstar Games meets their demands.
GTA VI’s no-disc descision has rocked the boat
GTA VI will be the first major game to release without a disc. Its digital pre-orders will be, like CyberLeek noted, in infinite supply while Rockstar’s “physical” release will take the form of a redeemable code packaged in a game box.
Advertisement
On CNN video game journalist Gene Park noted the shift as an issue of consumer rights.
The announcement of GTA VI’s release plan, alongside Sony’s decision to no longer produce game discs, has led to lawsuits and uproar from gamers who advocate for physical media and game preservation.
Got a tip? Send us an email securely via Protos Leaks. For more informed news and investigations, follow us on X, Bluesky, and Google News, or subscribe to our YouTube channel.
Bitcoin posted a modest recovery on Wednesday, which helped it climb above $64,000. The cryptocurrency is still almost 50% down from its all-time high, but VanEck’s latest analysis revealed that 8 of 12 tracked signals in its “Bitcoin Capitulation Check” are now firing.
This suggests that the market may be nearing the end of its correction phase.
Shallower Trough
VanEck said that all 12 signals entered their capitulation zones at some point over the past three months, while BTC itself has spent the past month stabilizing after recovering from its June summer low and may have bottomed near $58,500 on June 30.
Meanwhile, US spot Bitcoin ETFs have recorded more than $950 million in net inflows so far in August, which points to some renewed institutional demand even as the crypto asset remains below its record high.
Advertisement
VanEck expects a shallower trough this cycle compared with previous Bitcoin downturns. Earlier bottoms saw drawdowns of 94%, 85%, 84%, and 78%. Those periods also came before the current spot ETF market and when institutional ownership was much smaller. More importantly, each of those cycles saw major failures across the market. This time, there has been no Celsius, Three Arrows Capital, or FTX collapse.
According to its findings, Bitcoin appears to have gone through price capitulation, and the market is nearing or currently in an accumulation phase.
That accumulation phase could gain further momentum if more capital begins moving back into crypto, which Bitfinex identifies as the major missing piece for Bitcoin’s next rally. In its latest Alpha report, the exchange said two of the three conditions for a BTC rally are already in place: lower expected rates and already-loose financial conditions.
The third – capital flowing from equities, technology, and AI markets into crypto – has yet to materialize. For instance, corporate Bitcoin treasury activity has turned negative, and stablecoin supply remains below its May record. Bitfinex warned that in such a thin market, even relatively small changes in flows could produce an outsized move.
Advertisement
Bigger Move Ahead
Some investors are, however, already looking much further ahead.
SkyBridge Capital founder Anthony Scaramucci recently told CNBC that he expects Bitcoin to climb back above $100,000, a level the cryptocurrency has not closed above since November 2025. He believes the six-digit price territory will come around the halving, scheduled to take place in less than two years.
Futures for the Dow Jones Industrial Average and the other major stock indexes traded mixed Wednesday, as Wall Street awaited the minutes from the Federal Reserve’s latest policy meeting. Meanwhile, Nvidia (NVDA) supplier SK Hynix (SKHY) and Moderna (MRNA) surged on the stock market today. Ahead of Wednesday’s open, Dow futures rose 0.1%, while S&P 500 futures inched higher. Nasdaq-100…
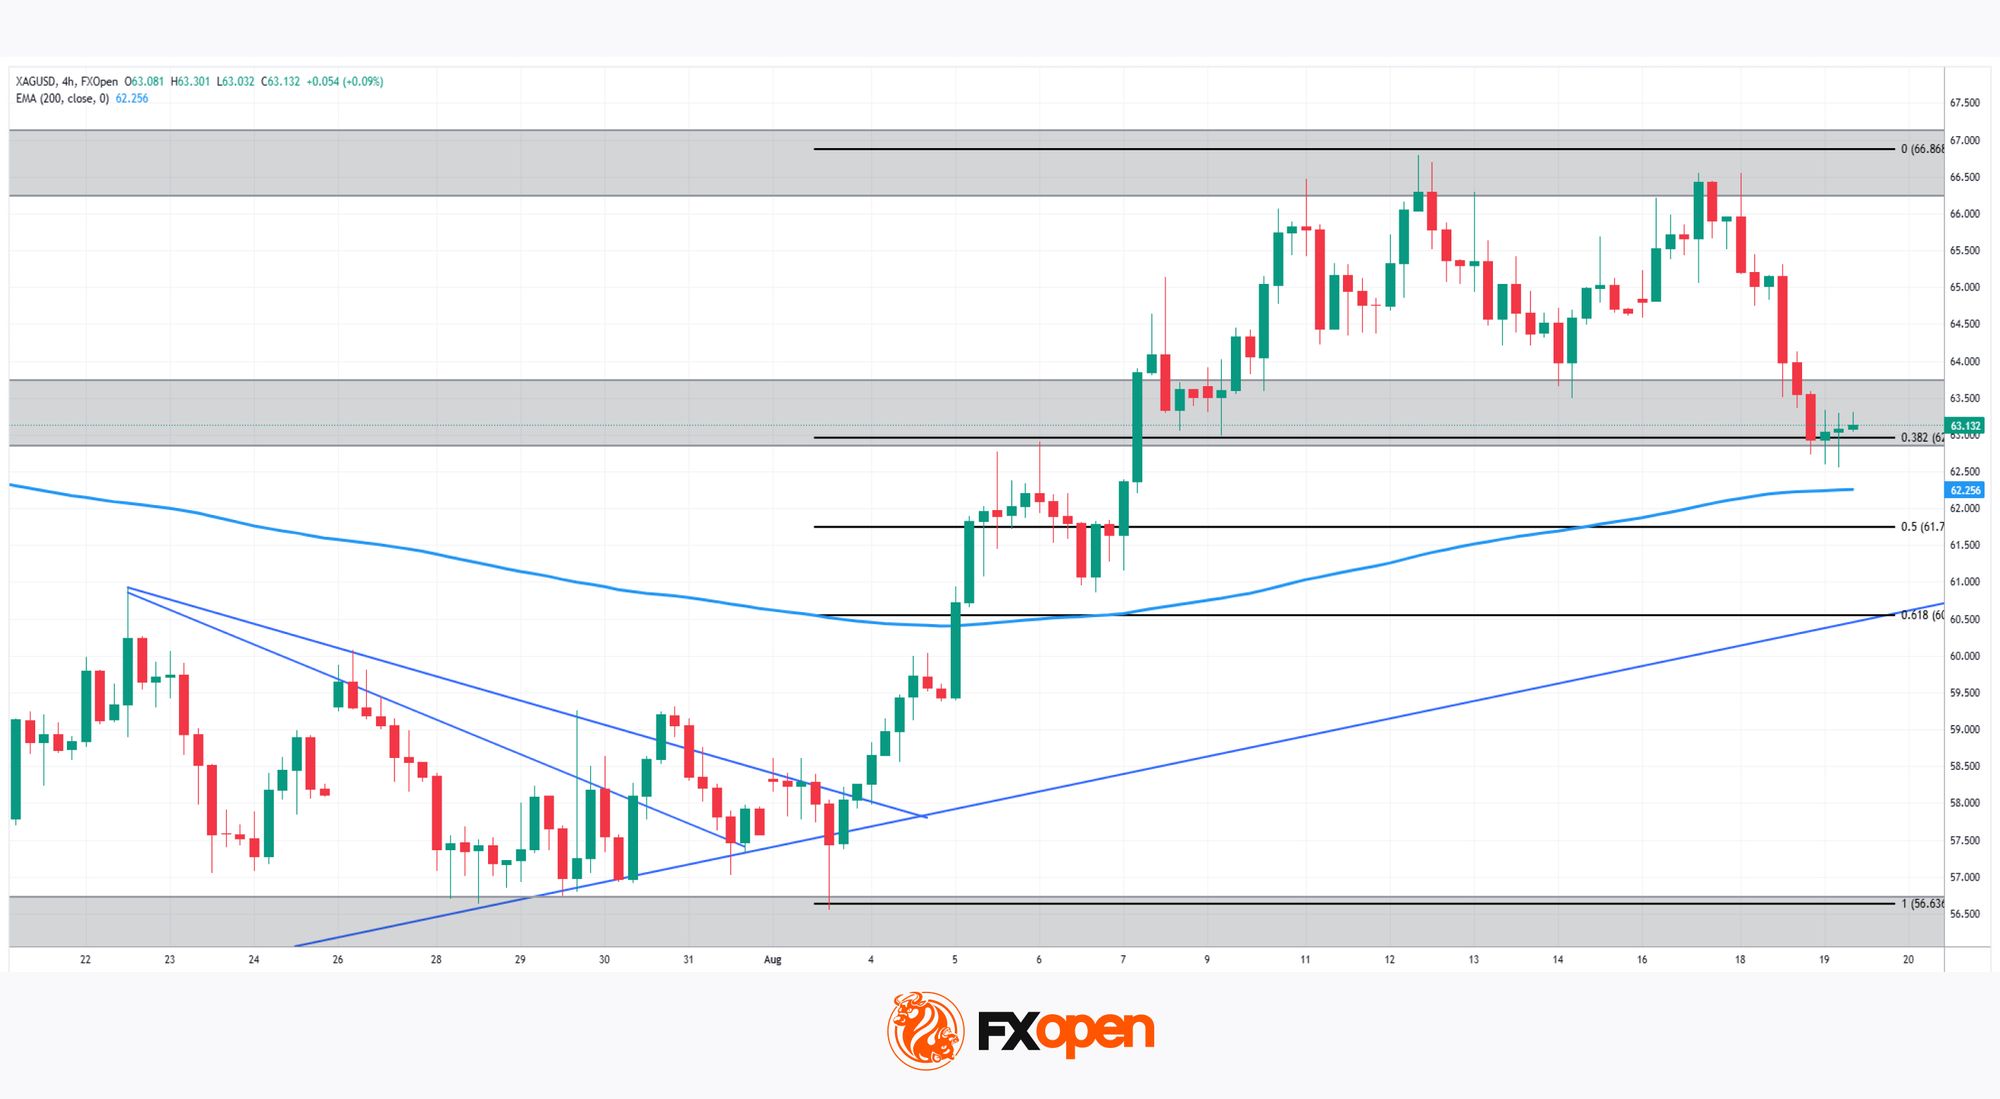
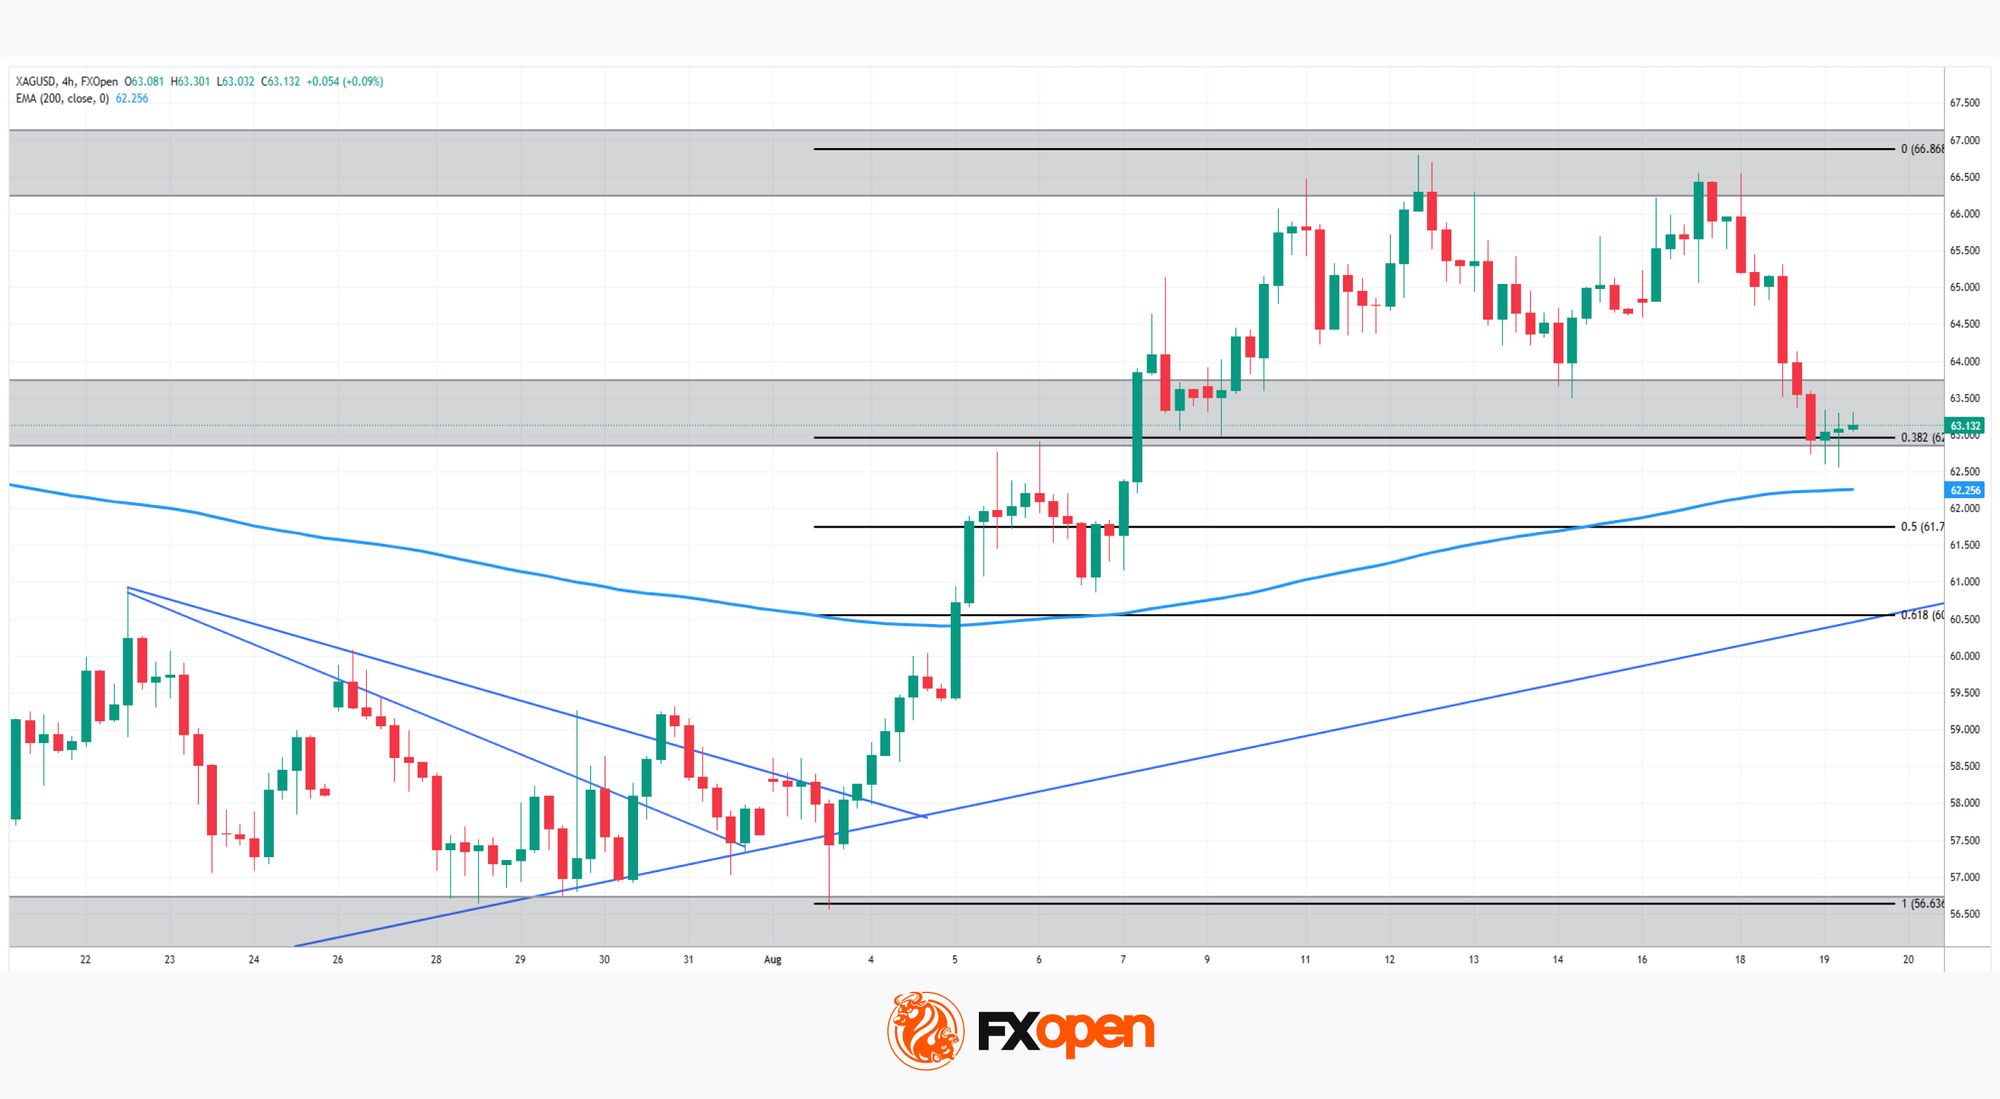
Silver has had one of its strongest months in years, but this week’s price action shows just how fragile precious metals rallies can be when bond markets get nervous. The metal surged nearly 10% last week after July’s Non-Farm Payrolls badly missed expectations, printing a loss of 23,000 jobs, prompting markets to price out any chance of a September Fed hike and reviving safe-haven demand.
That momentum reversed on Tuesday, however, with silver dropping toward $64 as global bond yields spiked to multi-year highs on mounting concerns over government spending and persistent inflationary pressures. Rising oil prices added to the unease, keeping inflation risks firmly in focus even as rate-hike expectations continue to fade.
Beneath the volatility, the structural picture remains supportive: silver continues to draw solid demand from the green energy transition, solar panels, electric vehicles, and AI data centre infrastructure, all keeping a floor under prices. All eyes now turn to the Fed’s July meeting minutes and Chair Kevin Warsh’s remarks at Jackson Hole, both expected to offer fresh clues on the path ahead for rates.
Technical Analysis of XAG/USD
As XAG/USD chart shows, silver broke above its descending trendline from June’s highs in early August, a genuine shift after weeks of decline, and has since been holding above the 0.382 Fibonacci retracement near 62.88, right where the 200-period EMA also sits nearby at 62.27. The broader recovery has been building on an ascending trendline off the mid-July lows.
Bullish Scenario
Advertisement
Should buyers defend this 0.382-EMA confluence and push higher, the path would open toward a retest of the 66.73 highs, the 0 Fibonacci level marking the origin of the entire decline. A confirmed break above that zone would signal the correction is fully over.
Bearish Scenario
Conversely, a break below the 0.382 retracement and the ascending trendline would expose the 0.5 level near 61.69, with a deeper slide risking a retest of the 0.618 retracement around 60.49, or even the triangle apex near 56.64 if selling pressure accelerates.
With price sitting right at the intersection of a reclaimed trendline, the 200-period EMA, and a key Fibonacci level, silver looks poised for a decisive move, will this recovery extend toward fresh monthly highs, or does the recent bond market turmoil drag the metal back into its prior range?
Advertisement
Start trading commodity CFDs with tight spreads (additional fees may apply). Open your trading account now or learn more about trading commodity CFDs with FXOpen.
This article represents the opinion of the Companies operating under the FXOpen brand only. It is not to be construed as an offer, solicitation, or recommendation with respect to products and services provided by the Companies operating under the FXOpen brand, nor is it to be considered financial advice.
On the last Friday of July, an Ethereum wallet linked by on-chain analysts to Arthur Hayes suddenly started selling.
Within minutes, 2,364 ETH was sent to Cumberland and Galaxy Digital, two major crypto trading firms. The wallet sold at around $1,821 per ETH, crystallizing a loss of roughly $241,000 on coins it had bought only weeks earlier.
Arthur Hayes(@CryptoHayes) bought high and sold low again! Over the past 2 hours, he deposited 2,364.38 $ETH into Cumberland and Galaxy Digital, receiving 4.3M $USDC in return. His selling price was $1,821, resulting in a loss of $241K (-5.3%). He had previously bought 7,213… pic.twitter.com/4AVZpjANZD
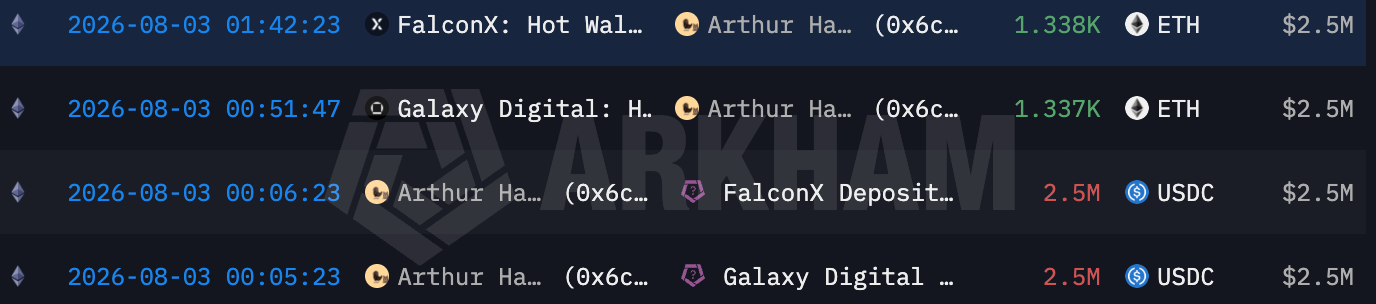
Two days later, the same wallet started buying Ethereum again at roughly $1,869. By Monday evening, on August 3, 2026, it had accumulated around 2,676 ETH — leaving it with more ETH than it held before the sell-off.
Whatever prompted the wallet to exit on Friday appeared to have changed over the weekend.
Why would an experienced crypto investor like Arthur Hayes sell at a loss, only to buy back even more days later?
Arthur Hayes Buys More ETH on August 3. Image Source: Arkham
Lookonchain caught the transactions within hours and posted the line that has followed the BitMEX co-founder for years:
“Arthur Hayes bought high and sold low again!”
That word, “again,” carries a serious accusation. It implies a pattern. It implies that crypto’s most quoted macro commentator, a man whose essays can move markets, is also its most reliable inverse indicator.
Advertisement
The Jim Cramer of crypto, as the meme goes.
But jokes are cheap. Receipts are not. So BeInCrypto pulled every transaction from the three wallets attributed to Hayes for the past two years and eight months, priced every trade, matched every sell against the buys that came before it, and added it all up.
The answer: the meme is half true. The half that is true cost him about $2.47 million. And the most interesting finding is not where he loses. It is the one place he wins.
The Scoreboard: One Winner, Six Losers
The wallets lost roughly $2.47 million overall. ENA — where Hayes is an adviser and token holder — was the only profitable token, offsetting about $5.5 million in losses elsewhere.
Advertisement
Meanwhile, if you consider just the closed reconstructed trades, the result is a loss of $2.24 million.
Include the open positions our model tracks, roughly 8,165 ETH purchased inside the window at an average of $1,884 and 25.3 million ENA at an average of $0.091, both currently underwater, and the total reaches minus $2.47 million on roughly $92 million put to work.
Note that the wallets hold more than the model tracks, about 10,800 ETH and 28.45 million ENA per Arkham. The gaps are pre-window coins, and 3.1 million ENA received from an Ethena multisig on August 10, none of which has a purchase price in our window, so none enters the profit math.
The trade record: 15 wins, 25 losses.
Advertisement
Token by token, the picture is stark.
ETH lost a reconstructed $2.04 million.
SYN lost $1.41 million.
LDO lost $1.26 million.
ETHFI lost $474,000.
PEPE lost $152,000.
PENDLE lost $124,000.
One token made money: ENA, up $3.23 million.
Arthur Hayes Realized PnL Per Token. Image Source: BeInCrypto
ENA is the governance token of Ethena. It is a project Hayes formally advises, holds vested tokens in, and promotes relentlessly.
On the six tokens where he is just another trader with a strong opinion, the wallets lost about $5.5 million. On the one token where he has an insider’s seat, he made $3 million.
The ETH Pattern: Sell Low, Rebuy High
Ethereum is where the meme earns its keep because of the repeated pattern of buying high and selling low. Our findings show that Hayes-linked wallets sold into short-term fear, then bought back after prices recovered, sometimes at a steep premium.
The wallets traded ETH 34 times in our window, and the choreography repeats: sell into fear, watch the market steady, buy back at a worse price.
Advertisement
The clearest example ran through August 2025.
On August 1, with Hayes publicly cautious on the macro picture, the wallet deposited 2,373 ETH to two trading desks, a sale Lookonchain tracked at about $3,507 per coin. Ethereum ignored the fear and ran almost straight up.
On August 10, the same wallet bought 1,500 ETH back at around $4,252. Same asset, roughly $745 per coin more expensive. On the rebought coins alone, the exit and re-entry cost roughly $1.1 million.
The July 2026 episode that opened this article follows the identical script, compressed into a weekend. Sell 2,364 ETH at a $241,000 realized loss on Friday.
Rebuy more than that by Monday. The loss purchased nothing: no protection, no dry powder, no changed thesis. Both transactions sit on the chain for anyone to verify, including the 1,167 ETH transfer to Cumberland.
Each individual sale had a reason. A scary macro print, a tariff headline, a liquidity worry, all articulated in Hayes’s essays. The problem is not any single decision.
It is that his fear operates on a weekend timescale while Ethereum’s moves operate on a monthly one. The wallets kept selling dips and rebuying recoveries, and the running total of ETH trading only found new lows.
Advertisement
Arthur Hayes ETH Trades. Source: BeInCrypto
The Counterexample: He Traded ENA Brilliantly, Once
Fairness demands the ENA chapter, because it was a clear exception.
Hayes-linked wallets timed the token far better than other trades, generating millions in profit — though the latest ENA position is already underwater.
In late November 2024, the wallets spent about $11.2 million, accumulating 16.79 million ENA at around $0.67 through Binance, Wintermute, and Flowdesk.
Then, unusually, Hayes waited. Three weeks later, on December 21, two hours after tweeting praise of Ethena, the wallet moved $8.4 million of ENA to Binance and sold near $1.19, roughly 78% above his $0.67 entry a month earlier. Our reconstruction credits about $3.7 million of realized profit on that day’s sale.
I could nit pick some things , but a very impressive run down on @ethena_labs. If you are a DeFi protocol and you haven’t integrated USDe or sUSDe, you are fucking up. https://t.co/bFsQB6Uw67
The criticism that followed concerned ethics: promoting a token publicly and selling into the pump within two hours. Nobody called the trade dumb.
Across our full window, his ENA buys were followed by an average 30% outperformance within a month, and his ENA sells preceded 22% underperformance. Both sides of the trade, timed well, repeatedly.
Why is Arthur Hayes Good With ENA Trades?
Two structural reasons. First, proximity. Maelstrom advises Ethena. Second, patience, but only here.
He held the November position for weeks, while his ETH conviction has a shelf life of days.
Advertisement
The 2026 sequel is going worse. Lookonchain data shows he bought 15.8 million ENA at $0.23 in February and sold 3.6 million at $0.14.
And in the few days before publication, the wallets went back in hard. They made a run of market purchases between August 1 and August 6 through Binance, Wintermute, Flowdesk, and Galaxy Digital, totaling roughly 25 million ENA at $0.08 to $0.09, timed directly into Ethena’s August 5 unlock of 172 million new tokens.
Arthur Hayes Purchases ENA. Source: Arkham
A further 3.1 million ENA arrived on August 10 from an Ethena multisig, consistent with a vesting distribution, which we exclude from his buys. ENA trades at $0.082 as we publish, 94% below its 2024 peak, and the purchased tranche is already underwater.
Arthur Hayes’ ENA Trades. Source: BeInCrypto
The Tuition Bills
The smaller trades show the same problem: Hayes-linked wallets repeatedly bought narratives too late or exited too early, turning strong convictions into heavy losses.
The worst single entry in the file is SYN. The wallets put $2 million into Synapse, watched it lose more than half its value against the market within a month, and finally flushed the position on August 1, 2026, selling 6.16 million SYN for $658,000. 33 cents back on every dollar in.
Arthur Hayes SYN Trades. Source: Arkham
The most Cramer-shaped moment belongs to PENDLE. On September 12, 2024, Hayes tweeted that he was betting PENDLE would reach $10.
Nine days later, the wallets sold 1.2 million PENDLE, about 61% of the position, at around $3.52, including one tranche dumped at a 36% loss. After the sale, PENDLE rallied 24% almost immediately.
Advertisement
The Verdict: Not Cramer, Something More Specific
Here is a twist. Hayes appears to have a real edge when entering trades; his buys outperform over the next month, but poor exits and weak long-term holds repeatedly erase that advantage.
For every purchase in the dataset, we asked one question. What did that token do over the next 30 days, compared with what it usually does?
The comparison matters. Every token has a typical 30-day move across our period, its drift.
Against that bar, Hayes, the buyer, is genuinely good. The tokens he bought went on to beat their own drift by about 10% over the following month, weighted by how much money he put in.
Advertisement
His nose for what is about to run is real. It is also why blindly doing the opposite of Hayes, the strategy Crypto Twitter jokes about, would have worked worse than the joke assumes.
The catch is that the 10% is what his entries were worth if held for a month. He almost never held for a month. The Friday-night sale, the PENDLE dump nine days after his own price target, and the ETH buyback at $4,252. Each of those exits cashed in the edge early or converted it into a realized loss.
And when he did hold on, the market eventually came for him anyway. Stretch the same measurement to 90 days, and it inverts. His buys trailed their drift by 20.5% within a quarter. The strength he buys is real but old. It pays for about a month after he arrives, then dies.
Put those numbers side by side, and you have the whole trader. His instincts run on a 30-day clock. But his nerves run on a 3-day clock. His losses live in the gap between the two.
Advertisement
Timing Score of Arthur Hayes Trades. Source: BeInCrypto
That gap is the scoreboard. The one-month edge makes every individual entry defensible, which is why no single Hayes trade ever looks stupid in isolation. The three-day nerves mean he keeps interrupting his own best ideas.
Is Arthur Hayes Crypto’s Jim Cramer?
So is he a profitable trader? On the evidence of the visible wallets, no.
Is he crypto’s Jim Cramer? Also, no, and the difference matters.
Cramer’s joke is that he is simply wrong. Hayes is not wrong. He is early on a one-month clock and gone either too soon or too late.
One final point of fairness. Whatever his trading record says, Hayes remains structurally long Ethereum.
Advertisement
Beyond the ETH the wallets hold outright, Arkham shows roughly 3,176 eETH and 1,167 weETH in staked positions, taking his total exposure to about 15,200 ETH equivalent, worth around $28.5 million.
He trades around the position badly, but he has never abandoned it. And a $2.47 million trading loss is a rounding error against a net worth Arkham estimates at $200 million to $350 million, most of it built at BitMEX, the exchange he co-founded, which announced on July 23 that it will shut down permanently on September 23 after 11 years.
The wallets we examined hold $33 million as of writing. Hayes never bets enough to get hurt, and nothing here speaks to how Maelstrom’s fund, which we cannot see, performs.
His trades are not uniquely bad. They are ordinarily bad, narrated in extraordinary essays, and permanently on display.
Advertisement
Arthur Hayes On-Chain Portfolio. Source: Arkham
How we Read Arthur Hayes On-Chain Trades
Everything on a blockchain is public and permanent. We analyzed three Ethereum wallets tagged to Arthur Hayes by Arkham Intelligence, and trackers such as Lookonchain have reported on them as his for over two years:
1. 0x534a0076fb7c2b1f83fa21497429ad7ad3bd7587
2. 0xa86e3d1c80a750a310b484fb9bdc470753a7506f
3. 0x6cd66DbdFe289ab83d7311B668ADA83A12447e21
Hayes has replied to posts about these wallets. He has never said they are not his. He has also never formally confirmed ownership, which is why the article describes the “wallets attributed to Hayes” rather than asserting ownership.
We downloaded the complete history of all three wallets, roughly 17,000 transfers, and then cleaned it. Out went thousands of scam deposits from address-poisoning attackers, including 624 fake versions of “USDC” built with lookalike characters.
Out went staking transactions, which move tokens without selling them. Also, out went roughly $35 million of tokens that arrived from vesting contracts, because Hayes advises projects including Ethena and Ether.fi through his fund Maelstrom, and receiving a token salary is not the same as buying with conviction.
What survived were 124 real trades between December 2023 and August 14, 2026. 82 buys worth $92 million. 42 sells worth $73 million, and seven tokens: ETH, ENA, PENDLE, ETHFI, SYN, LDO, and PEPE.
For every sell, we matched the coins against the earliest unsold purchases before it, the standard first-in-first-out method, and asked a simple question. Did this trade make money?
Advertisement
One honest note. We price trades at daily closing prices, and actual fills differ slightly.
Every figure here is a careful reconstruction, not an audit. The direction of the numbers is robust.
BeInCrypto has contacted Hayes and the Maelstrom fund for comment and will update this article with any response.
Disclaimer: This article is based on public blockchain data and third-party attribution. It is provided for informational purposes and is not investment advice.
POLAND – 2025/02/24: In this photo illustration, an Artificial Intelligence (AI) logo is displayed on a smartphone with an Artificial Intelligence (AI) symbols on the background. (Photo Illustration by Omar Marques/SOPA Images/LightRocket via Getty Images)
Sopa Images | Lightrocket | Getty Images
Retail investors aren’t giving up on the artificial intelligence trade. But they are getting selective and adding downside protection as markets head into the fall.
Advertisement
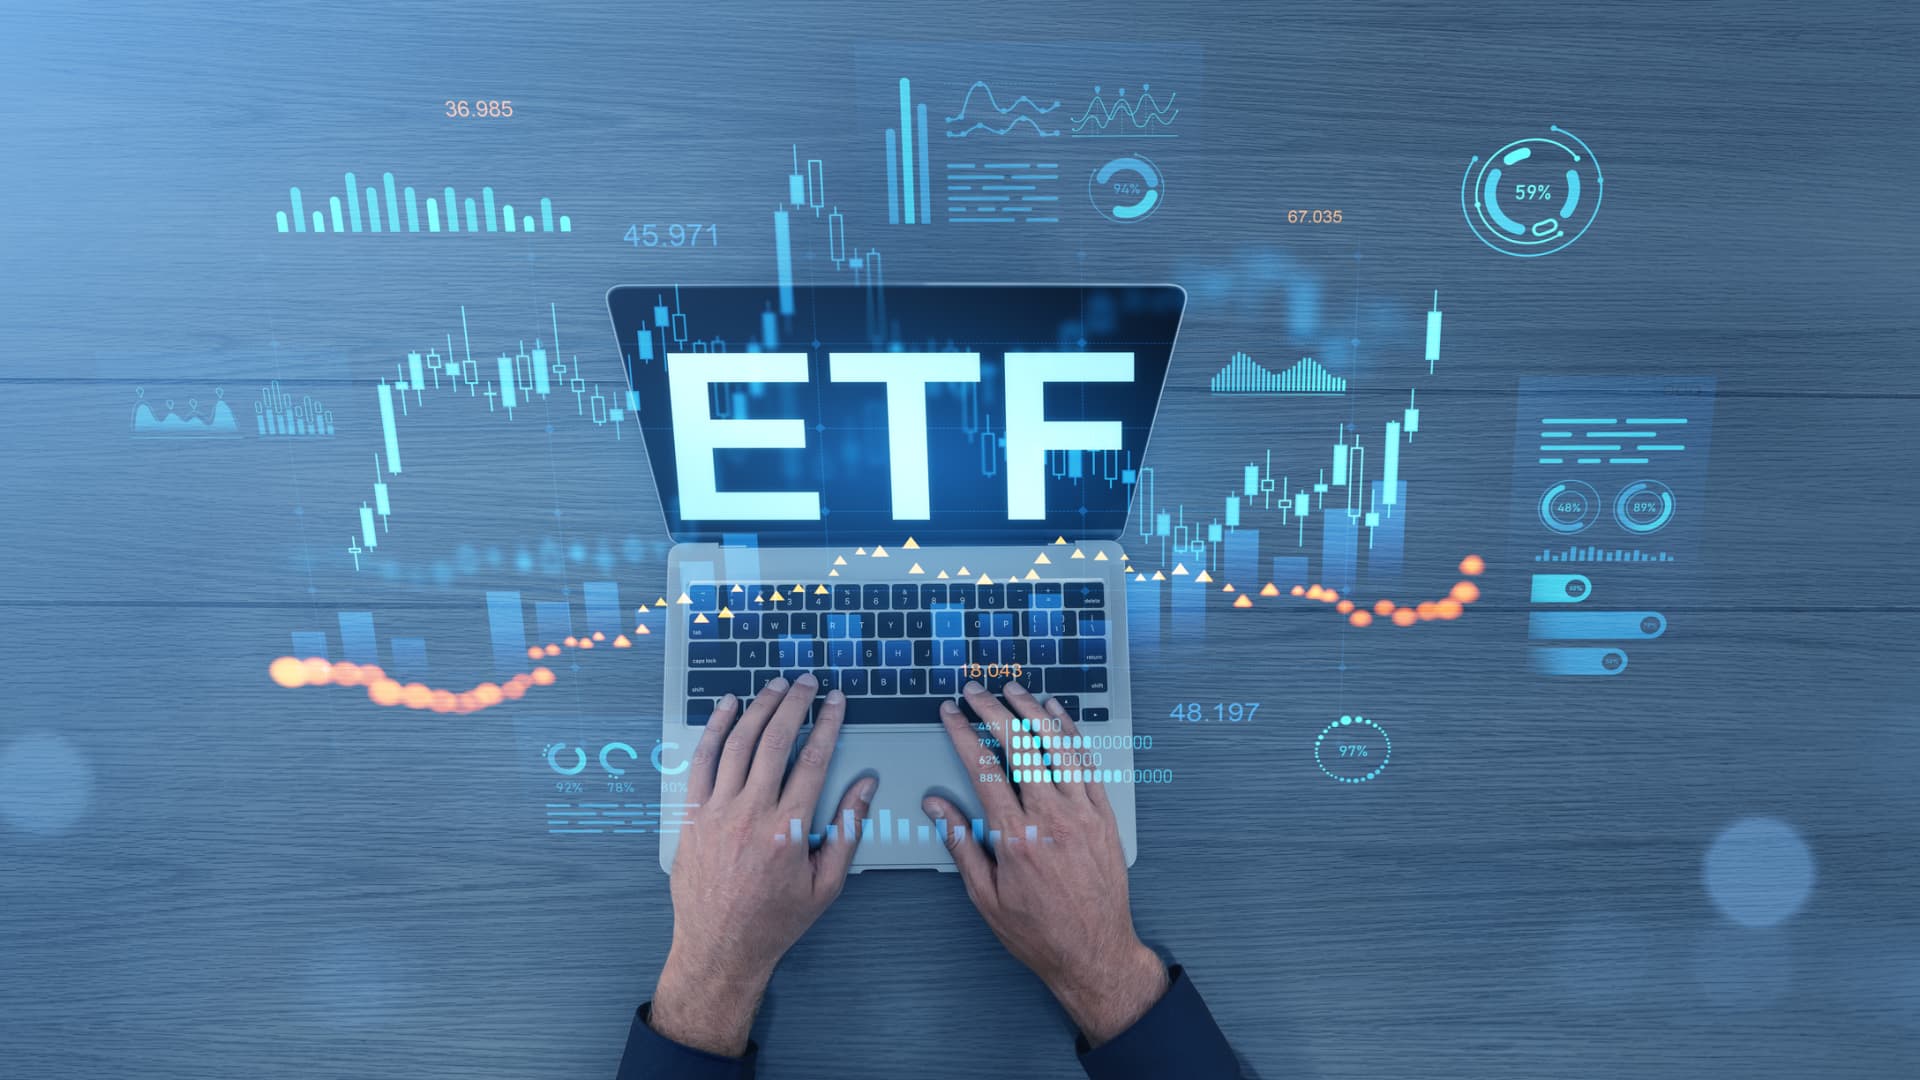
Investors are using put options and inverse ETFs to hedge risk while still positioning for upside in individual technology stocks, according to data from Vanda Research and Charles Schwab. Put options give the holder the right to sell an asset at a stated price by a certain date. Inverse ETFs aim to move in the opposite direction from the index they’re following.
“Retail investors are selectively trading in the classic AI theme but also adding downside protection via options and inverse ETFs,” Vanda’s global equity strategist Kaidi Meng told CNBC in an emailed statement.
Retail flows look very different now compared with prior years, Meng said. “Previously, retail bought any major dips almost without question. However, this year, we are seeing a more selective retail investor that is either switching between stocks quickly or buying underlying stocks while also buying protective puts,” she added.
Since April, Meng said put buying of the top 12 retail-favored stocks in 2026 has almost doubled versus the first quarter, despite an overall reduction in cash purchases of stocks. Put buying went up to 110% from about 26% of net cash buying, even as outright stock purchases have declined. Net cash buying refers to the amount investors spend on purchasing assets versus the amount they sell.
Advertisement
The strategist said growth of ETF strategies, including levered vehicles, has led to a different kind of risk-taking appetite from retail cohorts. “Flows into ETFs signal a trend of reduced outright exposure, rather than just an uptick in downside hedges,” Meng said.
Vanda’s data shows that since mid-April, buying of both bullish and bearish tech ETFs, including leveraged funds, has declined. Bullish activity fell sharply, down about 50%, Meng pointed out, compared with a roughly 35% decline for bearish ETFs.
Overall, Meng said retail investors appear to be adding downside protection through puts on individual stocks and inverse ETFs for broader market exposure, while also cutting their long positions.
“This reduction in long exposure may be a function of broader profit-taking after years of successful buy-the-dip strategies, or this could be a sign of retail investors choosing to take increased risk via more speculative stocks, levered ETFs, and betting sites,” she said.
Advertisement
Some are still bullish underneath
The increased demand for protection, however, doesn’t mean retail investors have broadly turned bearish.
Data from Charles Schwab show that many investors are still buying and positioning for further upside. Schwab investors continued to buy in July despite a choppy market backdrop, lifting the Schwab Trading Activity Index, known as STAX, for a third straight month and bringing it to its highest level since January 2022.
The index rose to 59.80 in July from 59.12 in June. Schwab clients remained net buyers, with the brokerage firm seeing more than two buyers for every seller in July.
A recent report by the firm showed that as many tech stocks pulled back, traders appeared more willing to buy dips in names with sharper moves, while showing less interest in stocks that remained rangebound. Notably, Nvidia, which was regularly among the top five names in STAX, was absent from those rankings in July.
Advertisement
Joe Mazzola, Schwab’s head trading and derivatives strategist, told CNBC the firm saw a modest pickup in put buying on the Invesco QQQ Trust (QQQ) during the week of Aug. 7.
Mazzola said Schwab investors were continuing to sell puts on individual AI-linked stocks such as Nvidia, Micron and Sandisk, taking advantage of elevated option premiums, while buying lower-cost QQQ puts to hedge some of their broader tech exposure.
But he said while the hedging pickup is noticeable, it is not dramatic.
“Put selling and call buying, so they’re trying to position themselves for an additional rally,” he said. A call option gives the investor the right to buy a stock at a specified price by a certain date.
Advertisement
A hedge or directional bet
Inverse and leveraged ETFs can be used to hedge risk, but traders can also use them to make directional bets.
“Many advanced investors continuously evaluate both market opportunities and portfolio risk, adjusting exposures and strategies as market conditions, investment themes, and their own objectives evolve,” Bryan Koplin, head of advanced trading at Fidelity Investments told CNBC in an email.
For example, some may use options or other advanced strategies to help manage portfolio risk or express a market view based on expected price movements.
“Similarly, we’re also seeing continued interest in leveraged and inverse ETFs,” Koplin said. “While these products could be viewed as portfolio hedging, they are frequently used by active traders to make directional bets on expected market movements.”
Advertisement
According to Koplin, their ease of use can make them an attractive alternative to strategies involving margin borrowing or short selling.
But he also warns that investors should carefully consider the objectives, risks and generally short-term nature of these products before trading them.
“As advanced investors evaluate portfolio construction, risk management, and more sophisticated trading strategies,” Koplin said, “access to education, research, and customizable tools can play an important role in helping them make tailored, informed decisions and navigate evolving market opportunities.”
Lizzie Post still remembers the time she walked into a party and an acquaintance greeted her with exciting news: “You had a baby!”
“I’m going to the bar,” Post replied.
Post, co-president of the Emily Post Institute and Emily Post’s great-great-granddaughter, knew the woman meant well. She had apparently heard that something momentous had happened—it hadn’t—and cycled through three incorrect milestones trying to identify it. Fortunately, she eventually stopped guessing: a relief for everyone involved.
Life is full of faux pas, but even when you’re the one making it, you can dig your way out of social quicksand most of the time. Here’s what psychologists and etiquette experts suggest saying, plus when to stop talking.
Advertisement
Your immediate reaction after saying something you regret might be to turn fire-truck red. Then comes the urge to reach for the very thing that got you into trouble in the first place: more words. People often try to explain, defend, or excuse their misfired remark, says Karina Schumann, a social psychologist and associate professor at the University of Pittsburgh who studies apologies and conflict resolution. The instinct is self-protective: They’re frantically trying to repair their image in the other person’s eyes.
“What actual repair looks like is to shift the attention to the other person,” Schumann says. “Put aside this very strong need that you have to repair your self-image, and instead think: ‘If I were on the receiving end of this, what would I need to hear?’”
Pause, acknowledge the impact of what you said, and take responsibility. She suggests phrasing it like this: “I’m sorry. I shouldn’t have assumed.” Or: “I can see that my joke was insensitive. I apologize.”
Then take a breath. More words will still be available later, should the situation require them.
Advertisement
Match the apology to the offense
A minor blunder and a painful faux pas shouldn’t trigger matching productions of remorse. Forget an acquaintance’s name? A quick “I’m sorry—please remind me” may be enough. Ask when someone is due when she isn’t pregnant, or make a joke that accidentally lands on a painful subject? That calls for a direct acknowledgment of the harm, without trying to laugh it off, and perhaps a longer conversation if the other person wants one.
The person responsible isn’t always the best judge of what it will take to repair the situation. Schumann points to a phenomenon researchers call the “magnitude gap”: People who cause harm tend to view it as less severe and less damaging to the relationship than the people on the receiving end do. The offender may think, I apologized; this should be over. The other person may still be wondering how the offender could fail to understand how much it hurt.
Don’t turn an apology into an autobiography
Advertisement
An apology doesn’t require an origin story, a director’s commentary, or a guided tour of everything happening inside the offender’s head.
“Blame is like a hot potato,” says Jennifer Thomas, a psychologist and co-author ofThe 5 Apology Languages: The Secret to Healthy Relationships. Defensive responses—including “I was only joking,” “I didn’t mean it that way,” and “Why did you take it so personally?”—toss it back to the injured person. They minimize the harm, gloss over the offender’s intentions, or suggest the other person is simply too sensitive.
An explanation can sometimes make what happened easier to understand, Schumann says, but it has to provide context without weakening responsibility. Lead with: “I shouldn’t have done that. There’s no excuse for it.” Then ask whether an explanation would be helpful.
A digital faux pas calls for the same restraint. If you send a text to the wrong person with information you wouldn’t have divulged to them otherwise, Post suggests writing: “I’m so sorry. Clearly that text wasn’t meant for you—and I probably shouldn’t have been sending it anyway.” Then leave it at that.
Advertisement
Resist the apology encore
For a minor, accidental blunder—maybe you stuck your toe in your mouth instead of your whole foot—one sincere apology is generally enough. “The more you apologize, the more it’s about you,” Post says. That means no apology cookies, no anguished message the following morning, and no campaign to extract an official declaration that everything is fine.
Serious harm is different. Schumann cautions against treating every apology as a “one-shot thing,” as though finding the perfect words should settle the matter. The other person may need a longer conversation, an effort to make amends, or simply more time.
“The timing of any forgiveness should stay wholly in the hands of the person who was hurt,” Thomas says. An apology offers them a choice, not a deadline.
Advertisement
What if you don’t realize you made a faux pas until hours or days later? It’s usually better to address it than hope the other person forgot, therapist Elika Dadsetan-Foley says. Try: “I’ve been thinking about what I said yesterday. I realize it may have been insulting, and I’m sorry I didn’t recognize that in the moment.”
The next time you meet, act normal
The next time you run into the neighbor you assumed was sick but who had merely gone makeup-free, or the acquaintance who received a text that was definitely not meant for them, offer a friendly greeting. Avoiding the person can make one uncomfortable exchange feel like a permanent rupture; bringing it up again can give a dying embarrassment fresh oxygen.
Keep the story to yourself, rather than retelling it as evidence of what a hopeless fool you are. “You may think that’s you throwing yourself under the bus, but you’re dragging the other person with you,” Post says. Your self-deprecation may get a laugh, but it also makes the other person’s embarrassment public.
Advertisement
Fortunately, most faux pas don’t require a lifelong of self-flagellation. If you’ve apologized sincerely and the other person seems ready to move on, follow their lead. “We all get stuff wrong from time to time,” Post says. Sometimes recovering gracefully means making amends. Other times, it means saying sorry—and letting everyone get on with the party.
Ripple said the $275 million raised will support its expansion into traditional financial services such as prime brokerage and multi-asset clearing, citing strong demand from institutions.














































You must be logged in to post a comment Login