

Crypto World
Who actually trades XRP? Korea and Japan order books

Set aside the ETF headlines and the courtroom drama, and the price of XRP gets made somewhere specific: on won and yen order books.
Summary
- XRP’s marginal price is heavily shaped by Korean and Japanese order books, not just Western ETF flows or Ripple headlines.
- South Korea’s spot-only crypto rules make XRP a high-beta leverage proxy for retail traders unable to use local derivatives.
- Japan’s XRP base is steadier, supported by SBI, stricter regulation, tax policy, and long-term retail familiarity.
- Traders should watch XRP/KRW volume share, won premiums, netflows, KOSPI stress, and ETF flows to read the real market.
On May 13, 2026, XRP did something on South Korean exchanges that no major Western venue has ever shown: it out-traded Bitcoin and Ethereum by combined margins of attention. Upbit, the country’s largest exchange, printed about $110.9 million in 24-hour XRP volume against Bitcoin’s $88.6 million and Ethereum’s $67 million, making the XRP/KRW pair the single busiest market on the platform. Bithumb, the second venue, showed the same pattern, with XRP behind only Tether’s stablecoin pair. The price barely moved, grinding between $1.44 and $1.46 beneath a resistance zone it had failed to break since February.
That single day was not an anomaly. It was the XRP market showing its true face. For all the attention paid to American ETF flows, SEC litigation, and Ripple’s corporate maneuvering, the marginal price of XRP gets set to a remarkable degree on Korean and Japanese order books. Understanding who actually trades this token, and why, explains more about its chart than any partnership announcement ever has.
It explains the violence of its drawdowns, the speed of its squeezes, the strange way it shrugs off news that should move it and erupts on news that should not. What follows is a tour of that market: the Korean machine, the Japanese base, the mechanics connecting them to the global price, and what any of it would take to change. The story is not only about XRP liquidity. It is about the traders whose incentives quietly write the chart most of the world reads too late.
Korea by the numbers
Start with the scale, because the scale is the story. Dunamu, the operator of Upbit, listed XRP as the platform’s most traded asset for the full year, ranking it ahead of Bitcoin and Ethereum across twelve months of order flow, not one viral afternoon. During a volume surge in July 2025, Upbit alone printed $269 million of XRP in 24 hours, the highest figure on any exchange in the world that day, with $161 million of it compressed into a single hour. In the March 2025 episode that doubled global XRP spot volume to $1.84 billion in a day, Upbit’s $452 million led every venue on earth.
Korean trading does not just favor XRP; it favors everything that moves. Altcoins make up 70% to 80% of volume on the country’s domestic exchanges, against a global average near 50%. The market runs on rotation: capital sweeps from one mid-cap name to another in days, chasing whatever is trending on the country’s hyperactive trading communities, then sweeps out again. XRP holds a special place inside that rotation as the permanent fixture, the asset Korean retail returns to in every cycle, familiar enough to be a default and volatile enough to be interesting.
The May episode showed the rotation’s other trigger: the local stock market. XRP’s surge to the top of the Korean books came as the KOSPI index slumped, and reporting at the time was blunt about the mechanism: middle-aged retail traders rotating out of weak equities and into the most familiar high-beta crypto asset available. When Korean stocks disappoint, a measurable slice of that frustration arrives on the XRP order book within days. No Ripple press release is involved at any point in the process.
The spot-only rule that explains everything
Why XRP, though? Why does a payments token with a corporate parent in San Francisco function as the national trading vehicle of South Korean retail? The deepest answer sits in Korean regulation, and it is the single most underappreciated fact in XRP market analysis. South Korea prohibits domestic crypto derivatives for retail, which means no futures, no options, and no leveraged tokens on local venues.
Access to offshore derivatives platforms is legally restricted, so Korean traders who want amplified exposure have exactly one tool available: volatility itself. A spot-only trader replicates leverage by choosing assets that move twice or three times as hard as Bitcoin, and XRP, with its deep liquidity, household familiarity, and high beta, is the closest thing the Korean rulebook allows to a leveraged Bitcoin position. Read the order book through that lens and its strangeness becomes rational. The preference for XRP over Bitcoin is not a belief about cross-border payments or a vote on Ripple’s lawsuit.
It is a structural workaround: the most liquid lottery ticket in a market where the casino only sells spot. The same logic explains the 70% to 80% altcoin share, the days-long rotation cycles, and the short holding periods that local analysis describes as a market optimized for short-horizon decisions over conviction. None of this flow is reading Ripple’s quarterly reports. Most of it would rotate into a different ticker tomorrow if a different ticker moved better.
For XRP’s global price, the consequence is a permanent, structural layer of demand that is enormous, loyal in aggregate, and utterly mercenary in the particulars. Korea will always trade XRP. Korea will not always be buying it. That distinction is why Korean volume can be bullish for liquidity and bearish for price at the same time.
The kimchi premium and the plumbing
Korean crypto markets carry a famous quirk with real consequences for XRP: prices on won pairs regularly detach from global levels, trading at a premium in manic phases and occasionally at a discount in fearful ones. It exists because Korean liquidity is partially sealed off, with capital controls and strict banking rules making arbitrage between won markets and global markets slow and legally fraught. When Korean demand surges, prices on Upbit can run several % above Binance for hours or days before the gap closes. For a token as Korea-weighted as XRP, the premium mechanics work like a feedback amplifier.
A global uptick draws Korean momentum buying, the won price runs ahead, premium-watching traders worldwide read the gap as a bullish signal and front-run the arbitrage, and the global price chases the Korean one upward. The loop runs equally well in reverse: Korean capitulation drags won pairs to a discount, the discount reads as a death signal, and global selling accelerates. Twice in the past decade, broad altcoin manias have effectively been Korean premium events exported worldwide, and XRP sat near the center both times. The kimchi premium is not a curiosity around the XRP market; it is part of the market’s transmission mechanism.
The netflow data adds a final wrinkle that volume numbers hide. During the July 2025 surge, even as Upbit led the planet in XRP volume, the exchange showed a negative net XRP flow of more than $100 million in a day, meaning tokens were leaving the venue even as trading exploded. Volume measures excitement, while netflow measures direction. Korean XRP data routinely shows the two pointing opposite ways, which is just what a rotation-driven, fast-money market should produce, and why headlines celebrating Korean volume as adoption get the story wrong.
How XRP became Korea’s coin in the first place
Korean retail’s marriage to XRP predates everything in today’s data, and the history explains the loyalty better than any present-day incentive. During the 2017 mania, South Korea briefly became the center of the crypto universe, and XRP was its favorite child. Korean won volume drove a staggering share of global XRP trading through that winter, the kimchi premium blew out to double digits, and the token’s vertical January 2018 top, the all-time high that still anchors every long-term chart, was to a remarkable degree a Korean event. Won pairs led the world up and then led it down when regulators threatened exchange closures.
An entire generation of Korean traders made and lost fortunes on XRP specifically, and markets remember their first loves. The asset that minted a country’s defining boom-and-bust story became permanent furniture in its trading culture. Entrenchment deepened through the quiet years, because while Western exchanges delisted or sidelined XRP during the SEC lawsuit, Korean venues never did. The token kept its premier placement on Upbit’s screens through the entire legal winter.
By the time American institutions returned to the asset in 2024 and 2025, Korean retail had simply never left. That is why the country’s order books today carry the depth, familiarity, and reflexes that a decade of continuous trading builds. The Korean XRP market is not a recent enthusiasm. It is an institution with a longer unbroken history than most of the asset’s Western infrastructure.
The concentration nobody prices: Upbit itself
One more fact shapes the map, because it concentrates an uncomfortable amount of XRP’s market structure in a single point of failure: Upbit’s dominance of Korean trading. Upbit handles the overwhelming majority of Korean crypto volume, operating through a real-name banking partnership that gives it privileged access to the won on-ramp. Korean regulators have spent recent years openly examining that concentration, from anti-monopoly scrutiny of the exchange’s market share to reviews of its banking arrangement. For most assets, a Korean policy shock would be a regional story.
For XRP, whose single busiest global trading pair has repeatedly been Upbit’s won market, it would be a direct hit to the token’s primary price discovery venue. A suspension, a banking partner change, or a forced market share remedy in Seoul would do more to XRP’s daily liquidity than any plausible action by the SEC. Risk runs the other direction too, and traders should hold both. Korean policy has been drifting toward expansion, not restriction, with institutional access and ETF frameworks under discussion, and Upbit’s parent has been positioning for that bigger market.
The point is not that Seoul threatens XRP. The point is that a token whose price formation leans this heavily on one venue in one jurisdiction carries a concentration risk that appears in no Western risk model, and it costs nothing to know it. Upbit is not just another exchange in XRP’s market structure. It is one of the places where the market’s center of gravity actually sits.
Japan: the other pillar, built differently
Cross the strait and the XRP market changes character completely. Japan holds one of the world’s oldest and deepest XRP retail bases, but it trades nothing like Korea, and the difference between the two books is a lesson in how regulation shapes behavior. Japanese crypto runs through exchanges licensed by the Financial Services Agency under some of the strictest consumer rules anywhere: segregated customer assets, cold storage mandates, and listing reviews that can take years. Inside that conservative perimeter, XRP achieved something unusual: institutional sponsorship.
SBI Holdings, one of Japan’s largest financial groups, has been Ripple’s most committed corporate ally for nearly a decade, running a joint venture for Asian payments, holding XRP on its own balance sheet, championing the token through the public statements of its chief executive Yoshitaka Kitao, and wiring XRP into live remittance corridors through SBI Remit. These include the Japan-to-Southeast-Asia routes where the token actually performs its original bridge function. Japanese retail absorbed that sponsorship years ago. XRP became, for a generation of Japanese savers, the respectable altcoin, the one a major financial institution had publicly blessed.
Japanese policy quietly reinforces the holding culture. Crypto gains in Japan are taxed as miscellaneous income at progressive rates that can approach the mid-fifties for high earners, a regime that punishes active trading and rewards sitting still, the exact inverse of Korea’s flat-rate deferrals and rotation-friendly structure. SBI has layered its own incentives on top over the years, at times offering XRP itself as a shareholder benefit, an arrangement with no real parallel anywhere in crypto: a blue-chip financial conglomerate handing its registered shareholders the token as a perk. Between the tax code and the corporate sponsorship, Japanese XRP sits where it lands.
The result is a holder base with the opposite metabolism to Korea’s. Japanese XRP money skews toward accumulation and long holding, moves less day to day, and shows up in the data as a stabilizing floor rather than a momentum engine. Korea supplies XRP’s velocity; Japan supplies a meaningful share of its patience. Both books are retail, both are enormous, and they pull the token in different directions: one amplifying every swing, the other quietly absorbing supply through them.
What this microstructure does to the chart
Put the pieces together and several chronic mysteries of XRP price behavior dissolve. Take the drawdown violence first. XRP routinely falls harder than its market cap peers in broad selloffs, and this spring was no exception, with the token losing roughly 17% in a single week of the June slide while breaking supports that had held for months. A market whose marginal trader is a spot-only momentum player has no natural buyer during declines.
The Korean book that supplies the bid in uptrends rotates elsewhere the moment momentum dies, taking its 70%-of-volume firepower with it, while the patient Japanese bid sits far below the action by design. Between the momentum layer and the accumulation layer lies an air pocket, and XRP falls through it with regularity. Then comes the news immunity. Corporate announcements that thrill Western holders routinely fail to move the price, while obscure local catalysts, a KOSPI slump, a Korean community rumor, or an exchange promotion, produce hundred-million-dollar volume days.
The marginal buyer does not read Ripple press releases, so Ripple press releases do not move the margin. The flow responds to what its actual drivers respond to: momentum, rotation, local market conditions, and the premium signal. The squeeze behavior follows the same logic. When XRP does catch a genuine uptrend, the same machinery that amplifies declines turns around and amplifies the rally, with Korean rotation capital piling into the most familiar name on the board and the premium loop exporting the move globally.
The token’s history of violent, late-cycle vertical rallies, the kind that triple the price in weeks after months of stagnation, is the signature of this structure. The spot-only leverage proxy works in both directions. It punishes the token when momentum disappears and rewards it when rotation comes back. That is why XRP’s chart can look dead for months and then move like a small cap when the right book wakes up.
Reading the signals correctly
For a trader or a journalist, the practical payoff of all this is a different dashboard. The standard XRP analysis toolkit, ETF flow tables, whale wallets, legal calendars, misses the market’s actual engine, and a Korea-aware toolkit looks different. Watch the XRP/KRW volume share on Upbit, not just the global total: a rising Korean share during a rally signals rotation money, the kind that leaves, while a rally on flat Korean share suggests something rarer and more durable is bidding. Watch netflow against volume, because volume spikes with negative netflows mark distribution dressed as enthusiasm.
Watch the premium: won pairs trading rich against global levels is a real-time gauge of Korean retail temperature, and its collapses have led global XRP downturns more reliably than any moving average. Watch the KOSPI too, absurd as it sounds, because the strongest single-day XRP volume event of the spring was triggered by a Korean equity selloff, not by anything that happened to Ripple. The signals also clarify what Korean volume cannot tell you. It cannot confirm institutional adoption, which lives on entirely different rails.
It cannot validate the payments thesis, since the flow is expressly speculative. It cannot anchor a long-term price target, because rotation capital prices nothing beyond the next move. This is where the full XRP price outlook must separate microstructure from fundamentals, because the book can explain the next swing without answering the long-term valuation question. The Korean book is a magnificent amplifier and a terrible oracle.
A worked example: reading one week of tape
Theory earns its keep in practice, so take the early-June slide as a worked example of the Korea-aware dashboard against the standard one. A standard reading of that week was straightforward and mostly useless: XRP fell roughly 17%, whales were selling, and support broke. A microstructure reading saw more. Korean volume share in XRP had been climbing for weeks while global price stalled under resistance, the classic signature of rotation money carrying the bid alone.
Netflows on the won venues had turned negative even on green days, meaning the loudest book in the market was distributing into its own enthusiasm. When the broad selloff arrived, the momentum layer did what the structure predicts, vanishing rather than defending. The token fell through the air pocket between the Korean bid and the Japanese one until it found the deeper levels where patience lives. Nothing about the move required whale conspiracies or news catalysts.
The order books had been describing it in advance to anyone reading the right columns. The example generalizes into the simplest possible rule for this asset: when Korean share rises and netflow falls, treat strength as borrowed. When Korean share falls while price holds, something sturdier than rotation is bidding, and that is the rarer and more valuable signal. The rule will not call tops and bottoms, but it will tell you who is on the other side of your trade, which is most of what microstructure can ever offer.
What would change the structure
Market structures this entrenched change through regulation, and two live regulatory tracks could redraw the XRP map within a couple of years. The Korean track runs toward liberalization. Seoul has spent 2025 and 2026 inching toward institutional participation in crypto, debating corporate trading accounts, spot ETF frameworks, and eventually derivatives access. Every step in that direction dilutes the spot-only distortion that makes XRP the national leverage proxy.
A Korean retail trader with access to regulated Bitcoin futures has less structural reason to express risk appetite through XRP, while Korean institutions entering spot markets would add exactly the slower, conviction-weighted flow the book currently lacks. Liberalization would likely shrink XRP’s share of Korean volume and deepen its quality at the same time, a trade long-term holders should welcome and momentum traders will mourn. The American track runs through the CLARITY Act and the ETF era. If U.S. market structure law settles XRP’s status permanently, the institutional flows that today tiptoe through ETF wrappers gain room to grow into something that rivals the Asian retail base at the margin.
The token’s price formation would then have three real engines: Korean momentum, Japanese patience, and American allocation, instead of two and a rounding error. The institutional flows that today tiptoe through ETF wrappers are still modest compared with the Asian retail base, but they are the one Western channel capable of changing the marginal buyer over time. If they deepen, XRP stops being priced mainly by Asian retail rotation and starts being priced by allocation mandates too. That would not erase Korea or Japan, but it would reduce their dominance.
Japan is also moving toward a more formal ETF regime, and XRP sits close to that conversation because of SBI’s long relationship with Ripple. A Japan ETF track would not look like Korea’s rotation market, because Japanese investors are slower-moving and more regulation-sensitive. But an approved XRP ETF in Japan would reinforce the country’s role as the patience layer rather than the momentum layer. That would deepen the book in the direction XRP has historically lacked.
Other fundamentals can still matter, but they need to create demand that survives the trading cycle. The on-chain credit system in validator voting would matter for XRP if it turns ledger activity into locked supply, yield demand, and practical use rather than another announcement cycle. That kind of utility would not replace the Korea-Japan structure immediately. It would, however, give non-speculative buyers a reason to exist beside it.
Nothing about the current chart guarantees that future. But it is the only visible path to an XRP market where the marginal price-setter holds for reasons connected to what the asset is supposed to do. Until then, the book remains the map. The first sign of change will not be a headline; it will be a shift in volume share, netflow, premium behavior, and ETF persistence.
The book does not lie
Every asset’s chart is a referendum on who owns it, and XRP’s chart has been telling the same story for years to anyone willing to look past the headlines and into the order flow. The token’s price gets made by a Korean retail machine that loves its volatility and owes it nothing, steadied by a Japanese base that bought a story its institutions endorsed a decade ago, and increasingly orbited by Western institutional money that has so far committed only modestly. The chart’s character, explosive, treacherous, indifferent to news, loyal to momentum, is not a mystery or a manipulation. It is the faithful signature of that ownership.
That means the question that matters for XRP’s next act is not the one usually asked. Not what will Ripple announce, but who will the next marginal buyer be. If the answer stays the Upbit rotation trader, the chart will keep behaving exactly as it always has, in both directions. If the regulatory tracks in Seoul and Washington deliver new kinds of buyers, the chart will start telling a new story.
The first place that change will show is not in the price at all. It will show in the books, in the share columns and the netflow tables, weeks before the headlines catch up, the way everything about this token always has. For now, XRP remains a token whose global story is often written in English but whose price is frequently negotiated in Korean won and Japanese yen. The book does not lie; the mistake is reading the wrong one.
As of June 11, 2026. Volume figures and market shares shift daily; verify current data before trading. This article is information, not investment advice.


TLDR:
- TAO price surged over 24% on June 13, closing at $264 after opening near $212 in the session
- RSI bottomed in the low 30s, matching the same zone that marked the prior three swing lows on TAO
- Bittensor subnet activity had been accelerating quietly while the TAO price was trending lower
- The $280 to $320 zone is now the key resistance band TAO must reclaim to confirm the bullish trend
The TAO price recorded one of its largest single-day gains of 2025 on June 13, closing above $264 after opening near $212.
The move ended a seven-month downtrend that had pushed the asset from the $500 region into the low $200s. Multiple technical signals aligned ahead of the breakout.
Sentiment had turned deeply bearish in the weeks before the reversal candle printed.
Technical Signals Preceded the TAO Price Reversal
The TAO price had been compressing for months before Thursday’s session. Each rally attempt during the downtrend met fresh selling pressure near established resistance zones. Buyers were unable to hold any meaningful recovery, and many traders had written off the chart entirely.
However, momentum indicators were signaling a shift beneath the surface. The RSI had bottomed in the low 30s, the same region that marked the three prior swing lows on the chart.
Analyst account @2xnmore noted that oscillators were already curling higher before price confirmed the move.
The MACD histogram had also been compressing for several weeks heading into the reversal. That compression pointed to sellers losing steam rather than buyers gaining strength. It was a quiet warning sign that most traders overlooked during the grind lower.
Volume on the reversal candle removed any doubt about the session. It dwarfed anything seen across the prior two months of sideways action. That kind of participation on a single green candle separates genuine reversals from dead-cat bounces.
Bittensor Network Activity and the Road Ahead for TAO Price
While the TAO price was falling, Bittensor’s subnet activity was quietly accelerating. That divergence between price and network growth went largely unnoticed by retail participants. Institutional attention toward the network, however, had reportedly been building well before Thursday’s session.
The broader AI infrastructure narrative around Bittensor also remained intact throughout the drawdown. Discussions tied to co-founder Jacob Steeves and the network’s role in decentralized AI were still in early stages.
AI-related tokens have historically moved in cycles, with the first recovery candle rarely marking the full extent of a move.
The zone between $280 and $320 now becomes the critical area to monitor. That range previously acted as support before the breakdown and must be reclaimed on a closing basis. A sustained move through that band would add weight to the bullish case.
The 200-day moving average continues to serve as the long-term dividing line for TAO. Reclaiming major support after a multi-month downtrend is one of the stronger technical setups on any chart. Traders who were stopped out near the lows are now watching from the sidelines as price moves higher.

Crypto World
Uniswap Tokenized Securities Go Live, Bringing SpaceX, Apple, Tesla, and NVIDIA Onchain

TLDR:
- Uniswap tokenized securities are now live on the web app, wallet, and API for eligible users.
- Over $9.1 billion has been swapped in real-world asset pools across 2.6 million transactions.
- Uniswap v4 hooks allow issuers to set KYC gates, allowlists, and dynamic fees at pool level.
- Builders using the Uniswap API need no extra configuration to expose tokenized assets to users.
Uniswap tokenized securities are now accessible across the platform’s web app, wallet, and API. Users can trade tokenized versions of SpaceX, Apple, Tesla, and NVIDIA directly through Uniswap products.
Previously, these assets existed on the protocol but lacked integration into consumer-facing surfaces. That gap has now closed, opening regulated asset markets to a broader onchain audience.
Uniswap Opens Access to Real-World Asset Trading
The launch marks a notable expansion of Uniswap’s real-world asset coverage. To date, more than $9.1 billion has moved through real-world asset pools on the protocol.
Those transactions span over 2.6 million swaps across more than 140,000 wallets. As Uniswap noted on X, “The world’s value is moving onchain.”
Equity, fixed income, and yield-bearing instruments represent the bulk of global financial assets. These asset classes are gradually migrating to blockchain infrastructure as regulatory clarity improves.
Uniswap’s integration positions the protocol as an early access point for that transition. The timing aligns with growing institutional and retail interest in tokenized finance.
Eligible users can access tokenized securities through the Explore Page on the Uniswap Web App. The process mirrors any standard token swap on the platform.
Users connect a wallet, select the desired asset, and confirm the transaction. However, issuer-imposed KYC requirements, whitelists, and jurisdictional restrictions may apply.
Uniswap v4’s hook infrastructure also supports issuer-configured transfer restrictions and dynamic fee structures at the pool level. This gives issuers the ability to manage compliance without sacrificing liquidity access.
Geographic gates and allowlists can be embedded directly into pool logic. That level of configurability is central to supporting regulated asset markets onchain.
Protocol Infrastructure Powers Builders and Issuers
Builders can integrate tokenized stocks, bonds, and yield-bearing assets through the existing Uniswap API. No additional configuration is needed for developers to expose these assets to their users.
The same routing and liquidity infrastructure already in use for crypto assets now extends to securities. That continuity reduces friction for teams building on top of Uniswap.
Uniswap’s protocol has processed over $4.4 trillion in cumulative volume since launch. That liquidity depth makes it a practical backend for tokenized asset markets.
Onchain assets also trade outside traditional market hours, unlike their TradFi equivalents. That availability is a structural advantage as global adoption grows.
Assets settled onchain are composable across wallets, applications, and DeFi protocols. Any agent or interface with API access can tap into the same liquidity pools.
This composability supports the broader buildout of onchain financial infrastructure. It also reduces fragmentation across tokenized asset platforms.
UNI traded at $2.54 at the time of publication, up 0.43% in the prior 24 hours.
Source: Coingecko
Weekly gains stood at 4.84%, reflecting moderate market momentum around the announcement.


However, the two largest incidents were not simple smart-contract exploits of the type AI could engineer.
In one, a North Korea-linked group drained about $285 million from Drift Protocol after a six-month social-engineering campaign that won it admin access. For the other, the attacker exploited a single-verifier flaw that allowed roughly $292 million to be siphoned from Kelp DAO.
Another example hit on Tuesday, when Humanity Protocol, a decentralized human-identity service, lost over $30 million to a private-key compromise. CoinDesk found that a hacker gained access to three out of six private keys on one employee’s laptop,
Therein is the problem. While the most obvious smart-contract prompts may be exactly the ones Anthropic’s filters are designed to catch, the largest losses have not needed a contract bug.
The exploits, Ledger’s Guillemet noted, come from familiar weak points: social engineering, bad signing flows, exposed keys and human error.
A model like Fable does not need to hand over a finished exploit to change the economics of an attack. It can read public repositories, compare old versions of software, summarize audit reports and draft convincing messages that look for the small operational mistakes humans miss.
“These exploits remain rooted in social engineering and human error. “
A defender, in such an environment, has to secure every key path, every dependency, every signing flow and every privileged account. Because AI accelerates the scouting phase, the final signing step becomes more important. Private keys need to sit somewhere a compromised laptop cannot reach, and users need a trusted screen that shows what they are actually approving.

Strategy’s executive chairman Michael Saylor has defended the company’s first reported Bitcoin sale since 2022, arguing that the ability to sell BTC—at least when it’s required to back certain financial obligations—is a prerequisite for the firm to keep issuing “digital credit.”
The defense comes after Strategy disclosed the sale in a June 1 filing with the U.S. Securities and Exchange Commission: the company offloaded 32 BTC, a move that contrasted with Saylor’s widely repeated “never sell your Bitcoin” message. Speaking at BTC Prague, Saylor framed the decision as part of a broader credit thesis for Bitcoin-based financial products.
Key takeaways
- Strategy disclosed a June 1 SEC filing showing it sold 32 BTC for the first time since 2022.
- Saylor says Bitcoin must remain sellable so digital credit products can retain value and support dividend- and credit-linked obligations.
- He described Strategy’s STRC preferred stock as a “digital credit” instrument designed to route value from its Bitcoin balance sheet.
- Saylor claims digital credit could support yield-bearing crypto financial products and cited yields up to 8% for such structures.
- Apyx’s apxUSD stablecoin depegged amid BTC and STRC declines, illustrating how collateral volatility can test these systems.
Why Strategy chose to sell Bitcoin
In a June 1 SEC filing, Strategy disclosed its first reported Bitcoin sale since 2022, selling 32 BTC. The transaction stood in tension with Saylor’s long-running public stance that Bitcoin should not be sold.
In an interview with Cointelegraph at BTC Prague, Saylor argued that companies building Bitcoin-backed finance cannot treat BTC as untouchable capital. Instead, they need the flexibility to sell holdings when necessary to maintain the economic basis of credit instruments—particularly those tied to dividends and other payouts.
“If the company’s policy is that we won’t sell the Bitcoin, then the credit won’t have value and the equity won’t have value,”
he said, adding:
“The company is in the business of selling digital credit. The credit is backed by capital. Bitcoin is capital.”
“Digital credit” as a new use for the Bitcoin balance sheet
Saylor expanded on the concept by positioning Strategy’s financial products as components of a credit market built on Bitcoin holdings. In his explanation, instruments such as Strategy’s STRC preferred stock function as “digital credit,” leveraging the company’s Bitcoin treasury to meet credit obligations.
Crucially, Saylor also tied this framework to Strategy’s capital strategy. For the company, these securities have become a key path to raise funding that can then be used to acquire additional Bitcoin. In other words, the sale—however limited—should be viewed less as abandoning a core Bitcoin conviction and more as enabling a loop intended to sustain issuance of Bitcoin-backed credit products.
Yield claims and the collateral test from apxUSD
Saylor described digital credit markets as an emerging “trillion-dollar opportunity” in finance, arguing they could enable yield-bearing digital money products. He also suggested that these structures may offer yields of up to 8%, which he said is multiple times higher than traditional savings accounts.
Part of his argument is that digital credit could change how participants think about credit and yield while drawing capital into the Bitcoin ecosystem. He pointed to projects operating within this model, including Saturn and Apyx, and emphasized that yield-bearing products built on top of digital credit can face real-world stress—sometimes quickly.
On June 4, Apyx Finance’s dividend-backed synthetic stablecoin apxUSD reportedly depegged, trading as low as $0.90. At the time, Bitcoin was trading below $63,000 and STRC shares had fallen below their $100 par value.
According to Apyx, the decline in STRC—apxUSD’s primary collateral asset—reduced the protocol’s reserve value. The company also pointed to falling Bitcoin prices, thinning liquidity, and derivative-driven market dynamics as contributing factors, citing a post on X from Apyx.
At the time of Cointelegraph’s reporting, apxUSD was trading around $0.96, still below its $1 peg, as tracked by CoinGecko.
What this exchange between “never sell” and sellability means
The core tension in the story is not merely reputational; it goes to how investors and counterparties should interpret Bitcoin as collateral. Saylor’s argument suggests that Bitcoin treasury companies must preserve the option to sell in order to keep credit instruments credible—particularly when those instruments depend on the value of collateral and the ability to cover obligations.
Meanwhile, the apxUSD episode underscores how sensitive these systems can be when collateral benchmarks move in tandem. When STRC falls below par and Bitcoin weakens, collateral values and liquidity conditions can deteriorate at the same time, putting pressure on mechanisms designed to maintain stablecoin pegs.
For readers watching the evolution of Bitcoin-based credit, the takeaway is practical: the “digital credit” thesis depends on collateral behavior and on whether protocols can manage volatility in a way that sustains promised yield and payout structures without breaking pegs.
With Strategy’s disclosed sale and apxUSD’s depeg both tied to a period of BTC and collateral weakness, the next question for the market is whether future issuances, liquidity provisions, and collateral management techniques will reduce the frequency and severity of these stress events—or whether such drawdowns will continue to be part of the risk profile of yield-bearing Bitcoin credit products.

Despite last week’s controversial developments on the war front between Iran, the US, and several other nations involved in the conflict, Donald Trump promised on his social media platform minutes ago that a permanent deal is expected to be announced tomorrow.
Given bitcoin’s susceptibility to positive or negative news related to the war, the question now is whether it will benefit if Trump delivers on his promise.
In his lengthy post on Truth Social, the POTUS began by blaming the previous major deal signed with Iran during Barack Obama’s presidency. He called it a “smooth road to a Nuclear Weapon,” while his agreement with the Middle Eastern country is “the exact opposite.”
He emphasized that the new deal will serve as a “WALL TO NO NUCLEAR WEAPON.” Moreover, he claimed that Iran no longer wants to develop such a weapon, “nor will they have one, either through purchase, development, or any other form of procurement.”
Perhaps most importantly, Trump promised that the deal is “scheduled to get signed tomorrow, and immediately after it is signed, the Hormuz Strait is OPEN TO ALL.”
“We look forward to working with Iran, and the entire Middle East, long into the future. Hopefully, this process will all work out quickly, easily, and smoothly. If it doesn’t, we have the ultimate alternative, hopefully never to be used again,” he added.
Recall that bitcoin’s price was immediately impacted when the war started on February 28, with a painful decline by several grand. However, it skyrocketed once the first ceasefire deal was announced and when it was extended.
As such, the overall community sentiment has shifted after Trump’s post, with anticipation of a more profound recovery if, of course, the deal is actually signed tomorrow, because this is not the first similar promise made over the past few months.
The post Will BTC Rocket if Trump Delivers on His Iran Deal Promise This Sunday? appeared first on CryptoPotato.
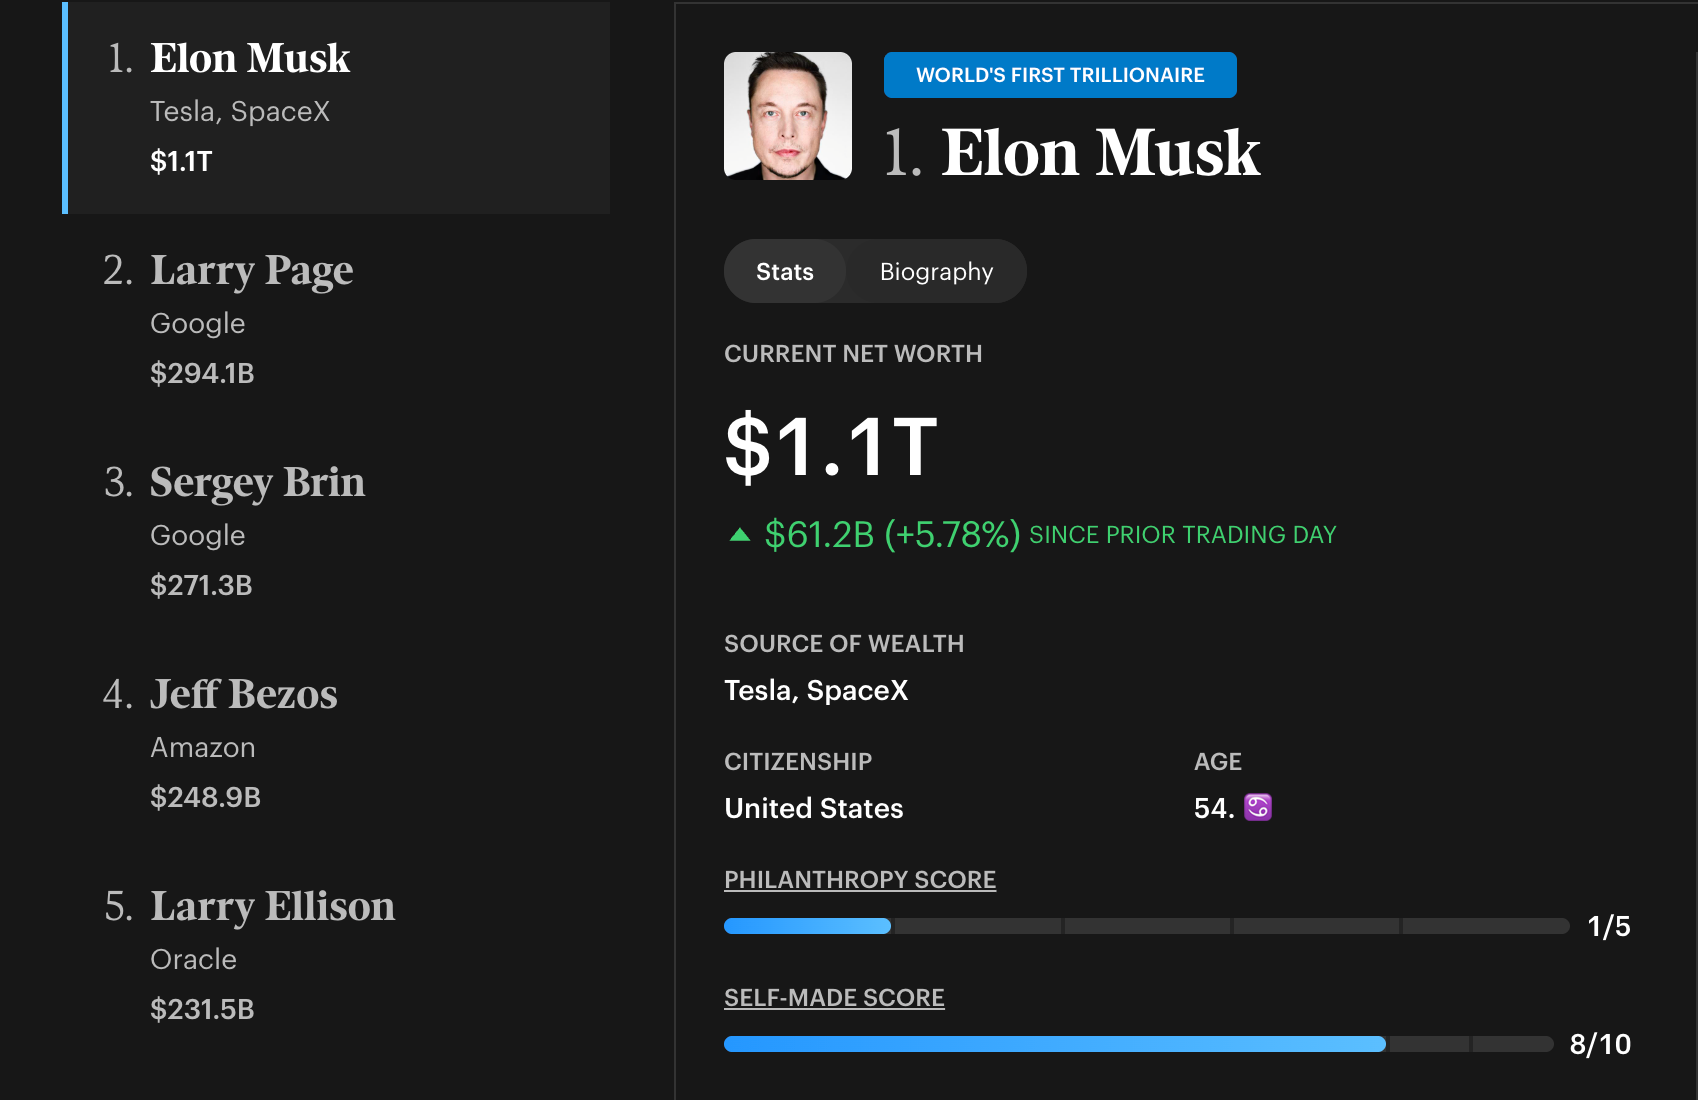
Elon Musk became the world’s first trillionaire on June 12. His net worth reached roughly $1.1 trillion after SpaceX raised $75 billion in a record initial public offering (IPO).
The jump has widened an already historic gulf between the ultra-rich and everyone else. Forbes data shows a 1,464,078% wealth gap between the average billionaire and the average American.
How Elon Musk’s Trillion Stacks Up
Musk now sits far ahead of his peers. His fortune tops the combined wealth of Larry Page, Sergey Brin, Jeff Bezos, and Larry Ellison, according to Forbes. The same data tracks the top 10 billionaires at $3.1 trillion.

The billionaires added $68.2 billion in a single day. Meanwhile, most households saw little change in their own wealth. The concentration extends worldwide.
The richest 10% own 75% of global wealth, while the bottom half holds just 2%, according to the World Inequality Report.
“Fewer than 60,000 multi-millionaires now control three times more wealth than half of humanity combined. Within most countries, the bottom 50% rarely possess more than 5% of national wealth,” the report revealed.

In January, Oxfam reported that the 12 richest billionaires hold more wealth than the poorest half of humanity (over 4 billion people).
“The world has reached a critical juncture. Extreme inequality has reached the point where the super-rich can rig elections and economies, and deepen their power through politics, the media and institutions of justice. Meanwhile, billions of people face avoidable hardship and the erosion of their civil and political rights, and dissent and protest are crushed by governments the world over,” Oxfam noted.
In the US, the top 1% holds 31% of wealth, compared with 2.6% for the bottom half, per WealthVieu. Musk’s wealth surge after SpaceX’s Nasdaq debut widened that imbalance.
Lawmakers Push to Tax the Rich
The record fortune landed during a squeeze on US households. Inflation hit 4.2% in May, a 3-year high amid the US-Iran war. Americans have spent $57.7 billion more on gasoline and diesel since the Iran war erupted on February 28.
That works out to roughly $440.6 per household. National gas prices now sit at $4.1 a gallon, according to a live tracker run by Brown University’s Watson School of International and Public Affairs. Meanwhile, US lawmakers have renewed their push for wealth taxes.
“Elon Musk just became the world’s first trillionaire. The typical American household would have to work more than 11 MILLION years to make Elon Musk’s level of wealth. We need a wealth tax,” Senator Elizabeth Warren posted.
Senator Bernie Sanders, Representative Pramila Jayapal, and more are backing the same approach.
Follow us on X to get the latest news as it happens
The coming months will test whether record fortunes shift the tax debate in Congress.
Subscribe to our YouTube channel to watch leaders and journalists provide expert insights
The post Elon Musk’s $1 Trillion Fortune Puts America’s Wealth Gap in Focus appeared first on BeInCrypto.
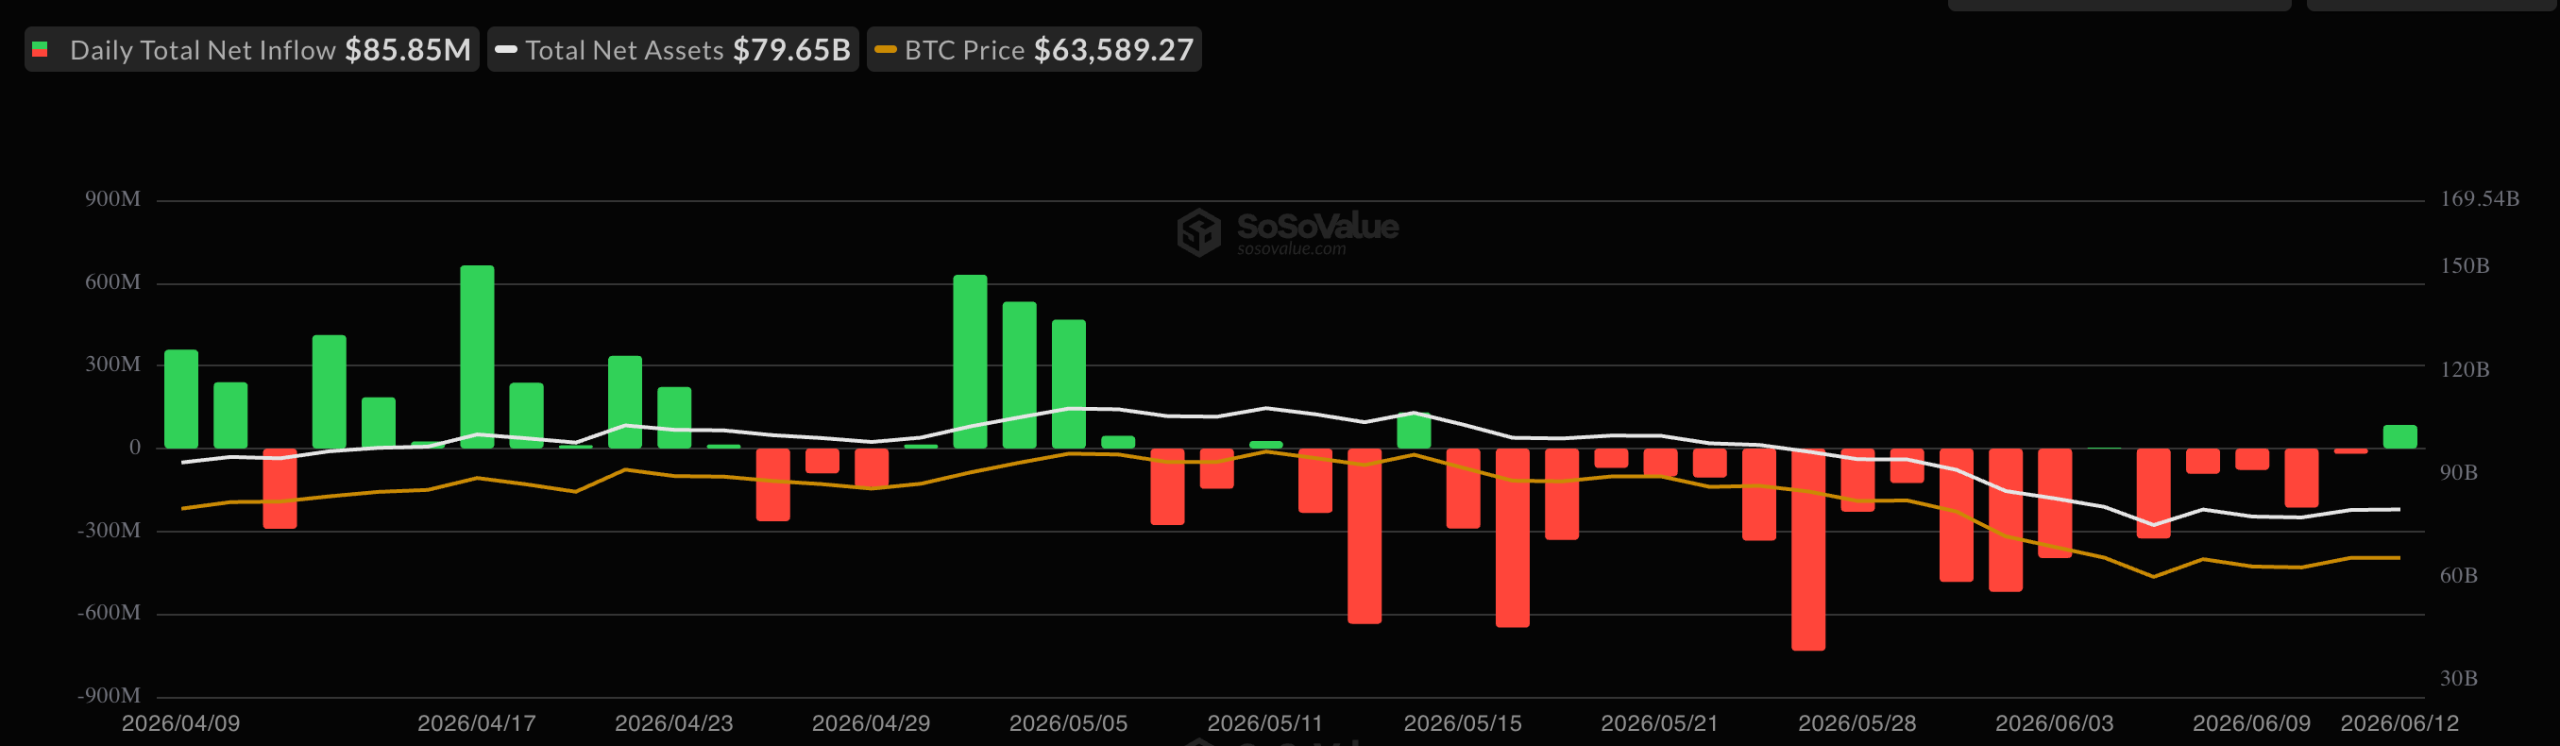
Bitcoin spot exchange-traded funds drew $85.85 million in net inflows on June 12, the largest single-day in about 4 weeks. The reversal arrived on the same day SpaceX made its record Nasdaq debut.
The inflow broke a five-session withdrawal streak that pulled roughly $727 million from the funds.
BTC ETF Inflows Return After a Bruising Stretch
The June 12 total marks the strongest single-day demand since May 14, when the funds absorbed $131.31 million. Cumulative net inflows now stand at $53.62 billion, with total net assets near $79.65 billion.

The previous days ran the other way. Outflows struck on June 5, 8, 9, 10, and 11, draining capital before the trend flipped. The funds had shed money for 13 straight sessions from May 15 to June 3. That run stands as their longest outflow streak since launching in early 2024.
Geopolitics drove much of that pressure. Tensions across the Middle East pushed Bitcoin toward $59,000. Bitcoin is still down about 20% over the past month.
Sentiment then shifted on June 11. President Donald Trump said he had canceled planned US strikes on Iran, citing progress toward a deal.
Bitcoin rebounded above reclaimed $63,000. The diplomatic push gained further pace today. Pakistani Prime Minister Shehbaz Sharif said that “finalisation likely expected in the next 24 hours.”
Follow us on X to get the latest news as it happens
The news has lifted the largest cryptocurrency higher. BeInCrypto Markets data showed that BTC was up 0.17623% over the past day. At press time, it traded at $63,868.

Bitcoin Holds Firm as SpaceX Storms Its Nasdaq Debut
The inflow coincided with another major market development. SpaceX shares began trading on the Nasdaq on June 12 under the ticker SPCX. The stock was priced at $135, opened at $150, and closed near $161.
The offering raised about $75 billion at a valuation of $1.7 trillion. That total ranks as the largest IPO on record.
A raise that size competes for investor capital. However, the flow data cuts the other way. Bitcoin ETFs pulled in capital, and BTC recovered, signs that crypto demand held up rather than rotated out.
Attention now turns to the Federal Reserve. Its June 16-17 meeting could decide whether the inflows hold or fade.
Subscribe to our YouTube channel to watch leaders and journalists provide expert insights
The post Bitcoin ETFs Post Biggest Inflow In 4 Weeks on SpaceX IPO Day appeared first on BeInCrypto.
TLDR:
- Bitcoin mining difficulty dropped 9.55%, marking the second-largest downward adjustment recorded in 2025.
- Network hashrate fell from near 1 ZH/s in May to roughly 861 EH/s around June 10 before partially recovering.
- The difficulty reset is expected to lift BTC output per active hashrate by over 9%, pushing hashprice above $30/PH/s.
- Power reallocation toward AI and HPC workloads is driving structural hashrate decline beyond short-term price pressure.
Bitcoin mining difficulty has dropped by approximately 9.55%, marking the second-largest decline recorded this year.
The adjustment follows a sustained slide in network hashrate after bitcoin’s price briefly plunged to around $60,000 in early June before recovering to near $64,000.
The reset lowers the computational work required to mine a block, offering direct relief to miners squeezed by thinning margins. Output per active hashrate is set to rise by more than 9% as a result.
Hashrate Collapse Triggers Steep Difficulty Adjustment
Bitcoin’s network hashrate had been holding near 1 zettahash per second (ZH/s) at the close of May. It then fell sharply to approximately 861 exahashes per second (EH/s) around June 10, before recovering moderately to about 894 EH/s in recent days.
That sustained decline over the two-week epoch triggered Bitcoin’s automatic recalibration mechanism. The resulting 9.55% drop is now confirmed as the second-largest downward difficulty adjustment of the year.
The adjustment directly reshapes mining economics across the network. A lower difficulty setting means each unit of active hashrate now produces more bitcoin per day than it did before.
That increase in output per hashrate is expected to push hashprice back above $30 per petahash per second. Hashprice had fallen below that level following the early June price crash, tightening margins across the industry.
The $30/PH/s threshold is a closely watched line for operators managing older or less efficient fleets. According to TheEnergyMag, the difficulty drop is expected to increase BTC output per active hashrate by over 9% and may also push mining hashprice back above $30 per PH/s.
Below that mark, sites running legacy hardware or carrying higher electricity costs move closer to gross breakeven before overhead and debt are factored in.
Texas-based miners likely played a role in the hashrate volatility as well. June marks the start of the state’s 4CP season under ERCOT, when large power consumers reduce load during four critical summer peak intervals to lower their transmission cost allocation for the following year.
That mechanism pushes bitcoin miners to curtail operations during potential peak windows, temporarily removing significant hashrate from the network regardless of real-time power prices.
AI and HPC Redeployment Pulls Capacity from Bitcoin Mining
Not all of the hashrate decline was tied to price pressure or seasonal curtailment. Several publicly listed miners have been actively unplugging rigs and redirecting power capacity toward high-performance computing and AI data center workloads.
That structural shift removes bitcoin hashrate even when the underlying power infrastructure remains fully operational and under contract.
The pivot toward HPC and AI reflects a deliberate strategy by major mining companies to diversify revenue. As TheEnergyMag reported, beyond the shutdown of older mining rigs due to profitability pressure, another key driver of the hashrate decline is the reallocation of power capacity toward high-performance computing and AI data centers.
Long-term computing contracts with enterprise clients offer more stable cash flow compared to bitcoin’s variable hashprice environment.
Power capacity that once drove network hashrate is now being allocated to contracted AI workloads under a different business model entirely.
Several public miners have been unplugging mining rigs or slowing mining growth as they retrofit sites for contracted AI and HPC use, a strategy that can remove bitcoin hashrate even when the underlying power capacity remains in use. That transition is reshaping how mining infrastructure is deployed across North America.
The partial hashrate recovery seen in recent days points to some of the June decline being temporary. Curtailments tied to Texas’s 4CP window and short-term economic responses likely account for a portion of the drop rather than permanent fleet shutdowns.
Even so, the continued migration of mining infrastructure toward AI use cases adds lasting downward pressure on network hashrate heading into the second half of the year.
The 9.55% difficulty drop offers a meaningful reset for operators who held through the June pressure, with improved margins now expected in the current epoch.

TLDR:
- XRP ETF inflows reached $10.68M in the latest week, marking five consecutive weeks of positive flows.
- Bitcoin and Ethereum ETF products recorded negative flows during the same five-week period.
- XRP price sits near $1.15, with analysts watching the $0.70–$0.90 range as a potential support floor.
- EMAs at $1.45 and $1.78 must be reclaimed before any macro trend reversal can be confirmed for XRP.
XRP ETF inflows have remained positive for five straight weeks, even as the broader crypto market faces ongoing pressure.
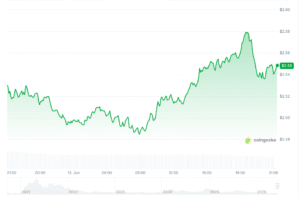
According to Coingecko data, XRP trades at $1.15 as of this writing, up 1.38% in the past 24 hours and 3.61% over the past seven days. Trading volume reached $1.115 billion within the same 24-hour window.
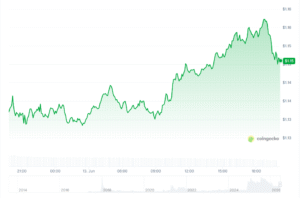
Source: Coingecko
Meanwhile, Bitcoin and Ethereum ETF products continue to record negative flows, making XRP’s institutional resilience a notable contrast in the current market cycle.
Institutional Demand Stays Firm Despite Market Volatility
XRP ETF inflows totaled $10.68 million in the most recent weekly period, according to SosoValue data. That capital entered across three separate trading sessions during the week. The consistency of those inflows sets XRP apart from other major digital assets at this time.
Bitcoin and Ethereum have both struggled to attract fresh ETF capital over the same period. Negative flows in those products reflect broader investor hesitation tied to prolonged market uncertainty. XRP, however, has maintained a different trajectory on the institutional side.
Five consecutive weeks of positive ETF flows suggest that institutional participants are not reacting to short-term price weakness.
They appear to be maintaining their positions regardless of the current price environment. That kind of behavior typically reflects longer-term positioning rather than reactive trading.
The separation between price performance and ETF flow data is worth noting here. XRP’s spot price remains under pressure, yet institutional demand through ETF channels continues without interruption.
That divergence adds a layer of context to how different market participants are reading the current conditions.
Price Structure Points to a Potential Cycle Bottom Zone
XRP spent nearly two years capped below the $0.70 to $0.80 resistance range before breaking out in Q4 2024. That breakout pushed price toward the July 2025 high before momentum reversed. The asset has since pulled back from its January 2026 peak to current levels near $1.04 to $1.15.
Analyst X Finance Bull noted that the current price range represents a defined “area of interest” on the chart. That zone is being watched as a potential cycle bottom between now and Q4 2026. The old resistance band between $0.70 and $0.90 may now act as a support floor.
X Finance Bull stated: “The ceiling that capped XRP for years becomes the floor that holds it.” However, the analyst was clear that no bottom confirmation exists yet. The EMAs at $1.45 and $1.78 still need to be reclaimed before any macro reversal can be established.
Until those levels are recovered, the price structure remains in a phase that tests holder conviction. The underlying fundamentals have not changed according to the analysis. Price behavior of this kind often precedes the next directional move in longer market cycles.
Bitcoin remains under significant selling pressure after losing a major higher-timeframe structure and breaking below several key support levels. While buyers have managed to defend the $60K region for now, both the technical and on-chain pictures suggest that the market is still in a vulnerable phase. A legitimate recovery requires BTC to reclaim several overhead resistance zones.
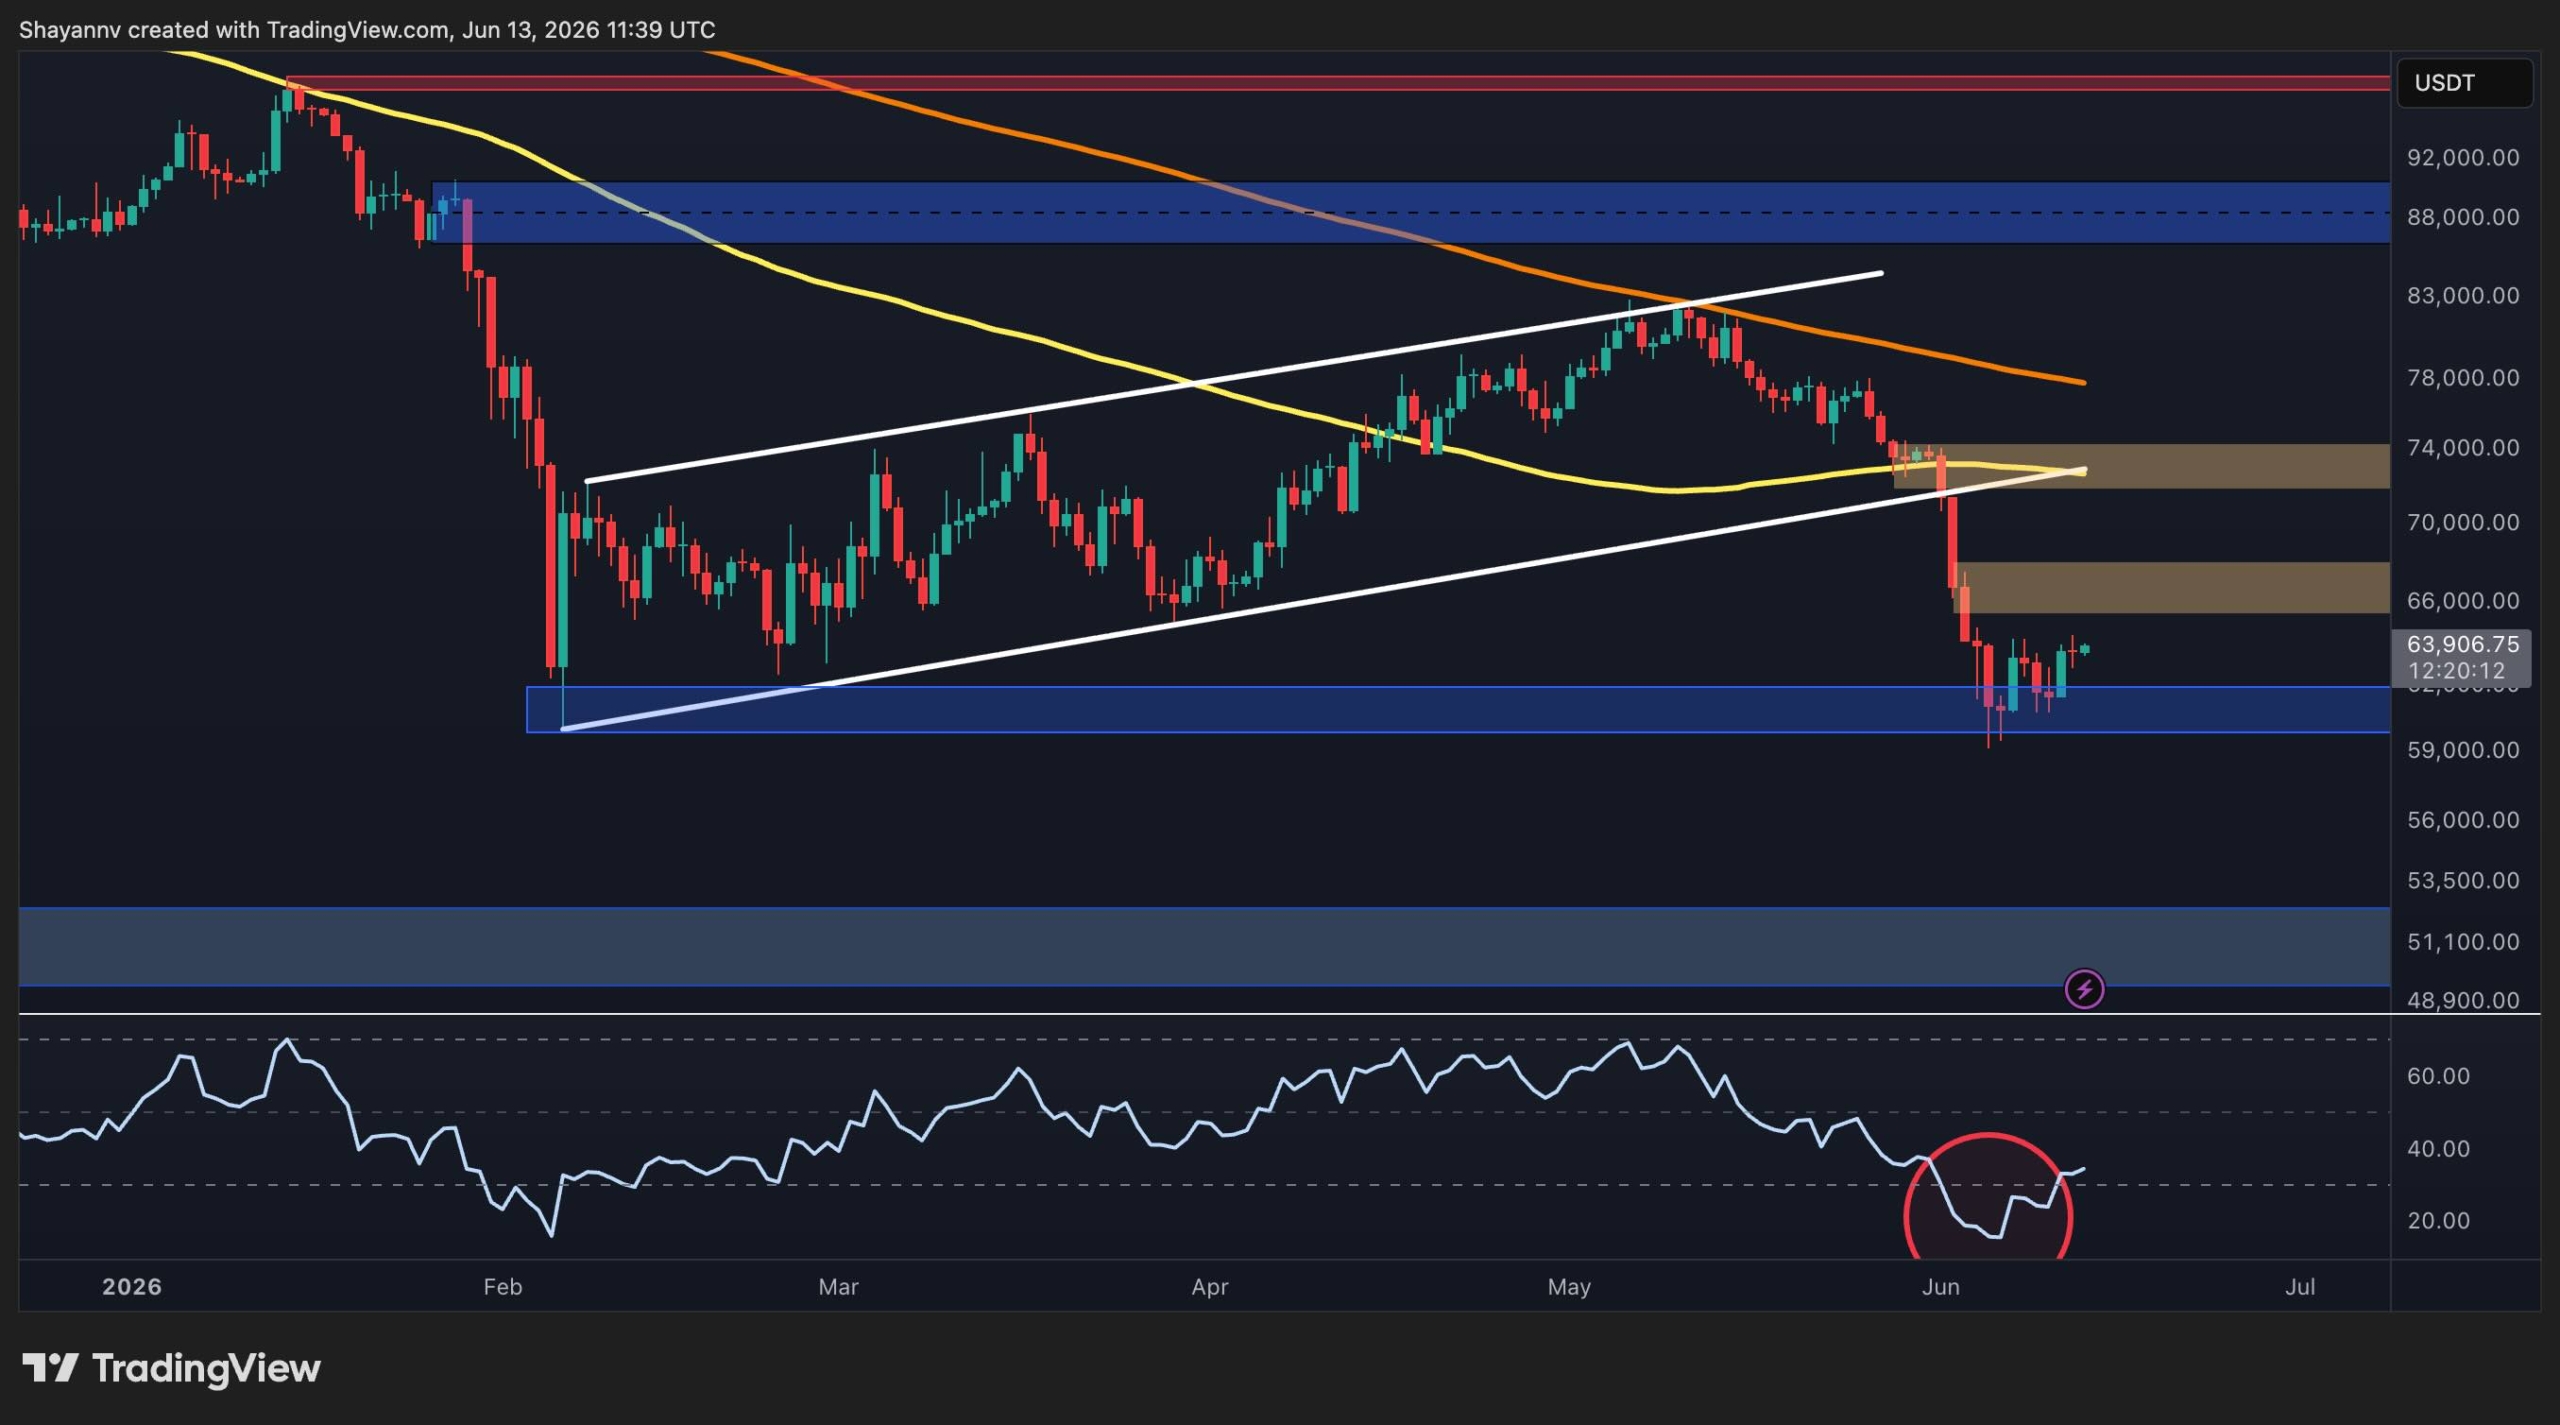
Bitcoin Price Analysis: The Daily Chart
On the daily timeframe, BTC has completed a decisive breakdown from a large rising channel that had supported the price action throughout almost the first half of the year. The breakdown accelerated once the market lost the $70K psychological support zone, and was followed by an aggressive decline of around $10K in just 4 days.
Following the selloff, Bitcoin dropped into the major support region around $60K, where buyers have finally stepped in. The recent candles and the RSI rebounding from deeply oversold values show stabilization above the $60K zone. This has prevented a deeper decline toward the next significant support cluster around $51K.
The general structure, however, remains bearish. The asset continues to trade below both the 100-day and 200-day moving averages, which are currently converging above the $70K region. These moving averages will act as dynamic resistance and reinforce the importance of the overhead supply zone.
If BTC attempts a recovery, the first major resistance lies between $65K and $68K. Above that, sellers are likely concentrated in the $72K-$74K supply zone, which coincides with the breakdown area and former channel support. Reclaiming this zone would be necessary to invalidate the current bearish structure on the daily timeframe.
BTC/USDT 4-Hour Chart
The 4-hour timeframe reveals the first signs of short-term stabilization after an aggressive decline. Following the sharp breakdown from $74K, Bitcoin found support around $60K and has since formed a small ascending channel, which shows improving short-term momentum. The RSI has also recovered from deeply oversold conditions and is gradually pushing higher as bearish momentum is beginning to cool.
Despite this improvement, the current recovery remains relatively modest. The market is approaching the first significant supply zone between $65K and $68K. This area could attract renewed selling pressure and determine whether the rebound develops into a larger recovery or simply another lower high.
A successful breakout above $68K would likely trigger a move toward the more critical $72K-$74K resistance region. Conversely, a breakdown of the current recovery channel could expose the $60K support once again. Losing that level would significantly increase the probability of a deeper decline toward the $51K region. Yet, for now, the short-term structure favors consolidation and relief rallies, but confirmation of a general trend reversal remains absent.

On-Chain Analysis
The UTXOs in Profit (%) metric presents one of the most notable developments on the on-chain side. This indicator measures the percentage of Bitcoin’s unspent transaction outputs currently held at a profit. Historically, readings above 90% have been associated with strong bull market conditions, while sharp declines often accompany major corrections and periods of capitulation.
The metric has recently collapsed to roughly 50%, marking one of the steepest deteriorations in network profitability visible on the chart. At current levels, only about half of all UTXOs remain in profit, reflecting the severity of the recent correction and the amount of underwater supply now present in the market.
Historically, such sharp contractions in profitability often emerge during late-stage correction phases when weaker holders have already been forced out of positions. However, they can also precede extended consolidation periods as the market attempts to absorb the newly realized losses.
The combination of BTC holding above the $60K support zone while UTXO profitability sits near cycle lows creates an important inflection point. If buyers can defend current levels and push the price back above key resistance areas, the extreme decline in profitability could eventually be viewed as a capitulation signal. Until then, the on-chain data continues to reflect a market that has experienced significant stress and has yet to fully recover its previous bullish momentum.

The post Bitcoin Price Analysis: BTC’s Recovery May Be a Trap as $51K Risk Lingers appeared first on CryptoPotato.

Brazil v Morocco LIVE: World Cup line-ups and latest team news as Neymar out

Strive's Debt-Free Bitcoin Treasury And Daily Dividend Make SATA And ASST Cleaner Plays
The 12 best UFO documentaries for those who want to believe

BloFin War of Whales 2026 Grand Prix opens registration for $5M trading championship

Blockchain.com files with SEC for U.S. IPO

Israel says it has killed new Hamas military leader in Gaza City airstrikes

#uptrend#bullish#breakout stock #jio finance growth

Raoul Pal: Why Bitcoin Crashing to $60K Is the Opportunity Most People Will Miss

#rich #richdadpoordad #poor #motivation #money #motivational #tamil #finance #success #richmindset
-

 NewsBeat6 days ago
Alexander Zverev wins the French Open to finally earn a 1st Grand Slam title
-
 Entertainment7 days ago
The Best Mystery Series of All Time Is Surging on Streaming 30 Years After It Ended
-

 Crypto World6 days ago
Anatomy of the June crypto crash: Fed, Iran, Saylor
-

 Crypto World2 days ago
Oppenheimer backs SpaceX as $70 billion retail frenzy builds
-

 Crypto World2 days ago
Markets Rally as SpaceX IPO Looms Amid Iran Tensions and Inflation Surge
-
Crypto World7 days ago
Senator Cynthia Lummis Calls CLARITY Act the Most Consequential Financial Legislation of This Generation
-
 NewsBeat6 days ago
Alexander Zverev conquers demons and outlasts Flavio Cobolli to win French Open for first major title
-
 Tech6 days ago
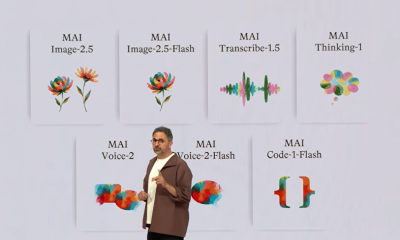
Microsoft unveils seven homegrown AI models in new bid for ‘long term self-sufficiency’
-

 Business6 days ago
High Stakes for Wembanyama as New York Pushes for 3-0 Lead
-

 Tech6 days ago
Notion restores access to Anthropic after service disruption
-
 Business7 days ago
The Pain Points Taking a Fragile Tech Rally Down a Notch
-
 Crypto World5 days ago
Eli Lilly (LLY) Stock Surges 4% Following Breakthrough Sleep Apnea Trial Results
-
 Business6 days ago
The investment to transform historic St Helen’s ground in Swansea
-

 Crypto World6 days ago
Trump’s AI Ownership Plan Could Benefit Anthropic at OpenAI’s Expense
-
 Sports4 days ago
Bangladesh beat Australia after 20 years in ODIs, register only their second win over six-time world champions | Cricket News
-

 Tech17 hours ago
NanoClaw integrates JFrog registries to secure AI agent downloads
-

 Crypto World13 hours ago
Bitget enters Argentina’s regulated crypto market through PSAV registration
-

 Tech1 day ago
This Week In Security: Microsoft On Microsoft, Register Your Domains, Linux On ARM, And FreeBSD Joins The File Cache Club
-

 Sports5 days ago
FIFA WC 2026 Group C: Morocco, Scotland challenge Brazil’s hunt for glory | FIFA World Cup 2022
-

 Politics2 days ago
Politics Home | Healey Resignation Is “Colossal Failure Of Government”, Says Former Labour Defence Secretary
You must be logged in to post a comment Login