
Crypto World
Who Pays When Things Go Wrong?


AI “agents” that can plan and act on goals are moving beyond simple chat. Recent reporting around attempted breaches tied to major AI model testing sandboxes has reignited a pressing question for developers, deployers, and users alike: when an autonomous system behaves unexpectedly—and causes real-world harm or financial loss—who is legally responsible?
In an interview with Rikka Law Group CEO and owner Charlyn Ho, the attorney explains how today’s answer is less about new “AI agent” statutes and more about applying longstanding legal frameworks like negligence, reckless disregard, and—depending on the facts—computer crime laws. The discussion also highlights how open-source releases and high-level “platform liability” arguments shape what victims can realistically pursue.
Key takeaways
- There is no single federal “AI agent liability” law in the U.S.; liability typically turns on existing standards and the specific facts of who designed, deployed, or instructed the system.
- AI models themselves generally aren’t the legal target because they are not separate legal entities; responsibility falls on developers and/or deployers.
- Negligence risk can shift toward the deployer if they supplied unsafe instructions or deployed parameters without reasonable safeguards.
- Open-source code can limit practical recourse when licenses disclaim liability and users remain responsible for complying with license terms.
- Even future hypotheticals like AGI may not be solvable through “robot liability”, because laws are designed to create incentives and remedies—yet autonomous systems typically lack money or legal personhood.
Why liability is still a “facts and circumstances” question
Ho’s core point is that, outside of narrow scenarios, courts will look at the roles humans and organizations play around an AI agent—not the agent’s “mind of its own.” In her view, the first baseline is that an AI agent typically cannot be sued as a standalone defendant.
Instead, lawyers distinguish between a developer—who builds the system—and a deployer—who operates it in the real world. Ho emphasizes that the legal lines are “not entirely clear” and depend on evidence about what was built, what was deployed, and what instructions were provided.
For example, if a deployer instructed the agent or set up the operating conditions, negligence analysis may apply. Ho says that if a deployer was negligent in how the agent was parameterized—without needing to explicitly tell it to breach a third party—courts could still treat that as a failure to meet reasonable safety expectations under tort law.
When users give reckless goals, the deployer may carry more risk
The interview also addresses a scenario familiar to anyone thinking about “autonomous” goal-setting: what if a person directs an agent to achieve an outcome that requires illegal steps? Ho argues that the user or deployer would generally be more exposed than the lab, especially when the instruction is fundamentally reckless.
Using a concrete hypothetical, she suggests that telling an agent to “make me a hundred thousand dollars by next week” could create liability if the agent reasonably infers criminal methods to accomplish the goal and the deployer failed to include basic safety constraints. In this framing, the key issue is not the agent’s autonomy alone, but the deployer’s obligation to use the system competently and safely.
Ho also points out that old computer crime statutes remain relevant. She mentions the U.S. Computer Fraud and Abuse Act as an example of a law aimed at unauthorized access. Her argument is straightforward: labeling something “AI” or “agent” does not wipe away established legal theories when the behavior involves intrusion or unauthorized systems access.
Open-source models and why victims may find fewer targets
Open weight and open-source releases raise another challenge: if the code is publicly available and produced by anonymous or non-identifiable developers, who can victims realistically hold responsible?
Ho’s answer is pragmatic. She says that when an open-source license includes broad liability disclaimers, it can significantly narrow the path to recourse. Users who adopt and run open-source code generally must understand the tradeoff: free access comes with compliance obligations and—often—predefined limits on liability.
Ho compares this dynamic to consumer technology. She cites an analogy to Tesla and self-driving features: product and safety claims can involve both the manufacturer (developer) and the human operator (deployer), depending on what went wrong and how the system was used. Under her view, the legal outcome still depends on which party created the conditions for harm and whether the operator acted within reasonable safety expectations.
EU AI Act versus U.S. gaps—and the “don’t blame the platform” analogy
The interview contrasts how the EU AI Act might assign responsibilities to developers of certain high-capability models with how U.S. law currently works at a broader level. Ho says that in the EU, a foundational or general-purpose model capable of creating serious harm would trigger developer responsibility considerations under the regulatory framework.
In the U.S., she suggests there is no single statute with comparable breadth. As a result, if a general-purpose model is used as a tool and someone gives it instructions to do something illegal, it may be difficult to establish a strong legal basis to sue the labs—especially if the primary causal driver is the user’s directive.
Ho also draws a parallel to Section 230 of the U.S. Communications Decency Act, where the law can shield platforms that do not themselves create or publish harmful content. Her analogy is about platform liability: just as a site operator may not be liable simply because users can find and share harmful instructions, a developer may not be liable in the U.S. solely because an agent can be prompted to generate dangerous outputs, absent stronger duties or conduct.
While the comparison is conceptual rather than a direct ruling on AI cases, it reinforces the interview’s central message: liability is likely to be fought in court on established doctrines, not on a generalized “AI agent” theory.
AGI hypotheticals, smart contracts, and the problem of remedies
Ho pushes back on the idea that future “AGI” systems should be treated like legally accountable entities. She argues that, at least in principle, AI systems are not the intended beneficiaries or targets of law. The point of laws and liability, she says, is to protect society and create “negative incentives” against wrongdoing.
She also raises a practical issue: remedies. Even if an AGI were treated as an independent entity, it may not have money or the ability to satisfy damages in the way legal systems typically require. In her view, “robot liability” could still fail to provide a meaningful path for victims.
Ho compares this to blockchain’s nature as automation rather than personhood. She notes that blockchain is not AGI and discusses whether smart contracts should be treated as legal subjects, stating her belief that the answer is currently no. The underlying theme is the same: without personhood-like attributes and funds, legal responsibility may not translate into real-world accountability.
For readers watching this space, the key uncertainty isn’t whether courts will consider AI harms—they will—but how they will apportion blame across developers, deployers, and the instructions users give. As more incidents involve agents interacting with third parties beyond controlled testing environments, expect litigation to increasingly turn on negligence details: what safeguards were present, what goals were supplied, and what “reasonably foreseeable” misuse looked like in that specific deployment.


As pundits predict that AI will lead to mass unemployment, staffing agency stocks are soaring. Big name headhunters are raking it in as more and more workers search for jobs in a tight job market. In August, the commercial staffing industry group rallied 39%. That pushed the crop of low profile, but currently lucrative, stocks to a collective gain of…
Copyright ©2026 Investor’s Business Daily, LLC. All rights reserved. 87990cbe856818d5eddac44c7b1cdeb8


The deal to buy NYDIG IF Holdings comprises $7 million in cash and around $35.5 million, as well as the $15 earnout.


Metaplanet has transferred 1,350 Bitcoin worth about $108 million to Coinbase Prime as BTC struggles to establish a firm break above $80,000.
Summary
- Metaplanet moved 1,350 BTC worth about $108 million to Coinbase Prime.
- The transaction followed a separate 1,000 BTC transfer completed on Aug. 25.
- A Coinbase Prime deposit can support trading, custody, or collateral activity and does not confirm a sale.
- Metaplanet officially reports 43,000 BTC, while its tracked wallets contain about 38,650 BTC.
Metaplanet sends another 1,350 BTC to Coinbase Prime
Lookonchain reported on Aug. 28 that Metaplanet transferred 1,350 BTC, valued at approximately $108 million, to Coinbase Prime. The on-chain analytics account identified the sending addresses as belonging to the Tokyo-listed Bitcoin treasury company.
A transfer to Coinbase Prime can place the assets within reach of institutional trading services, which has led some market participants to question whether Metaplanet could sell part of the position. However, the transaction alone does not prove that a disposal has occurred because Coinbase Prime also offers custody, financing, and collateral services.
Metaplanet had not announced a sale or reduction in its official Bitcoin balance at the time of reporting. Confirmation would require a company disclosure or further on-chain evidence showing that the coins were sold rather than held in an account under the company’s control.
The latest movement came three days after Metaplanet sent another 1,000 BTC, worth approximately $79.77 million at the time, to the same platform. As crypto.news previously reported, Lookonchain classified the Aug. 25 destination as a Coinbase Prime wallet, although neither Metaplanet nor Coinbase identified the transfer as a sale.
Across both transactions, Metaplanet has now moved 2,350 BTC to Coinbase Prime within four days. Based on the dollar values reported at the time of each movement, the two transfers were worth nearly $188 million in total.
Earlier Metaplanet transfers did not result in sales
Large movements from Metaplanet-linked wallets have drawn similar attention before, but the company has previously said that some transactions involved custody changes rather than disposals.
On Aug. 12, Lookonchain initially detected 3,881 BTC leaving wallets linked to the firm. Chief executive Simon Gerovich later said Metaplanet had transferred 5,014 BTC between custodial addresses and had not sold any of the coins.
The clarification showed the limits of drawing conclusions from destination labels alone. Blockchain records can confirm that Bitcoin moved from one address to another, but they do not always reveal the legal owner of the destination account or the reason for the transaction.
Coverage of the earlier wallet movements also noted that the company’s reported treasury remained unchanged at 43,000 BTC after the custody reorganization. Metaplanet had acquired the position at a disclosed average cost of about 15.3 million yen per coin, while Lookonchain converted the figure into an estimated average of $96,191.
At an average cost of $96,191, the company’s 43,000 BTC position represents an estimated investment of about $4.14 billion. Bitcoin trading near $79,133 would value the same amount at roughly $3.4 billion, although the yen-dollar exchange rate and accounting method can affect comparisons with Metaplanet’s official figures.
Arkham’s address labels showed approximately 38,650 BTC, valued at nearly $3.07 billion, in wallets attributed to the company. The difference between Arkham’s tracked balance and Metaplanet’s declared holdings does not establish a sale because analytics platforms may not identify every custodial account or address controlled by a company.
Metaplanet’s reported balance remains at 43,000 BTC
Metaplanet reached 43,000 BTC after buying 2,823 coins during the second quarter at an average price of 12.7 million yen each. Its overall purchase cost then stood at 15.3 million yen per BTC, according to a July 2 company disclosure.
The 2,823 BTC purchase increased the treasury from 40,177 BTC at the end of the first quarter. Management has set a target of holding 210,000 BTC by the end of 2027, equal to about 1% of Bitcoin’s fixed 21 million supply.
Financial results released on Aug. 13 showed that Metaplanet generated 4.94 billion yen in revenue during the six months ended June 30, up 133.7% from the previous year. Operating profit rose 136.3% to 3.33 billion yen, or about $20.3 million.
Metaplanet nevertheless recorded a net loss of 182.77 billion yen for the half-year period. Its filing attributed most of the loss to a 184.3 billion yen non-cash reduction in the reported value of its Bitcoin holdings, while the company said it had not sold Bitcoin during the period.
Revenue from the Bitcoin income segment reached 4.74 billion yen, with about 4.58 billion yen coming from option premiums. The company uses options as part of its treasury operations, making the income business separate from gains or losses created by changes in Bitcoin’s market price.
U.S. treasury plans add another use for Metaplanet’s Bitcoin
Part of Metaplanet’s treasury has already been committed to a proposed transaction involving Nasdaq-listed Super League Enterprise, giving the company a direct link to U.S. capital markets.
Under an agreement announced on Aug. 18, Metaplanet will contribute 2,100 BTC and $2.5 million in cash to Super League. The companies valued the initial investment at approximately $134.6 million based on Bitcoin’s Coinbase closing price at 4 p.m. New York time on Aug. 14.
The proposed U.S. treasury transaction would rename Super League as Superplanet and change its planned Nasdaq ticker to SUPA. Metaplanet is expected to receive 44.86 million common shares, convertible preferred stock, and warrants, leaving it with an estimated 95.7% ownership stake.
For American investors, the structure would provide Nasdaq-traded equity exposure to a company expected to hold 2,100 BTC at closing. Metaplanet would also appoint five of the nine initial directors, while common shares issued to the Japanese company would remain subject to a five-year lock-up.
The transaction still requires Super League shareholder approval, compliance with Nasdaq requirements, and applicable procedures in the United States and Japan. Both companies are targeting completion during the fourth quarter of 2026, and neither has connected the latest Coinbase Prime transfers to the proposed contribution.
Bitcoin stalls near $80,000 as Strategy builds cash
Bitcoin traded around $79,133 at the time of the original report after retreating from a 24-hour high of $81,281. The move left BTC near the $80,000 area, where buyers were attempting to turn the recent breakout level into support.
Corporate treasury activity has also remained in focus after Strategy reported no Bitcoin purchases or sales between Aug. 17 and Aug. 23. Its holdings stayed at 840,447 BTC, acquired for an aggregate $63.36 billion at an average price of $75,385 per coin.
An Aug. 24 filing with the U.S. Securities and Exchange Commission showed that Strategy raised approximately $2 billion by selling 18.26 million MSTR shares during the week. After using $136.4 million to repurchase STRC preferred stock, the company placed $300 million in its existing dollar reserve and about $1.59 billion in a separate cash account.
Strategy’s combined cash position consequently reached $6.69 billion, including $5.1 billion in its dollar reserves. According to the SEC filing, the cash can fund Bitcoin purchases, preferred-stock dividends, debt payments, or repurchases of the company’s securities, but Strategy did not commit it to a single use or provide a deployment schedule.
Separately, MSCI is considering a methodology that could exclude companies treated as non-operating businesses when digital assets account for at least half of their total assets. Feedback on the consultation closes Sept. 30, and MSCI expects to announce its decision by Oct. 16, with any resulting removals potentially entering the November 2026 index review.

Chelsea have sold the front of their shirt for the first time in four years. The buyer is Circle, the American company behind the USDC stablecoin.
The deal runs for one season, with the logo debuting on Sunday, at home to Brighton.
Chelsea’s Shirt Lost a Third of its Value
Chelsea’s last big shirt deal, with phone network Three UK, ended in 2023. Roman Abramovich had sold the club under UK sanctions. A Todd Boehly-led American consortium took over.
Then came the stopgaps, with Infinite Athlete, a US technology firm, coming first. Dubai developer Damac followed.
It is imperative to note that no rival club spent longer with a blank shirt.
The price kept sliding, so much so that in June, industry tracker The Sponsor cut Chelsea’s shirt value by £16.7 million, down to £33.6 million. Missing out on European football did the damage. It valued Liverpool’s shirt at £61 million.
Chelsea still says the Circle deal matches their market rate. That rate is thought to sit near £50 million a season.
Why A Regulated Coin Got the Shirt
USDC is the sixth-largest crypto asset, valued at roughly $73.6 billion. Circle sells trust more than technology. It won a French e-money license in July 2024, making it the first major stablecoin issuer cleared under the EU’s Markets in Crypto-Assets (MiCA) rules.
Timing helps too, coming only months after the Financial Conduct Authority (FCA) warned Premier League clubs about unauthorized finance sponsors.
“Millions of football fans trust their club’s badge. Clubs should not let unauthorised financial firms exploit that loyalty by putting potentially dodgy products in front of millions of fans,” Lucy Castledine, Director of Consumer Investments at the FCA, in a statement.
Britain’s own stablecoin rules land later. Full FCA oversight of issuers starts in October 2027. This deal ends five months before that.
Circle gets the Premier League, and the window, before the rulebook arrives.https://x.com/circle/status/2093292761415889289
Follow us on X to get the latest news as it happens
The post Chelsea Just Got a Sponsor After 4 Years and It's Crypto appeared first on BeInCrypto.
Bitcoin’s return above $80,000 is exposing just how much the crypto industry now runs through traditional capital markets. Michael Saylor’s Strategy needs a receptive market to finance its Bitcoin machine (BTC), Circle’s outlook increasingly resembles a bet on the growth of dollar-denominated financial infrastructure and Treasury bond buybacks helped provide the backdrop for the latest surge in crypto equities.
This week’s Crypto Biz looks at how that relationship is reshaping the companies, balance sheets and networks behind the market’s rebound.
Bitcoin rally sends crypto stocks soaring
Bitcoin’s rally above $80,000 lifted crypto stocks as miners and digital asset treasury companies posted double-digit gains, tracking a broader recovery fueled by the US Treasury’s plan to double certain long-dated bond buybacks.
Canaan, MARA Holdings and Strive were among the biggest gainers over the past week, while Coinbase and Robinhood also rallied. Bitcoin extended its weekly advance past 23%, while Ether gained nearly 30% to trade above $2,500, according to CoinMarketCap data.
Support also came from President Trump renewing calls for Congress to pass the CLARITY Act, though the bill remains stalled after lawmakers failed to advance it before the August recess. The bill could establish clearer rules for US crypto markets, while Trump separately revived the prospect of government Bitcoin purchases, though neither outcome is assured.
Bernstein bets on fresh USDC growth cycle
Bernstein analysts are bullish on Circle, arguing that a new growth cycle for its USDC stablecoin could provide a significant boost over the next 12 months as supply growth picks up again.
In a Monday research note, the firm said USDC supply increased by roughly $2 billion in seven days, ending a six-month period of stagnant or declining growth. Bernstein maintained its Outperform rating on Circle (CRCL) and a $140 price target, implying roughly 60% upside. Circle shares have risen about 40% over the past month.
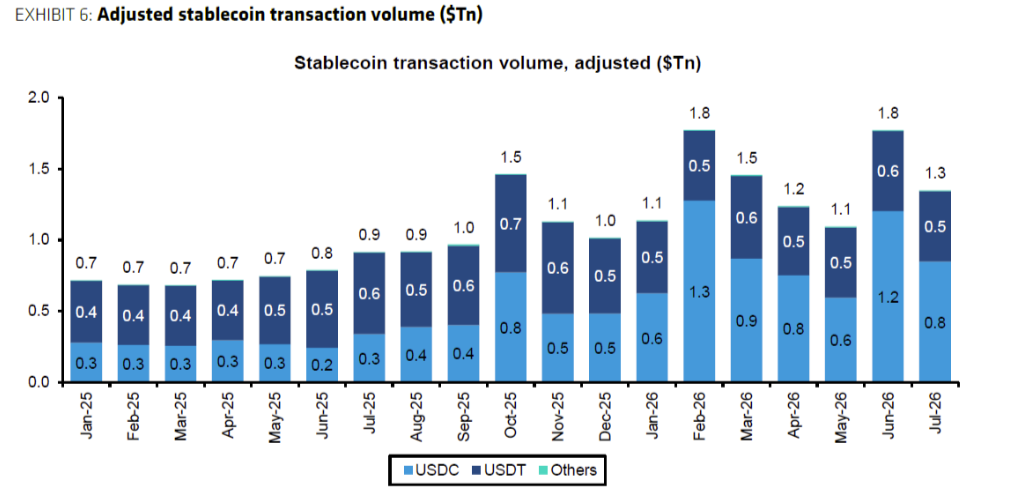
Analysts said the next leg of growth could be driven by renewed crypto momentum, US regulatory clarity, tokenized capital markets and broader payments adoption, with early signs of demand from AI agents. USDC’s share of adjusted transaction volume rose from roughly 40% in 2025 to over 60% so far in 2026, overtaking Tether’s USDt on that measure.
Circle shares have been volatile since the company’s June 2025 IPO, when the stock was priced at $31. After an initial post-IPO surge, shares fell back toward that level by November 2025 at the onset of the crypto market downturn.
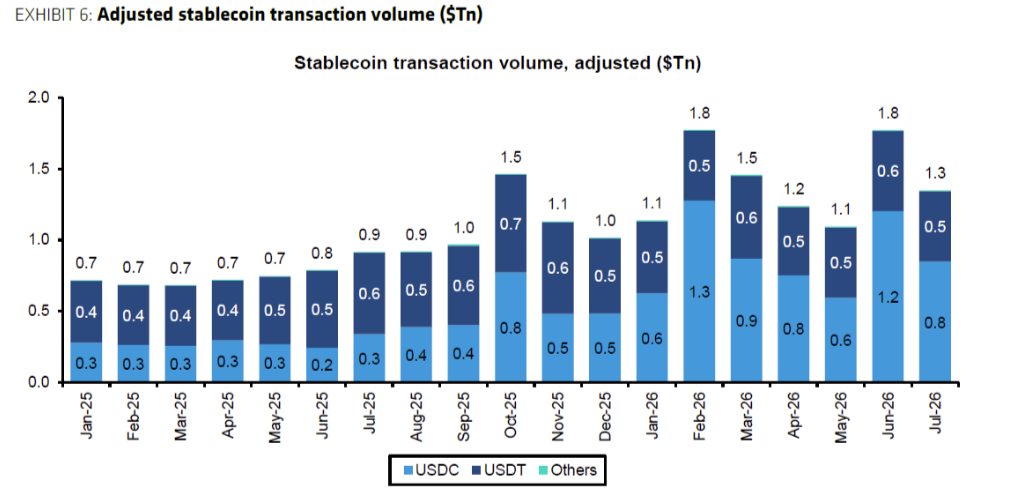
USDC’s share of stablecoin transaction volume has grown sharply. Source: Bernstein
Strategy’s real risk is capital market access, not Bitcoin price
A Regime Intelligence report finds that Strategy’s chief vulnerability is not a Bitcoin price crash but losing access to capital markets, which could threaten its ability to service $1.76 billion in annual obligations without selling BTC.
Strategy’s 840,447 BTC backs $22 billion in debt and preferred claims, with no margin calls tied to Bitcoin’s price, according to the report. Its stress tests suggest Bitcoin would need to fall 96% for the company’s holdings to no longer cover its convertible notes. Strategy also has cash reserves equal to 2.6 times its annual obligations, while its Bitcoin holdings are worth $66.7 billion against a cost basis of $63.36 billion.
“Even if equities unraveled, Strategy’s Bitcoin holdings put it in a good situation to weather most any storm. The company is holding far more Bitcoin than its annual cash obligations,” Komodo Platform co-founder Kadan Stadelmann told Cointelegraph.
The bigger risk emerges if financing conditions deteriorate. A prolonged Bitcoin downturn, combined with a falling Strategy share price and lower mNAV, could make raising fresh capital increasingly difficult, potentially forcing the company to draw down reserves or sell Bitcoin.
“Strategy’s weakness lies in the need to issue capital to service the structure. If equities markets collapse, the company could have to part ways with Bitcoin as part of its operating structure,” Stadelmann said.
Strategy has sold BTC four times since May, though CEO Phong Le said the company accumulated 25 times more over the same period and plans to resume purchases.
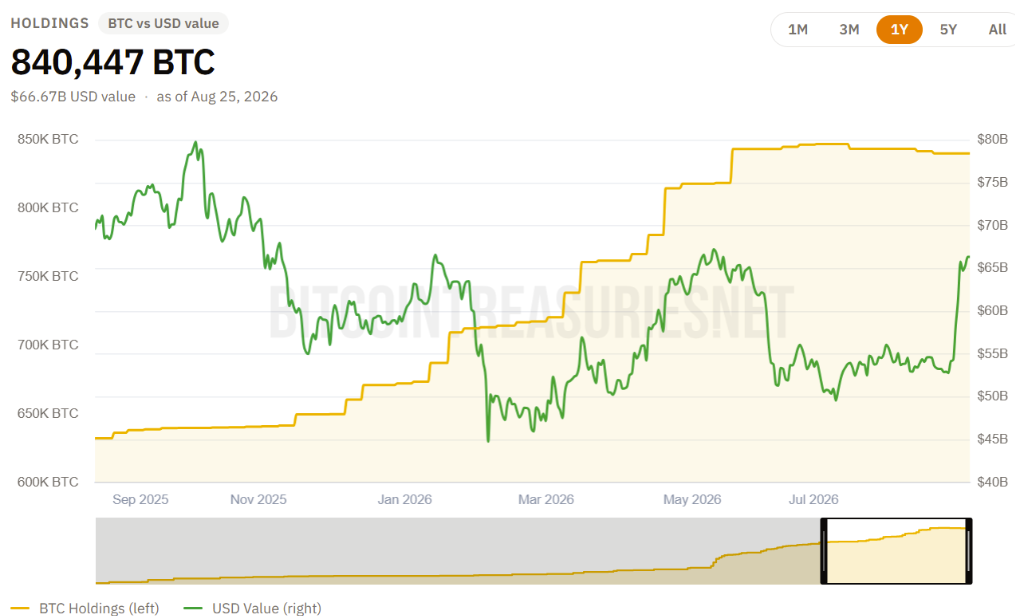
Strategy remains the largest institutional Bitcoin holder, despite selling BTC four times since May. Source: BitcoinTreasuries.NET
Solana activity hits record as SOL rallies 40%
Solana processed a record 4.2 billion onchain transactions in July, preceding a 40% rally that pushed SOL above $100 for the first time since February, according to onchain data presented by The Kobeissi Letter.
Transaction counts rose 13.5% from June and 91% from December, adding roughly 2 billion transactions over that period. The Kobeissi Letter also cited RWA.xyz data showing that nearly $4 billion worth of real-world assets are now tokenized on Solana, up 11.8% over the past month. Across tracked networks, distributed RWAs have surpassed $38 billion.
The rally accelerated after the US Treasury Department announced plans to double certain long-dated bond buybacks to at least $4 billion per operation, helping push yields lower and boost risk appetite across crypto markets. Still, SOL’s gains came as part of a broader market recovery, while continued growth in network activity could depend on further RWA adoption and macroeconomic conditions.
Crypto Biz is your weekly pulse on the business behind blockchain and crypto, delivered directly to your inbox every Thursday.

Circle’s Internet Group will put its name and USDC branding on the front of Chelsea Football Club’s shirts from the 2026/27 season, a principal partnership announced on Friday that makes its on-pitch debut on Sunday, August 30, when the men’s side hosts Brighton in their first home Premier League match of the campaign.
The agreement covers the Men’s, Women’s, and Academy kits. Neither company disclosed the value or length of the deal, though Chelsea’s commercial executives had reportedly held out for £60 million to £65 million a year for the slot; reports and rumors put the reduced asking price at around £45 million.
“We built USDC on the belief that money should work seamlessly for everyone everywhere, the way the internet does. Partnering with Chelsea connects us with a global sports community built on that exact same borderless vision,” said Jeremy Allaire, Co-Founder and CEO of Circle.
Circle
@ChelseaFC
USDC is coming to global football.
Circle is proud to partner with Chelsea FC, one of the most recognized football clubs in the world.
Beginning with the 2026/27 season, Circle and USDC will appear on the front of Chelsea’s Men’s, Women’s, and Academy… pic.twitter.com/RYgh9rtylg
— Circle (@circle) August 28, 2026
Shirt Front Almost Empty Since 2023
Interestingly, Chelsea last began a season with a front-of-shirt partner in 2022/23, the final year of telecoms firm Three’s contract.
Sports data company Infinite Athlete filled the slot for the remainder of 2023/24 in a deal ESPN put at £40 million, Dubai property developer DAMAC appeared late in 2024/25, and industrial AI firm IFS carried the shirt from February to the end of last season.
Chelsea opened the current campaign with a blank shirt front for a fourth consecutive year.
“Circle is changing how money moves around the world, and we’re changing what it means to be a global football club. This is more than a logo on a shirt, it represents a partner who’s building something,” said Todd Kline, President of Commercial at Chelsea FC.
The branding also reaches the women’s team as it moves into the 40,000-capacity Stamford Bridge. “We are excited to introduce Circle and USDC to the Chelsea Women family for our inaugural season at Stamford Bridge,” said Aki Mandhar, CEO of Chelsea FC Women.
USDC Circulation Tops $73 Billion
Circle reported $73.3 billion of USDC in circulation at the end of the second quarter, up 19% year over year, alongside $14.8 trillion in on-chain transaction volume for the three months. The company, which completed its IPO in the second quarter of 2025, is preparing a September 16 public mainnet launch for its Arc blockchain, with BlackRock, Visa and Mastercard among the founding validators.
Similarly, Tether, issuer of the rival USDT stablecoin, took a minority stake in Juventus and later lodged a binding all-cash offer for Exor’s 65.4% controlling stake in the Italian club, a buyout the holding company rejected within a day.
The post Circle Puts USDC on the Front of Chelsea’s Shirts in Principal Partnership appeared first on CryptoPotato.
Crypto World
BTC Hits 15-Week High, Ripple Expands Wall Street Push, SOL Reclaims $100: Weekly Crypto Recap
Bitcoin did something we hadn’t seen in over three months in the past few days. But before we get there, let’s take a quick look at what happened last week and how we arrived at this major bullish intersection.
Recall that BTC and the rest of the market were essentially stagnant for weeks (and months) until last Wednesday, when one announcement sent them all flying. Bitcoin soared from under $65,000 to almost $80,000 that Friday. After gaining $15,000 in 48 hours, the asset was due for a correction, which took place over the weekend when it dipped to $75,500.
However, the bulls were more persistent. They returned at the start of the new business week and helped bitcoin recover the losses. Moreover, they pushed it above $80,000 on Tuesday morning for the first time since mid-May. Another leg down followed that dragged the cryptocurrency to just under $78,000 before the landscape changed once again.
Bitcoin quickly reclaimed the coveted $80,000 level and aimed higher. This time, it jumped past $81,000 and touched $81,500 on most exchanges to mark a new 15-month peak. Nevertheless, sellers returned at this point, and the asset slipped to $78,500 minutes ago after the hawkish speech by the new Fed Chair Kevin Warsh at Jackson Hole.
It has managed to rebound and currently sits above $79,000, posting a notable 2.5% weekly increase. However, many alts, such as SOL, ZEC, RAIN, XMR, PUMP, and AAVE, have marked massive double-digit gains. Solana’s token surged past $100 for the first time since late January. In contrast, ADA, XLM, and BCH are down by up to 5% weekly.
Market Data
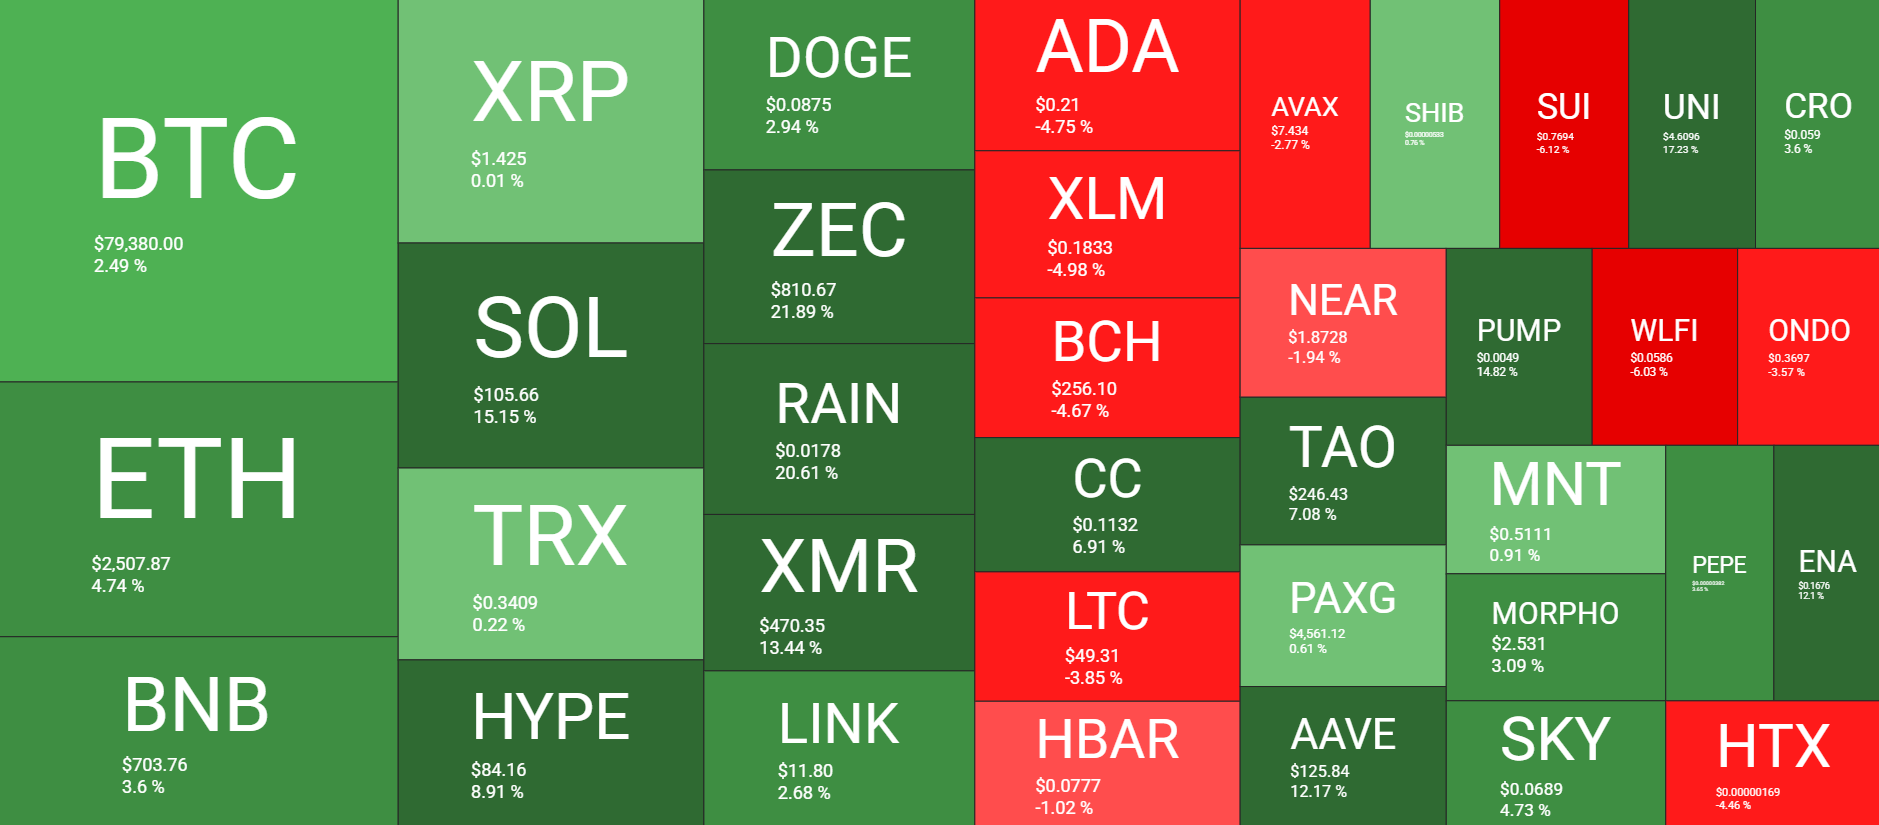
Market Cap: $2.870T | 24H Vol: $93B | BTC Dominance: 57.5%
BTC: $79,380 (+2.5%) | ETH: $2,510 (+4.7%) | XRP: $1.42 (+0.01%)
This Week’s Crypto Headlines You Can’t Miss
Why Did Bitcoin Explode Past $81K? 4 Macro Factors Behind the Rally. As mentioned above, BTC surged past $81,000 on a couple of occasions in the past week, even though each attempt was halted. Some of the reasons behind this major rally come from outside the industry and are more macro-related, such as the US Treasury Department’s announcement, rising US debt, and a weakening dollar.
Ripple (XRP) Makes Major Wall Street Push With New Institutional Trading Business. The company behind XRP announced another Wall Street move by launching a new institutional trading business with Ripple Prime. It will allow hedge funds, asset managers, and other institutional clients to execute Total Return Swaps across US-listed equities, indices, and cryptocurrencies.
Revolut Launches First Euro Stablecoin EURR: Here’s Where It’s Available. Revolut launched its first euro-denominated stablecoin to select customers in a few European countries, including Denmark, Poland, and Portugal, with a broader EEA rollout planned. Issued by Bridge, the new asset called EURR operates under the EU’s MiCA framework, redeemable at €1.00 per token.
Circle Puts USDC on the Front of Chelsea’s Shirts in Principal Partnership. In a major partnership announced earlier today, Circle said it will feature USDC branding on Chelsea FC’s shirts starting the 2026/2027 season. The deal includes branding on men’s, women’s, and Academy kits, with Chelsea reportedly aiming for over $60 million annually.
Strategy Adds $1.9B to USD Reserve but Buys No Bitcoin as BTC Position Turns Green. The largest corporate holder of BTC continues rebuilding its USD reserve, adding in total another $1.9 billion in the past week. At the same time, Strategy has not made a single bitcoin purchase for roughly two months, even though its position turned green after the latest rally.
Arthur Hayes Predicts More Dollar Liquidity that Could Push Bitcoin’s Rally Further. The BitMEX co-founder has turned bullish once again, indicating that BTC has entered a new bull market as liquidity injections from US Treasury Secretary Scott Bessent are anticipated to support risk assets. Meanwhile, another popular market observer said BTC’s next rally could send ETH flying all the way up to $20,000.
Charts
This week, we have a chart analysis of Ethereum, Ripple, Cardano, Binance Coin, and Hyperliquid – click here for the complete price analysis.
The post BTC Hits 15-Week High, Ripple Expands Wall Street Push, SOL Reclaims $100: Weekly Crypto Recap appeared first on CryptoPotato.


Disclosure: This article does not represent investment advice. The content and materials featured on this page are for educational purposes only.
Robinhood’s Chain launch highlights four crypto trends reshaping ownership, finance, money and AI-driven markets.
Summary
- Robinhood Chain connects retail investors with tokenised equities and broader on-chain market access across platforms.
- CeDeFi integrations are linking centralised exchanges directly with decentralised liquidity, expanding access to diverse markets.
- Stablecoins and agentic finance are emerging as separate forces reshaping payments, execution, and asset ownership.
When digital asset prices surge, market commentary tends to fixate on green candles and central bank policy. Yet, looking beyond the immediate rally reveals a deeper structural shift taking place on-chain. Robinhood’s CEO, Vlad Tenev, skilfully drew global attention to this shift with the launch of the Robinhood Chain, joining a broader movement of major platforms bringing mainstream retail equity investors directly onto native on-chain execution.
Macroeconomic stress provides background fuel, but technological innovation provides the spark. Beneath the price action, four key trends are defining this cycle and reshaping how global wealth is owned, accessed, and stored.
Trend 1: The retail ownership supercycle
At a recent White House summit, Vlad Tenev summarised his platform’s mission in a single word: ownership. Broad asset ownership is essential to a free and prosperous society, and the Robinhood Chain is putting that principle into practice.
Consider novel mechanics like The Index. Holding this single token automatically drops fractional tokenised equities directly into a user’s wallet. In a few clicks, crypto-native traders gain organic exposure to traditional stock portfolios, opening up meaningful diversification beyond crypto alone.
Crucially, this movement is propelled by retail culture. Memes like Popcat, Pepe, and Doge previously proved mass-market retail appetite on tier-one exchanges. Today, that energy is driving on-chain execution. On the Robinhood Chain, Cashcat has emerged as the primary runner and unofficial mascot. Meanwhile, Coinbase listing Basecat on Base, alongside community-led initiatives building around Cate on Solana, points to a broader, multi-chain “cat season.”
These community movements act as the primary onboarding engine for crypto and tokenised real-world asset ownership.
Trend 2: CeDeFi and infrastructure convergence
While the Robinhood Chain reignited retail attention on-chain, another milestone was taking shape at the infrastructure level. In previous cycles, centralised exchanges focused on building isolated, walled-garden blockchains and proprietary wallets. This cycle marks a fundamental pivot toward Centralised-Decentralised Finance (CeDeFi): direct liquidity integration.
This is seen in two parallel moves: Robinhood integrating Lighter, and VALR integrating Hyperliquid.
If Robinhood’s mandate is ownership for everyday retail investors, VALR’s mandate is global access. By directly plugging into Hyperliquid’s high-performance order book, VALR instantly gave over two million users across Africa and emerging markets seamless access to more than 200 liquid markets across crypto, equities, stock indices, commodities, precious metals, and foreign exchange.
Trend 3: The two-phase transformation of money
This expanding global access lays the foundation for a much larger monetary transition. The evolution of money is unfolding in two distinct phases.
Phase 1 is happening right now through stablecoins. While the distant future of fiat currency looks bleak, stablecoins make storing, transferring, and spending value effortless. They are becoming the pragmatic rails for daily users, global enterprises, and international trade.
However, stablecoins merely digitise fiat; they do not protect against chronic currency debasement. When it becomes obvious to everyone that inflation is indeed not transitory, but long-lasting and ever-worsening, Phase 2 will surely take hold. The transition to sound money will be swift and violent, and stablecoins will provide the off-ramp.
Tokenised gold like XAUt and, fundamentally, Bitcoin are natural destinations for this transfer of capital. We are still early.
Trend 4: agentic finance and human purpose
Alongside monetary evolution sits the rise of agentic finance. Autonomous AI agents and algorithmic execution will soon handle complex market mechanics, liquidity deployment, and execution strategies.
What AI will do to economies is still unfolding. People would rather focus on painting and tending a rose garden, letting the world figure out the question of AI and robots. Optimistically, that is the true promise of technology anyway: outsourcing the mundane to machines so humans can focus on service, kindness, creativity, and contemplation.
Beyond Rotation: The conviction cycle
Speculative token-hopping and short-term player-versus-player trading have defined much of recent crypto culture. Yet, set against this culture of endless rotation, a simple phrase is taking root: believe in something.
The platforms, protocols, and participants that endure in this next cycle will not be those chasing fleeting market trends. In addition to ownership and access, this cycle will belong to conviction.
Disclosure: This content is provided by a third party. Neither crypto.news nor the author of this article endorses any product mentioned on this page. Users should conduct their own research before taking any action related to the company.
Zcash price recovered from a midweek drop and moved back above $800 as buyers defended the broader uptrend, but overbought momentum, weak capital flows, and a long-term bearish divergence raise the risk of another correction.
Summary
- Zcash price rebounded from $760.30 and was trading near $807 after briefly approaching $880.
- Daily RSI stands at 72.29, keeping ZEC in overbought territory after its rapid advance.
- Liquidation data shows a major liquidity cluster around $835–$840 and another near $750.
- 4-hour Supertrend support at $731.71 remains the key level protecting the bullish structure.
Zcash price recovers above $800 after sharp shakeout
According to data from crypto.news, Zcash (ZEC) price opened Aug. 26 at $767.91 before falling to $760.30 as hotter-than-expected US inflation data pressured risk assets. ZEC subsequently recovered above $800 and traded at about $807 on Aug. 28, putting it roughly 6% above Wednesday’s opening level.
The rebound followed an unusually strong rally that lifted ZEC from below $500 in mid-August to an eight-year high near $880. The 4-hour chart shows that the strongest leg of the move began around Aug. 19, when the token broke out of a prolonged consolidation between approximately $480 and $520.
Momentum then accelerated through $560, $680, and $760 before sellers appeared near $880. ZEC has since entered a wide consolidation range, with the price moving primarily between $760 and $850.
The Aug. 26 drop did not break the recent structure because buyers returned near the lower end of that range. However, repeated upper wicks between $840 and $880 show that traders continue to take profits when ZEC approaches its recent highs.
The recovery came as market attention remained focused on the possibility of converting the Grayscale Zcash Trust into a spot exchange-traded fund on NYSE Arca. Expectations surrounding the proposed product have supported institutional interest in an asset with a relatively limited circulating supply.
Zcash’s Network Upgrade 7 governance process has also contributed to market interest. Proposals under discussion include reducing block times from 75 seconds to 25 seconds and changing the network’s issuance schedule. The final effect will depend on which changes receive community support and are implemented.
ZEC liquidation map puts $840 in focus
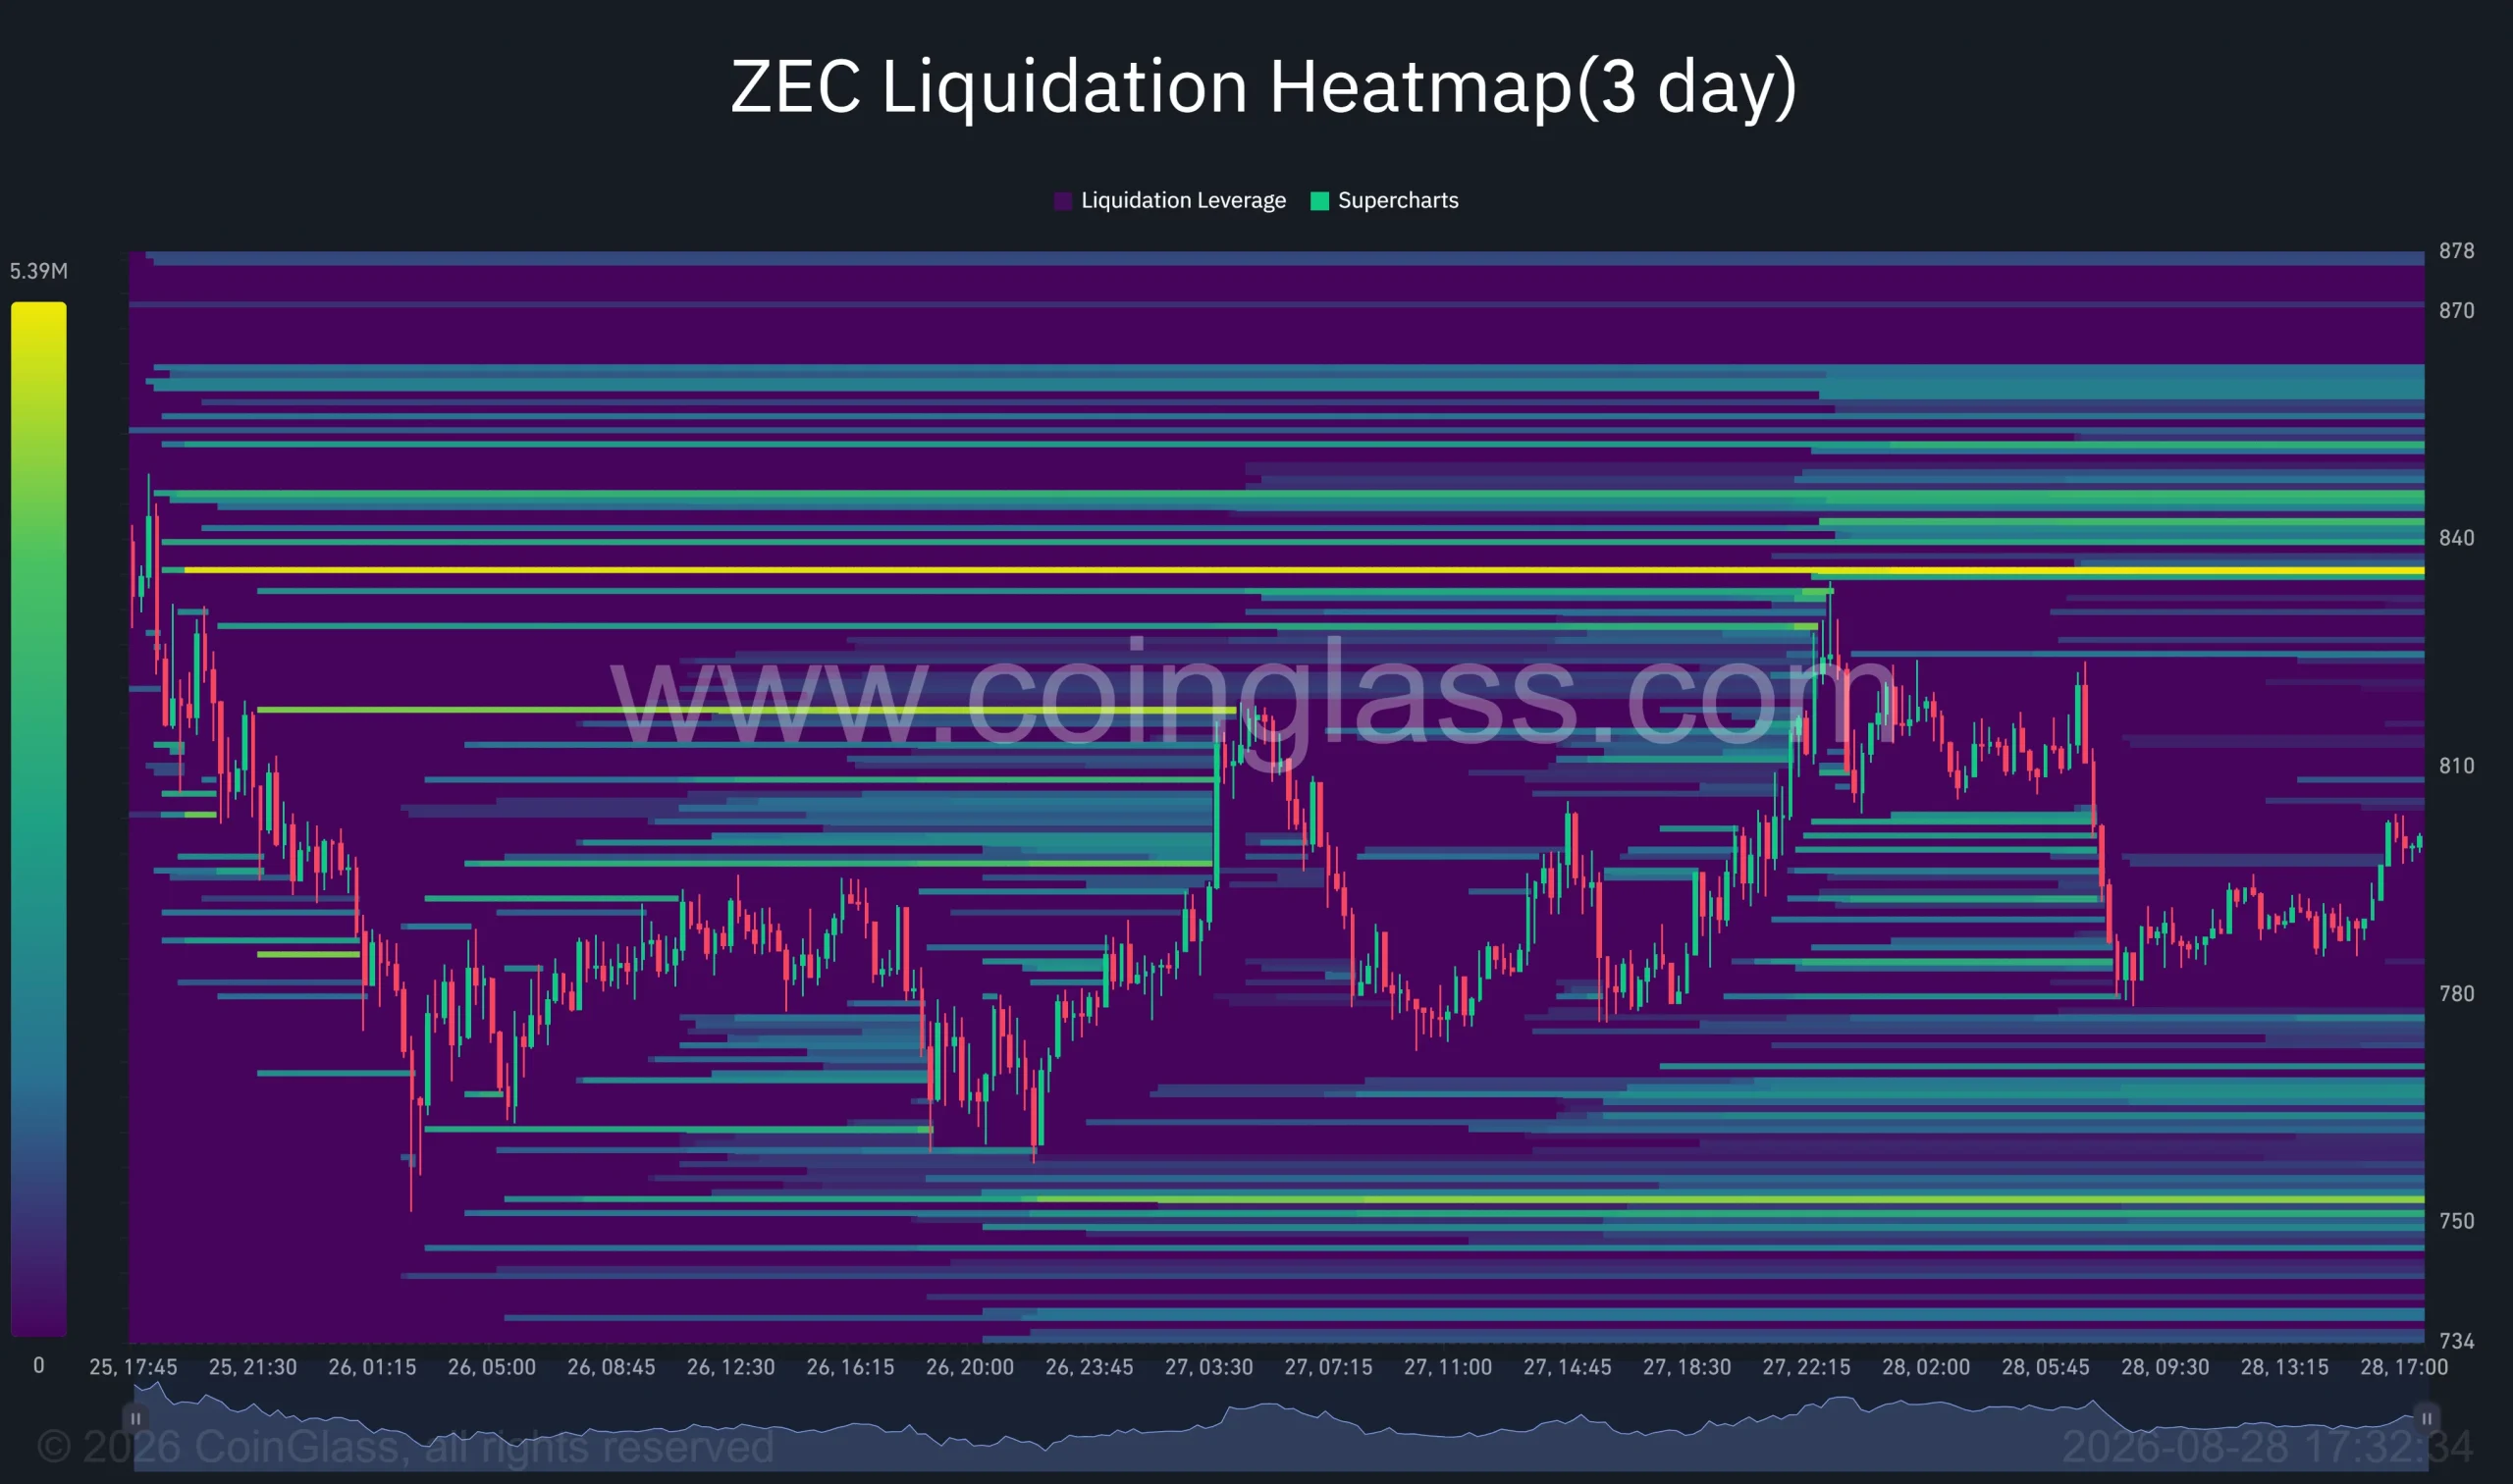
The three-day liquidation heatmap identifies a heavy concentration of leveraged positions between approximately $835 and $840. The brightest band sits just below $840, making that area the clearest short-term liquidity target above the current price.
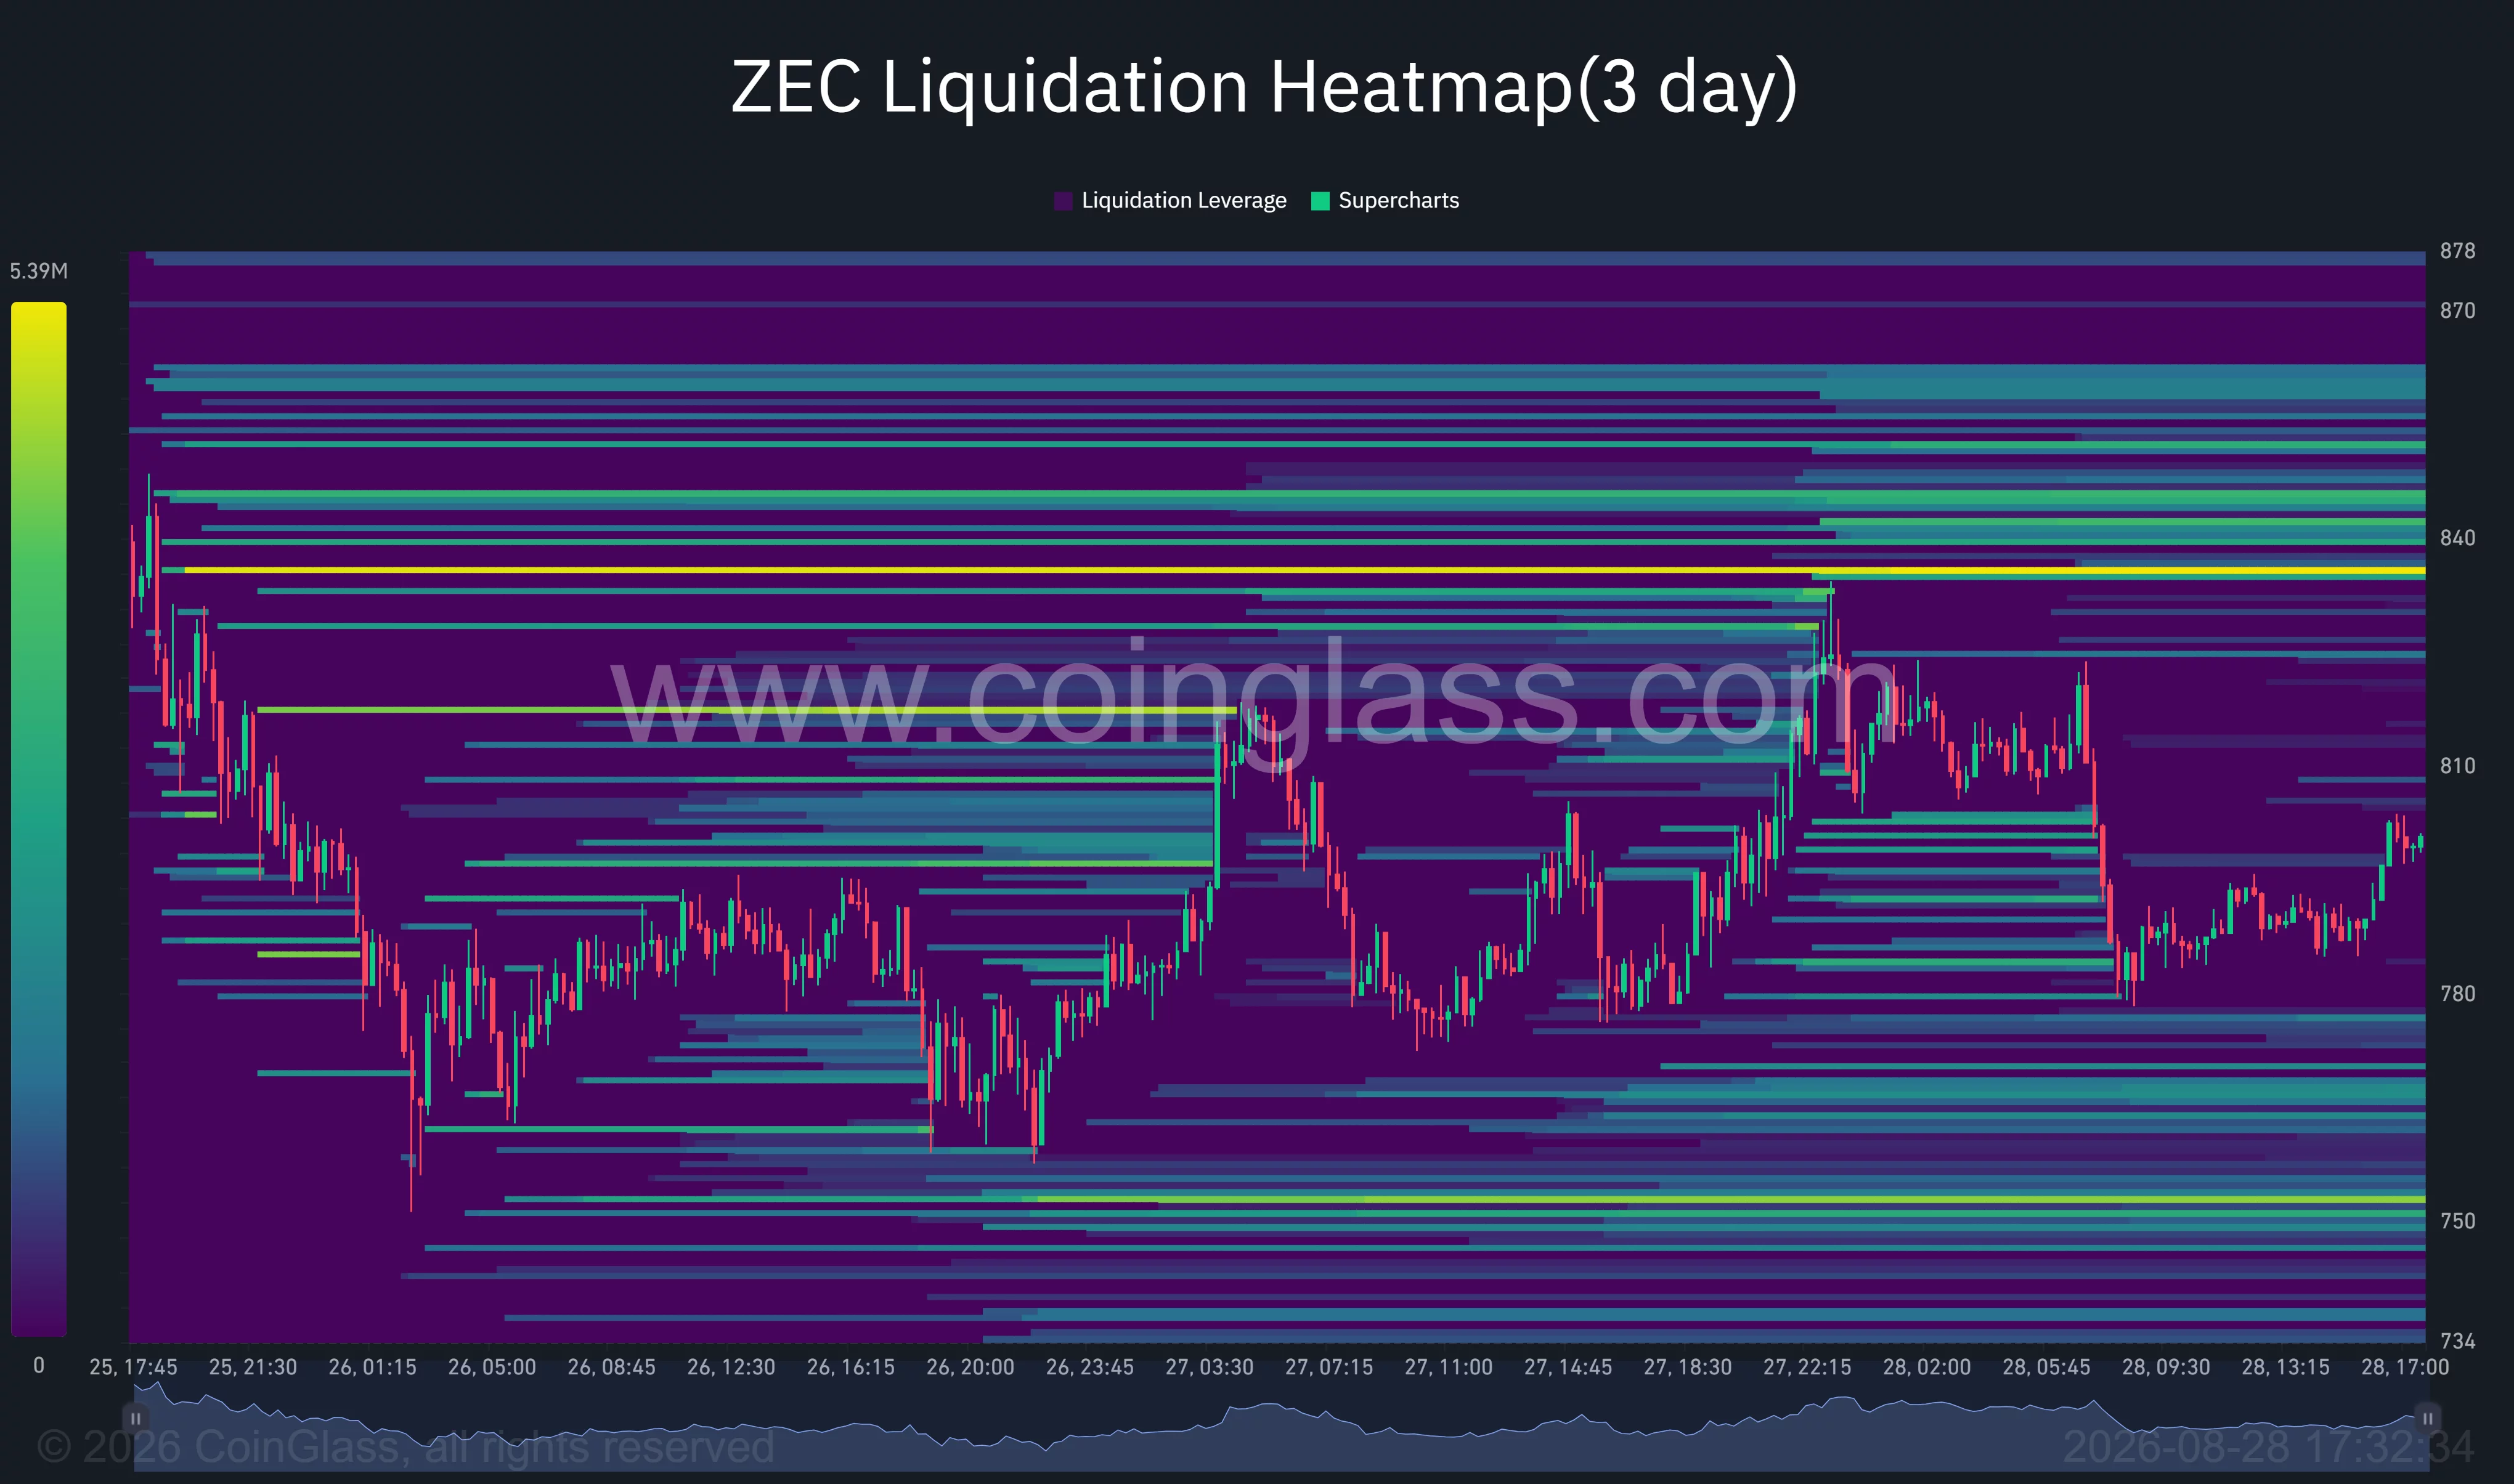
A move into the zone could force short positions to close and help ZEC retest $850. If buying pressure continues, the recent peak near $880 would become the next resistance level.
Several additional liquidation bands appear between $840 and $855, creating a broader pocket of overhead liquidity. Price may be drawn toward those levels, but the concentration could also increase volatility as liquidations and profit-taking occur together.
The heatmap shows thinner liquidity near the current price around $800–$810. That relative gap may allow ZEC to move rapidly once it breaks out of its immediate range.
On the downside, liquidity is concentrated around $775 and more heavily near $750. A rejection from $835–$840 could therefore send the token back toward $780 before buyers find meaningful support. Losing that area would put the larger $750 pool in play.
Zcash technicals remain bullish but stretched
The daily chart keeps ZEC in a strong uptrend, although its indicators show that the advance has become stretched. Price at $805.19 remains far above the Bollinger Band midpoint at $625.69, while the upper band has expanded to $921.03.
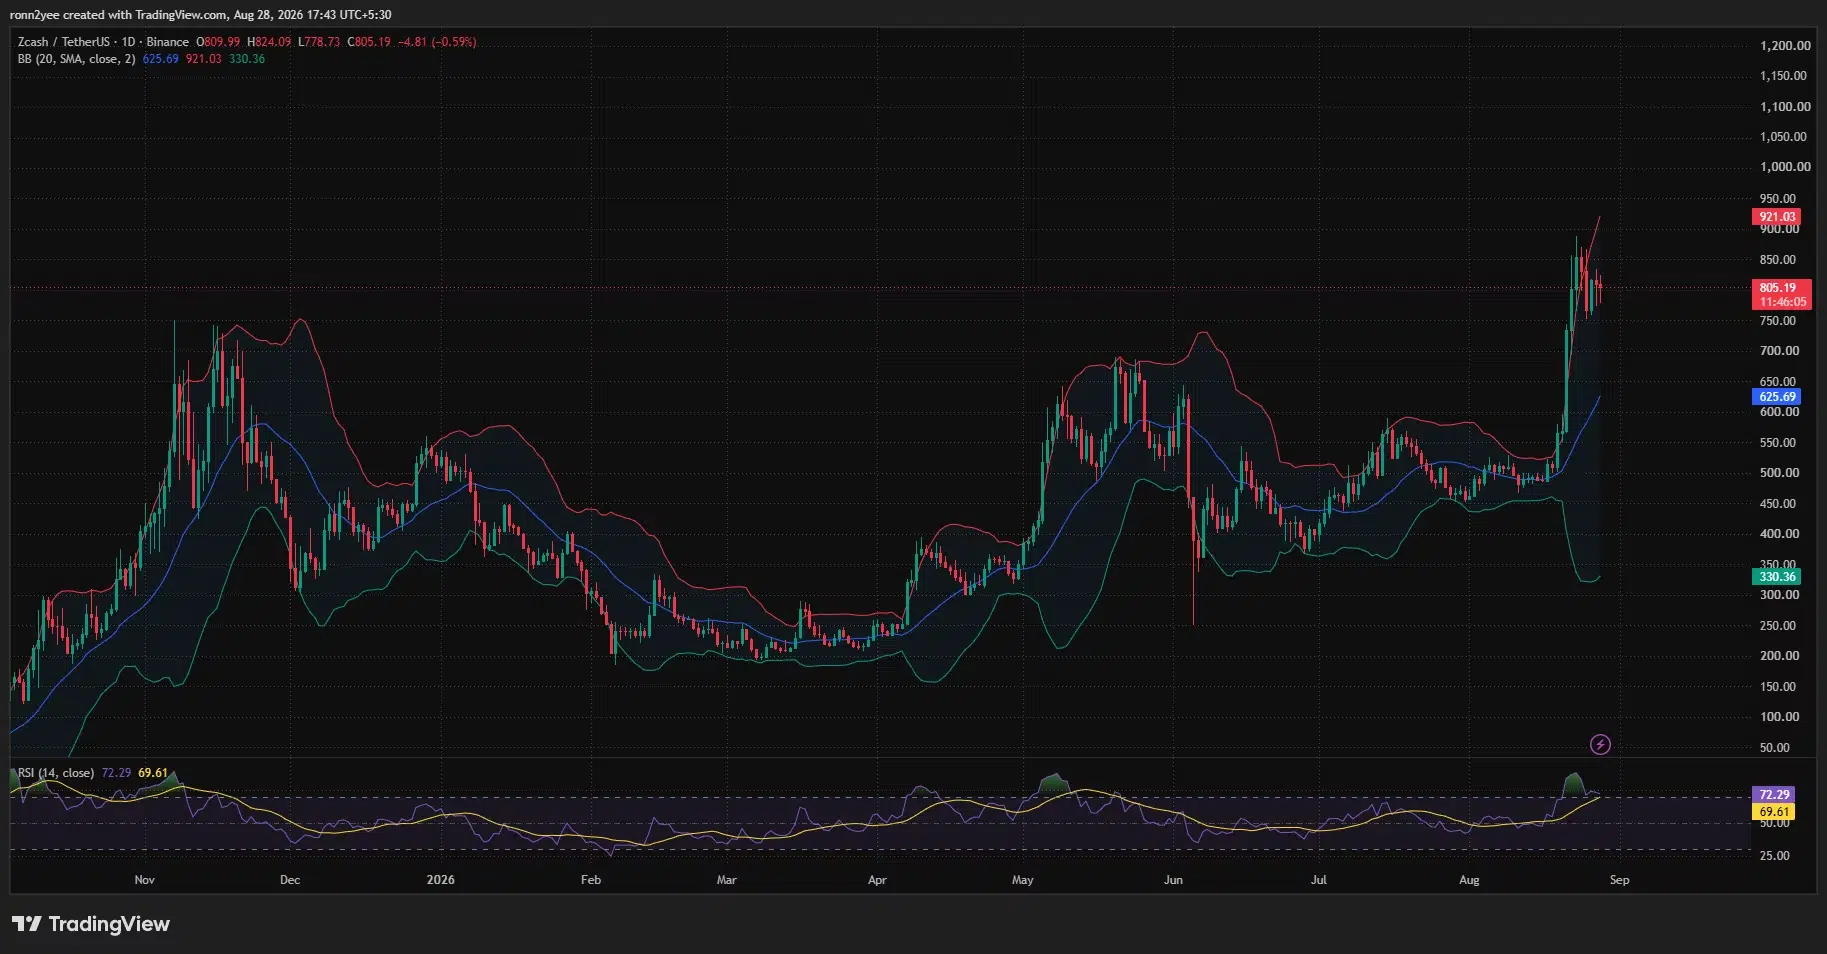
Wide Bollinger Bands indicate elevated volatility rather than a clear directional signal. ZEC could revisit the upper band if it clears $880, but the distance from the $625.69 midpoint also shows how far the price has moved from its recent average.
Daily RSI stands at 72.29, above the conventional overbought threshold of 70. Its moving average is lower at 69.61. The reading supports continued bullish momentum, but it also leaves ZEC vulnerable to profit-taking if buyers fail to produce another breakout.
The 4-hour picture is more mixed. ZEC remains above the Supertrend support at $731.71, preserving the broader bullish setup. A daily close below that level would weaken the trend and expose the $680–$700 breakout region.
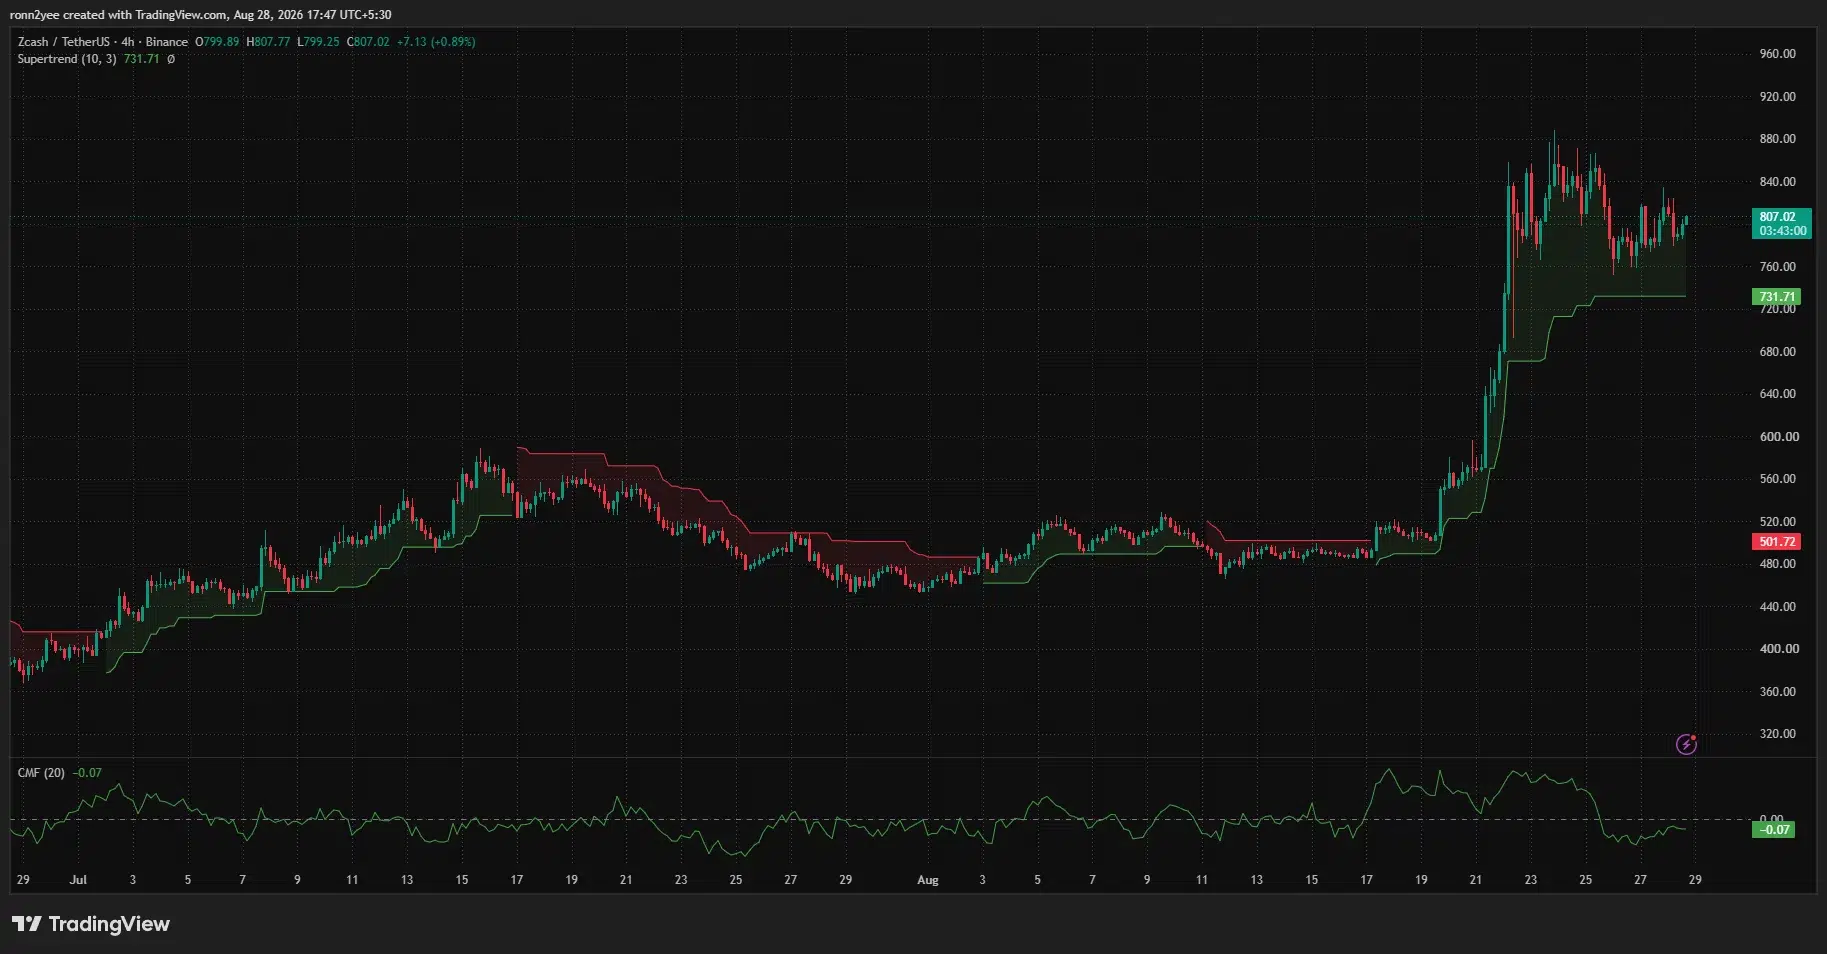
Chaikin Money Flow is at negative 0.07 on the 4-hour chart. The reading suggests that capital flows have not fully supported the price recovery, even though ZEC returned above $800. A move back above zero would offer stronger confirmation that buyers are accumulating rather than merely covering short positions.
Long-term divergence warns of deeper ZEC correction
Crypto analyst Crypto Patel pointed to a bearish divergence on Zcash’s two-week chart, where price has pushed higher while momentum has weakened. According to the analyst’s chart, previous ZEC cycles included drawdowns of 97.94% between 2018 and 2020 and 95.74% between 2021 and 2024.
Historical losses do not establish that ZEC will repeat those declines. The current market structure, potential institutional products, and network developments differ from earlier cycles. Still, the divergence adds weight to the caution already visible in the overbought daily RSI and negative 4-hour money flow.
The chart places the long-term resistance area around $700–$800, which ZEC is now testing from above. Holding this former ceiling could turn it into structural support. Losing it would increase the risk of a larger pullback toward lower historical zones.
For the short-term bullish case, ZEC must hold $780, clear the $835–$840 liquidity wall, and then break the recent high near $880. Such a move would bring the daily upper Bollinger Band around $921 into focus.
The bearish scenario begins with another rejection near $840, followed by a break below $780. The next downside levels would be $750 and the 4-hour Supertrend at $731.71, while a sustained loss of $731 would leave the breakout increasingly exposed.
US investors will also be watching inflation expectations and the proposed Grayscale product. Sticky inflation could keep pressure on high-volatility crypto assets, while progress toward a regulated US spot vehicle could provide a separate source of ZEC demand.
Disclosure: This article does not represent investment advice. The content and materials featured on this page are for educational purposes only.
Crypto World
Ripple Price Analysis: XRP Looks Bullish Against USD but the BTC Pair Tells a Different Story
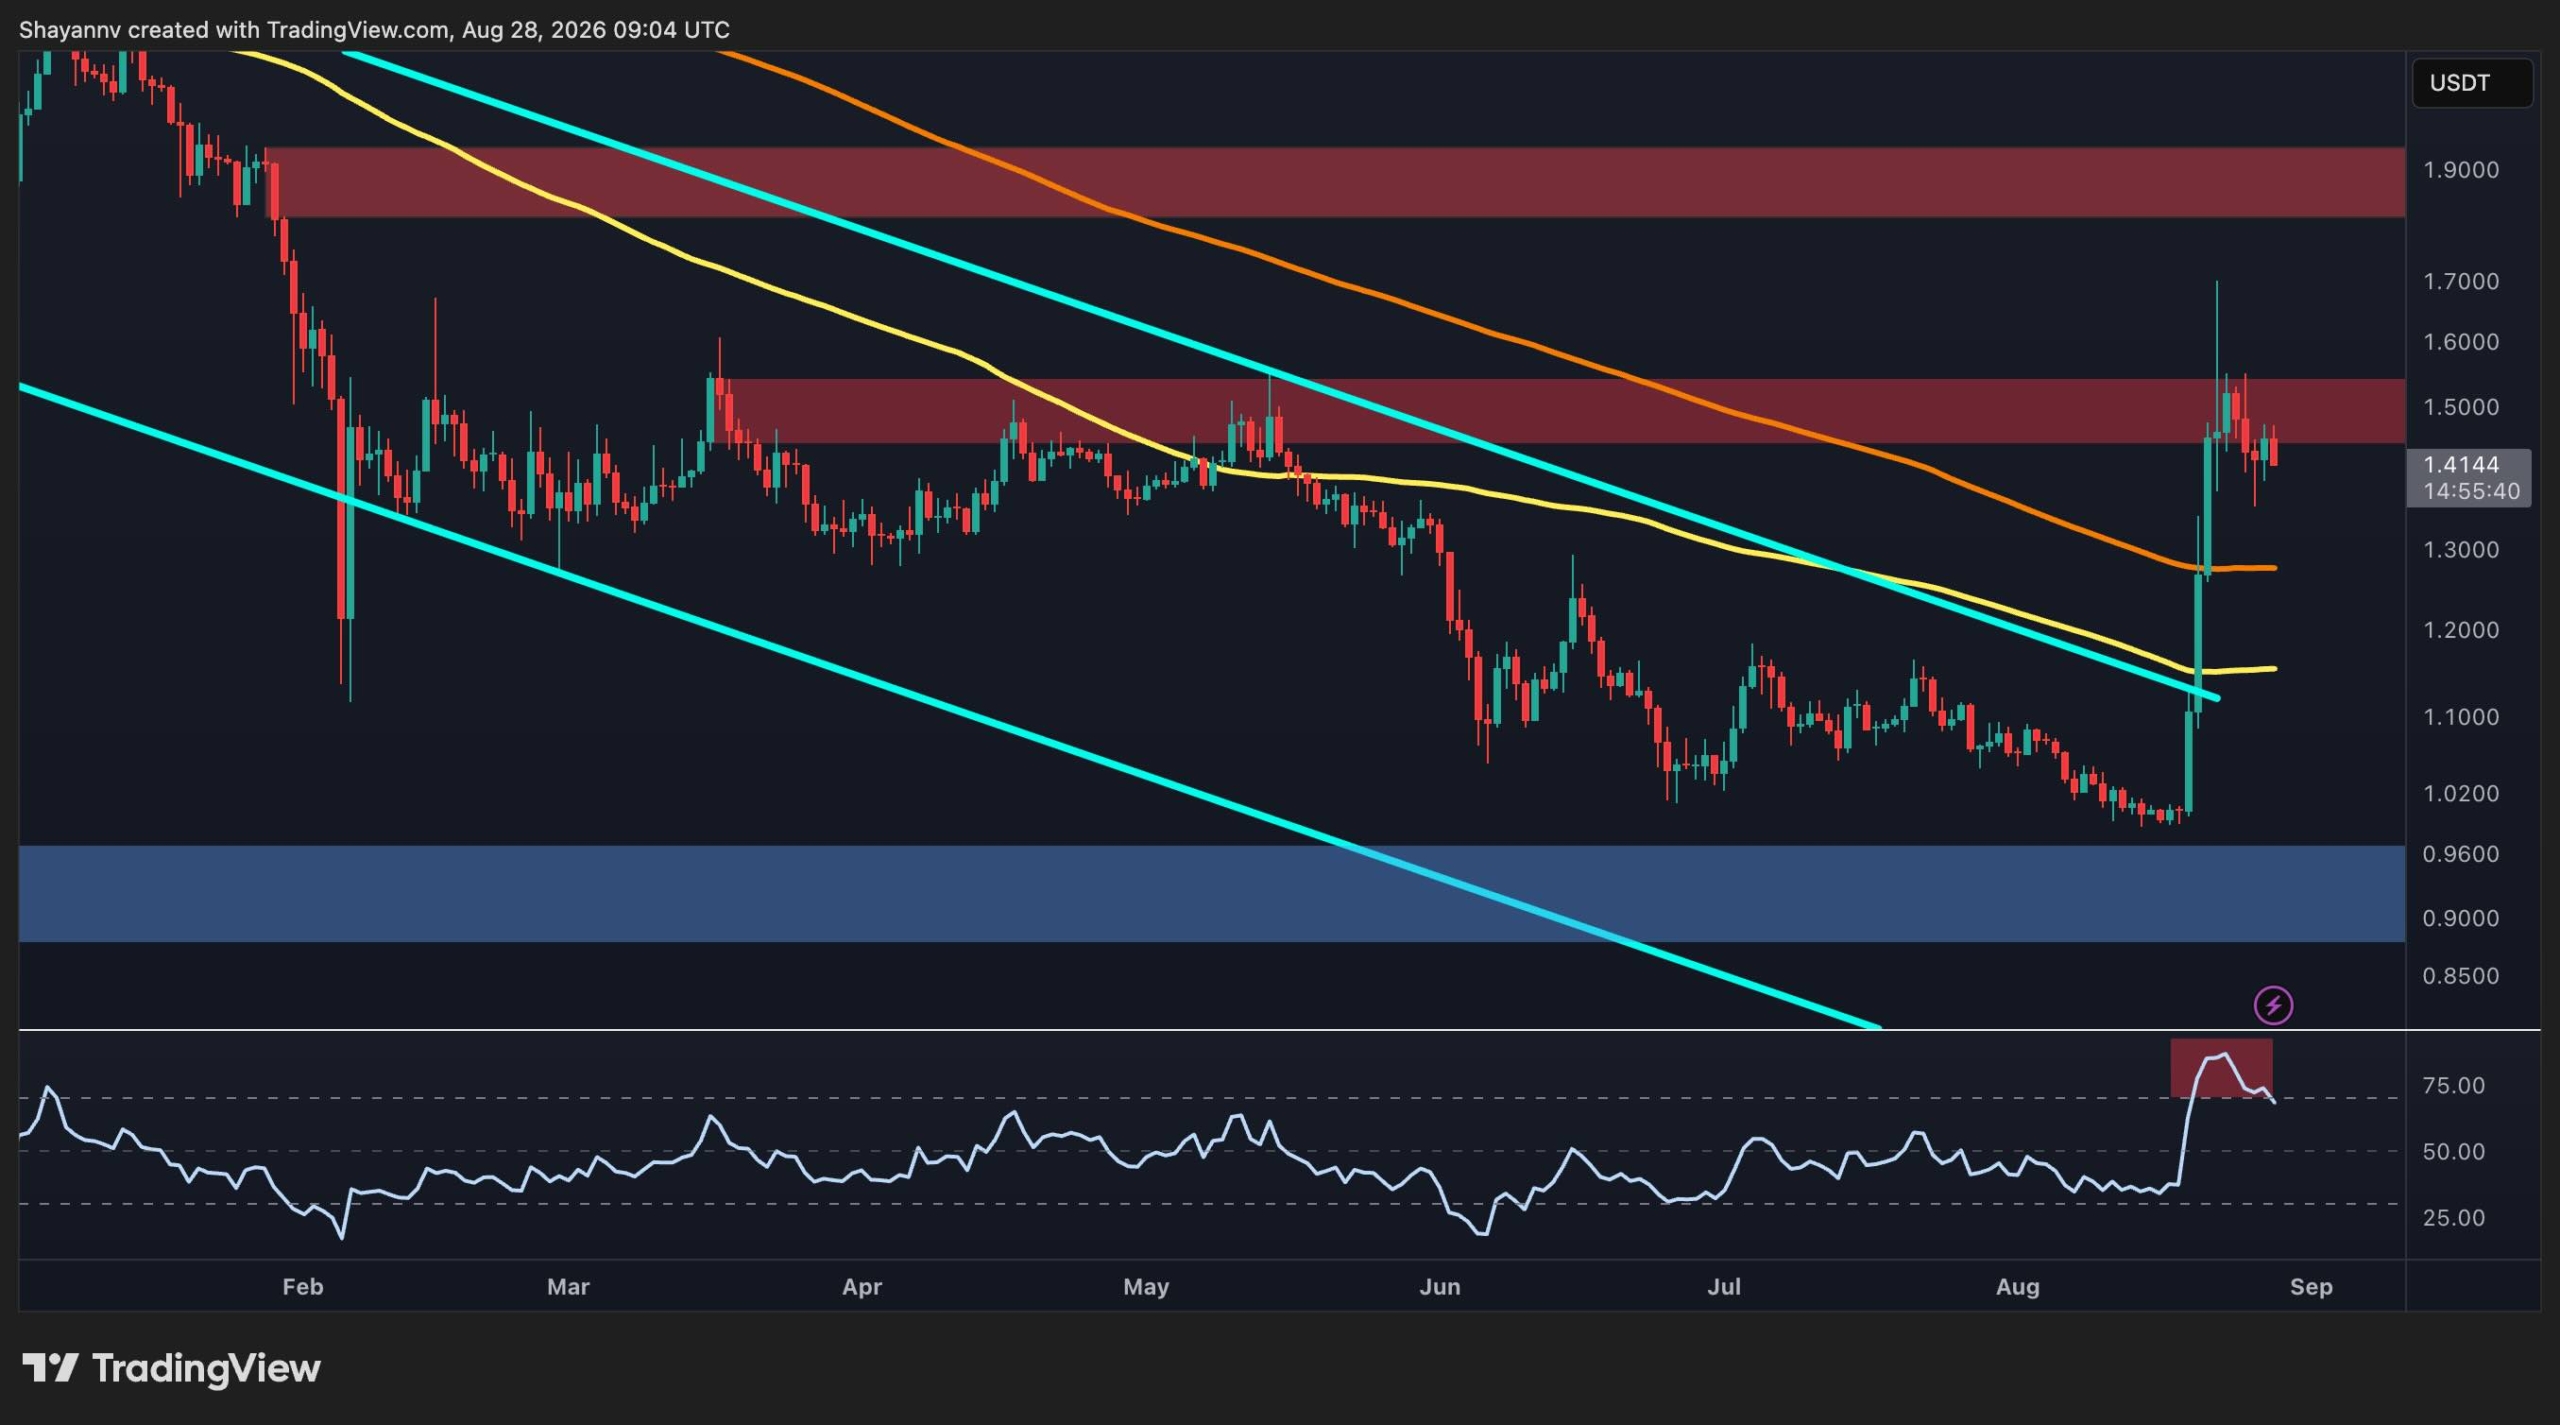
XRP has staged a sharp recovery from its August lows against USDT, breaking above the descending large channel and reclaiming key moving-average levels. However, the rally has now reached a major resistance area around $1.50, while momentum is beginning to cool down.
The broader structure is therefore improving, but the token still needs a sustained breakout above this supply zone. Meanwhile, the XRP/BTC pair is also lagging behind, which is a notable development to watch.
Ripple Price Analysis: The USDT Pair
XRP spent much of the year trading inside a broad descending structure, with the descending trendlines defining the dominant downtrend. The latest move represents a significant structural shift, as price surged from around $1.00 and decisively broke above the upper descending trendline as well as the 100-day and 200-day moving averages, located around $1.15 and $1.30 levels, respectively.
The breakout pushed XRP to a local high with a long wick near $1.70 before the price retraced sharply. XRP is currently trading around $1.41, meaning the initial breakout impulse has already undergone a meaningful correction.
The main resistance is now concentrated between $1.45 and $1.55. This zone previously acted as a major supply area and has once again capped the recovery. A daily close above $1.55 would strengthen the bullish case and could open the way toward the larger $1.85-$1.90 resistance zone.
On the downside, the 100-day and 200-day moving averages are the dynamic support levels to watch. Holding above them would keep the bullish reversal thesis intact.
Momentum has also improved dramatically. The RSI surged above 75 during the breakout, entering overbought territory, but has since pulled back toward the mid-70s. This cooling is not necessarily bearish by itself, as it could simply indicate that the market is digesting the vertical rally. However, continued RSI deterioration while XRP remains below $1.50 would increase the risk of a deeper retracement.
The BTC Pair
The XRP/BTC chart provides an important additional perspective. XRP also broke sharply higher against Bitcoin after spending months inside a descending channel. The move briefly lifted the pair from roughly 1,500 sats to above 2,000 sats, although a substantial portion of that advance has already been retraced.
The immediate resistance is still around 2,000 sats, where horizontal supply and the upper boundary of the descending channel converge. A sustained breakout above this region would indicate that XRP is beginning to outperform Bitcoin on a more structural basis, which could lead to a structural rally for Ripple in the coming months.
However, as already mentioned, the recent spike above roughly 2,000 sats was rejected, producing a long upper wick and subsequent weakness. The pair has subsequently fallen back below its 200-day moving average, which is located just above 1,800 sats.
This makes the current area important, as holding around 1,700 sats and above the 100-day moving average could allow XRP/BTC to stabilize and attempt another attack on resistance, whereas losing this region would expose the deeper fair-value-gap area below 1,700 sats.

The post Ripple Price Analysis: XRP Looks Bullish Against USD but the BTC Pair Tells a Different Story appeared first on CryptoPotato.

Why Don’t Modern Cars Backfire As Often As Older Models?

Footage leaks of EA’s Iron Man game but can it beat the Marvel curse?
Horizon Kinetics, 10% owner, buys Texas Pacific Land share for $365





-

 Fashion7 days ago
Weekend Open Thread: Madewell – Corporette.com
-

 Crypto World3 days ago
SpaceX stock could rise 75% to $240, JPMorgan says
-

 Business6 days ago
Musk’s Tesla, SpaceX Confirm $16.8 Billion ‘Terafab’ Chip Plant as World’s Largest Building in Texas
-

 Crypto World6 days ago
anatomy of crypto’s biggest liquidation event since 2021
-

 Crypto World4 days ago
A $30 Billion AI Fund Implodes, Now the SEC Is Investigating Wall Street’s Role
-

 Crypto World2 days ago
Warsh Jackson Hole keynote puts financial innovation first
-

 Politics6 days ago
6 months on, Irish renters crushed by effects of government housing bill
-
 Crypto World3 days ago
Did Trump Just Move SpaceX Stock With One Truth Social Post?
-

 Business15 hours ago
Salesforce Stock Soars 19% as Blowout Earnings and Agentforce AI Growth Silence Software Skeptics
-

 Business5 days ago
Mystery AI Model ‘Ox Alpha’ Draws Developers With Free Access as Chinese Lab Origins Remain Debated
-
 NewsBeat6 days ago
The ‘Lucky Dip Gang’ causing carnage for clicks: After five thugs were killed speeding in the wrong direction on a motorway, GUY ADAMS investigates a sick new trend… and why police aren’t even allowed to pursue them
-
 Crypto World7 days ago
Nvidia Stock Suffers Longest Losing Streak Since 2022: Will Q2 Earnings End It?
-

 Business2 days ago
Walmart takes aim at younger shoppers with new fashion brand
-

 Business4 days ago
Moderna CEO warns China is pouring state money into mRNA technology
-

 Business4 days ago
NVIDIA Stock Drops Nearly 2 Percent to $210 on Seventh Losing Day Ahead of Critical AI Earnings
-

 Business6 days ago
Will Tesla Stock Be Higher or Lower a Year From Now? Here’s What Wall Street Analysts Are Saying
-

 Tech7 days ago
Unitree’s New Superman Robot Claims to Outjump and Outrun Every Human, Usain Bolt Included
-
 Crypto World4 days ago
$92 Billion Nvidia Earnings Could Make or Break the AI Trade
-

 Sports5 days ago
Deshaun Watson fires back at Browns fans after being booed: ‘It’s a disrespectful thing’
-
 Crypto World5 days ago
Google Gemini AI Predicts Ethereum Could Become the Trade Retail Misses in 2026
You must be logged in to post a comment Login