
Crypto World
Why Crypto’s ‘Buy the Rumor’ Mantra No Longer Works
I entered the crypto market at a time when Bitcoin traded around $6,000 — yes, that long ago. Back then, it existed in a no man’s land between experimentation and finance, and the market reacted to headlines or influential voices in a knee-jerk manner.
That wasn’t just my impression. Years later, a study analyzing Bitcoin and Dogecoin during the 2020–2021 cycle found statistically significant increases in price and trading volume on days when Musk posted about cryptocurrencies. The effect was especially pronounced for Dogecoin, whose volatility response was more than ten times stronger than that of Bitcoin.
Fast forward to today, and something feels different. Big news still happens. Prices still rise and fall. But the way the market responds has clearly changed. Below, I try to break down what’s actually different.
Headlines Used to Be the Market
Earlier crypto cycles were defined by immediacy. Liquidity was thinner, derivatives were far less dominant in price discovery, and positioning was far more visible in spot markets. As a result, price action clustered tightly around the moment news broke.
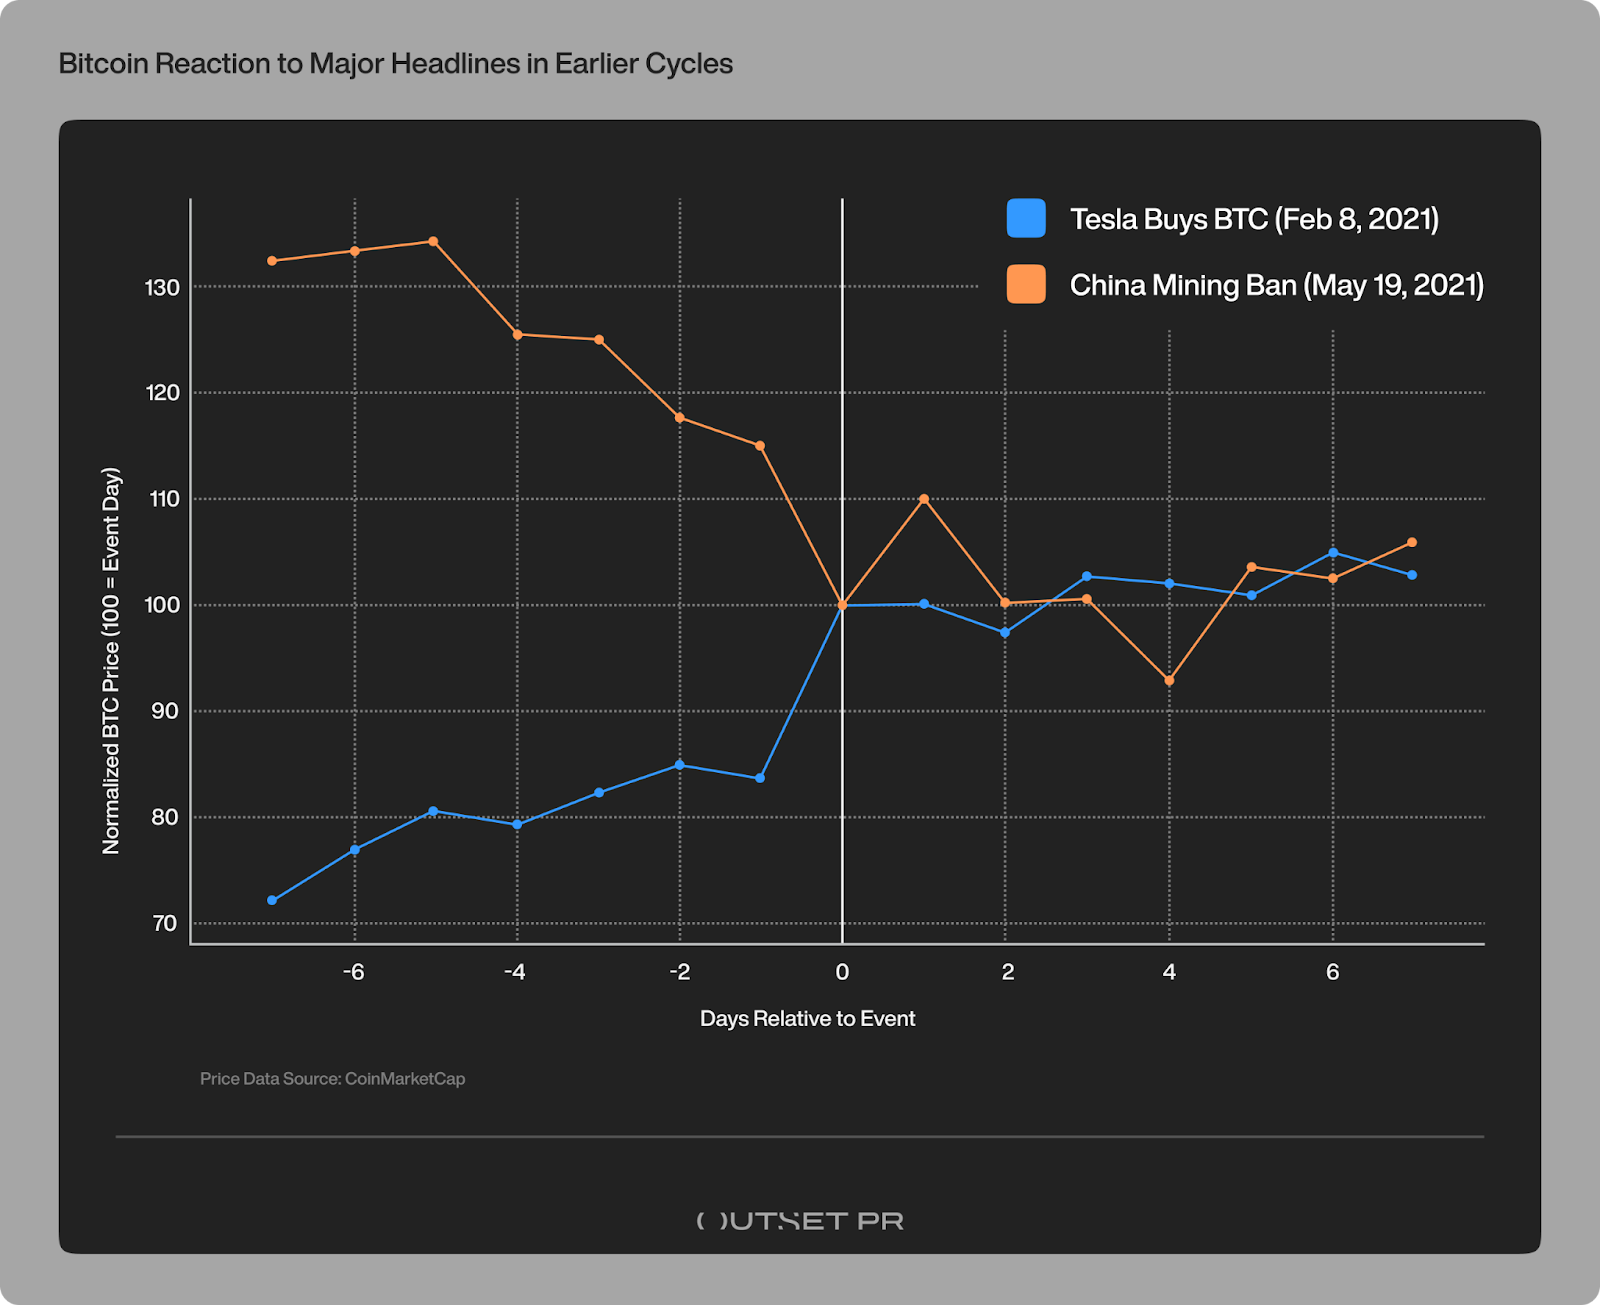
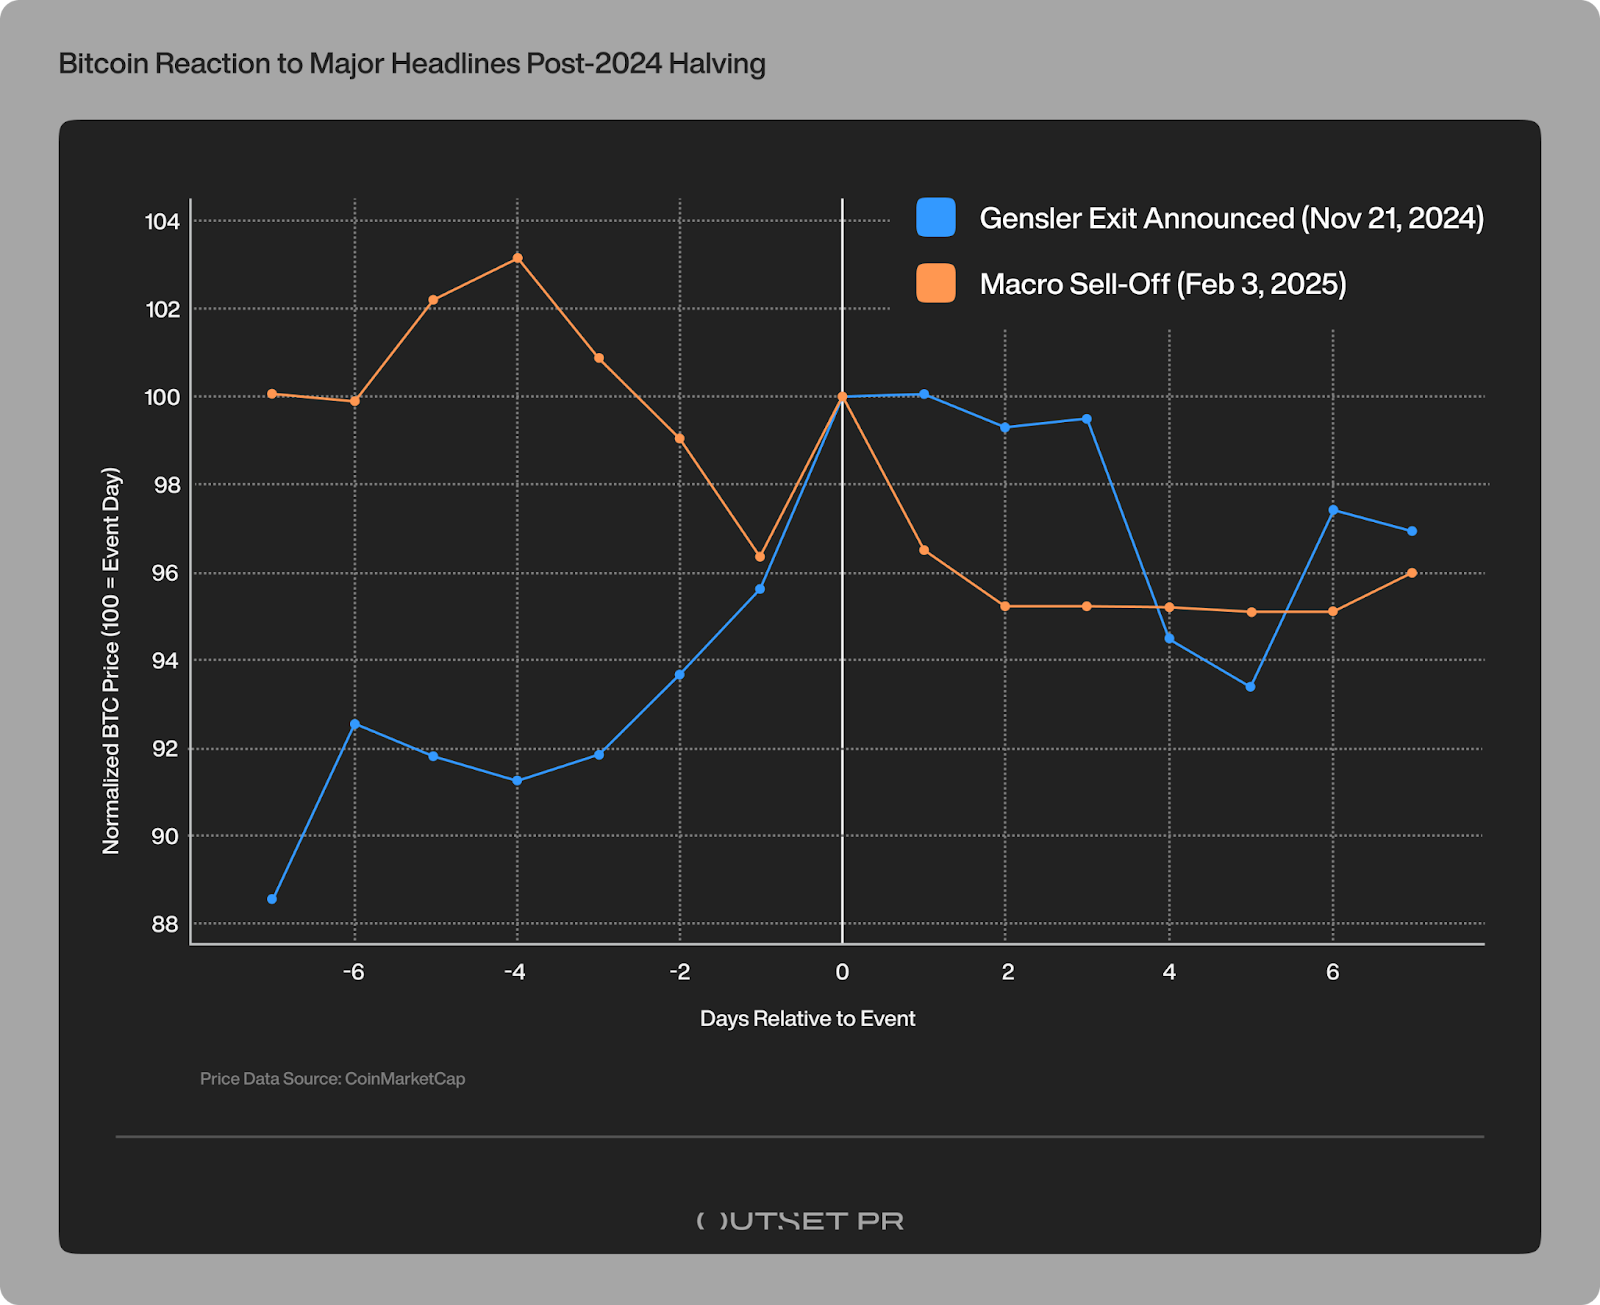
To assess whether Bitcoin’s reactions to news were immediate or gradual, I compared price behavior around major headlines across different market cycles. I selected two high-impact events from earlier cycles and two events of comparable significance from the post-2024 halving period. For each case, I tracked price movements before and after the news and normalized the data to focus on reaction patterns rather than absolute price levels.
In February 2021, Tesla disclosed that it had purchased $1.5 billion worth of Bitcoin, which was trading around $38,000. Within hours of the announcement, the price surged more than 15% in a single session to the level above $44,000. There was little ambiguity in how the market interpreted the news. The headline itself was the catalyst.
The same dynamic worked in reverse just a few months later. In May 2021, as China intensified its crackdown on Bitcoin mining, Bitcoin fell from roughly $40,000 to near $30,000 in a matter of days. Headlines triggered panic selling, forced liquidations, and cascading declines that felt sudden and overwhelming. Price didn’t drift lower — it collapsed.
In those markets, volatility wasn’t an exception. It was the baseline.

How the Current Cycle Handles Big News
Can we say Bitcoin no longer reacts to news? Not exactly. But the way it reacts has clearly changed.
Take the regulatory shift surrounding Gary Gensler’s departure as Chair of the U.S. Securities and Exchange Commission — widely viewed as a meaningful inflection point for the crypto industry.
In November 2024, when news of his impending exit became public, Bitcoin was trading in the mid-$80,000s. Over the following weeks, price pushed higher to the $100,000 level. But the move unfolded gradually, with much of the appreciation taking place before the leadership change became official in January 2025.
There was neither a single breakout candle, nor sudden repricing at the moment of confirmation. Instead, the market embraced the development as part of a broader, already-expected regulatory shift.
A similar pattern emerged during the February 2025 macro-driven sell-off. As U.S. tariff announcements and rising global risk pushed markets into a risk-off mode, Bitcoin slipped from just above $100,000 to the mid-$90,000s. The decline was real, but measured and spread over several sessions rather than concentrated in a single shock. Unlike the China ban in 2021, there was no panic cascade and no sense of structural failure.Price fell, but it did so calmly.
Volatility Spread Out Over Time
The contrast is telling. In 2021, major headlines produced immediate double-digit moves jostled around the news itself. In the current cycle, developments of similar importance have resulted in multi-day trends, with price often moving ahead of official announcements.
Bitcoin didn’t stop rising and falling. The charts point to a different shape of volatility — with smoother price moves and fewer headline-driven extremes. Market reactions no longer reflect that wide-eyed, hair-scratching surprise, but are increasingly driven by positioning, liquidity, and expectations.
In short, Bitcoin didn’t stop reacting — it stopped overreacting.
Where the Reaction Went
Much of the current market’s adjustment happens away from the visible spot price. Large players now use futures and options to build and hedge exposure. Capital flows in and out via spot Bitcoin ETFs, while big trades move through OTC desks rather than hitting the spot market right away. Together, these channels mute the black-and-white reactions that once defined earlier crypto cycles.
Large players and whales are still there, but their influence no longer reveals itself through obvious spot-market shocks. They can reposition quietly, change exposure without immediately forcing price to respond.
It feels like the market has finally buried its emotional, headline-driven reactions in the past and matured toward a quieter process of repricing risk.
This shift is unfolding against a very different macro backdrop: tighter global liquidity, fewer expectations of automatic bailouts, and monetary policy focused on restraint rather than stimulus. Bitcoin, increasingly treated as a macro asset and accessed through regulated channels like ETFs, now responds more to liquidity conditions and capital flows than to isolated news events.
If you’re still expecting every major headline to trigger an instant breakout or crash, the market can feel broken. Step back, though, and a different picture emerges — one where the noise hasn’t vanished, but it no longer leads the story. What remains is a market learning to price risk with patience.


The Federal Deposit Insurance Corporation (FDIC) has moved to tighten oversight of stablecoins, signaling a clear shift in how these digital assets will operate in the United States.
On April 7, the FDIC approved a proposal to implement key provisions of the GENIUS Act. The rule would set standards for stablecoin issuers under its supervision, including requirements for reserves, redemptions, capital, and risk management.
In simple terms, stablecoins in the US are being pushed closer to the banking system. Issuers will need to hold safe assets such as cash or US Treasuries and prove they can redeem tokens reliably at a one-to-one value.
At the same time, the proposal formally brings banks into the stablecoin ecosystem. Insured banks would be allowed to hold reserves and provide custody services. This links stablecoins more directly to traditional financial infrastructure.
The FDIC also addressed how deposits backing stablecoins may be treated. If these funds meet the legal definition of a deposit, they could qualify for the same protections as regular bank deposits. This could increase trust but also expands regulatory control.
However, the rule is not final. The agency will accept public comments for 60 days before making changes.
Overall, the direction is clear. In the US, stablecoins are no longer being treated as a separate crypto product. They are operating under rules similar to those applied to banks.
The post FDIC Moves to Treat Stablecoins Like Banks Under New Rule appeared first on BeInCrypto.
Crypto World
FDIC Approves GENIUS Act Stablecoin Rule to Govern Reserve, Capital, and Deposit Standards

TLDR:
- The FDIC Board approved a proposed rule establishing a prudential framework for payment stablecoin issuers under the GENIUS Act.
- FDIC-supervised IDIs offering stablecoin custodial and safekeeping services will face defined requirements under the new rule.
- The rule clarifies that tokenized deposits meeting the deposit definition will be treated equally under the Federal Deposit Insurance Act.
- Public comments on the proposed rule will be accepted for 60 days following its official Federal Register publication date.
The Federal Deposit Insurance Corporation (FDIC) has taken a notable regulatory step for digital assets. Its Board of Directors approved a notice of proposed rulemaking to implement the Guiding and Establishing National Innovation for U.S. Stablecoins Act (GENIUS Act).
The proposed rule sets a prudential framework for FDIC-supervised permitted payment stablecoin issuers. It covers reserve assets, redemption, capital, and risk management standards. This marks the FDIC’s second rulemaking under the GENIUS Act.
FDIC Sets Prudential Standards for Stablecoin Issuers
The proposed rule targets FDIC-supervised permitted payment stablecoin issuers directly. It establishes clear requirements around reserve assets, redemption processes, capital adequacy, and risk management. These standards aim to bring consistency across how stablecoin issuers operate within the banking system.
The FDIC also addressed insured depository institutions (IDIs) offering stablecoin-related custodial and safekeeping services. Such institutions will face specific requirements under this proposed framework.
This ensures that custodial services for stablecoins meet the same prudential standards as other banking activities.
The FDIC Board approved the proposed rulemaking and announced it through official channels earlier today. The rule reflects an ongoing effort to integrate digital assets into existing regulatory norms. It follows months of legislative activity surrounding the broader GENIUS Act framework.
Deposit Insurance Clarified for Reserves and Tokenized Deposits
The proposed rule also addresses pass-through insurance for deposits held as stablecoin reserves. This clarifies how federal deposit insurance applies within a stablecoin context. It is a practical detail for institutions managing reserve-backed payment stablecoins.
Moreover, the rule covers tokenized deposits meeting the statutory definition of a deposit. Under the Federal Deposit Insurance Act, such deposits will receive no different treatment than any other deposit type. This provides legal clarity for banks exploring tokenized deposit products going forward.
The public comment period for the proposed rule will remain open for 60 days after its Federal Register publication.
Stakeholders across the financial and crypto sectors will have an opportunity to respond. This allows the industry to contribute before the rule is finalized.
This latest proposal is the FDIC’s second rulemaking under the GENIUS Act. The first was issued on December 19, 2025, covering application procedures for IDIs seeking to issue payment stablecoins through subsidiaries.
Together, both rules are building the foundation of a broader federal stablecoin regulatory framework. As the GENIUS Act continues to take shape, regulated stablecoin issuance is becoming increasingly well-defined for financial institutions.

Key takeaways:
-
BTC failed to hold $70,000 despite strong ETF inflows as selling by public miners offset recent institutional buying.
-
Options markets reflect high demand for downside protection as a 17% put premium signals cautious sentiment.
Bitcoin (BTC) failed to sustain Monday’s $70,000 level despite $471 million in net inflows into US-listed spot exchange-traded funds (ETFs). The market’s initial excitement faded following reports that multiple US and Israeli aircraft and equipment were destroyed during a military operation in Iran over the weekend.
Since the S&P 500 remained relatively flat between Friday and Tuesday, Bitcoin’s inability to maintain bullish momentum likely stems from other factors.

The US-listed Bitcoin ETFs recorded $471 million in net inflows on Monday, the highest in over five weeks; however, the trend for the preceding two weeks remained muted, signaling a lack of conviction. Part of traders’ concern stems from recent Bitcoin sales by publicly listed miners.
Bitcoin miner and digital asset treasury companies put BTC under pressure
MARA Holdings (MARA US) reportedly transferred 250 BTC on Tuesday, according to Lookonchain data. MARA previously announced the sale of 15,133 BTC in March and reported 38,689 BTC held in total. Traders fear additional sell pressure as multiple miners focus on trimming debt to fund a strategic shift toward AI computing data centers.
Riot Platforms (RIOT US) transferred 1,500 BTC for sale during the first week of April, according to Arkham data. Per the latest operational update, the company held 15,680 BTC, intensifying fears of continued liquidations as high energy costs negatively impact operations.
Other addresses linked to large miners sold 265 BTC on Tuesday after accumulating since early 2024, according to Lookonchain. The address 3PFNdgGi…myCh139 still holds 112 BTC. Regardless of the rationale behind these movements, sentiment worsened after Bitcoin’s hashrate dropped to 953 exahashes on Monday, down from 1,083 exahashes in late February.

Strategy (MSTR US) continued accumulating Bitcoin, totaling 4,871 BTC in the previous week alone. However, investors increasingly fear that few buyers remain after a two-month bear market, especially as companies that raised debt to accumulate Bitcoin face heavy pressure and are forced to sell some reserves.

Among the companies that reduced Bitcoin holdings over the past month are Sequans Communications (SQNS FR) and Nakamoto Inc (NAKA US). More concerning, a handful of other listed companies face losses of 35% or more on their Bitcoin holdings, including GD Culture Group (GDC US) and OranjeBTC (OBTC3 BR), according to BitcoinTreasuries data.
Related: Bitcoin price risks ‘$15K shakeout’ in the next 5 months, BTC analyst warns

Bitcoin options markets signaled discomfort on Tuesday as put (sell) options traded at a 17% premium relative to call (buy) instruments. Traders believe whales have a better gauge of the market, but the options skew results from regular traders constantly buying downside protection rather than a premeditated movement from market makers.
There is no indication that professional traders are leaning bearish, but a single day of strong ETF net inflows does not prove heightened institutional demand. Hence, even if a deal to reopen the Strait of Hormuz lifts risk markets, odds are Bitcoin could struggle to sustain levels above $75,000 given the risk-averse sentiment.
This article is produced in accordance with Cointelegraph’s Editorial Policy and is intended for informational purposes only. It does not constitute investment advice or recommendations. All investments and trades carry risk; readers are encouraged to conduct independent research before making any decisions. Cointelegraph makes no guarantees regarding the accuracy or completeness of the information presented, including forward-looking statements, and will not be liable for any loss or damage arising from reliance on this content.
Crypto World
Petroyuan Rises as Physical Oil, Yuan Settlements, and Rare Earth Markets Decouple From Dollar Systems
TLDR:
- Dated Brent physical oil trades at $141 while futures sit at $107, marking the widest gap recorded since the 2008 financial crisis.
- Twenty-six ghost fleet tankers settled yuan-based oil trades through CIPS, which hit 928 billion renminbi in daily volume by March 9.
- China controls 95 percent of heavy rare earth processing, and its 2025 export bans have already disrupted auto production lines in the US and Europe.
- The MAG7 lost $1.1 trillion in market cap since the conflict began, as physical supply constraints continue pressing paper-based equity valuations lower.
The petroyuan is gaining momentum as four key global markets send converging signals. Physical oil, equity valuations, yuan settlements, and rare earth supply chains are all drifting away from dollar-based systems.
China appears positioned on the favorable side of each shift. The gap between physical and paper oil markets has not been this wide since 2008, drawing growing attention from analysts tracking commodity and currency flows worldwide.
Physical Oil and Equity Markets Break From Paper Valuations
Physical oil prices have separated sharply from futures markets in recent weeks. Dated Brent is now trading at $141, while futures remain at $107, a $34 gap. Dubai physical hit $140, and Oman physical reached $166. That spread is the widest since 2008.
Equity markets, however, continue to price in a temporary disruption. The MAG7 has lost $1.1 trillion in market capitalization since the conflict began.
Microsoft is 32 percent off its peak, and the S&P technology sector is down 8 percent since February 28. Energy stocks are up 6.6 percent over the same period.
Market analyst Shanaka Anslem Perera wrote on social media that “the paper market prices a resolution. The physical market prices the molecules that are not there.”
That observation reflects a widening divide between financial pricing and real-world supply conditions. Force majeures have spread across ten countries, with zero restarts reported so far.
The longer the disruption continues, the more pressure builds on paper-based valuations. Analysts say the gap between physical delivery and financial claims may not close without actual supply restoration. The current trajectory points toward structural, not cyclical, dislocation.
Yuan Settlements and Rare Earth Controls Reshape Global Trade Flows
Yuan-based oil settlements are rising sharply through China’s CIPS payment system. Twenty-six ghost fleet tankers have left the Persian Gulf since February 28, settling trades in yuan.
CIPS daily volume surged to 928 billion renminbi by March 9. Iran is sending 1.22 million barrels per day to China entirely outside the dollar system.
The dollar still holds 58 percent of global reserves, but settlement flows are shifting. China is capturing the yuan volumes the ongoing conflict generates daily.
The IRGC is also moving to legislate this yuan-based oil architecture into permanent law. That adds a regulatory layer to what began as an informal arrangement.
China also controls 95 percent of heavy rare earth output and processing globally. Export bans introduced in 2025 have already shut automotive production lines across the US and Europe.
The $8.5 billion American diversification push remains years away from producing separated dysprosium at scale. No near-term substitute has emerged.
Deutsche Bank described the conflict as the making of the petroyuan. Analysts, though, say that framing is too narrow.
The war is revealing that the global financial architecture rests on paper claims converting reliably to physical delivery. The April 19 waiver expiry is the next key date markets are watching closely.


An analysis of Morpho markets finds depositors are undercompensated by 5-10x. Curators counter that empirical loss data tells a different story.
Overcollateralized lending has emerged as one of DeFi’s most durable primitives.
Morpho alone holds roughly $7 billion in TVL, according to DeFiLlama, with distribution via Coinbase, Kraken, and other front ends. Apollo Global Management has committed to acquiring up to 9% of MORPHO’s token supply over four years, and the Ethereum Foundation has deployed nearly $19 million into the protocol’s vaults.
But a quantitative analysis published Sunday by Dirt Roads, a DeFi research publication authored by Luca Prosperi, has sparked a debate over whether the depositors fueling that growth are being systematically undercompensated, or whether the lending primitive is working exactly as it should.
Bear Case: Depositors Are Selling Puts They Don’t Understand
Prosperi’s analysis adapts the Black-Cox first-passage framework – a refinement of Merton’s 1974 structural credit model – to DeFi collateralized debt positions. In this context, depositing USDC into a Morpho vault backed by ETH collateral is equivalent to holding a risk-free bond and simultaneously selling a put option on that collateral, with the liquidation loan-to-value (LLTV) acting as the strike price.
Calibrated to ETH’s approximately 75% annualized realized volatility, jump intensity of 1.5 events per year with a mean jump size of -8.3%, and an LLTV of 86% against a 70% starting LTV, the model shows that the appropriate credit spread ranges from 250 to 400 basis points above the risk-free rate, in this case the Fed’s Secured Overnight Financing Rate (SOFR).
Observed depositor rates in flagship Morpho USDC markets are roughly 2-4% APY – thin margins above SOFR, which currently stands at 3.65%.
Crypto investor Santiago Roel endorsed the findings, arguing that $11.7 billion in Morpho vaults is retail capital funding crypto-collateralized lending “thinking it’s a savings account.” No institution, he says, would accept near risk-free rates to come on-chain. He pointed to a structural shift from early DeFi — when triple-digit APYs at least compensated for risk — to a present where vaults with completely different risk profiles present the same thin yields, and depositors simply pick the highest number.
“Last cycle we saw a lot of retail pour savings into algo stablecoins promising ‘risk-free’ yield,” Roel wrote. “This cycle vaults have a lot of demand but they are mispriced for the level of risk.”
Bull Case: It’s a Repo, Not a Put Option
The pushback came swiftly from practitioners with skin in the game and challenged not just the model’s inputs but its foundational analogy.
Steakhouse Financial’s adcv, whose firm curates the primary Morpho vaults that Coinbase routes retail deposits through, argues that on-chain lending is structurally closer to a repurchase agreement than a put option sale.
In a repo, one party temporarily exchanges an asset for cash with a commitment to repurchase and, critically, the lender holds the collateral outright throughout the transaction. On Morpho, collateral is locked in smart contracts and can be seized and liquidated atomically if value declines toward the LLTV threshold. The lender’s exposure is bounded not by the theoretical option payoff on the collateral’s full volatility distribution, but by the narrow residual risk that liquidation mechanics fail to make the lender whole.
This reframing leads to adcv’s central empirical objection: the loss-given-default (LGD) parameter. Prosperi’s model sets LGD at approximately 5%, derived from Morpho’s formulaic liquidation incentive. But the liquidation penalty is a cost borne by borrowers — not a loss absorbed by lenders. For liquid crypto-native collateral on prime markets, on-chain liquidation has historically resulted in near-zero bad debt for depositors because the overcollateralization buffer, continuous oracle monitoring, and open liquidator competition work as designed.
Steakhouse’s own data supports the claim. During the sharp selloff in late January and early February, when BTC fell 17% and ETH dropped 26% in a single week, Morpho processed approximately $238 million in liquidations. Users of Steakhouse’s vaults absorbed zero bad debt and maintained full withdrawal liquidity throughout.
“If you set the LGD parameter to a few basis points over 0% rather than approximately 5%, the model outputs fall exactly in line with observed rates at around 3-30 basis points,” adcv wrote.
Hasu, a strategy lead at Flashbots, made the same point more bluntly.
“Great model, but bad data in, bad data out,” he wrote. “If you use the historically observed level of bad debt on Morpho prime markets, even with a big safety buffer, the result changes: Now, depositors should demand an excess return of only 3-30bps, which is in line with rates observed in the wild.”
The Real Risk Is Fundamental, Not Market
MonetSupply, a contributor at Spark, offered a third perspective that aligns broadly with the curators’ position but redirects the risk conversation entirely. The bulk of the risk in on-chain prime repo, he argued, is not from market price-jump risk – the variable that Prosperi’s model centers on – but from fundamental and technical risks embedded in collateral assets and oracle mechanisms.
Most blue-chip collateral in Ethereum DeFi consists of tokenized Bitcoin (WBTC, cbBTC) or liquid staking tokens (wstETH, weETH). These issuers have long track records, but remain subject to custody and key management failures, smart contract vulnerabilities, and business continuity risks. Oracle providers introduce an additional dependency layer. The probability of incidents across these vectors is low, MonetSupply argues, but losses in a failure case can reach 100% of exposure – a fat-tailed distribution that Merton-style market risk models do not capture.
He pointed to the most recent major DeFi loss events – the Resolv exploit and the Drift Protocol vault drain – as evidence. Both were driven by fundamental risk factors, not market volatility. “As a DeFi lender, the primary driver of risk is these fundamental factors rather than jump risk,” he wrote.
MonetSupply also offered the most rigorous version of the structural premium argument, framing it through the lens of liquidity premia and convenience yield. For traditional finance investors, prime money market funds and T-bills are the benchmark liquid assets, and they would never accept sub-SOFR yields. But for crypto-native actors, the relevant measure of liquidity is not speed-to-bank-account but speed-to-on-chain-execution. A directional crypto fund facing even a one-hour delay between requesting redemption of a money market fund and receiving a wire to their exchange account could miss a 5-10% move in a volatile asset, he argued, wiping out years of excess risk-adjusted return over on-chain repo.
Convenience yield — the implied return on holding inventory close at hand — provides the same logic from a different angle. If on-chain actors derive meaningful benefit from having capital instantly deployable within the crypto ecosystem, even if that benefit is realized infrequently, it can be entirely rational to accept risk-adjusted returns below SOFR on prime repo.
Spark’s own USDT savings vault, MonetSupply noted, maintains over $700 million in available withdrawal capacity against $885 million in total deposits, far exceeding those of typical on-chain lending markets, which already offer a significant liquidity advantage over off-chain cash equivalents.
DeFi’s Structural Advantages
A separate thread in the debate argues that the risk-free rate comparison itself is flawed on even simpler grounds.
Pseudonymous trader MilliΞ contends that DeFi yield carries structural properties traditional fixed income does not: composability that enables permissionless derivative applications, censorship-resistant access without custodians who can “play silly games with you,” and instant withdrawals versus the 30-day redemption windows typical of money market instruments.
“This may not matter to most of us first-worlders,” they wrote, “but it sure matters to the remainder of the planet.”
Where Both Sides Agree
Nobody disputes that the vast majority of retail depositors flowing into Morpho through exchange front-ends do not understand the credit exposure they are taking, and that vault risk profiles vary dramatically even when headline yields look similar.
Similarly, no one disputes that the track record supporting the curators’ optimistic loss assumptions is short and tested only in broadly favorable conditions; a point underscored by the Resolv exploit that cascaded across fifteen Morpho vaults in March, and the Stream Finance collapse that hit lending markets in November 2025. Steakhouse’s own vaults avoided those losses, but other curators’ depositors were not as fortunate.
Prosperi’s analysis also flags concerns outside the LGD debate. Leverage looping strategies, such as recursive wstETH/WETH or sUSDe loops at 7-10x effective leverage, behave not as credit products but as leveraged carry trades on mean-reverting basis spreads, where a 5% depeg at 10x leverage triggers liquidation. And the growing push to onboard non-crypto-native collateral breaks every assumption in the framework simultaneously: unobservable volatility, discrete oracle monitoring, multi-week liquidation delays, and jurisdictional enforcement risk.
The Real Test
The core disagreement is over which measure of risk matters: the structural exposure embedded in the position, or the empirical loss history of the platform. Prosperi and Roel argue the former; Hasu, adcv, MonetSupply, and the curator ecosystem argue the latter – while adding that the model is looking at the wrong risk entirely, and that rational actors may have good reasons to accept thin or even negative spreads over SOFR.
Structural models can overstate market risk by assuming passive borrower behavior and ignoring the efficiency of on-chain liquidation mechanics, which have performed as advertised even under severe conditions. But they may understate the fundamental risks that MonetSupply identifies, which lie entirely outside the analysis framework. Meanwhile, empirical models can understate risk by extrapolating from a short, favorable sample.
As institutional allocators expand on-chain credit exposure, the question may ultimately be settled not by models but by the next sustained drawdown, or the next fundamental failure.
“The mispricing will become visible when the market turns,” Prosperi wrote. The curators are betting it won’t, and vault depositors agree with them, at least for now.
This article was written with the assistance of AI workflows. All our stories are curated, edited and fact-checked by a human.


Summary
- Uniswap’s price climbs roughly 4–5% over 24 hours as shorts cover into prior selling.
- Perpetuals volume spikes while open interest only nudges higher, pointing to a flow‑driven bounce, not long‑term positioning.
- UNI trades as a DeFi governance and DEX token, moving broadly in line with other liquidity‑sensitive majors rather than staging a standalone re‑rating.
Uniswap’s (UNI) price rose about 4–5% over the past 24 hours on Tuesday, clawing back ground after a week of steady selling as traders rushed to cover shorts and fade what they saw as an overshoot to the downside.
UNI spot prices hovered around $3.10–$3.20 during the European afternoon, up from the roughly $3.00 area printed earlier this week, but still far below the $4.00 handle seen around key governance headlines in late February and early March.
The move comes as Uniswap, an automated market maker and leading DeFi DEX whose governance token sits squarely in the DeFi/L1 infrastructure bucket, continues to trade as a high‑beta proxy on on‑chain liquidity rather than a pure idiosyncratic story.finance.
Historical data from Yahoo Finance shows UNI closing near $3.10 on April 7 after marking $3.12 on April 5 and $3.17 on April 4, highlighting how compressed the absolute trading range has been even as percentage swings look dramatic intraday.
Kraken’s price page lists Uniswap at about $3.15, up 1.82% over the last 24 hours, with a circulating supply of roughly 633.6 million UNI and a market capitalization just under $2.00 billion. WEEX cites a similar picture, showing UNI at $3.11 with a 24‑hour volume of about $125.44 million and a market cap near $1.97 billion, reinforcing that today’s jump is happening inside a broader multi‑month range rather than breaking it.
Derivatives flows line up with the short‑covering narrative. While venue‑specific UNI perp data remains fragmented, platforms tracking perpetuals across majors have flagged a broader pattern where perpetual trading volume has doubled over the past five months even as aggregate open interest only climbed about 50%, from roughly $13 billion to $18 billion before retracing back to $13 billion. That structure—more turnover relative to the open risk being carried—typically marks environments where traders are trading the range, not building long‑term positions, and UNI’s latest pop fits neatly into that template.
Crypto.news’ recent coverage of Uniswap’s price around the dismissal of a four‑year scam‑token lawsuit, when UNI traded near $2.83 after a 15% weekly rebound, framed the token as pushing toward the upper end of a $3.30–$4.12 band with a strengthening RSI but still stuck below prior breakdown levels. Another crypto.news story from late February, written as UNI traded around $4.02 with an 18% weekly gain, tied that move to a fee‑switch expansion proposal that could lift protocol revenue toward $61 million annually and potentially justify a push toward the $4.55–$4.60 zone. Taken together with broader crypto.news reporting on Bitcoin’s recent slide and renewed risk jitters, UNI’s last 12 hours look like textbook mean‑reversion in a liquidity‑sensitive DeFi token—powered by perp flows and dip‑buyers, but still waiting on sustained open interest and fresh governance catalysts before any new macro uptrend can credibly be declared.


Risk markets, including bitcoin , staged a late-day rally Tuesday after Axios reported Iran’s positive reception to Pakistan’s request for a two-week ceasefire.
“The President has been made been aware of the proposal, and a response will come,” said White House Press Secretary Karoline Leavit, when asked about the report.
Under heavy pressure earlier in the session, the Nasdaq rallied to close modestly in the green. Crypto followed suit, with bitcoin climbing to $69,400 after sliding below $68,000 hours prior.
Markets got off on the wrong foot Tuesday after President Trump said “a whole civilization will die,” if Iran didn’t open the Strait of Hormuz prior to his 8 pm ET deadline. That remark prompted strong criticism from politicians and other figures who had previously supported his campaign and presidency, with some even calling for the impeachment of Trump.

Global public debt is approaching 100% of world GDP, a level not seen since World War II.
The IMF is sounding the alarm: with debt high and borrowing costs rising, governments can no longer defer hard fiscal choices.
IMF Debt Warning in Numbers
The IMF chart tells a dramatic story. Global public debt as a percentage of GDP has spiked through several historical crises: World War I, the Great Depression, World War II, the 2008 Global Financial Crisis, and COVID-19.
However, the current trajectory is different. Unlike post-World War II, when debt levels declined sharply, today’s projections show debt continuing to rise. The IMF estimates global public debt will soon exceed World War II peaks.
Era Dabla-Norris and Rodrigo Valdes write in F&D magazine that “trust is now essential to reconciling competing priorities.” In other words, governments face impossible trade-offs between spending, taxation, and debt servicing.
Fun Fact: After World War II, global debt dropped from 150% to under 50% of GDP within two decades. Today’s projections show the opposite trajectory.
Why the IMF Warning Matters for Crypto
The IMF’s debt warning has direct implications for crypto markets:
- Inflation Hedge Narrative: When governments face unsustainable debt, they often resort to inflation to reduce real debt burdens. Bitcoin’s fixed supply makes it an attractive hedge against currency debasement.
- Dollar Confidence: Rising US debt levels put long-term pressure on dollar confidence. Stablecoins and Bitcoin could benefit as alternatives.
- Fiscal Instability: The IMF warns that hard fiscal choices cannot be deferred any longer. Historically, political instability around austerity measures has driven capital into uncorrelated assets.
Historical Context
The chart shows debt spikes during every major 20th-century crisis. However, each previous spike was followed by a decline. The current trajectory breaks this pattern.
COVID-19 pushed debt above 100% of GDP. Instead of declining, projections show a continued increase. For the first time since World War II, there is no clear path back to sustainable levels.
For crypto, this macro backdrop strengthens the case for decentralized alternatives to government-issued currencies. As fiscal trust erodes, trustless systems gain appeal.
The post IMF Alarm: Global Debt Hits World War II Levels appeared first on BeInCrypto.

Institutional Accumulation and Long-Term Holders
Richard Teng shared a chart showing the historical relationship between Bitcoin’s price and Long-Term Holders (LTH) Supply. The chart revealed a striking inverse relationship during major market cycles. As Bitcoin’s price surged in previous cycles, LTH Supply dropped sharply, marking a period of heavy distribution.
Since mid-February, BTC long-term holders have been back in accumulation mode. pic.twitter.com/iF45ytd6Ae
— Richard Teng (@_RichardTeng) April 7, 2026
During the recent price fluctuations between $65,000 and $70,000, long-term holders reduced their supply. However, the LTH Supply line hit bottom in mid-February 2026. Since then, it has sharply increased, showing a definitive upward trend. This change suggests that Bitcoin’s long-term holders have returned to accumulation, despite the ongoing market uncertainty.
Teng emphasized that this shift back to accumulation is highly bullish for Bitcoin. Long-term holders typically signal confidence in the asset when they stop selling. Their current behavior points to a belief in Bitcoin’s future value and stability.
Bitcoin’s Support Levels and Short-Term Market Risks
While Bitcoin’s price fluctuates within a tight range, analysts highlight the risks of short-term volatility. Bitcoin is currently trading in a “negative gamma pocket” between $65,000 and $70,000. This zone has thinner support levels, which could lead to rapid downside movements if bullish momentum fades.
Despite this risk, traditional financial institutions seem unaffected by the market’s turbulence. In fact, these institutions are using the current market chop as a buying opportunity. The large-scale purchases signal that institutions are unfazed by short-term market instability and are focusing on long-term gains.
Market data from Unfolded reported a massive $471.3 million in net inflows into Spot Bitcoin ETFs on April 6, 2026. This surge in institutional investments underscores the growing confidence in Bitcoin, despite its current price fluctuations. Traditional finance players are betting on Bitcoin’s future value, making this an optimistic sign for the market’s health.
Shifting Market Dynamics and the Future Outlook for Bitcoin
Bitcoin’s market behavior over the past few months has shown significant shifts. After a period of distribution, Bitcoin veterans have now returned to accumulation mode. This suggests that Bitcoin’s price may be poised for growth in the coming months as institutions continue to invest.
The reversal in long-term holder supply is seen as a bullish signal for Bitcoin’s future. As long as this accumulation trend persists, the potential for a price surge remains strong. The ongoing institutional interest further supports the likelihood of sustained growth for Bitcoin in the longer term.
With institutions continuing to invest and long-term holders refraining from selling, the outlook for Bitcoin is positive. However, the market still faces potential short-term volatility. Traders and analysts will be watching closely to see if the accumulation phase leads to a sustained upward trend.
MSBT will launch tomorrow as the lowest-fee Bitcoin ETF on the market, potentially kicking off a fee war among funds.
Morgan Stanley’s much-anticipated spot Bitcoin (BTC) exchange-traded fund is expected to begin trading on Wednesday, April 8, on NYSE Arca. Bloomberg senior ETF analyst Eric Balchunas confirmed the launch date in an X post today, citing the NYSE’s listing notice.
Bloomberg’s Isabelle Lee had signaled during a Monday broadcast that the launch was imminent, stating it would be “probably this week.“
The fund will enter the market as the lowest-cost spot Bitcoin ETF in the U.S. Per Morgan Stanley’s most recent S-1 amendment filed with the SEC, the annual expense ratio is just 0.14%, undercutting Grayscale’s Bitcoin Mini Trust, which is currently the lowest-fee option at 0.15%, and sitting well below BlackRock’s IBIT, which charges 0.25%.
Bloomberg’s Balchunas called the pricing a “semi-shock,” noting that the lower fee means none of Morgan Stanley’s roughly 16,000 financial advisors “will feel conflicted using it and they have shot at getting outside assets. Smart.”
The Defiant first covered Morgan Stanley’s filing for the ETF back in January, when the Wall Street giant — which manages nearly $9 trillion in assets — filed with the Securities and Exchange Commission (SEC) to launch both a spot Bitcoin and spot Solana ETF. At the time, Timot Lamarre of Bitcoin custody firm Unchained told The Defiant the launch would add to Bitcoin’s legitimacy and intensify fee competition among issuers.
The launch comes at a moment of renewed momentum for Bitcoin ETFs broadly. Spot Bitcoin ETFs had a weaker start to 2026, but yesterday, April 6, marked the largest net inflow day for U.S. spot BTC ETFs since February, with $471.32 million in net inflows, per SoSoValue.
BlackRock’s IBIT remains the dominant player by a wide margin, with over $63 billion in cumulative net inflows per SoSoValue, whereas cumulative net inflows across all Bitcoin ETFs currently sits at $56.43 billion.
Since the launch of spot Bitcoin ETFs in the U.S. in early 2024, an historical moment for the crypto industry, multiple major TradFi players have moved to launch their own products.
Morgan Stanley’s MSBT will be the first BTC ETF from a U.S. investment bank, but it will trade alongside funds from major asset managers, namely BlackRock, Fidelity, VanEck, Franklin Templeton, and others.
Spot BTC is currently trading around $68,600, down 13% on the year, and over 45% below its all-time high around $126,000, which was s4t in October of last year.

This article was written with the assistance of AI workflows. All our stories are curated, edited and fact-checked by a human.
FDIC Moves to Treat Stablecoins Like Banks Under New Rule

Irish Premiership: Ten-man Larne lose as Glentoran win to narrow gap at top

Americans lost a record $21 billion to cybercrime last year


-

 NewsBeat5 days ago
Steven Gerrard disagrees with Gary Neville over ‘shock’ Chelsea and Arsenal claim | Football
-

 Business5 days ago
No Jackpot Winner and $194 Million Prize Rolls Over
-

 Fashion4 days ago
Weekend Open Thread: Spanx – Corporette.com
-

 Crypto World6 days ago
Gold Price Prediction: Worst Month in 17 Years fo Save Haven Rock
-

 Business2 days ago
Three Gulf funds agree to back Paramount’s $81 billion takeover of Warner, WSJ reports
-

 Business4 days ago
Expert Picks for Every Need
-

 Sports3 days ago
India men’s 4x400m and mixed 4x100m relay teams register big progress | Other Sports News
-

 Business6 days ago
Login and Checkout Issues Spark Merchant Frustration
-

 Crypto World7 days ago
Bitcoin enters the public bond market as Moody’s gives a first-of-its-kind crypto deal a rating
-
Business2 days ago
No Jackpot Winner, Prize to Climb to $231 Million
-
Crypto World7 days ago
Bitcoin stalls below key resistance as technical signals skew bearish
-

 Tech5 days ago
Commonwealth Fusion Systems leans on magnets for near-term revenue
-

 Politics7 days ago
Starmer’s centre has collapsed, and the left was right all along
-

 Fashion1 day ago
Massimo Dutti Offers Inspiration for Your Summer Mood Board
-

 Crypto World6 days ago
Ripple rolls out enterprise crypto treasury platform for corporates
-

 Crypto World6 days ago
Why It’s Partnering, Not Issuing
-

 Business3 days ago
Akebia Therapeutics, Inc. (AKBA) Discusses Pipeline Progress and Strategic Focus on Kidney Disease Treatments at R&D Day – Slideshow
-
Politics7 days ago
Help us to finally end fox hunting for good
-

 Tech7 days ago
Solo Leveling: Ranking All Sung Jinwoo Shadows by Power
-

 Tech6 days ago
Drawing Tablet Controls Laser In Real-Time
You must be logged in to post a comment Login