
Crypto World
Will BTC Slide Under $80K Next?

Bitcoin has pulled back sharply, slipping roughly 10% from midweek into Thursday and testing the $81,000 level for the first time in more than two months. The move comes as traders digest a wave of outflows from spot BTC exchange-traded funds, alongside a broader risk-off tone that coincided with gold’s retreat from its own all-time high. The backdrop is a market increasingly focused on hedging and liquidity, with options markets flashing notable fear metrics just as leveraged bets have been unwound. The price action also underscores a crucial test for the $80,000 support area, which—while still intact—faces renewed scrutiny as investors weigh macro risks and the possibility of renewed volatility.
Bitcoin (BTC) experiences a pullback after a period of outsized moves, and the tissue of market signals suggests traders are cooling risk exposure in the near term. The drop comes on the back of US-listed spot Bitcoin ETFs showing material net outflows, while gold prices have dipped from their Wednesday peak. In this context, the market’s nervous undertone is evident in the options market, where fear is elevated and hedging activity appears more pronounced than at any point in recent months.
The latest data shows US-listed spot Bitcoin ETFs have recorded about $2.7 billion in net outflows since January 16, representing roughly 2.3% of total assets under management. This backdrop has raised questions about institutional demand and whether investors are layering into safer havens or stepping back from risk assets altogether. At the same time, gold has declined about 13% from its Wednesday high, reminding traders that multi-asset markets can move in tandem when liquidity tightens and macro narratives shift. The combination of ETF redemptions and precious metal dynamics has contributed to a cautious mood that could extend into the near term, even as some investors point to longer-term value cases for BTC as a potential hedge against inflation and currency risk.
Key takeaways
- Bitcoin options delta skew rose to 17% on Friday, its highest level in more than a year, signaling extreme fear and heightened hedging activity as market makers prepare for further downside protection.
- Net outflows from US-listed spot BTC ETFs totaled about $2.7 billion since Jan 16, equating to roughly 2.3% of assets under management and raising questions about institutional demand.
- The price correction reached about 10%, with BTC retesting the $81,000 area—the first proximity to that level in over two months—raising the specter of a soft test of the psychological $80k support.
- Approximately $860 million in leveraged long BTC futures positions were liquidated between Thursday and Friday, while aggregate BTC futures open interest fell to about $46 billion from around $58 billion three months prior, indicating deleveraging across the market.
- Stablecoin dynamics in cross-border flows suggested moderation rather than a rush for cash, with a 0.2% discount for USDT/CNY versus the US dollar/CNY, contrasting with traditional parity expectations and signaling cautious liquidity conditions.
Tickers mentioned: $BTC
Sentiment: Bearish
Price impact: Negative
Market context: The current dynamics sit at the intersection of risk-off trading, ETF outflows, and macro uncertainty. As traditional risk assets face persistent headwinds, investors have favored liquidity and short-duration exposures, which often translate into pressure on highly leveraged crypto positions and volatility spikes in liquid markets like BTC.
Why it matters
The surge in BTC options fear, mirrored by a jump in delta skew, points to a market structure that is increasingly sensitive to downside risk. When put options carry a premium relative to calls, market makers hedge with heightened caution, amplifying price swings in times of stress. The 17% delta skew suggests that the market is more willing to pay for downside protection than to bet on further upside, a condition that can feed upon itself if macro catalysts continue to weigh on sentiment. In this environment, traders must monitor not just price levels but the pace and direction of hedging activity, as it can create feedback loops that drive rapid short-term moves.
ETF flows are a useful lens into the institutional appetite for BTC as an asset class. The reported $2.7 billion of net outflows since mid-January, representing 2.3% of AUM, signals institutional demand softness even as retail participants can remain active. Outflows from spot BTC ETFs can compress price durability if buyers do not re-enter in meaningful size, particularly when risk-off sentiment is reinforced by other macro variables. This backdrop also coincides with gold’s multi-month rally being tempered by short-term retracements, underscoring a broader competition for capital across safe-haven assets. In this light, BTC’s price action becomes a barometer for risk sentiment in the crypto space and a gauge of how quickly demand can swing in response to macro cues.
Beyond the price action, the risk narrative extends into the realm of technology risk like quantum computing. While some market participants remain skeptical about imminent disruption to the cryptographic foundations of blockchains, others warn that long-term security considerations must be taken seriously. Independent research and ongoing dialogue within the industry—highlighted by initiatives such as Coinbase’s advisory board aimed at evaluating quantum threats with public research slated for early 2027—add a layer of forward-looking risk assessment to the conversation. The broader takeaway is that risk considerations—whether macro, technological, or liquidity-driven—are increasingly intertwined in shaping crypto markets.
Analysts note that a cooling in leverage can be a double-edged sword. On one hand, a deleveraging phase can reduce systemic risk and limit cascading liquidations, potentially stabilizing prices after a sharp correction. On the other hand, if risk appetite does not return, the market could remain range-bound with occasional reversals as participants digest incoming data and reassess risk premium. The combination of a lower open interest and notable liquidations suggests a shift toward a more conservative posture among traders, even as some investors argue that the long-term bull case for BTC remains intact. The ongoing debates around quantum security and the ongoing debate about institutional appetite will likely shape how quickly the market can stage a renewed rally if macro and crypto-specific catalysts align.
The futures market remains a useful lens into risk sentiment. With open interest sliding to $46 billion from a prior $58 billion, and with a substantial portion of long positions liquidated, the market appears to be purging excess leverage. This process can improve resilience over the longer term, but it can also prolong volatility in the near term if demand remains tepid or if new catalysts emerge. The broader ecosystem will watch how quickly liquidity returns, how ETF flows evolve, and whether macro narratives shift back toward risk-on or risk-off dynamics. In this context, BTC’s ability to reclaim momentum will hinge on more than just price—it will require a rebalancing of demand across institutions, traders, and retail participants alike.
As markets calibrate to these dynamics, traders will keep an eye on stablecoin liquidity signals as a proxy for overall risk appetite. The ratio of USDT to yuan and the implied USDT/CNY vs USD/CNY relationship offer a barometer of capital flight and the willingness of traders to move into on-chain assets or exit to cash. In the current climate, a modest 0.2% discount suggests a measured outflow rather than a rush for liquidity, reinforcing the narrative of caution rather than panic selling. This nuanced picture—combining price action, leverage cycles, and cross-asset flows—frames BTC as a barometer of risk sentiment rather than a standalone driver of returns in the near term.
What to watch next
- BTC price action around the $81,000–$87,000 band, with a focus on whether the asset can reclaim momentum and establish a new upside base.
- New ETF net flow data over the coming weeks, to determine whether institutional demand resumes or remains tepid.
- Deribit and other derivatives gauges (delta skew, volatility surfaces) for signs of fading fear or renewed hedging pressure.
- Any fresh developments on macro frontiers that could alter risk appetites, including inflation data and policy signals.
Sources & verification
- Bitcoin price retest near $81,000 and related market moves (price page and price data references).
- US-listed spot Bitcoin ETF net outflows totaling about $2.7 billion since Jan 16 (2.3% of AUM).
- Gold’s three-month performance and its interaction with crypto markets (gold-related article referencing divergence).
- BTC options delta skew reaching 17% (Deribit delta skew data; laevitas.ch source).
- Reported leveraged long BTC futures liquidations around $860 million; open interest decline from $58B to $46B (CoinGlass and related charts).
- Stablecoin liquidity indicators and USDT/CNY dynamics (OKX-based data visuals and captions).
- Coinbase advisory board on quantum computing risks and public research planned for early 2027.
- Related market analysis on potential “liquidation revenge” dynamics and BTC price catalysts.
Bitcoin market dynamics: options fear, ETF flows, and macro risk
Bitcoin (CRYPTO: BTC) has found itself navigating a confluence of hedging-driven activity, ETF liquidity, and broader macro risk signals. The most notable marker is the jump in the delta skew of BTC options to 17%—the highest in more than a year—indicating an elevated demand for downside protection that can feed into heightened volatility as market makers hedge. This condition often materializes when traders anticipate more downside or when liquidity is contracting, even if the immediate price path appears uncertain. The practical upshot is that any negative surprise—be it a policy shift, macro data release, or unexpected liquidity shock—can trigger outsized moves as hedges unwind or recalibrate in a hurry. The Deribit delta skew metric depicted in the chart below, with its sourcing from laevitas.ch, offers a window into the market’s fear gauge and the distribution of risk bets across the spectrum of options contracts.
The recent price action, meanwhile, reflects not only fear but real liquidity dynamics. Leverage in the system has been purged to some degree, with approximately $860 million in leveraged long BTC futures liquidations observed between Thursday and Friday. While this purge reduces systemic risk in the near term, it also underscores how fragile short-term sentiment can become when a dramatic price swing occurs. At the same time, aggregate BTC futures open interest slipped to about $46 billion, down from roughly $58 billion three months ago, signaling a cautious tilt among market participants and a shift away from highly leveraged bets. The chart below from CoinGlass illustrates the current open interest landscape and helps contextualize the scale of deleveraging occurring in the market.
Beyond outright price risk, the market is watching cross-asset flow signals, especially stablecoins, as a proxy for risk appetite. The current data indicate a modest shift in the USDT/CNY dynamic, with a 0.2% discount to the US dollar/CNY rate, indicating moderate outflows rather than an abrupt liquidity crunch. This stands in contrast to a typical 0.5%–1% premium and suggests that, at least in the near term, investors remain selective about their allocation to on-chain assets. Taken together with the price correction and the outflows from spot BTC ETFs, these indicators paint a cautious portrait: BTC could reclaim momentum if flows stabilize and risk sentiment improves, but the near-term path remains tethered to macro twists and the pace of institutional adoption.
In the broader context, investors should consider the potential implications of quantum computing risks on long-term security models for blockchains. While the field remains in early stages, industry observers emphasize the importance of ongoing research and preparedness. As Coinbase has signaled through its independent advisory board and forthcoming public research, this is a risk factor that could influence long-horizon holdings, even if it does not pose an immediate threat to today’s networks. At the same time, the market continues to watch for catalysts, such as potential policy shifts, ETF inflows, or regulatory developments, that could tilt risk sentiment in either direction. For now, the narrative is one of measured caution, with a focus on liquidity, hedging, and the durability of BTC’s longer-term value proposition in a rapidly evolving crypto landscape.
https://platform.twitter.com/widgets.js


GBP/USD failed to climb above 1.3500 and corrected some gains. EUR/GBP started a decent increase and might aim for more gains above 0.8700.
Important Takeaways for GBP/USD and EUR/GBP Analysis Today
· The British Pound is showing bearish signs below the 1.3400 support.
· There is a key bearish trend line forming with resistance near 1.3280 on the hourly chart of GBP/USD at FXOpen.
· EUR/GBP is gaining pace and trading above the 0.8660 pivot level.
· There is a connecting bullish trend line forming with support at 0.8670 on the hourly chart at FXOpen.
GBP/USD Technical Analysis
On the hourly chart of GBP/USD at FXOpen, the pair failed to stay above the 1.3450 pivot level. As a result, the British Pound started a fresh decline below 1.3400 against the US Dollar.
There was a clear move below 1.3340 and the 50-hour simple moving average. The bears pushed the pair below 1.3250. Finally, there was a spike toward the 1.3200 handle. A low was formed near 1.3202, and the pair is now consolidating losses.
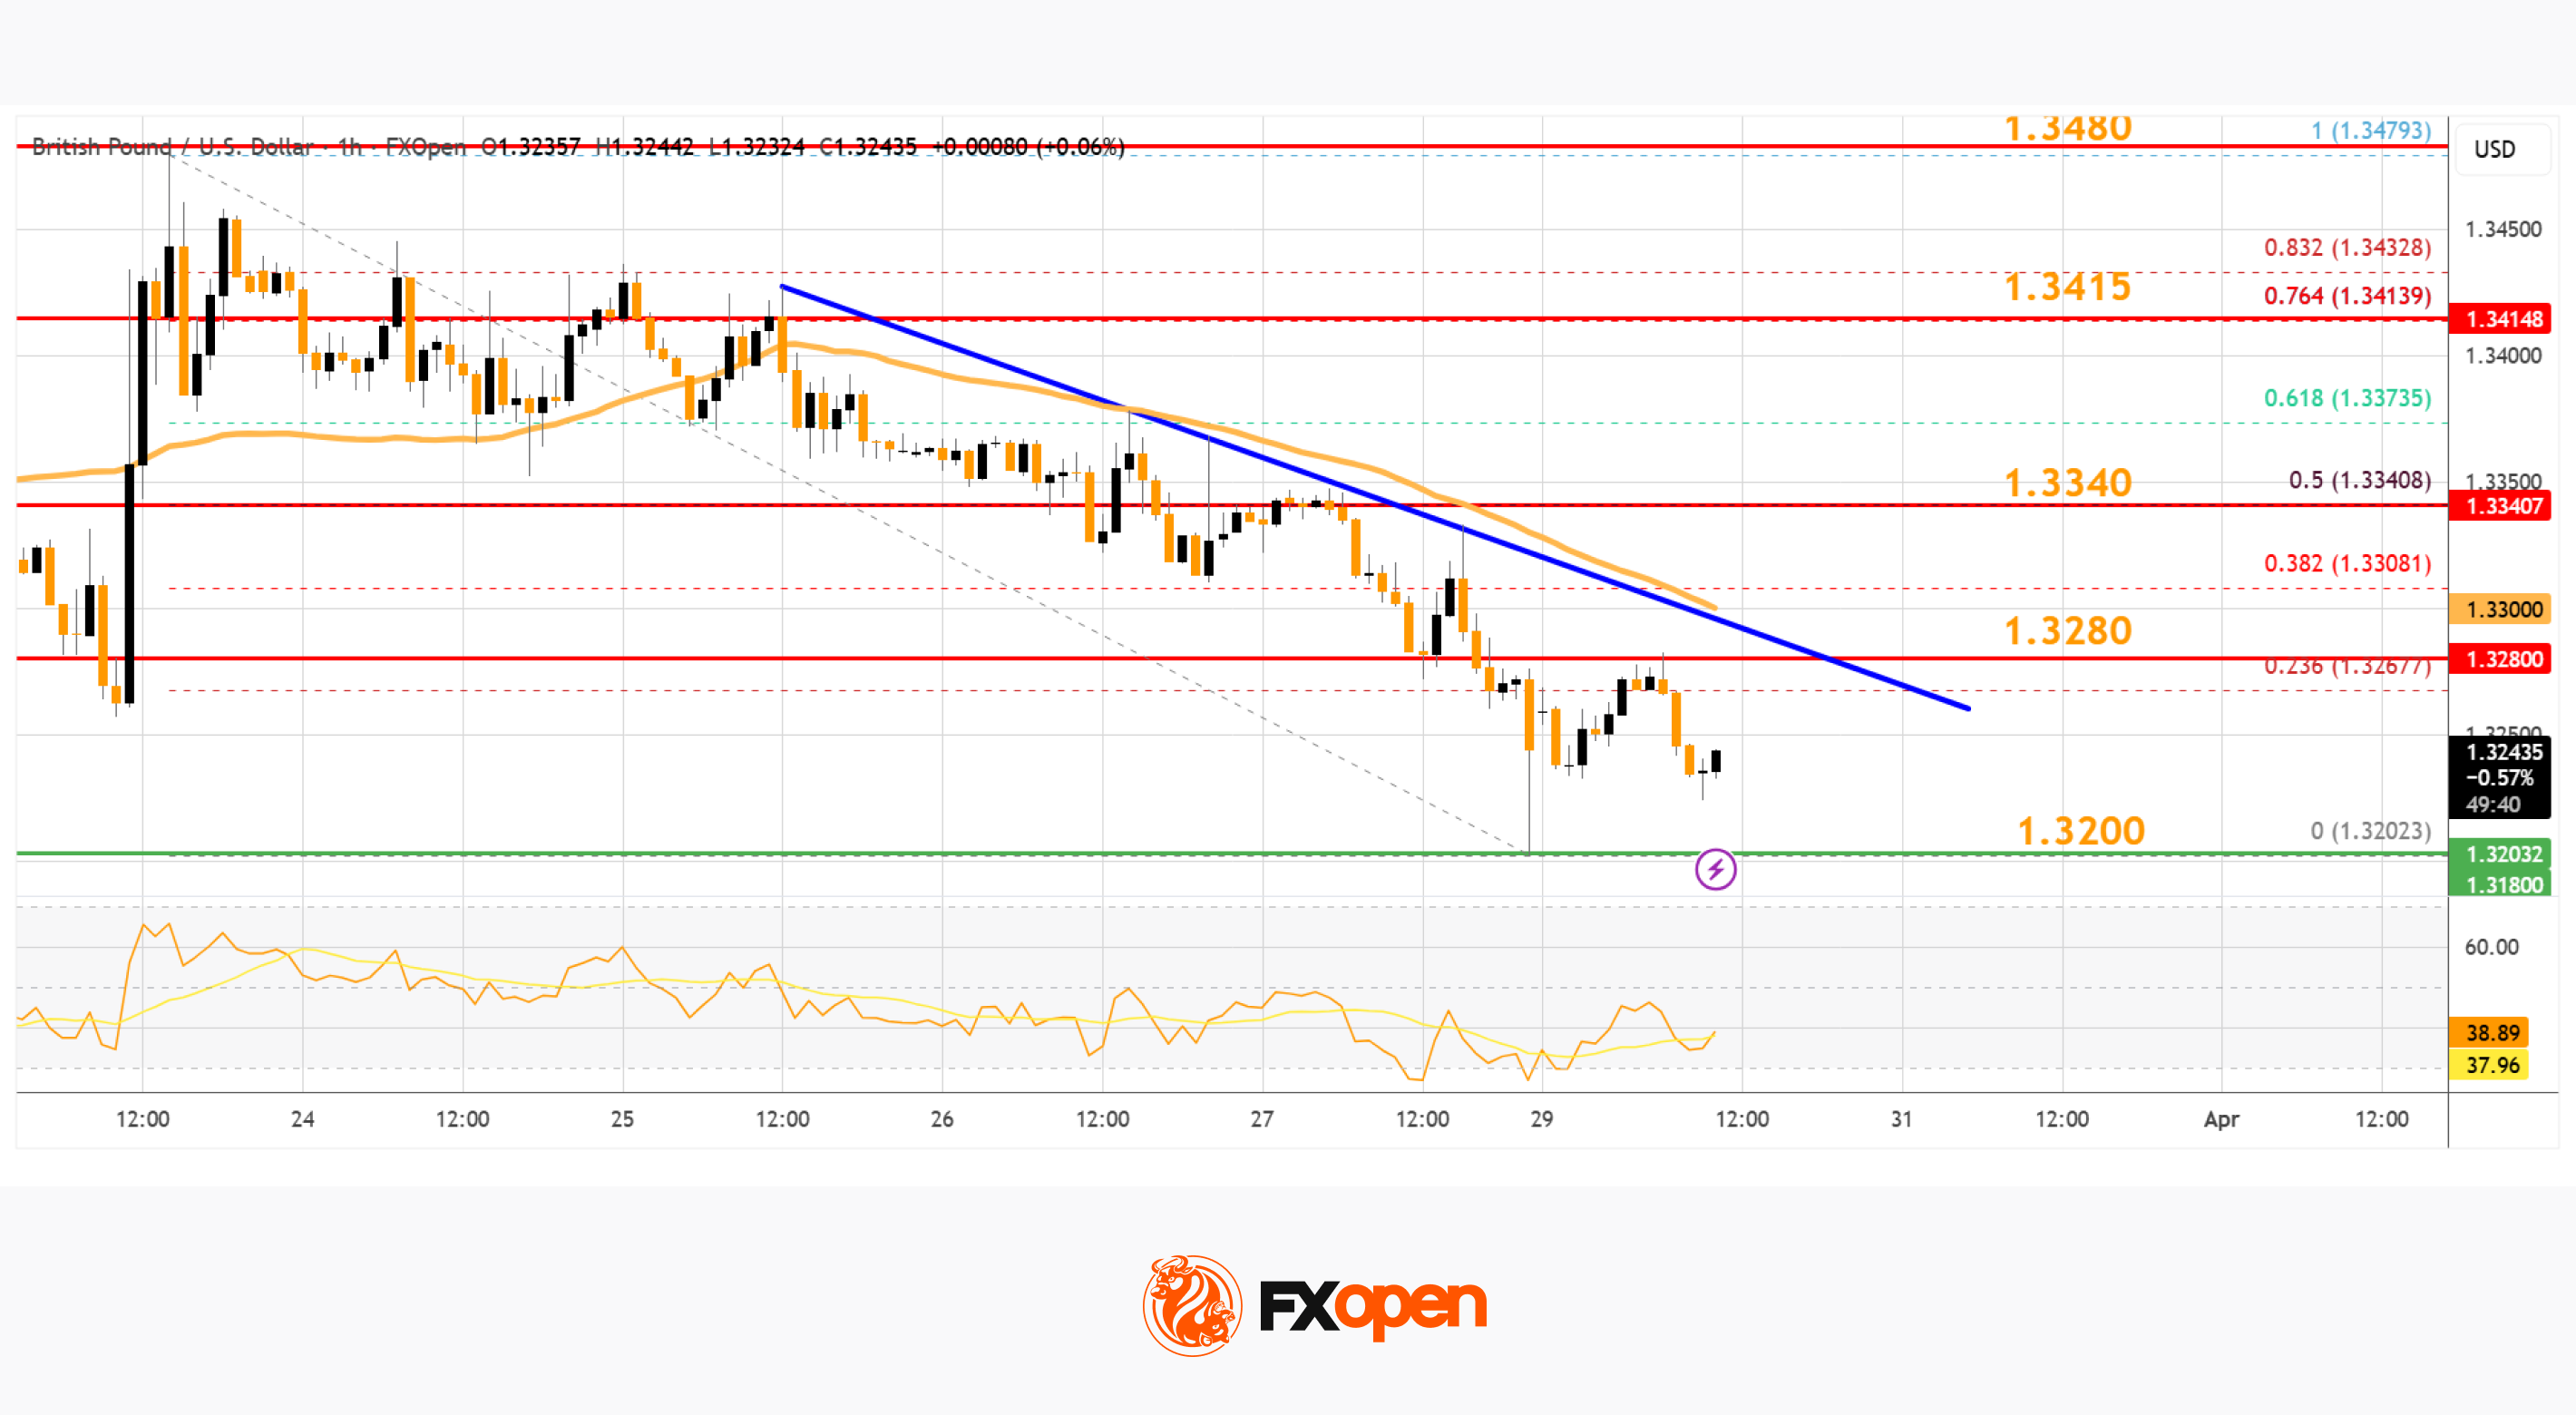
There was a minor move above 1.3240 and the 23.6% Fib retracement level of the downward move from the 1.3479 swing high to the 1.3202 low. On the upside, the GBP/USD chart indicates that the pair is facing resistance near a key bearish trend line at 1.3280.
A close above the trend line might send the pair toward the 50% Fib retracement at 1.3340. If the bulls remain in action, they could aim for more gains.
In the stated case, the pair might rise toward 1.3415. The next major hurdle for GBP/USD sits at 1.3480. On the downside, there is a key support forming near 1.3200. If there is a downside break below 1.3200, the pair could accelerate lower. The next key interest area might be 1.3160, below which the pair could test 1.3120. Any more downside could lead the pair toward 1.3050.
EUR/GBP Technical Analysis
On the hourly chart of EUR/GBP at FXOpen, the pair started a decent increase from 0.8635. The Euro traded above 0.8650 to enter a positive zone against the British Pound.
The pair settled above the 50-hour simple moving average and 0.8660. The pair traded as high as 0.8687 before there was a minor pullback, but the pair stayed above the 23.6% Fib retracement level of the upward move from the 0.8636 swing low to the 0.8687 high.
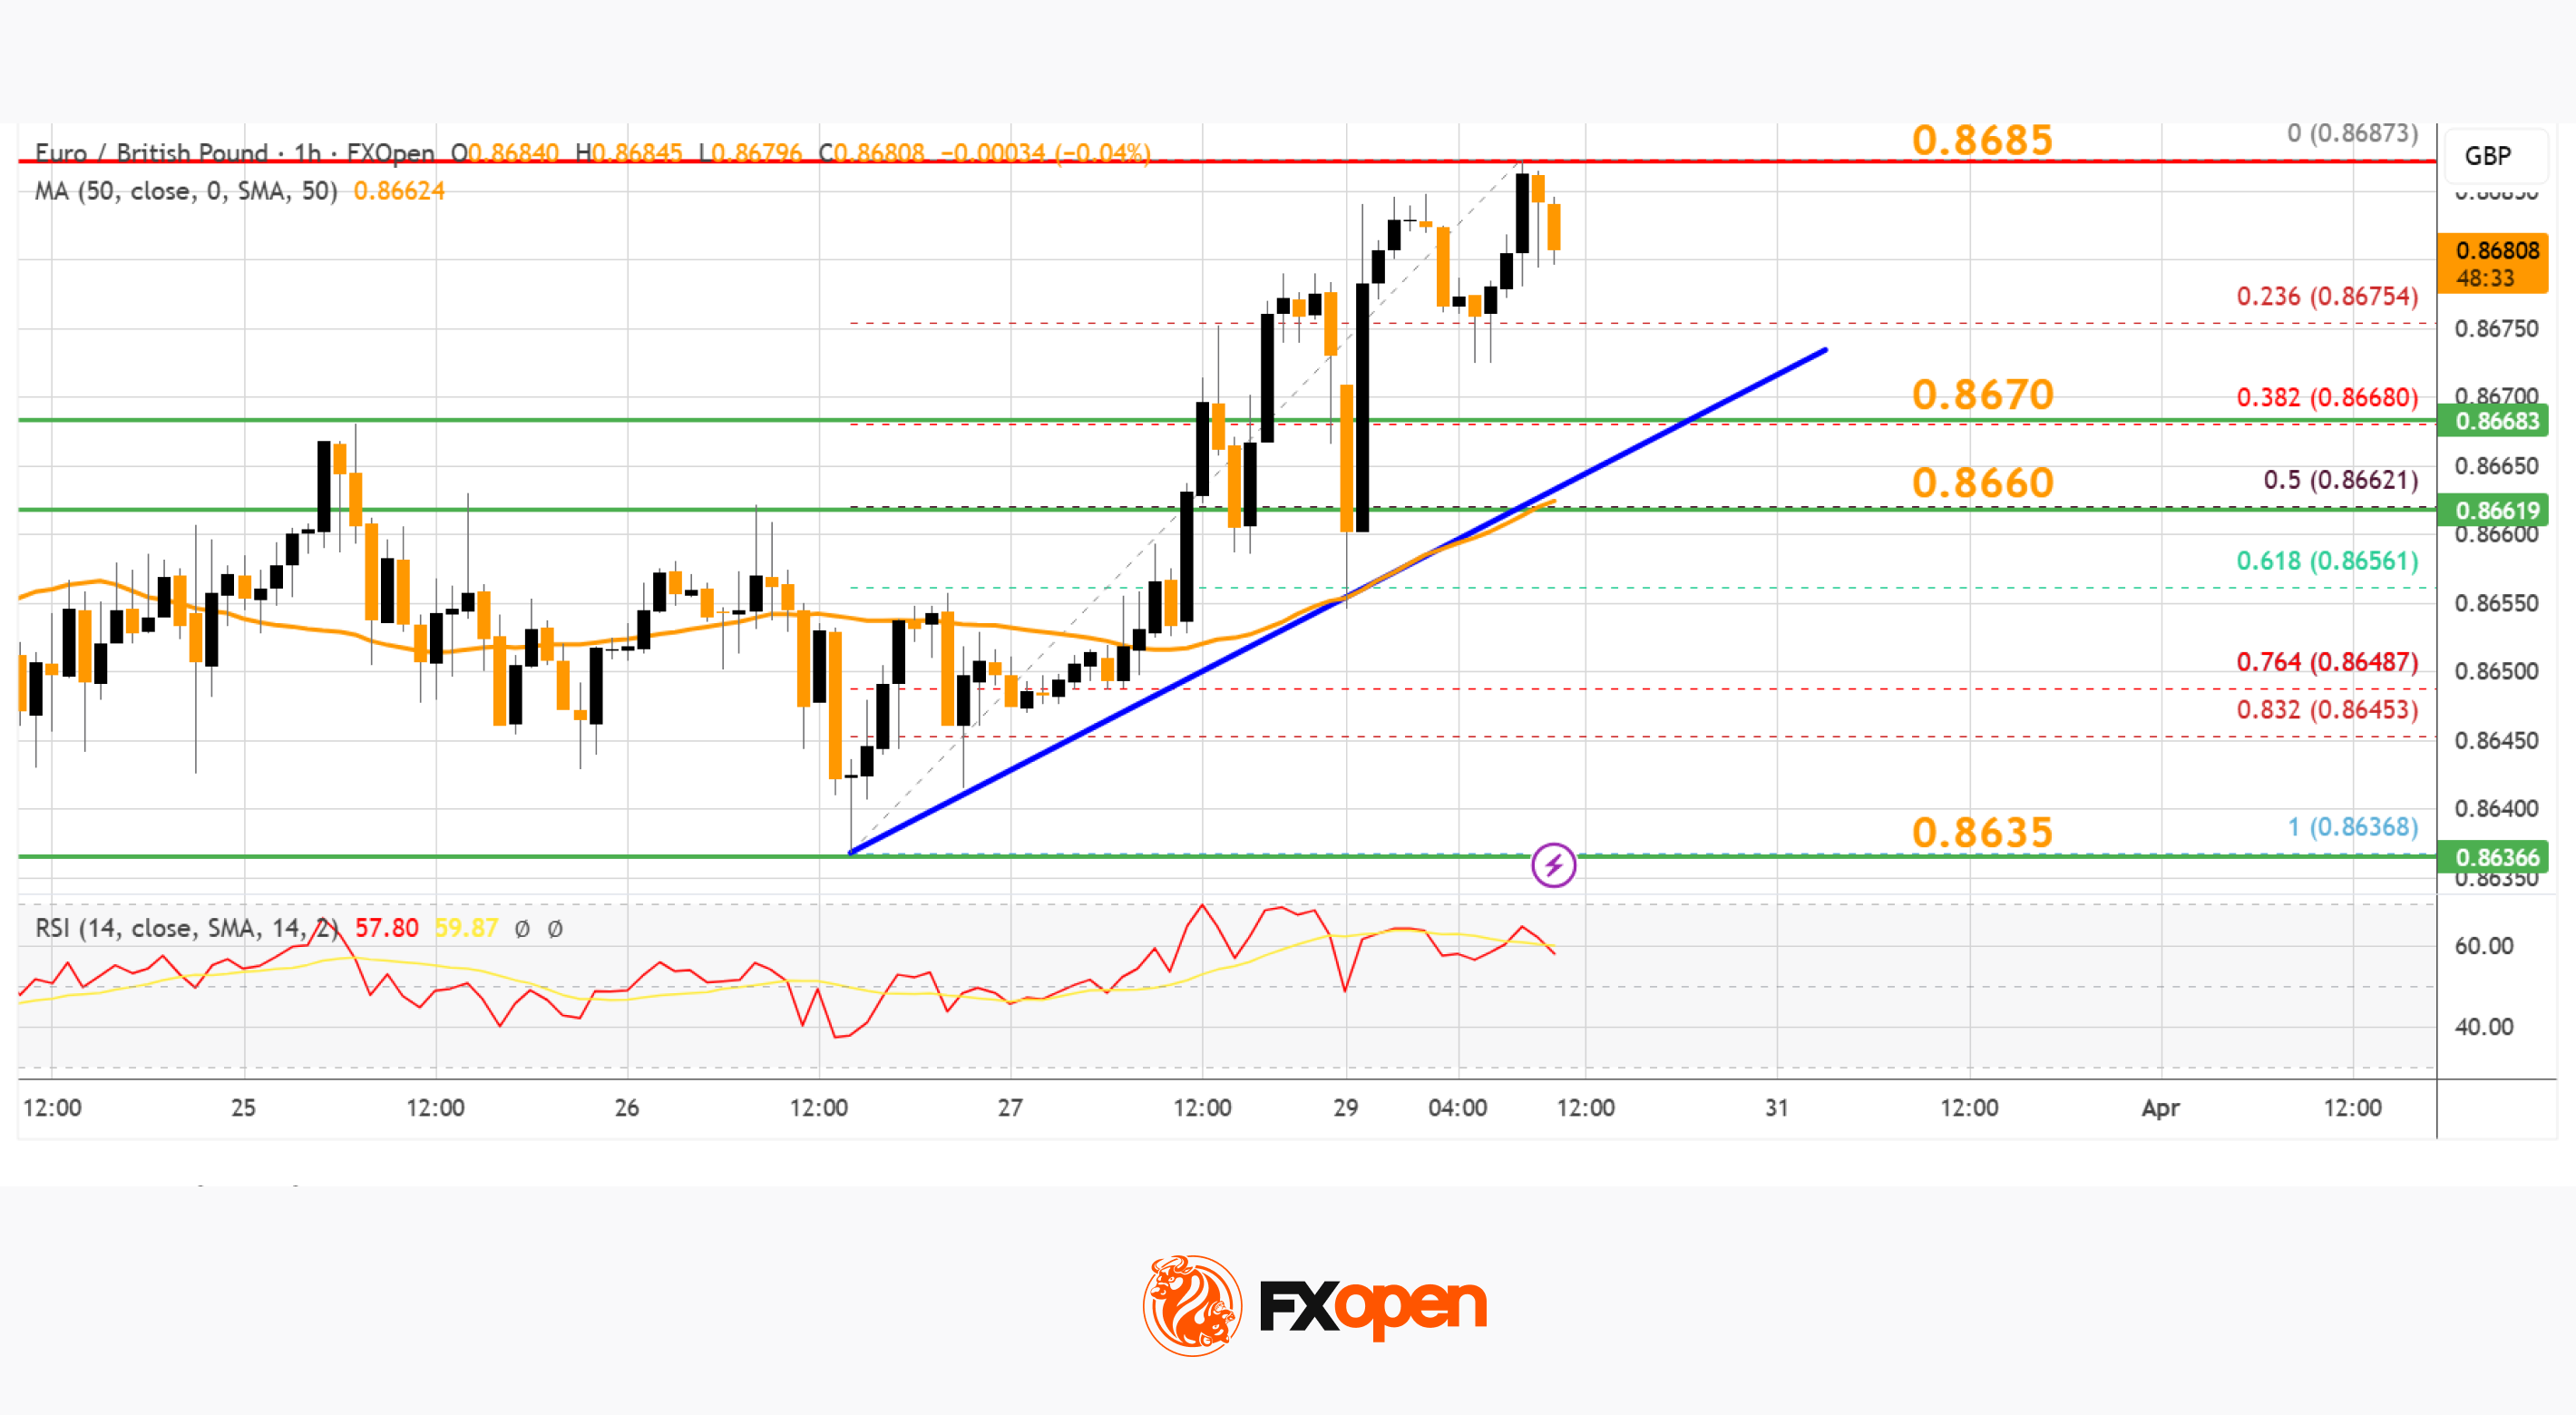
However, the pair is stable above 0.8670. Besides, there is a connecting bullish trend line forming with support at 0.8670.
A downside break below 0.8670 might call for more downsides. In the stated case, the pair could drop toward the 50% Fib retracement level at 0.8660. Any more losses might call for an extended drop toward the 0.8635 pivot zone.
If there is another increase, the EUR/GBP chart suggests that the pair is facing hurdles near 0.8685. A close above 0.8685 might accelerate gains. In the stated case, the bulls may perhaps aim for a test of 0.8700. Any more gains might send the pair to 0.8740.
This article represents the opinion of the Companies operating under the FXOpen brand only. It is not to be construed as an offer, solicitation, or recommendation with respect to products and services provided by the Companies operating under the FXOpen brand, nor is it to be considered financial advice.

Key Highlights
- Starcloud secured $170M in Series A funding at a $1.1 billion valuation, achieving unicorn status in just 17 months post-Y Combinator
- The startup is developing orbital data centers in low Earth orbit to overcome terrestrial energy and space limitations
- Successfully deployed the first Nvidia H100 GPU to space in November 2025 and conducted AI training operations
- Second satellite mission scheduled for October 2026 will include AWS Outposts and deliver 100x greater power capacity
- Competition intensifies as SpaceX and Blue Origin announce comparable orbital infrastructure initiatives, including Musk’s million-satellite proposal
A Redmond, Washington-based startup called Starcloud has successfully closed a $170 million Series A funding round. The investment values the company at $1.1 billion, granting it unicorn status merely 17 months following its presentation at Y Combinator’s demo day.
Benchmark and EQT Ventures co-led the financing round. Additional participants included Macquarie Capital, NFX, Y Combinator, along with notable angel backers such as Dennis Muilenburg, former Boeing chief executive, and Kevin Johnson, who previously led Starbucks.
This latest capital injection elevates Starcloud’s cumulative funding to $200 million. Earlier financing rounds brought in $34 million from backers including Andreessen Horowitz and In-Q-Tel, the venture investment division of the CIA.
Starcloud’s mission centers on establishing data processing facilities in low Earth orbit. The strategy leverages the virtually uninterrupted solar energy available in space, eliminating the land availability and power supply challenges that hamper terrestrial data center development.
Constructing traditional Earth-based data centers typically requires up to five years because of regulatory approvals and energy infrastructure lead times. Starcloud contends that orbital infrastructure sidesteps these obstacles completely.
“We’re witnessing the AI revolution hit the hard limits of terrestrial power infrastructure,” stated CEO Philip Johnston. “Relocating AI computation to orbit grants us access to boundless solar energy and eliminates the power constraint entirely.”
Pioneering GPU Deployment in Orbit
Starcloud deployed its inaugural satellite, Starcloud-1, in November 2025, equipped with an Nvidia H100 processor. According to the company, this marked the first instance of this GPU operating in the space environment. The mission achieved another milestone by completing the first orbital AI model training session and executing a variant of Google’s Gemini model beyond Earth’s atmosphere.
The satellite’s design and construction took only 21 months using a modest $3 million pre-seed budget—a timeline the company characterizes as unprecedented in aerospace development.
Starcloud has already established collaborative agreements with Nvidia, Amazon Web Services, and Google Cloud.
Second Mission Set for October Launch
Starcloud’s follow-up satellite, designated Starcloud-2, is scheduled for deployment in October 2026. This spacecraft will transport AWS Outposts equipment and produce 100 times the power output of its predecessor. The satellite will also debut the largest commercial deployable thermal radiator ever launched into space.
Starcloud-2 represents the company’s first satellite designed to process commercial cloud computing tasks for revenue-generating clients, including initial customer Crusoe.
The fresh capital will fund development of next-generation Starcloud-3 satellites, scale up manufacturing operations, expand the workforce, and lock in future launch service agreements.
Long-term projections call for a constellation comprising 88,000 satellites. The company anticipates orbital data centers will achieve price parity with ground-based alternatives by 2028 or 2029, driven by declining launch expenses.
Starcloud faces emerging competition in this sector. SpaceX, under Elon Musk’s leadership, revealed plans in February 2026 for an orbital data center network featuring one million satellites following the acquisition of his AI venture xAI. Jeff Bezos’ Blue Origin has similarly signaled interest in comparable infrastructure projects.
Johnston indicated that Starcloud is negotiating energy capacity agreements with major cloud service providers, with public announcements anticipated in upcoming months.

Crypto World
BTC price rises as Trump says U.S. in talks with ‘new regime’ in Iran, threatens oil infrastructure if deal fails

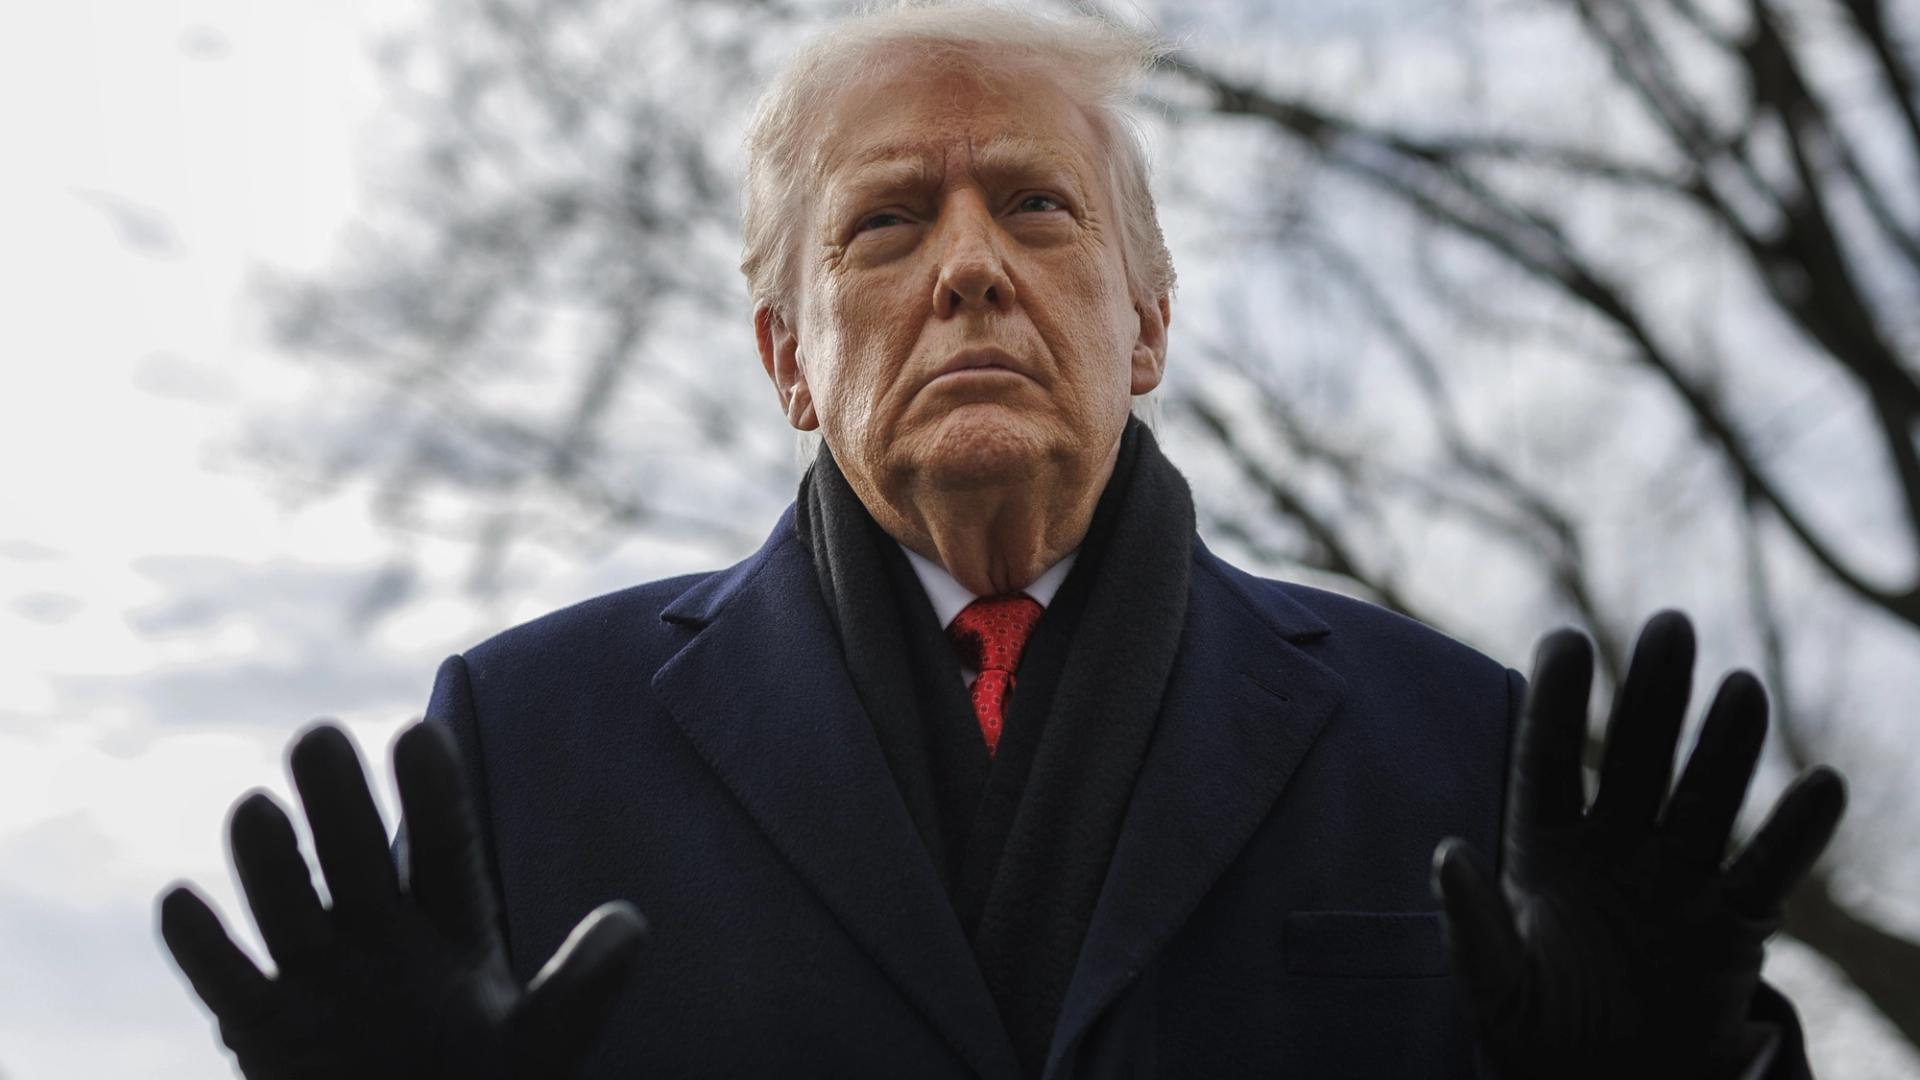
U.S. President Donald Trump said the U.S. is “in serious discussions with a new, and more reasonable, regime” to end military operations in Iran, the first public acknowledgment of a regime change in Tehran since the conflict began five weeks ago.
Using the phrase “new regime” his post on Truth Social suggests the talks involve a leadership structure that was not in place when the war started at the end of February.
In the same post, Trump demanded the Strait of Hormuz be “immediately open for business” and threatened to “blow up and completely obliterate” Iran’s electric generating plants, oil wells and Kharg Island if a deal is not reached shortly. He added that desalination plants were also under consideration.
These are all targets the U.S. deliberately avoided hitting for the duration of the five-week conflict, he said.
The combination of a potential ceasefire with a new government and the most explicit threat to civilian and energy infrastructure yet makes this a two-sided headline that the market will struggle to price cleanly.
One the one hand, talks are taking place with a new regime and “great progress” has been made. On the other, the president just publicly listed every piece of critical infrastructure he’s prepared to destroy if those talks fail while saying such action would “conclude our lovely ‘stay’ in Iran.”
Bitcoin jumped above $67,600 on the news, taking its 24-hour gain to 1.3%. Ether (ETH) outperformed, up 3.1% to $2,070, solana (SOL) rose 1.9% to $84.09 and XRP added 1.0% to $1.35. The weekly picture is still uniformly red — with BTC down 1.3%, XRP 1.2%, SOL 2.2%. Tron continues to outperform, up 1.3% in 24 hours and 5.3% on the week.
The bounce squeezed a lot of shorts on the way up. CoinGlass data shows $9.32 million in short liquidations in the last hour alone against just $207,000 in longs.
Traders took on $340 million in liquidations over a 24-hour window, absorbing the bulk at $242.25 million from the overnight flush before the Trump post landed. The largest single order was a $9.8 million BTCUSD liquidation on Bybit.
Crypto World
Solana price confirms bearish flag pattern as ETFs break 6-week inflow streak, will it crash?

Solana price fell 13% over the past week after confirming a bearish pattern on the charts. Will it experience a steeper decline ahead as institutional investors seem to be backing away from the asset?
Summary
- Solana price dropped over 13% in a week after confirming a bearish flag pattern, signaling potential continuation of the downtrend.
- Institutional outflows from Solana ETFs and derivatives-driven liquidations have added to selling pressure, weakening investor sentiment.
- Technical indicators point to further downside risk toward $67, with a break below $80 likely to accelerate losses.
According to data from crypto.news, Solana (SOL) price fell 13.5% from its weekly high of $92.88 to $80.37 earlier on Monday before settling a little above at $84.07 at the time of writing.
Solana price fell as institutional investors began rotating capital away from the token, likely as they explored other options. Data from SoSoValue shows that spot Solana exchange-traded funds recorded $4.24 million in outflows over the past week, breaking a six-week weekly inflow streak that drew in nearly $127 million from the investment products.
While this recent cooling doesn’t necessarily mean that institutional investors will continue to back off from the asset in the weeks ahead, they have certainly spooked retail investors into a cautious state as they await clearer market signals.
Another major reason that has set back the token is the persistent liquidations across crypto derivatives markets. Over the past 24 hours, over $24 million in positions were liquidated from Solana alone, with the majority coming from long liquidations. As these positions were wiped out, the resulting selling pressure further accelerated the decline.
Meanwhile, the ongoing uncertainty around when the war between the U.S. and Iran would come to an end has also fostered a cautious environment for investors who are rotating to gold and other safe-haven assets that have historically protected capital during geopolitical crises.
On the daily chart, Solana price has confirmed a multi-month bearish flag pattern. Such a pattern is formed when an asset drops sharply downwards, forming a flagpole followed by some consolidation forming the flag part of the pattern.
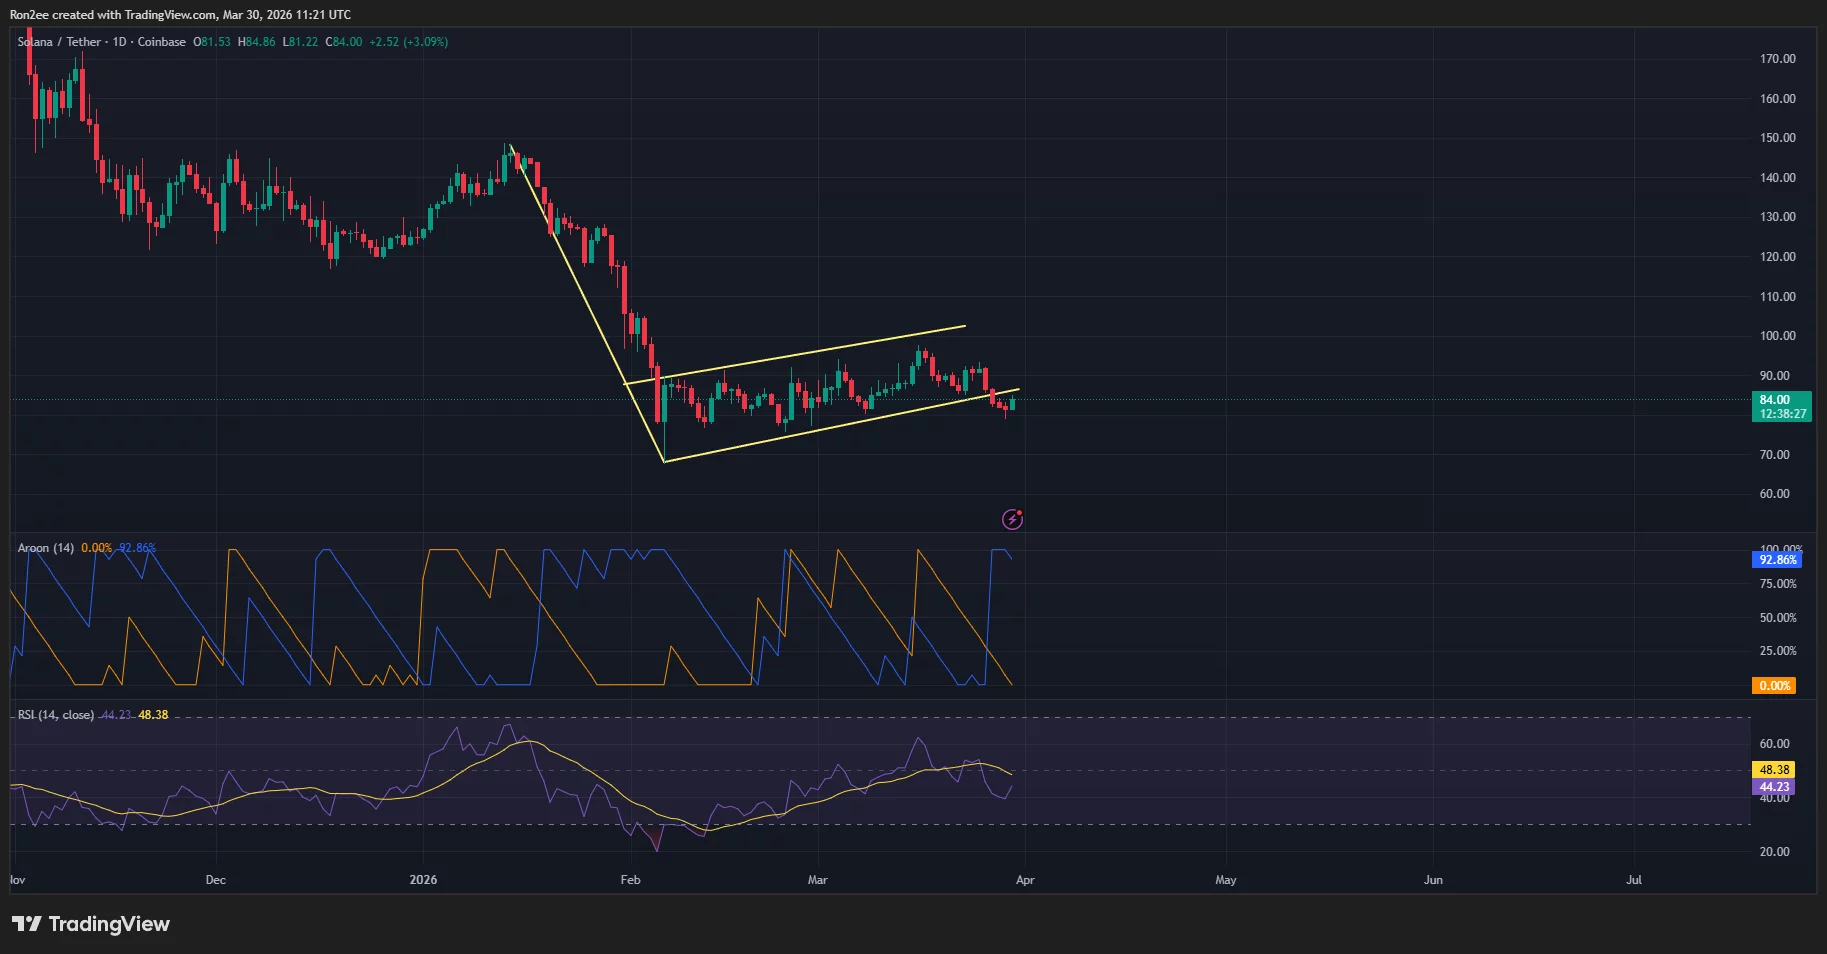
A break from the lower trendline of the pattern confirms the bearish outlook and has often preceded a significant downward move.
Hence, Solana price is likely to visit its year-to-date low of $67.82 reached on Feb. 6. On the bearish side, if Solana price loses the $80 support level, the selloff could intensify quickly.
Technical indicators seem to support this bearish outlook. Notably, the Aroon Down stood at 92.86% while the Aroon Up was at 0%, a sign that the bears are in total control of the trend.
The Relative Strength Index, which shows the RSI at 44 slowly climbing back toward the neutral threshold, suggests that while the immediate panic has subsided, the overall momentum remains weak.
Disclosure: This article does not represent investment advice. The content and materials featured on this page are for educational purposes only.


Prospects of interest rate rises are no longer just the U.S. story. Traders are now betting the Bank of Japan (BoJ) could tighten too as the resource-scarce nation faces inflation risks from the ongoing Iran war.
Traders see a roughly 69% chance of the BoJ raising its benchmark borrowing cost at the April 28 meeting, according to data tracked by Bloomberg. Action in options tied to U.S. interest rates shows traders expect the Fed to raise borrowing costs in the coming weeks.
BoJ’s policy meeting summary released Monday showed one member calling for a bigger rate hike in response to the conflict in the Middle East and its inflationary impact on Japanese society. Comments also noted that any move would factor in incoming economic data and anecdotal signals from the market.
The Fed’s tightening is a well-known headwind for risk assets, including bitcoin. The Bank of Japan can be just as impactful. Years of ultra-low rates encouraged traders to borrow in yen and invest in higher-yielding markets (the so-called carry trade), keeping borrowing costs suppressed globally and greasing rallies in risk assets.
So, a shift toward tighter policy in Tokyo could reverse these flows, sending ripples across markets and potentially deepening the crypto bear market. The BoJ has already raised its interest rate to 0.75% from -0.1% over the past two years while simultaneously ending its massive asset purchase program. Yet, rates in Japan remain significantly lower than the 3.5% seen in the U.S.
The bank, therefore, has plenty of room to hike if the Iran crisis worsens, potentially driving higher energy prices and imported inflation in Japan and other oil-dependent countries.
Easier said than done
Hiking rates, however, will be a challenging task given Japan’s strained fiscal situation. The country’s debt-to-GDP ratio stands at a staggering 240%, meaning higher rates could sharply increase borrowing costs and strain government finances.
Economists have said that Japan is caught between a rock and a hard place. If it hikes rates and allows government bond yields to rise, it could put Japan’s debt sustainability at risk. If it keeps rates low, the yen will likely depreciate significantly, adding to inflation concerns.
Strains are already evident in the FX market. The Japanese yen continues to weaken and is currently just around 160 per U.S. dollar, its weakest level since mid-2024. The JPY has depreciated by 54% since 2021.


South Korea’s Naver Financial has delayed plans for its share swap with crypto exchange Upbit’s parent firm Dunamu.
Summary
- Naver Financial has delayed its share swap with Dunamu by nearly three months, with a shareholder vote set for Aug. 18 and completion now expected on Sept. 30.
- The deal remains subject to regulatory approvals and could face further delays or cancellation, with South Korea’s Digital Asset Basic Act also likely to influence the timeline.
According to a regulatory filing with the country’s Financial Supervisory Service, Naver said it will hold a shareholder vote on Aug. 18, following which it will complete the transaction on Sept. 30.
With the new timeline, the deal has now been delayed by nearly three months from earlier target dates of late May or early June.
While the company did not disclose the reason behind the delay, it said the deal remains subject to multiple regulatory approvals tied to changes in major shareholding and business combination review. It added that the transaction could be subject to further delays or cancellation depending upon how the approval process unfolds.
The deal may also be impacted by South Korea’s proposed Digital Asset Basic Act, which is expected to be implemented in the first half of 2026.
The planned legislation is the second phase of the country’s crypto regulatory framework and is set to expand beyond the current user protection regime to put in place a broader rulebook for the digital asset sector.
In the meantime, Dunamu has reported weaker operating performance, with its revenue and profit both falling in 2025 as market activity across the crypto market has slowed.
Per its annual filing, the company posted a 10% year-on-year decline in revenue, while its operating profit fell 26.7% and its net profit fell 27.9%.
Naver Financial first disclosed plans to acquire Dunamu last year, with local media reporting at the time that the company was preparing a share swap to bring the Upbit operator under its umbrella. The deal was subsequently confirmed in November as a roughly $10.3 billion all stock deal.
Around the same time, the company also announced plans to launch a stablecoin wallet service in collaboration with blockchain investment firm Hashed and the Busan digital exchange. As previously reported by crypto.news, the companies plan to develop a wallet named “Silk Pocket.”
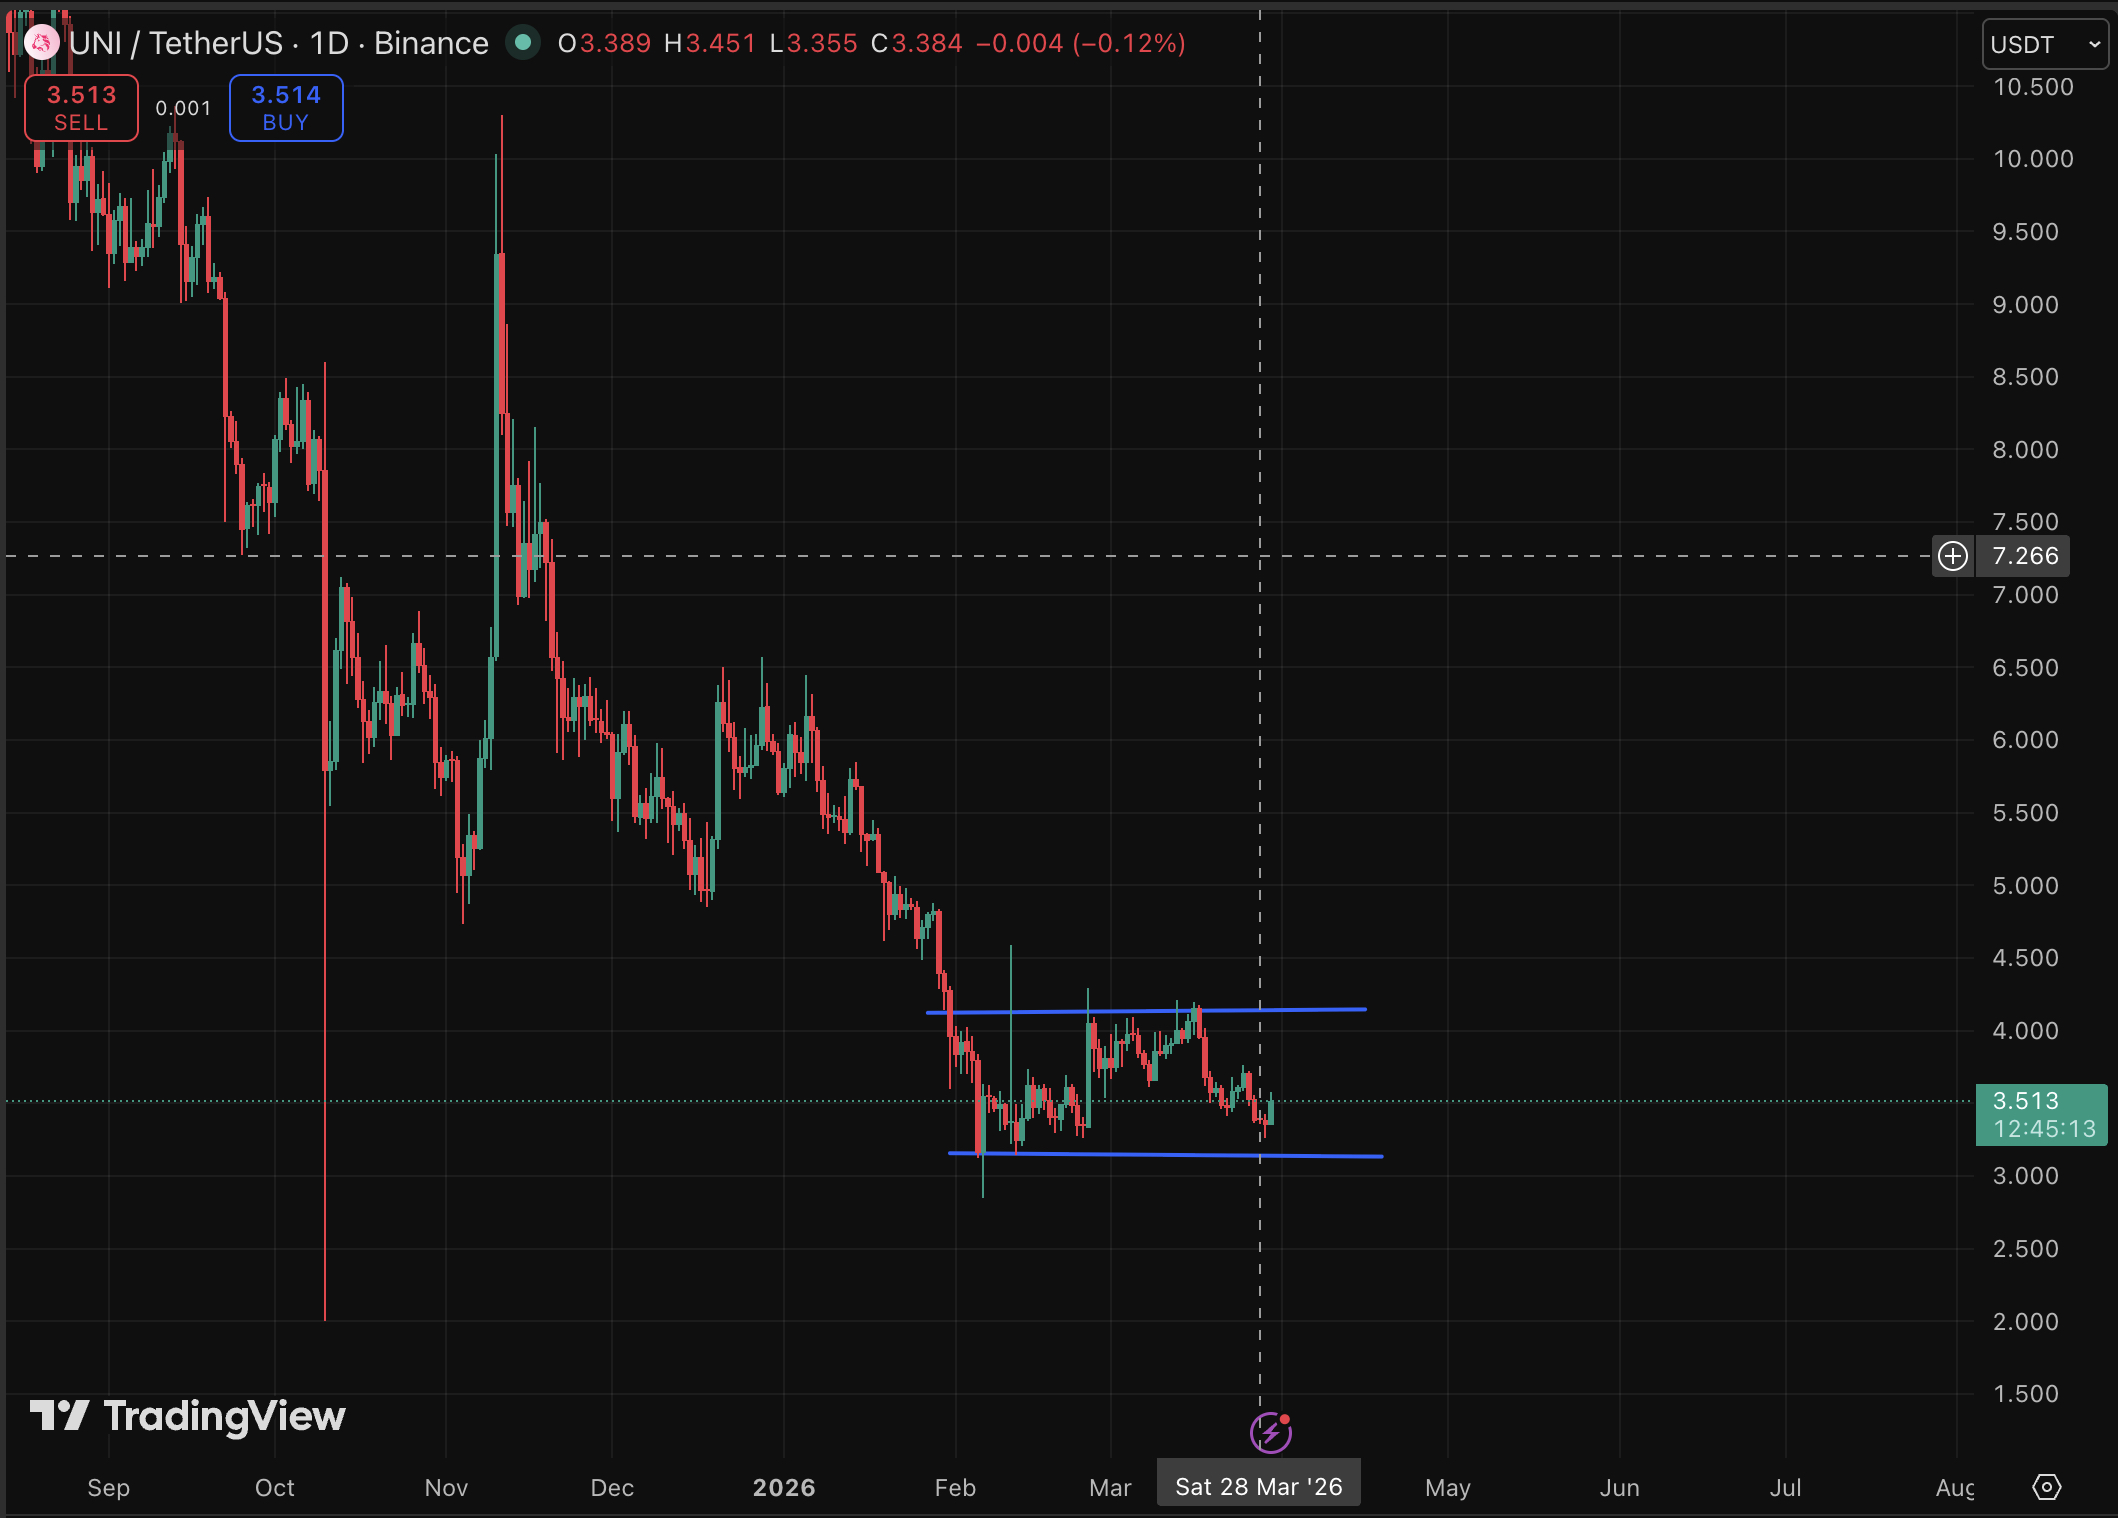
Uniswap’s governance token is holding on and looking good. UNI crypto is now priced at $3.50, with a healthy 4.5% intraday gain. However, the real story is structural, with centralized exchanges clawing back relevance in a recovering market, and UNI sits at a critical technical junction that will define its next $1 move in either direction.
The CEX versus DEX debate has sharpened considerably in early 2026. Kraken’s anticipated IPO is positioning the exchange as the compliance gold standard, while Coinbase continues to dominate retail onboarding. Uniswap v4, meanwhile, is competing as a programmable liquidity layer rather than a simple swap venue, a pivot that changes its valuation calculus entirely.
The question now is whether crypto’s recovery provides a second attempt or whether UNI fades further.
Discover: The best crypto to diversify your portfolio with
Can UNI Crypto Price Reclaim $4 Before April?
UNI is consolidating inside a $3.10–$3.95 range, with moving averages stacked in mild bearish alignment. The 7-day SMA sits at $3.71, the 20-day at $3.83, and the 50-day at $3.68, all above the current price.
An analyst, Tony Kim, set a slightly more aggressive target earlier this month: “Potential move toward $4.22 resistance if current support levels hold through March.”

In a bull scenario, daily volume breaks above $5.2M, RSI pushes past 53, and UNI reclaims the $3.7 50-day SMA, opening a run toward $4.15.
However, the bear can argue that there could be an invalidation. A close below $3.3 flips short-term structure negative, potentially dragging price toward the $3.25 weekly low f
Discover: The best pre-launch token sales
LiquidChain Targets Early-Mover Upside as Uniswap Tests Key Levels
UNI at $3.50 offers a known asset at compressed valuation, but with the 200-day SMA at $5.85 as a realistic ceiling, the upside math is bounded. Early-stage infrastructure presales offer a different risk profile entirely.
LiquidChain is positioning itself as a Layer 3 cross-chain liquidity layer, fusing Bitcoin, Ethereum, and Solana liquidity into a single execution environment, a direct infrastructure play on the fragmentation problem that makes multi-chain trading expensive and slow.
A new layer emerges. Only a few see it first. — LiquidChain (@getliquidchain) March 24, 2026
The future is LiquidChain  ⟁https://t.co/vqvBcdSj94 pic.twitter.com/R7ZeZ0NPGl
The project’s Unified Liquidity Layer and Deploy-Once Architecture mean developers write once and access all three ecosystems simultaneously, reducing the bridging friction that has historically hemorrhaged value from DEX traders.
The presale is currently priced at $0.0144, with more than $600K raised to date. Liquid also offers a huge 1700% APY as staking rewards, and launched with a Certik audited contract.
This article is not financial advice. Crypto assets are highly volatile. Always conduct your own research before investing.
The post UNI Crypto Prediction: CEX Resurfaced as Crypto Recovers appeared first on Cryptonews.
Crypto World
Advanced Micro Devices (AMD) Stock: Aletheia Capital Projects 63% Rally on AI Infrastructure Boom

Key Highlights
- Aletheia Capital maintains Buy recommendation on AMD with $330 price objective
- Server CPU revenues expected to expand at 45% CAGR through 2028
- Data center business projected to surge from $17B in 2025 to $77B by 2028
- Company has evolved into comprehensive AI compute solutions provider
- CEO Lisa Su joins Trump administration’s science and technology advisory council
Advanced Micro Devices ($AMD) continues to attract bullish sentiment from Wall Street analysts, with Aletheia Capital maintaining its Buy recommendation and establishing a $330 price objective for the chipmaker. Trading at $201.99, the stock presents substantial appreciation potential based on the firm’s analysis.
Advanced Micro Devices, Inc., AMD
The investment case from Aletheia focuses heavily on AMD’s positioning within the emerging agentic AI landscape. The research firm contends that central processing units — rather than solely graphics processing units — represent the optimal semiconductor architecture for agent-based computational tasks, positioning AMD favorably to capitalize on this shift.
Aletheia’s financial projections anticipate AMD’s server CPU business will achieve a remarkable 45% compound annual growth rate spanning 2025 through 2028. This aggressive expansion forecast forms the foundation of the firm’s optimistic outlook.
Regarding data center operations, the analyst firm forecasts revenue climbing from $17 billion in 2025 to $58 billion by 2027, ultimately reaching $77 billion in 2028. This trajectory represents approximately 4.5-fold growth over a three-year period.
Aletheia employed a sum-of-the-parts methodology to derive its $330 valuation. For comparison, InvestingPro’s Fair Value analysis places AMD at $225.24, which still exceeds current trading levels.
The company delivered 34% revenue growth over the trailing twelve months. This performance validates the thesis that AMD is capturing increased market share within the AI computing sector.
Aletheia’s perspective on AMD has broadened beyond viewing the company as merely an alternative GPU supplier. The firm now characterizes AMD as a “comprehensive AI compute provider” — terminology that underscores the company’s strategic transformation.
However, the firm acknowledged several risk factors including end market demand volatility, execution challenges, and geopolitical uncertainties. These considerations carry significant weight given current macroeconomic conditions.
Wall Street Consensus Strengthens
Wolfe Research similarly maintains an Outperform stance on AMD with a $300 price objective. The firm emphasized AMD’s conviction in its AI accelerator development timeline and sustained server market traction.
Seaport analyst Jonathan Golub observed that semiconductor sector valuations, including AMD’s multiple, have contracted since July. He interprets this compression as creating attractive entry opportunities.
Corporate Updates and Strategic Moves
AMD and Celestica unveiled the Helios rack-scale AI platform designed for data center infrastructure applications. This collaboration capitalizes on Celestica’s engineering and production expertise.
The company also finalized a multi-year licensing arrangement with Adeia Inc. This agreement provides AMD access to Adeia’s semiconductor intellectual property library while settling all pending legal disputes between the parties.
CEO Lisa Su secured an appointment to President Trump’s Council of Advisors on Science and Technology. This role positions her among influential leaders guiding U.S. technology and scientific policy direction.
AMD communicated concerns regarding its client computing and gaming divisions due to escalating memory component costs. These segments have demonstrated weaker performance relative to the robust data center business.
InvestingPro designates AMD as a “prominent player in the Semiconductors & Semiconductor Equipment industry.” The stock declined 0.87% during the trading session at time of publication.

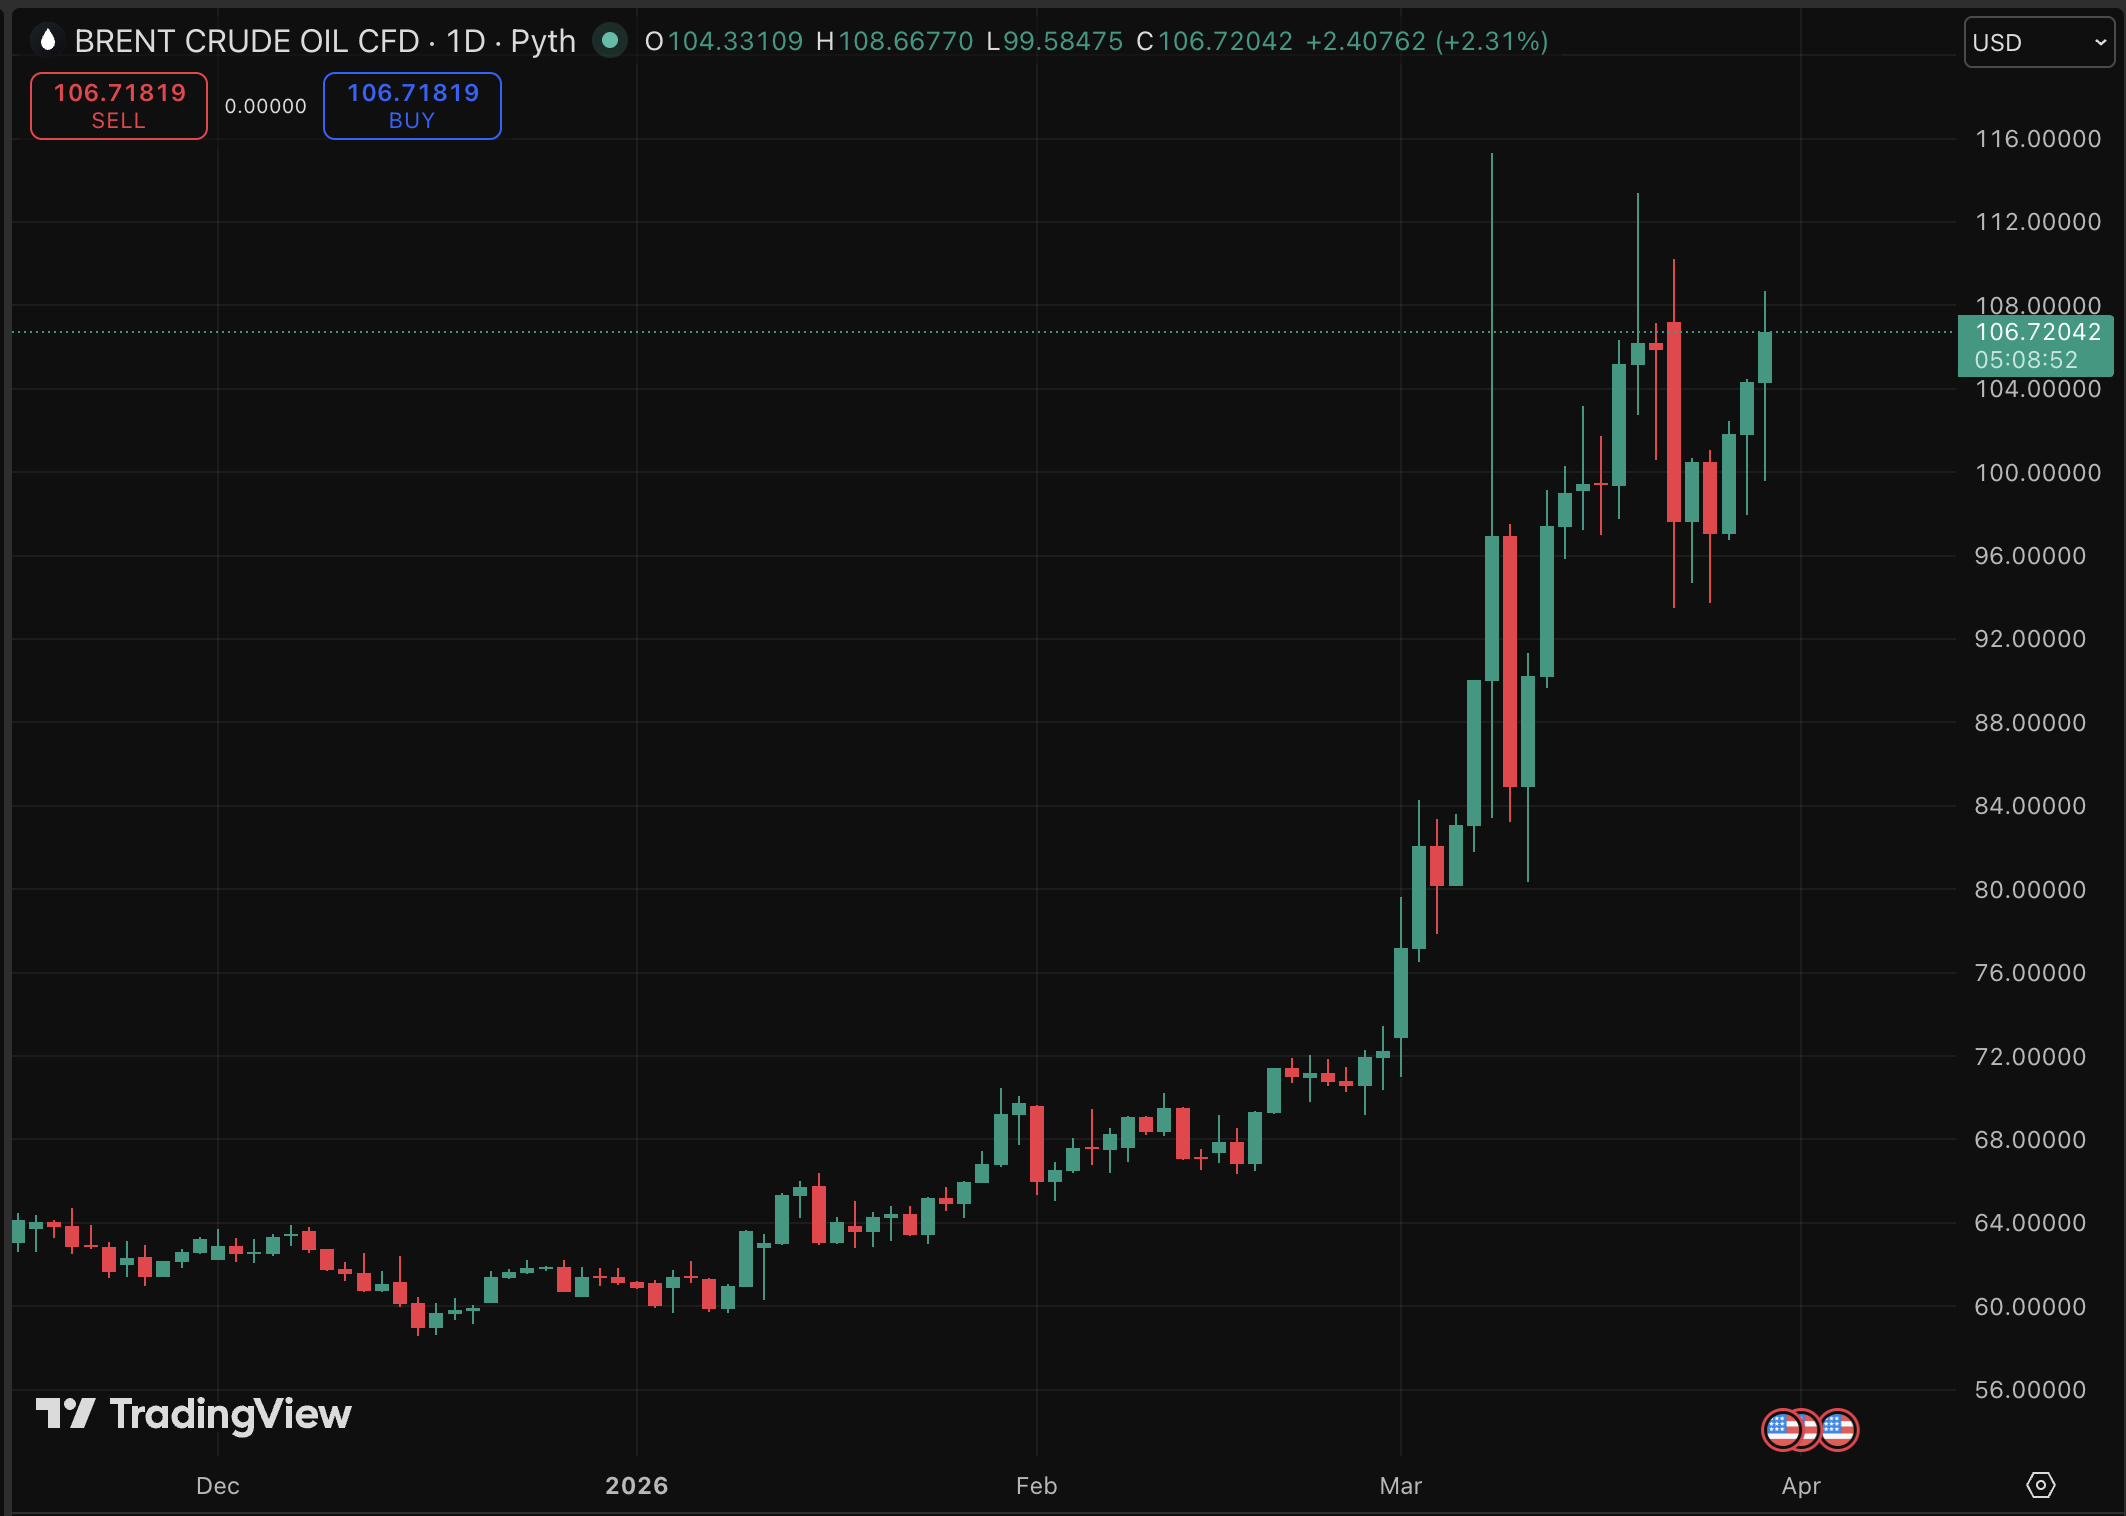
Brent crude oil just posted its biggest monthly price gain on record, 51% since the opening day of the month, and crypto traders are watching both the oil chart and their crypto positions simultaneously before making any prediction.
Bitcoin rebounded 2% intraday to $67,000 even as oil shockwaves rattled equities, raising a question active traders are increasingly asking: is the real opportunity in oil, crypto, or something built on top of both narratives? The answer depends heavily on what happens in the Strait of Hormuz over the next 72 hours.
Brent closed Friday at $112.57 per barrel, up from $72.48 on February 27, the day before the US-Israeli strike on Iran, and briefly tagged $119.50 intraday, its highest since June 2022. BloombergNEF estimates 9 million barrels per day have been knocked offline by the conflict, with Iran all but closing the Strait of Hormuz, through which roughly one-fifth of global oil and gas normally flows.
A coordinated 400-million-barrel emergency reserve release on March 11 barely dented the rally. Trump’s 10-day ultimatum to Iran to reopen the strait was met by a rising oil price and falling stock markets, not exactly the negotiating leverage the White House projected.
Total crypto market capitalization has reached $2.4 trillion despite the macro turbulence, suggesting digital assets are absorbing the geopolitical shock. The macro correlation between Treasury yields, risk assets, and crypto is tightening, and oil is now the single most consequential variable in that equation.
Discover: The best crypto to diversify your portfolio with
Oil Price Prediction: Will Oil Blast Pass $200?
WTI crude surged above $110 per barrel on March 9 and has held elevated since, with 10-year futures still pricing around $57 per barrel, a signal that markets expect eventual normalization but have no timeline for it.
Bitcoin is currently trading in a defined $62,000–$73,000 channel. Resistance sits at $73,000, tested and rejected recently; support is intact at $62,000. The brief touch of $74,000 before the pullback signals buyers are present at highs, but conviction is thin.
Rising import prices, up 1.3% in February, combined with oil above $110, are the inputs feeding that rate-hike probability. Watch Tuesday’s API Crude Oil Stocks and ADP Employment data as the next directional catalysts.
Once the Strait of Hormuz opens for business, oil will likely start to normalize. Is this the time to long oil? The answer lies more in geopolitics right now, not much in chart structure.
Discover: The best pre-launch token sales
Bitcoin Hyper is Targeting A movement Similar to Oil
BTC at $67,000 inside a known range is a respectable position, but at this market cap, the asymmetric upside that early crypto cycles delivered is structurally compressed.
The Iran deadline extension is already weighing on risk assets, and spot BTC traders are essentially betting on a macro resolution they cannot control. For traders hunting for leverage on the Bitcoin ecosystem without the channel ceiling, the infrastructure layer is where some rotation is happening.
Bitcoin Hyper ($HYPER) is positioning as the first Bitcoin Layer 2 with Solana Virtual Machine (SVM) integration, combining Bitcoin’s security model with sub-Solana-speed execution and low-cost smart contracts.
The presale has raised $32 million at a current price of just $0.0136, with 36% staking rewards live for early participants. The core pitch: Bitcoin’s programmability problem (slow transactions, high fees, no native smart contracts) gets a direct fix, while the security layer stays intact.
Research Bitcoin Hyper before the presale window closes.
This article is not financial advice. Crypto assets are highly volatile. Do your own research before investing.
The post Oil Price Prediction: Trading Oil With Crypto? Is It Time to Long Oil? appeared first on Cryptonews.
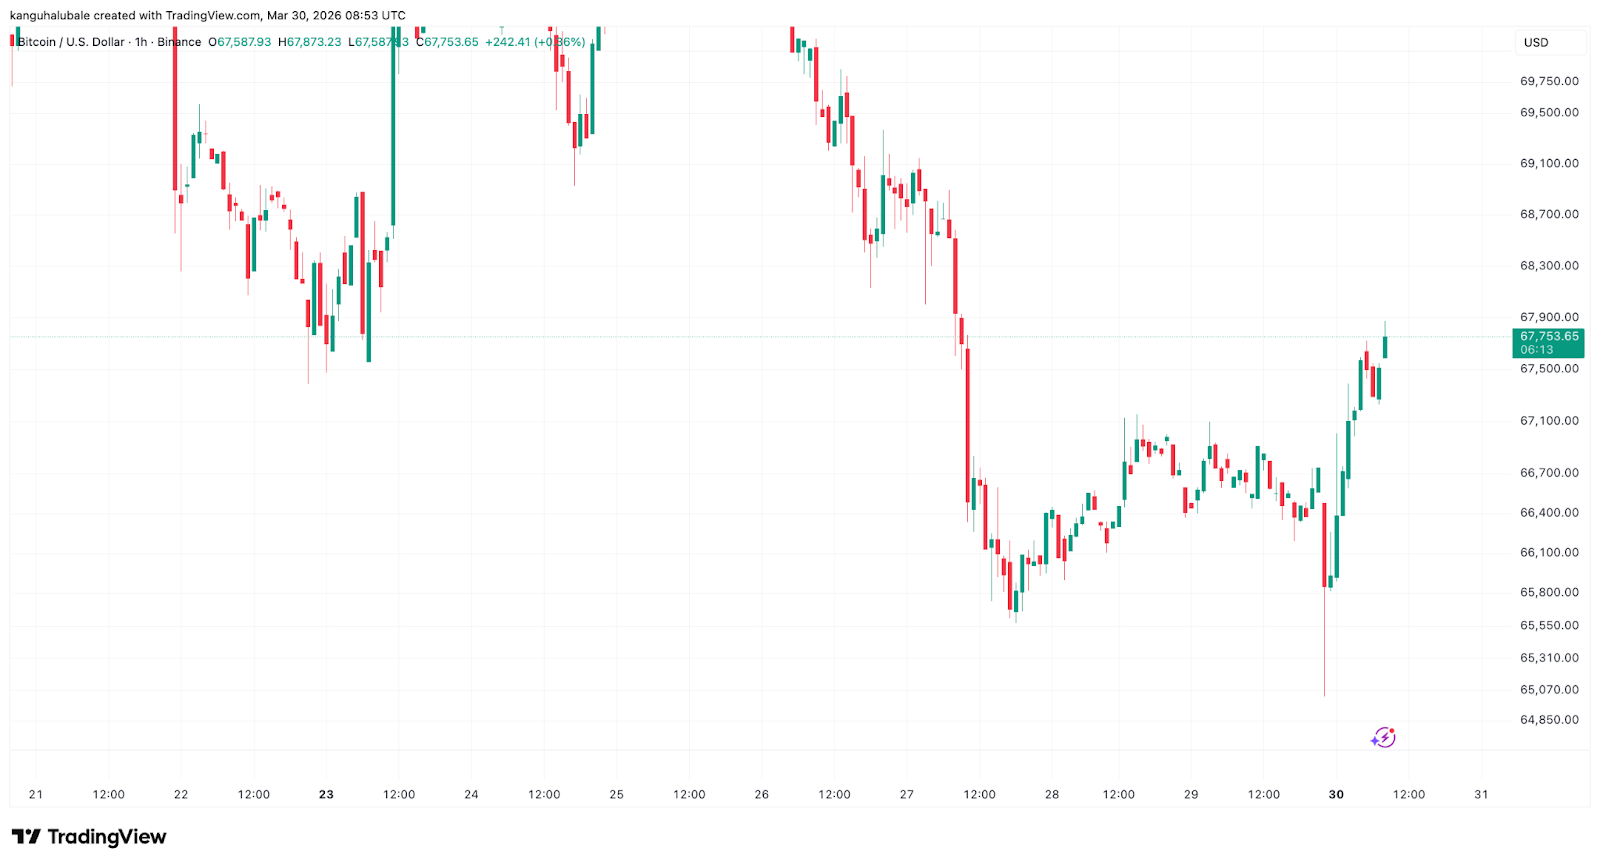
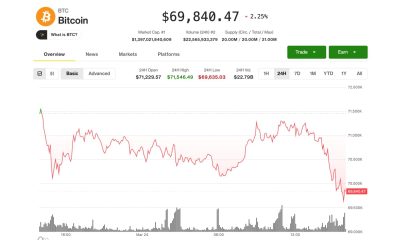
Bitcoin (BTC) buyers made a tepid comeback on Monday, pushing BTC price to its intraday high of $67,860. Analysts said that Bitcoin remains in a bear market, with several metrics pointing to a potential bottom below $50,000.
Key takeaways:
-
Bitcoin price turns $70,000 into resistance, clearing the path for a deeper correction.
-
Bitcoin’s short-term holder realized price bands moved lower, with a potential bottom around $46,000.
-
Historical retracement levels and a bear flag breakdown point to $39,000–$41,000 as the final low for BTC price this cycle.
Bitcoin’s “path of least resistance” is downward
Data from TradingView captured ongoing BTC price gains, up 1.5% on the day to trade at $67,750, as $69,000-$70,000 became new resistance.

Analyzing Bitcoin’s price action on lower time frames, Telegram trading resource Technical Crypto Analyst said losing the $68,000-$69,000 support “confirms short-term bearish momentum,” adding:
“Unless price quickly reclaims $69K–$70K, the path of least resistance remains downward toward the $65K demand zone.”
Related: Worst six months since 2018? Five things to know in Bitcoin this week
“Great bounce upwards, but nothing confirmed as of yet on Bitcoin,” MN Capital founder Michael van de Poppe said in a Monday post on X.
It “all depends on macroeconomic events; however, I’d rather see a breakout above $71K for confirmation,” he added.
“On the other hand, a classic little sweep to $65K just before the push upwards would signal that we’re going to get that momentum.”

Analyst Kyle Chassé said that with the Fear and Greed index still in the “extreme fear zone” and the order books showing more shorts than longs, the market leans “towards more downside.”

Where will the Bitcoin price bottom?
Bitcoin’s 46% drawdown from its $126,000 all-time high has seen the cost basis of short-term holders (STH) — the average price of entities who have held BTC for less than 155 days — drop from $113,500 to $83,200.
“This is a sign that the pricing for a potential bottom has also moved lower,” said CEO and founder at Alphractal Joao Wedson in an X post on Monday.
Similarly, the lower line of the STH realized pricing bands (blue line) has also moved “even lower, which could confirm that Bitcoin may form a bottom around $50K or slightly below,” Wedson added.
The chart below shows that Bitcoin bottomed out just below the lower band of the STH realized price during the 2022 bear market.

Analyst Willy Woo said that the bear market bottom for Bitcoin could be between its realized price, currently at $54,000, and the Cumulative Value-Days Destroyed (CVDD), now at $45,500.
“Old school onchain models suggest a BTC bottom between $46K-54K. ”

The CVDD measures the cumulative value of “Coin Days Destroyed” (long-term holders selling) relative to the market’s age, creating a rising “floor” price during bear markets.
Crypto analyst Crypto Jelle said Bitcoin’s bear market lows have historically formed between the 0.618 and the 0.786 retracement levels, which are at $57,600 and $39,000, respectively.

As Cointelegraph reported, the current “last stages” of the bear market are producing predictions of as low as $41,000, based on a bear flag breakdown.
This article is produced in accordance with Cointelegraph’s Editorial Policy and is intended for informational purposes only. It does not constitute investment advice or recommendations. All investments and trades carry risk; readers are encouraged to conduct independent research before making any decisions. Cointelegraph makes no guarantees regarding the accuracy or completeness of the information presented, including forward-looking statements, and will not be liable for any loss or damage arising from reliance on this content.

Man United’s full five-player injury and withdrawal list as Michael Carrick eyes top two finish

Apple Ireland appears to have broken sanctions on Russia
Scott Mills’ heartbreaking announcement in final BBC show that left him ‘sad and shocked’


-
 NewsBeat5 days ago
Manchester United reach agreement with Casemiro over contract clause amid transfer speculation
-

 News Videos4 days ago
Parliament publishes latest register of MPs’ financial interests
-

 NewsBeat3 days ago
The Story hosts event on Durham’s historic registers
-

 Business4 days ago
Instagram, YouTube Found Responsible for Teen’s Mental Health Struggle in Historic Ruling
-
 NewsBeat5 days ago
Tesco is selling new Cadbury Dairy Milk bar and people can’t wait to try it
-
 Entertainment7 days ago
Cynthia Bailey Dishes on ‘RHOA’ Season 17, Discusses Kandi
-

 Tech7 days ago
Samsung will soon let you control smart home devices from your car’s dashboard
-
 Entertainment2 days ago
Lana Del Rey Celebrates Her Husband’s 51st Birthday In New Post
-

 Fashion6 days ago
Does It Matter What You Wear When You’re Laid Off and Looking?
-
 NewsBeat7 days ago
Colombian military plane with 110 soldiers onboard crashes following takeoff
-

 Business6 days ago
More women enter wealth management, but few in advisory roles: study
-

 NewsBeat6 days ago
Entrepreneurs Forum survey reveals optimism in North East
-

 Politics7 days ago
How Media Platforms Balance Performance and Accessibility in Image Delivery
-
 NewsBeat6 days ago
NASA Artemis II Astronauts enter 14-Day quarantine as moon rocket reaches launchpad
-

 Business6 days ago
Late-paying firms face multimillion-pound fines under new crackdown
-
 Crypto World6 days ago
BTC gives up $70,000 level as markets mull higher interest rates
-

 Sports5 days ago
Fantasy Baseball Week 1 Preview: Top sleeper hitters for both five- and 12-day period led by Munetaka Murakami
-

 Fashion6 days ago
Coffee Break: Korean Skincare Set
-

 Fashion6 days ago
Althea Mink: Patrice Taylor’s Atlanta Couture Brand Built on Legacy, Resilience, and Architectural Glamour
-

 Tech5 days ago
US FCC Prohibits Approval Of New Foreign-Made Consumer Routers
You must be logged in to post a comment Login