

Crypto World
WLFI Price Eyes Another Rally? 3 Distribution Risks Loom

World Liberty Financial price, or the WLFI price, surged nearly 20% over the past 24 hours, triggering optimism across holders. But three separate metrics now reveal hidden risks beneath the surface strength.
Distribution happening across whale cohorts and mid-term holders preparing exits create consolidation pressure that could derail the pattern entirely. Or, is the WLFI price action planning a plot twist here?
Cup Pattern Needs Controlled Consolidation Above $0.105
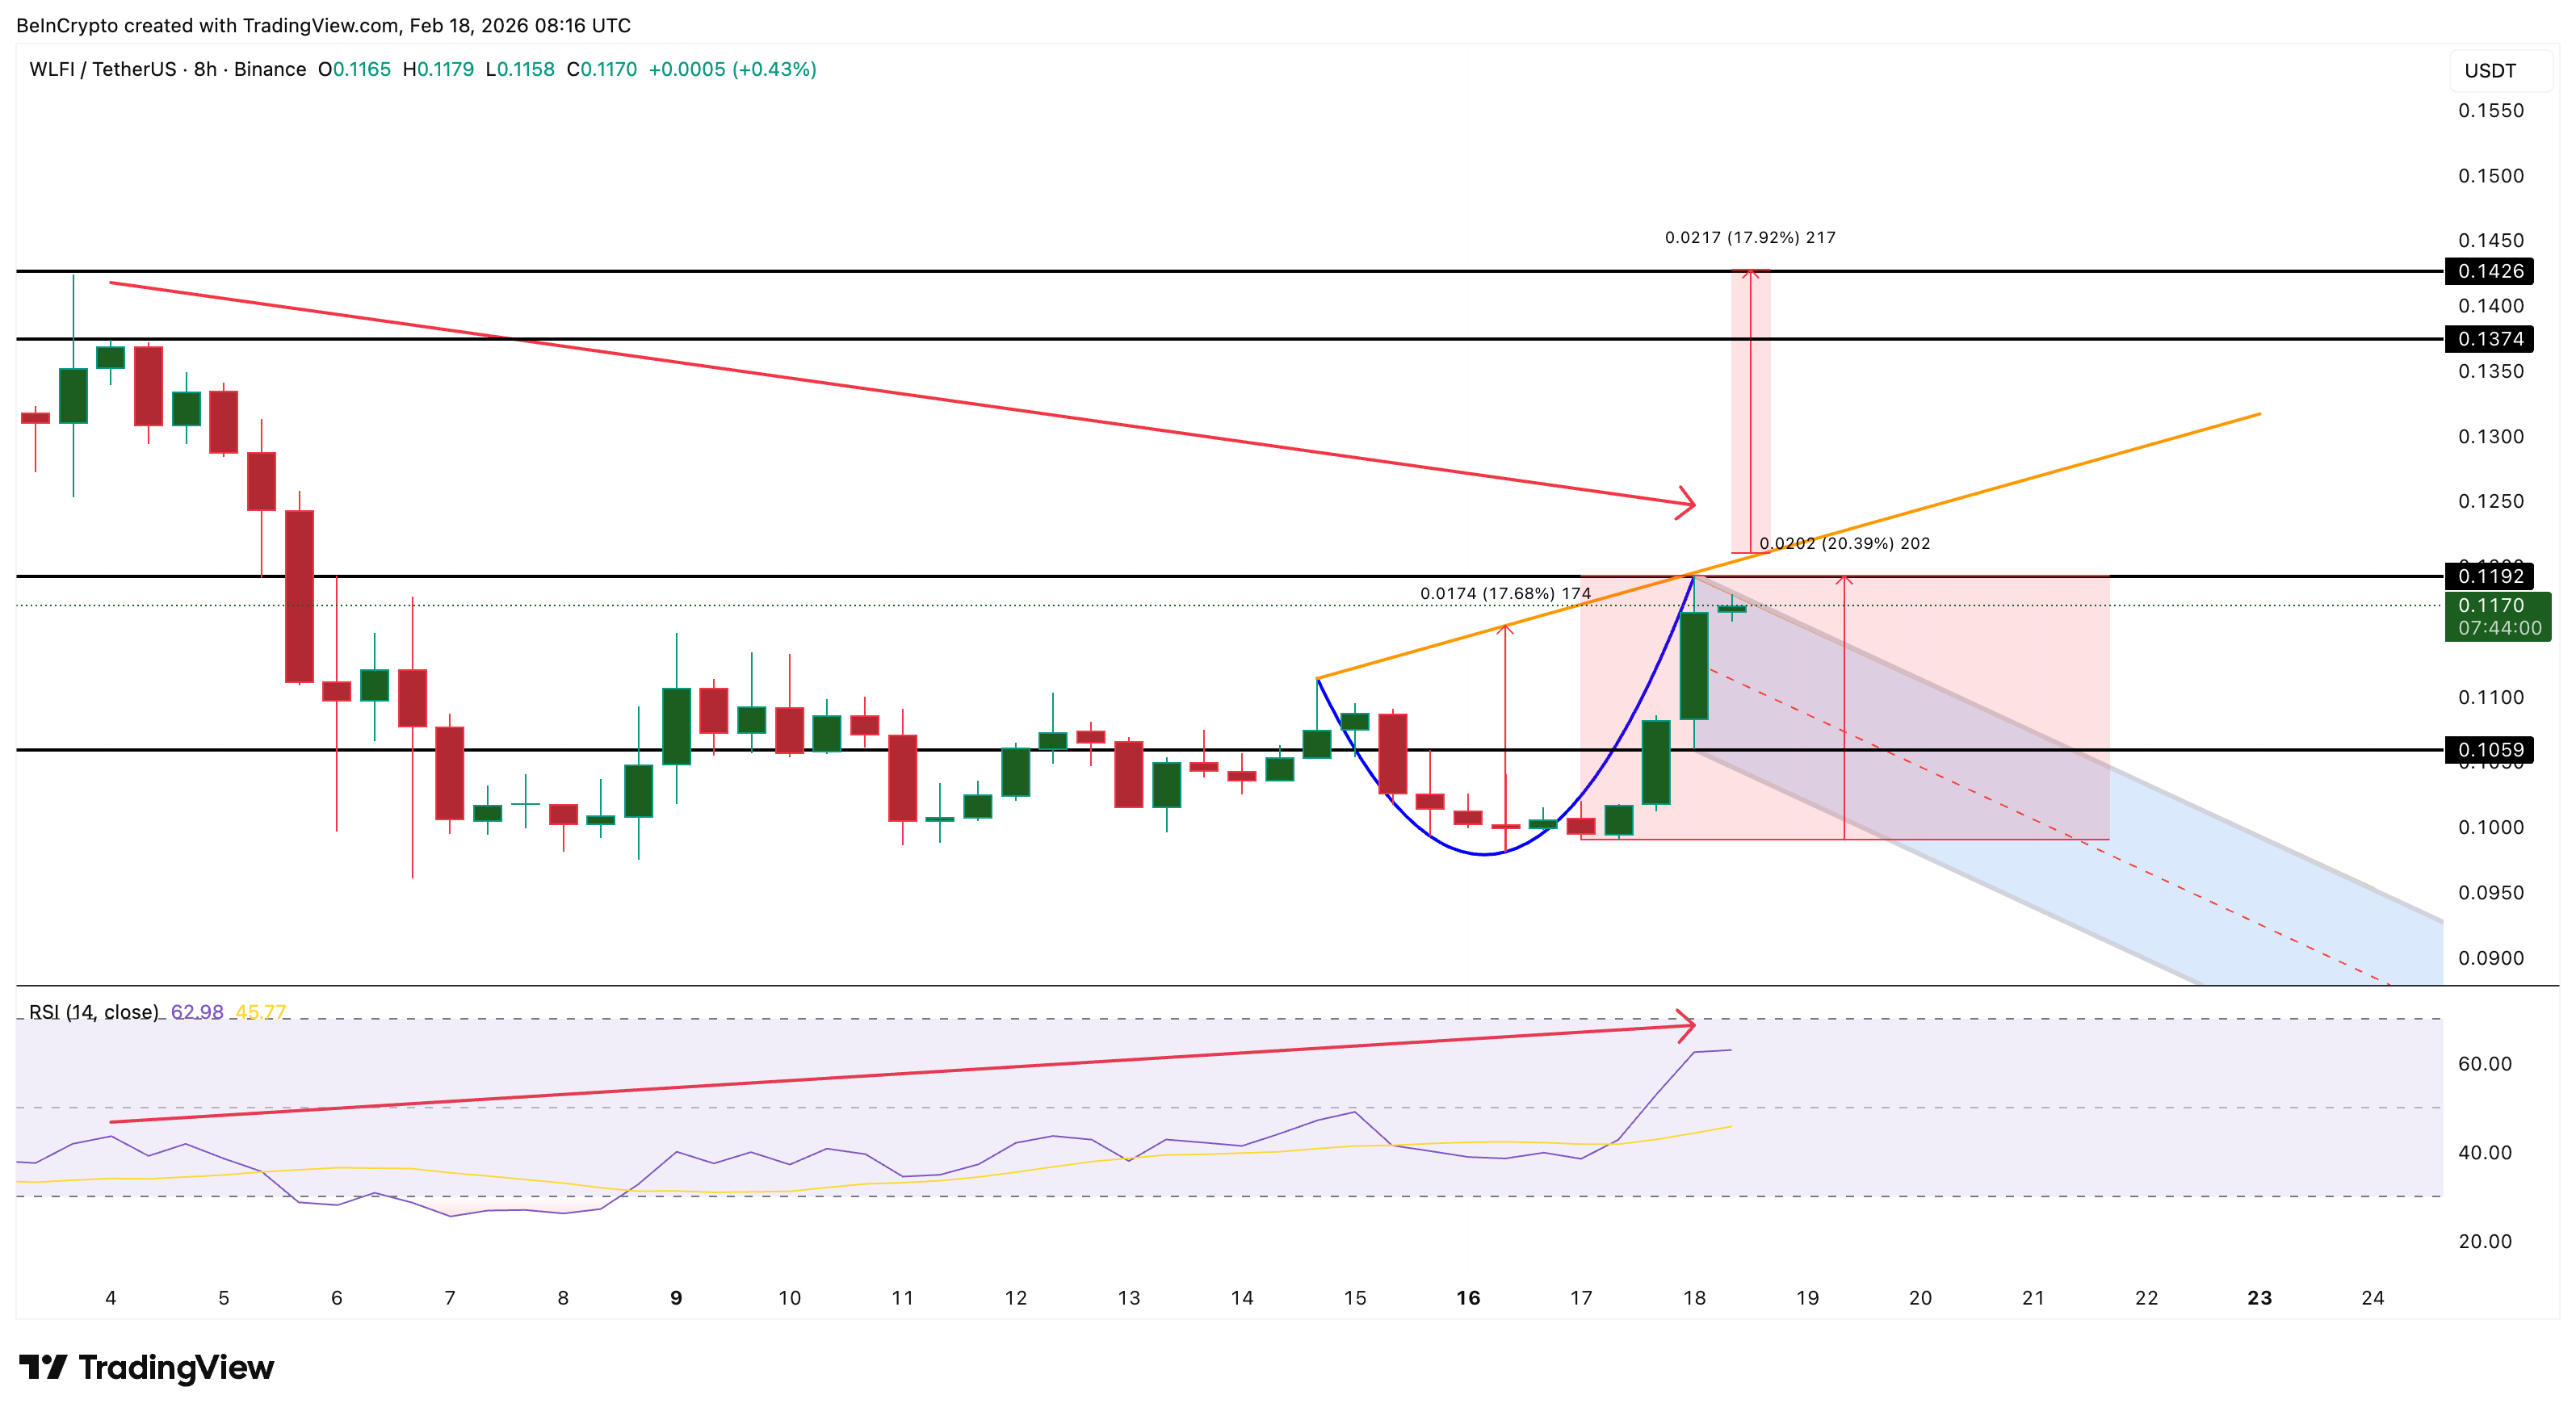
The 8-hour chart shows a rounded bottom structure resembling a cup. The cup itself has already completed, given the recent price recovery. Now WLFI needs to form the handle through controlled consolidation before attempting the next breakout.
Sponsored
Sponsored
The key detail is the upsloping neckline connecting the rim of the cup on both sides. The left rim formed at an earlier high while the right rim sits at a higher level. This upward slope indicates that buyers are willing to pay higher prices over time, creating structural strength. The neckline must be broken upward to complete the pattern and trigger the measured 17% move.
Between February 4 and February 18, a hidden bearish divergence formed on the 8-hour timeframe. WLFI price made a lower high after peaking at $0.119. During that same period, the Relative Strength Index made a higher high. RSI measures momentum strength by comparing the magnitude of recent gains to recent losses.
Want more token insights like this? Sign up for Editor Harsh Notariya’s Daily Crypto Newsletter here.
When price makes lower highs, but RSI makes higher highs, it signals that a pullback could be coming.
The divergence could actually be constructive for the pattern. Cup formations require a handle to complete properly. The handle forms through sideways or slight downward price movement that shakes out weak hands before the next explosive move.
The critical level is $0.105. As long as WLFI consolidates without breaking below this support, the pattern and breakout possibility remain intact. A measured move from the cup’s low to the neckline projects a breakout target of $0.142, representing approximately 17% additional upside from the possible breakout point.
Sponsored
Sponsored
Mega-Whales Sold 1.1 Billion Tokens as Long Positions Diverged
While new whale cohorts accumulated approximately 25 million WLFI tokens during the past 24 hours, the largest holders moved in the opposite direction.
Mega-whale addresses holding more than 1 billion tokens have been steadily reducing their positions since February 6. On February 17, during the price rally, they dropped holdings dramatically from 9.45 billion to 8.35 billion WLFI. That represents 1.1 billion tokens sold directly into the strength.
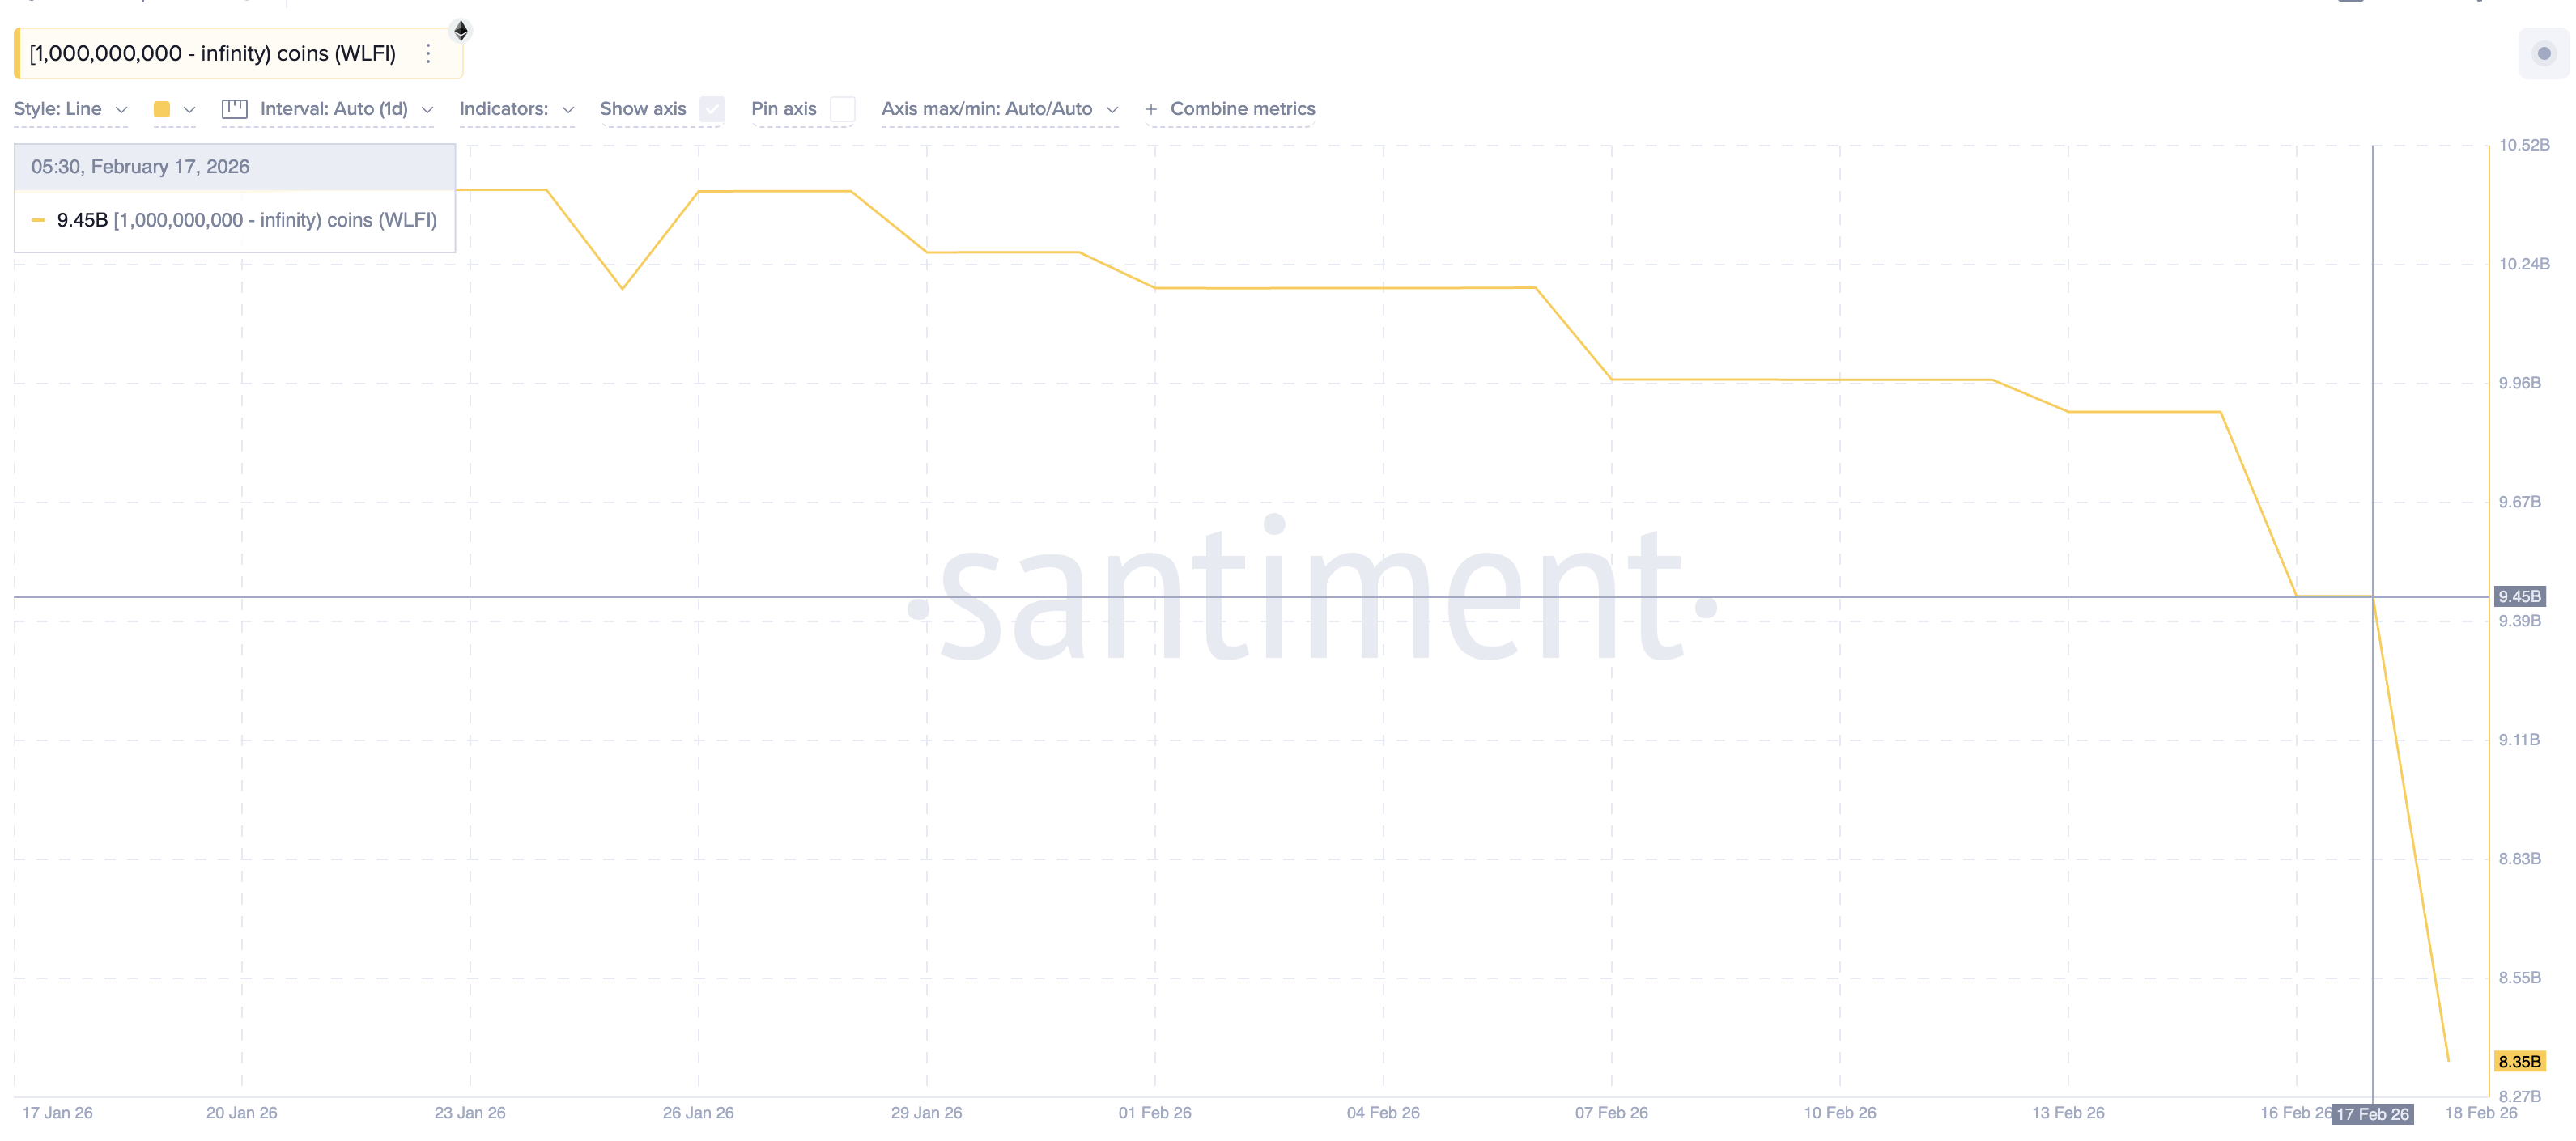
The price did not crash because smaller whales and leveraged long positions absorbed the selling.
But the distribution creates overhead pressure.
Data from Hyperliquid derivatives exchange shows diverging behavior across different WLFI trader cohorts over the past 24 hours. General whale addresses increased their long positions by 68%, showing continued optimism.
Sponsored
Sponsored
But the top 100 addresses (mega whales) by trading volume reduced long positions significantly.
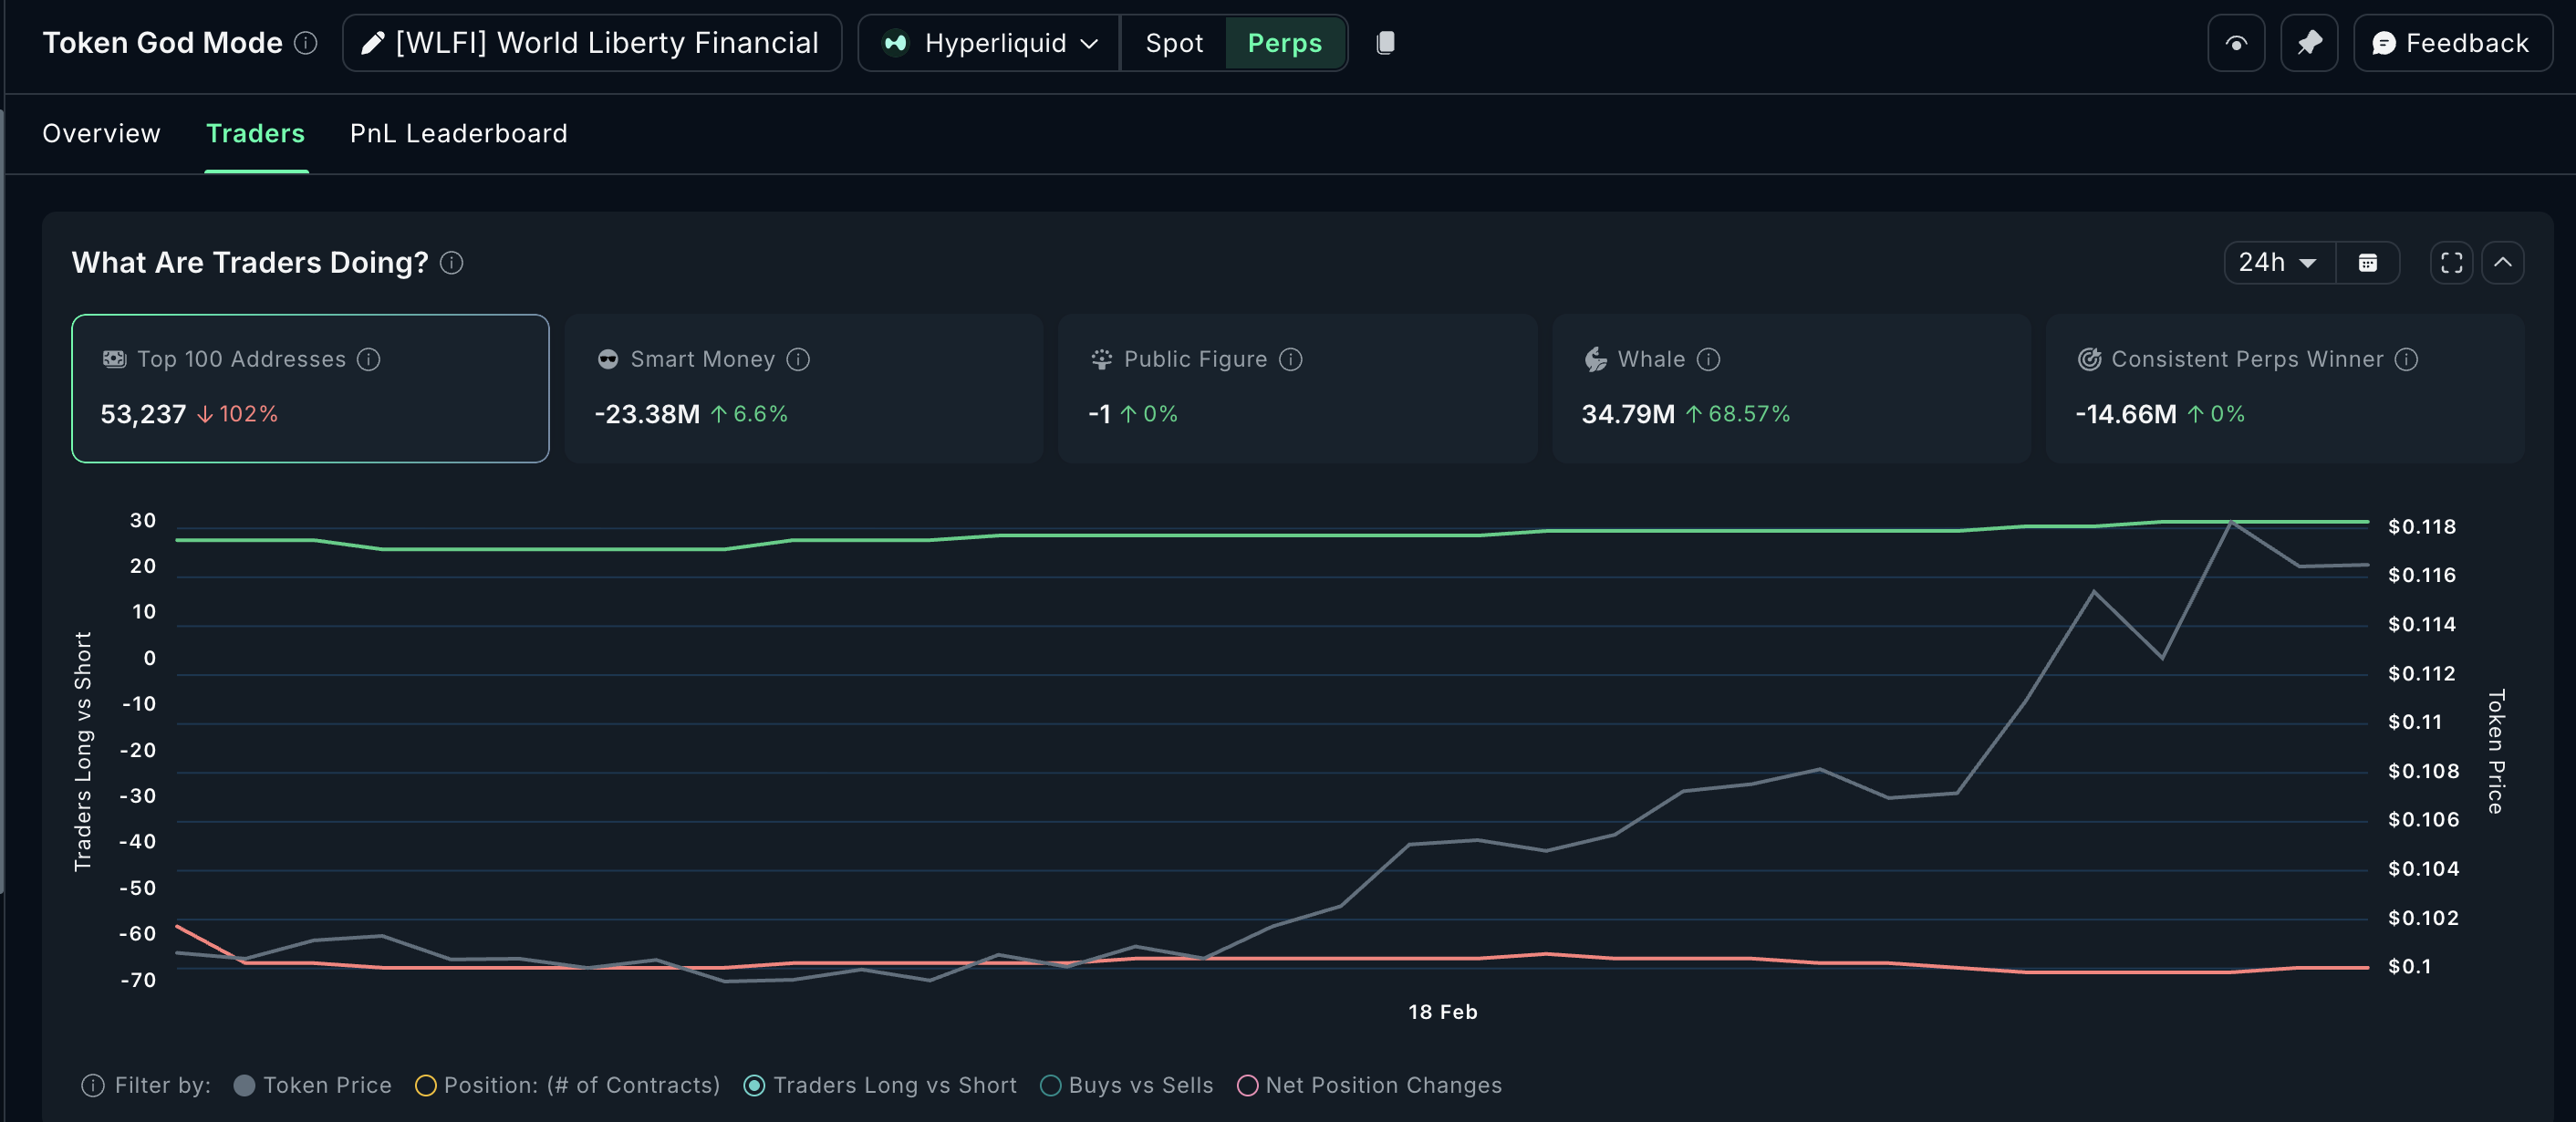
Smart Money, which tracks positioning by experienced traders, shows a net short position over the past 24 hours, hinting at caution.
This creates a dangerous setup where smaller participants are buying and adding leverage while the largest and most sophisticated players distribute and position defensively.
The rally relied on smaller whale buying and leverage rather than conviction from mega-whales. If consolidation turns into a long squeeze where leveraged longs get forced to sell, the pullback could accelerate beyond the healthy handle formation needed for pattern completion.
Sponsored
Sponsored
Mid-Term Holders Activate 500 Million Tokens for Exit, Could This Impact the WLFI Price?
The third warning comes from on-chain activity metrics. Spent Coins Age Band tracks coin movement from specific holder cohorts based on how long they held the tokens. The 90-day to 180-day age band represents mid-term holders who acquired WLFI between three and six months ago.
Before February 17, this cohort showed activity of approximately 949,000 tokens moving. Between February 17 and 18, that number exploded to over 500 million tokens.
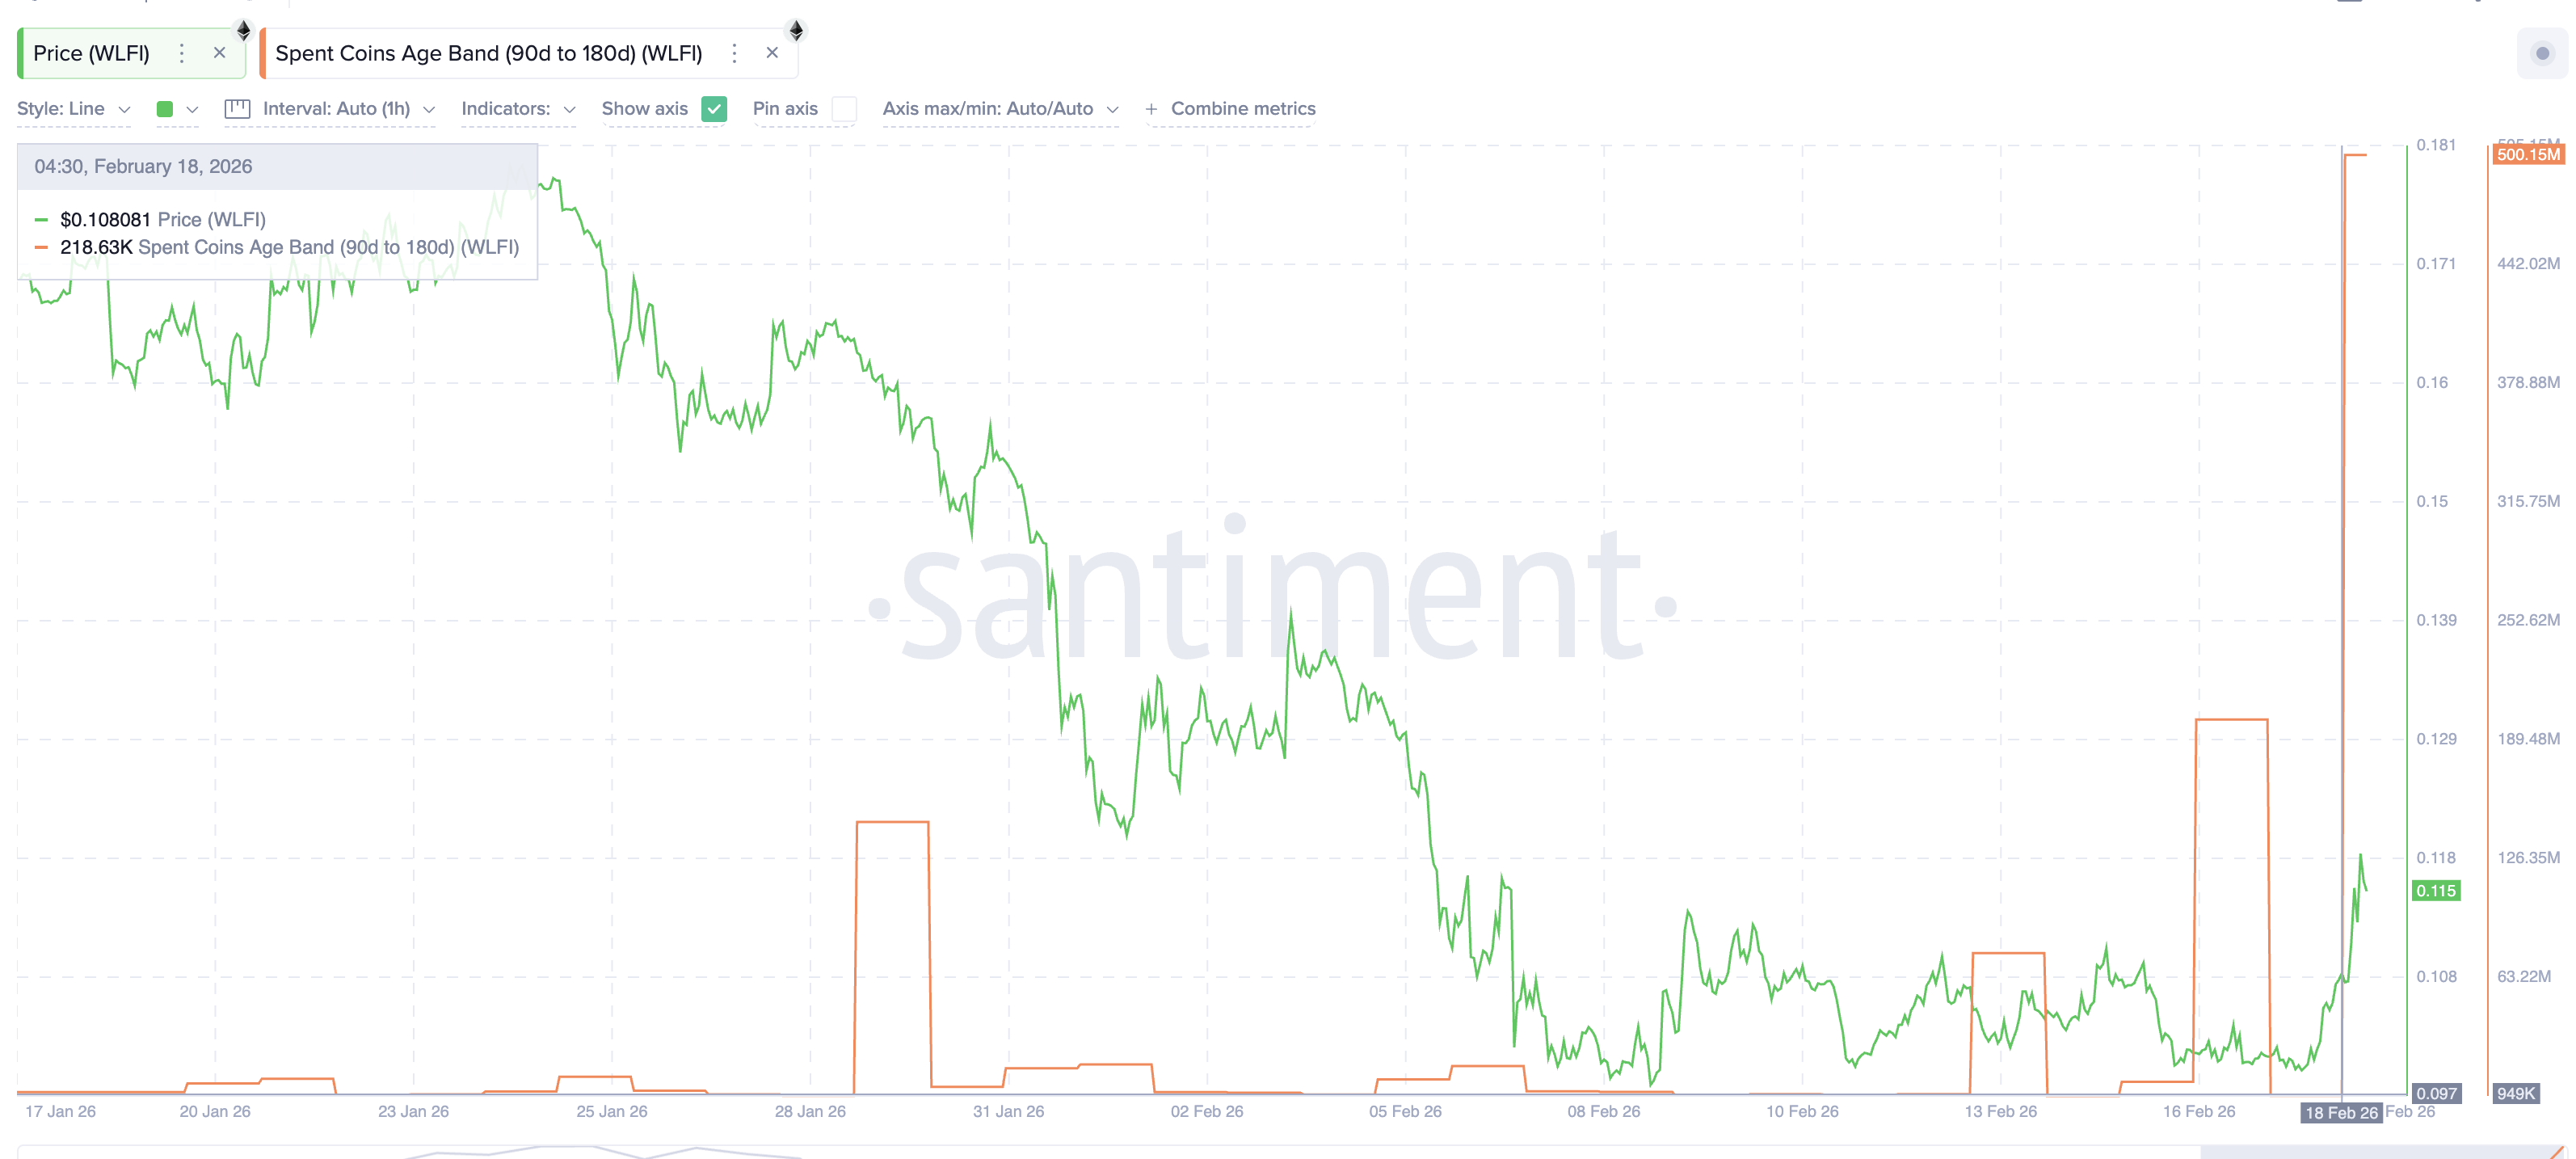
This represents a 500-times increase in coin activity from mid-term WLFI holders. When holders who sat through months of price action suddenly activate coins en masse, it typically means preparation for exit. They see the 20% rally as their opportunity to take profits after months of waiting. The 500 million tokens moving creates significant potential selling pressure on top of the 1.1 billion already sold by mega-whales and the cautious positioning by Smart Money.
All three risks point toward consolidation. The 8-hour chart RSI divergence predicts it. Mega-whales selling 1.1 billion confirms it. Mid-term holders activating 500 million validates it. The consolidation is healthy and necessary for handle formation if it stays controlled above $0.105 and respects the upsloping neckline. But the market remains weak broadly.
Fibonacci extension to the downside projects $0.090 or lower if the pattern breaks, invalidating the entire setup.
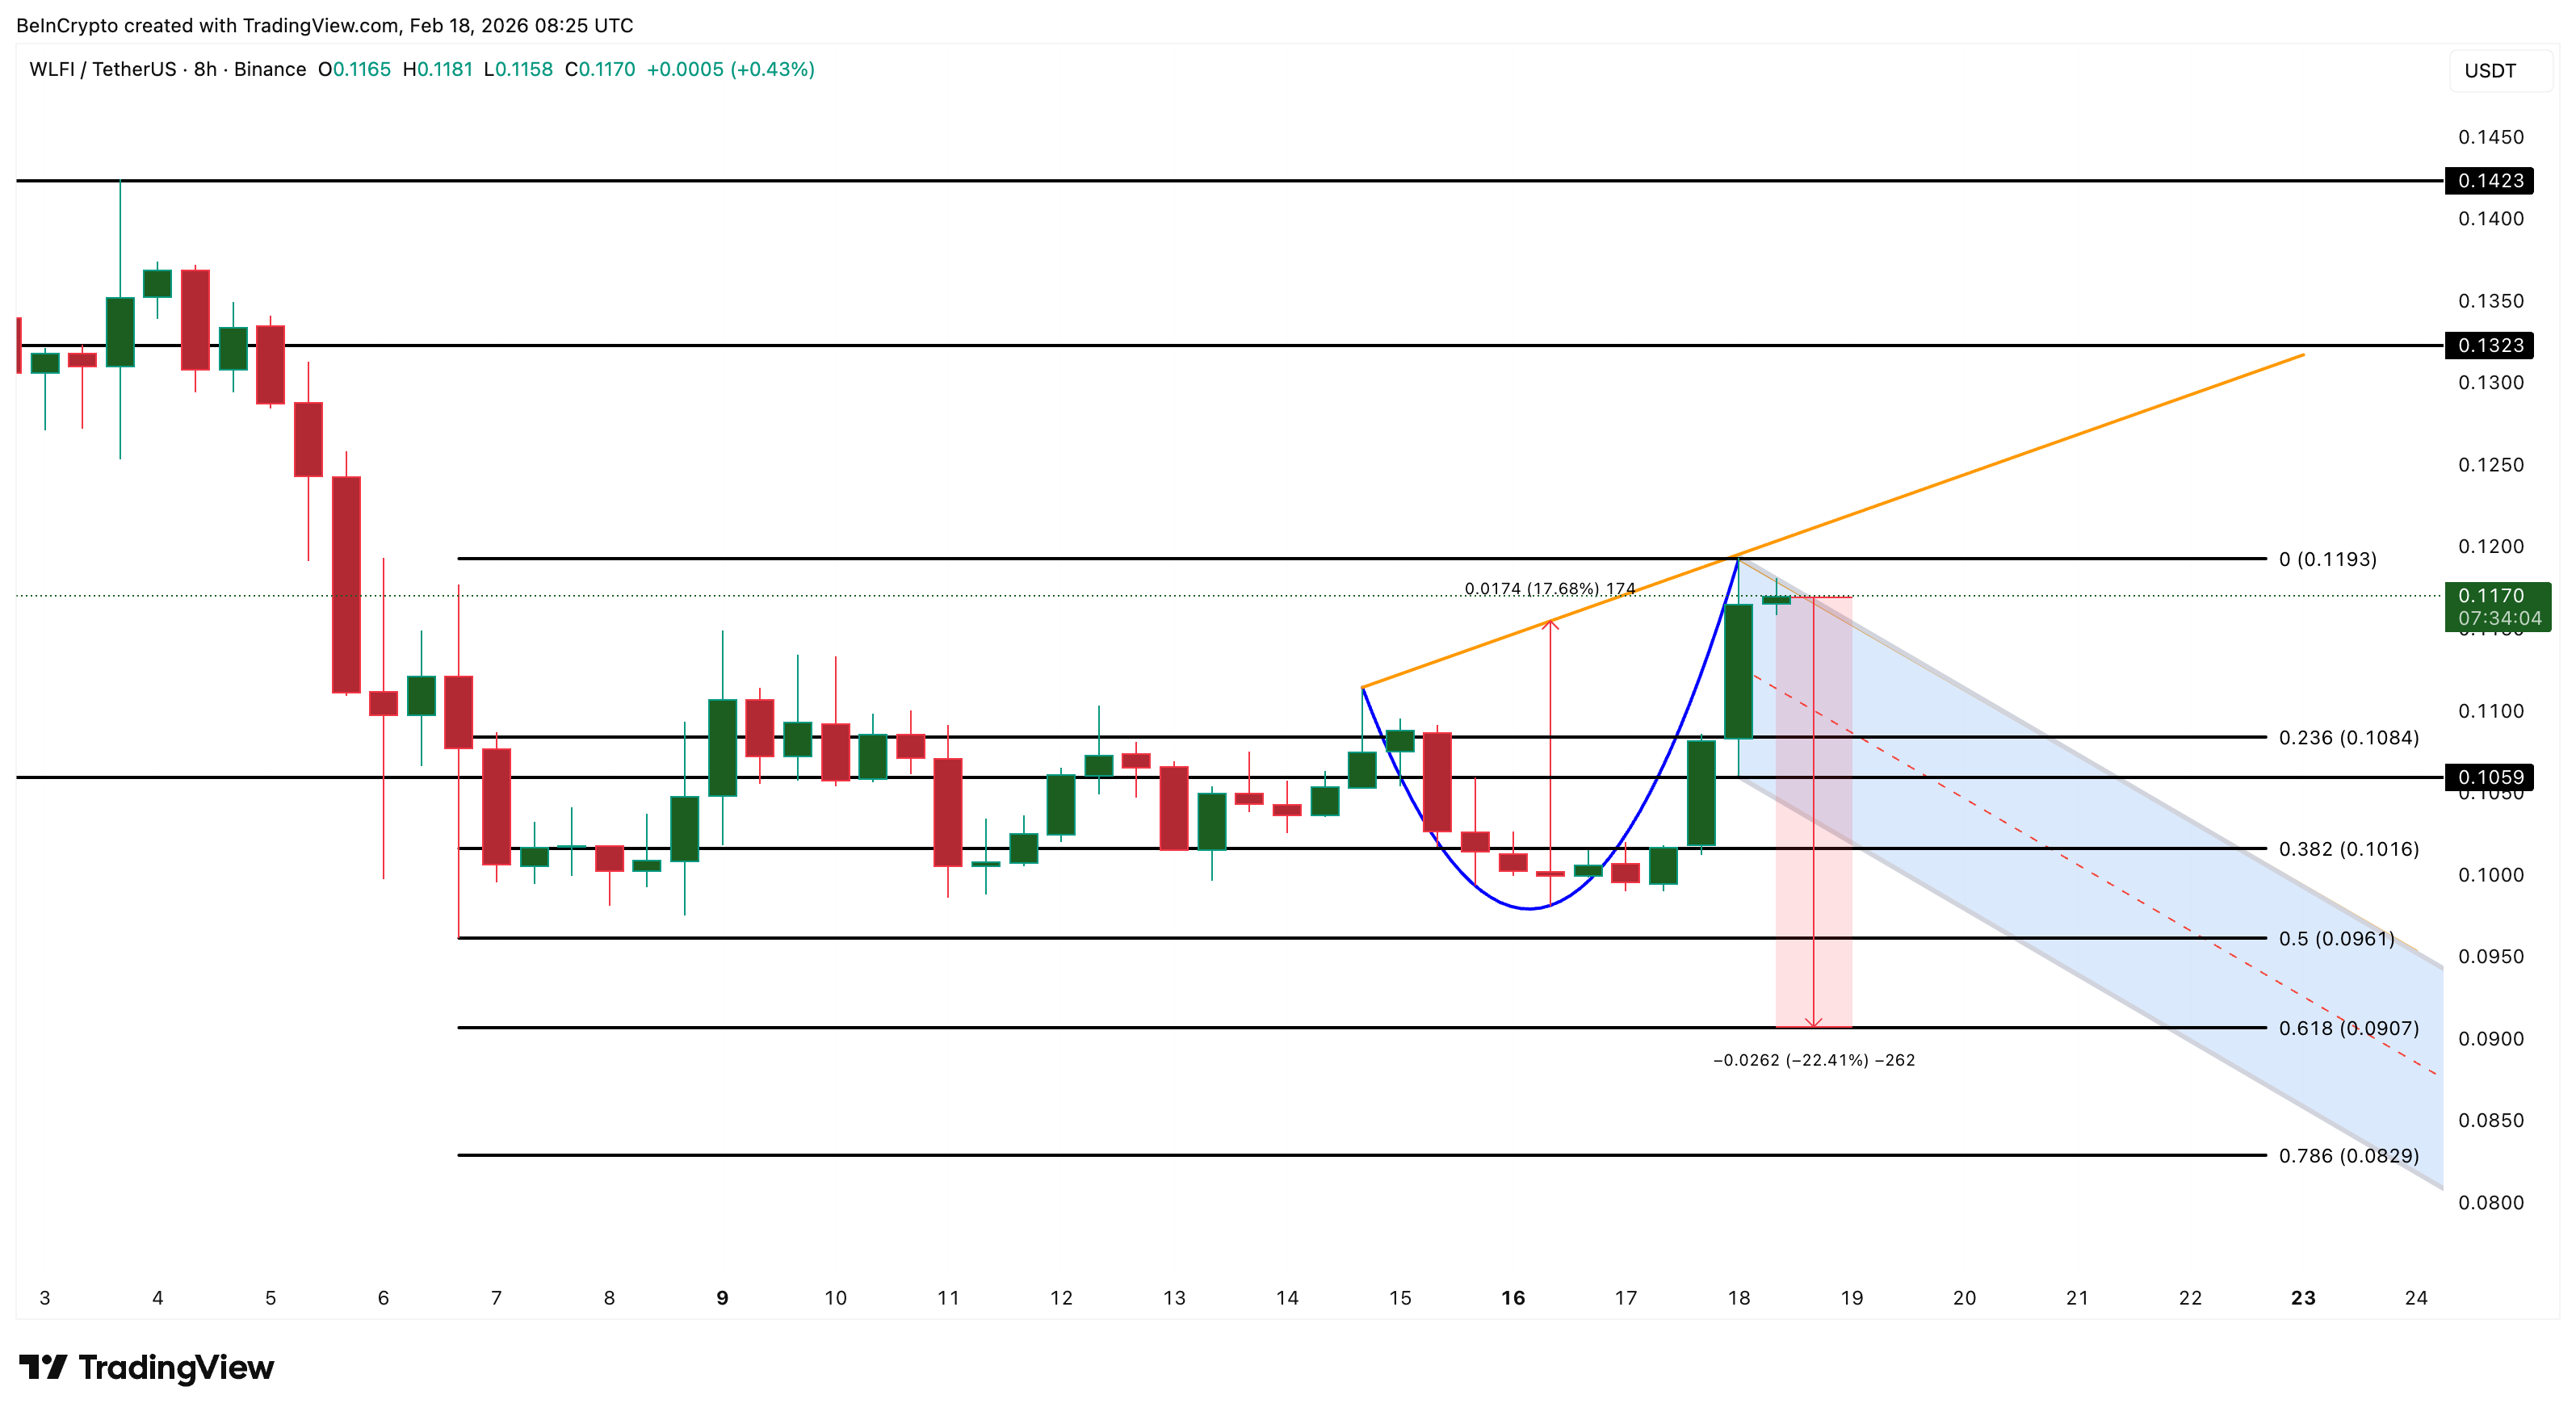
On the upside, breaking above $0.119 reactivates bullish momentum with first resistance at $0.132 before the main pattern target of $0.142. The $0.105 level decides everything. Controlled consolidation above it allows the cup to complete its handle. Breakdown below it turns the distribution into a cascade.


Two-year Bitcoin hodlers “absorbed” seller pressure in recent weeks, according to new research, but most analysts still expect new macro BTC price lows.
New analysis suggests that Bitcoin (BTC) is “relying” on early 2024 buyers as its price action stalls below $70,000.
Key points:
-
Bitcoin buyers from early 2024 are in focus as a giant potential safety net for BTC price.
-
Their cost basis extends down to $60,000, and a major capitulation has not yet happened.
-
New macro BTC price lows remain a popular near-term bet.
2024 Bitcoin hodlers have “absorbed” new sellers
In the latest edition of its weekly newsletter, “The Week Onchain,” crypto analytics platform Glassnode said that BTC price was in a “dense demand zone.”
As BTC/USD treads water around 45% below its October 2025 all-time highs, buyers from long before that event are holding up the market.
Their importance has become much more noticeable since Bitcoin dropped below its true market mean price near $80,000.
“A closer inspection of price behavior since the breakdown below the True Market Mean indicates that downside pressure has largely been absorbed within a dense demand zone between $60k and $69k,” Glassnode summarized.
“This cluster was primarily established during the H1 2024 consolidation phase, where investors accumulated within a prolonged range and have since held their positions for over a year.”

Researchers referenced the seven-month consolidation structure that characterized much of 2024, and which itself placed old all-time highs of $69,000 from late 2021 in focus.
Now, those buyers face falling into unrealized loss, but are so far avoiding capitulation.
“The positioning of this cohort near breakeven levels appears to have moderated incremental sell pressure, contributing to the development of another sideways structure since late January 2026,” “The Week Onchain” continued.
“The defense of the $60k–$69k range suggests that medium-term holders remain resilient, allowing the market to transition from impulsive decline into range-bound absorption.”

New BTC price lows in “next week or so?”
The presence of hodler resilience comes at a crucial time as market participants still expect new macro lows to come next.
Related: Bitcoin price ignores $168M Strategy BTC purchase as Iran tensions escalate
As Cointelegraph reported, Bitcoin traders have little faith in the current range holding as support, with $50,000 now a popular target.
“Expected a quick bounce to reset indicators then straight back down. I still believe 52-53k is coming in the next week or so,” one such forecast from trader Roman stated this week.

An accompanying chart suggested that the indicator “reset” would affect the relative strength index (RSI) and moving average convergence/divergence (MACD) on four-hour time frames.
Earlier, Cointelegraph noted rare lows for weekly RSI, with analysis hinting that such levels were a once-per-cycle phenomenon.
This article does not contain investment advice or recommendations. Every investment and trading move involves risk, and readers should conduct their own research when making a decision. While we strive to provide accurate and timely information, Cointelegraph does not guarantee the accuracy, completeness, or reliability of any information in this article. This article may contain forward-looking statements that are subject to risks and uncertainties. Cointelegraph will not be liable for any loss or damage arising from your reliance on this information.

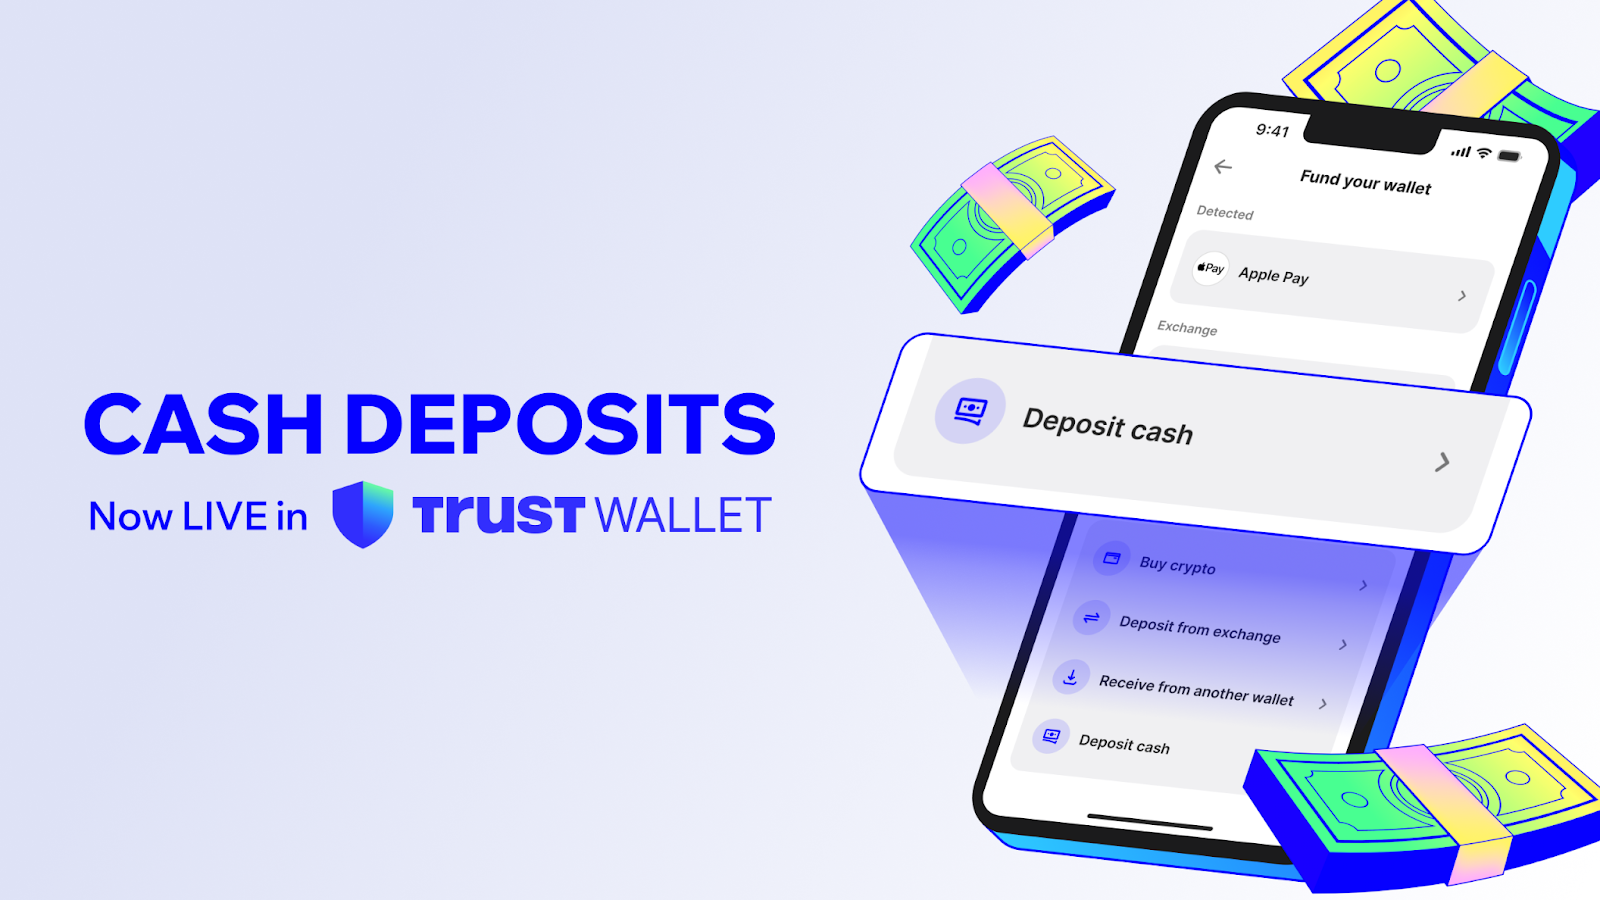
Trust Wallet, the world’s leading self-custody web3 wallet with over 220 million users, today announced the launch of Cash Deposits in the United States, a new feature that allows users to load physical cash and convert it into digital assets directly inside their Trust Wallet – without a bank account, debit card, or custodial balance.
Powered by Coinme, a leading enterprise crypto infrastructure platform, Cash Deposits enables users to load cash into a digital wallet at over 15,000 retail locations nationwide and receive stablecoins and other digital assets (BTC, SOL etc) directly into their self-custodial wallet.
With this launch, Trust Wallet removes one of the biggest barriers to participating in the digital economy: access to traditional banking.
“Millions of people in the U.S. earn and live on cash, yet most digital financial tools still assume all have a bank account or card,” said Felix Fan, CEO of Trust Wallet.
“Cash Deposits is about meeting these users where they are. If you have cash, you now have a fast, direct way to turn it into digital assets that you fully control – no intermediaries holding your funds, and no reliance on traditional banks.”
Across the United States, millions of people are paid fully or partially in cash, such as gig workers, service workers, and individuals in cash-heavy local economies. For many, opening or maintaining a bank account can be difficult, cards may not be available, and existing cash services can be slow, expensive, or require giving up control of funds.
Cash Deposits removes those barriers. With Trust Wallet, users can now load cash and convert their money to digital assets, enabling them to receive directly into a self-custody wallet they control – unlocking faster payments, easier remittances, and broader access to decentralised and digital finance.
Unlike traditional cash services that rely on banks, cards, or custodial accounts, Cash Deposits enables a direct path from physical cash to a user’s self-custody wallet. Through Coinme’s nationwide retail network, cash is converted into digital assets and delivered straight to the user’s Trust Wallet – without intermediaries holding funds after the transaction is completed.
The supported retail locations are displayed in the Trust Wallet app before users begin, allowing them to view nearby deposit options available through Coinme’s retail network.
“At Coinme, our focus has always been building compliant, nationwide infrastructure that bridges physical cash with digital assets,” said Neil Bergquist, CEO and co-founder of Coinme.
“By powering Trust Wallet’s Cash Deposits feature, we’re enabling that infrastructure to operate seamlessly within a leading self-custody experience, making it simple for users to move from cash to crypto at scale.”
Funds typically arrive within minutes rather than days, giving users faster access to their money while maintaining full control over their assets. Available across 48 U.S. states*, the feature brings national scale to a cash-to-digital experience that has historically been fragmented or inaccessible.
By combining Coinme’s established cash onramp infrastructure with Trust Wallet’s self-custody wallet, the partnership delivers one of the first mainstream, nationwide cash-to-stablecoin experiences within a single app – making digital finance more practical and accessible for everyday users.
*The cash on-ramp is currently available in the U.S. and Puerto Rico, excluding New York and Vermont. Stablecoin purchases are available in supported states, excluding Texas.
About Trust Wallet
Trust Wallet is the secure, self-custody Web3 wallet and gateway for people who want to fully own, control, and leverage the power of their digital assets. From beginners to experienced users, Trust Wallet makes it easier, safer, and convenient for millions of people around the world to experience Web3, access dApps securely, store and manage their crypto and NFTs, as well as buy, sell, and stake crypto to earn rewards — all in one place and without limits.
About Coinme Crypto-as-a-Service
Founded in 2014, Coinme is a leading licensed and regulated provider of an enterprise stablecoin and crypto payments platform. Coinme enables a fully native and seamless stablecoin and crypto payment experience within partners’ web or mobile apps. By integrating with Coinme’s simple API suite, SDKs, and widget, partners can quickly deploy crypto and stablecoin products and services natively while leveraging Coinme’s robust exchange and compliance infrastructure. For more information, please visit https://coinme.com.

TLDR
- Société Générale Forge has launched EUR CoinVertible on the XRP Ledger, expanding its stablecoin to a new Layer-1 network.
- The deployment follows previous integrations on Ethereum and Solana, strengthening the firm’s multi-chain strategy.
- Ripple supports the launch by providing institutional-grade custody and infrastructure services to ensure security.
- The integration on XRP Ledger enhances scalability, reduces transaction costs, and offers a secure decentralized architecture.
- SG-FORGE aims to increase the adoption of its euro-backed stablecoin for trading, payments, and collateral use cases.
Société Générale Forge has launched its euro-backed stablecoin, EUR CoinVertible, on the XRP Ledger. This move expands the stablecoin’s presence, following previous deployments on Ethereum and Solana. The integration into the XRP Ledger strengthens the firm’s multi-chain strategy and enhances the adoption of compliant digital assets across various blockchain networks.
EUR CoinVertible Expands to XRP Ledger
Société Générale Forge has successfully deployed EUR CoinVertible on the XRP Ledger. This launch adds another Layer-1 network to the stablecoin’s ecosystem, which already includes Ethereum and Solana. According to SG-FORGE, the decision to use the XRP Ledger stems from its high-performance capabilities, which can provide faster transactions, lower fees, and a secure decentralized architecture.
Ripple has supported the launch by providing its institutional-grade custody and infrastructure services. This partnership aims to ensure the stablecoin’s seamless integration while maintaining high security standards. Ripple’s technology enables SG-FORGE to enhance the operational and security standards for the stablecoin’s use cases.
SG-FORGE highlighted several key advantages of integrating EUR CoinVertible into the XRP Ledger. The platform’s scalability and low transaction costs are central to its appeal. XRP Ledger’s decentralized infrastructure also ensures a high level of security for institutional users of the stablecoin.
Jean-Marc Stenger, CEO of SG-FORGE, emphasized the firm’s focus on delivering transparent and secure digital assets. “The launch of EUR CoinVertible on XRP is a milestone in our effort to advance regulated digital assets that are compliant and scalable,” Stenger stated. The integration on XRP reinforces SG-FORGE’s commitment to expanding its offering of euro-backed stablecoins for trading, payments, and collateral use.
Ripple’s Role in Expanding EUR CoinVertible Use Cases
Ripple’s involvement in the launch is crucial, as it provides both infrastructure and custody services for EUR CoinVertible. The partnership with Ripple supports SG-FORGE’s strategy of driving the adoption of the stablecoin across various financial and crypto markets.
Cassie Craddock, Ripple’s Managing Director for UK and Europe, remarked that SG-FORGE is at the forefront of creating structured crypto-asset offerings in Europe. “Ripple’s infrastructure has been integral to supporting the launch and ongoing expansion of regulated stablecoins like EUR CoinVertible,” Craddock added. The move to integrate with XRP’s robust platform is expected to unlock new use cases for the stablecoin, such as trading collateral and further integration into Ripple’s product suite.

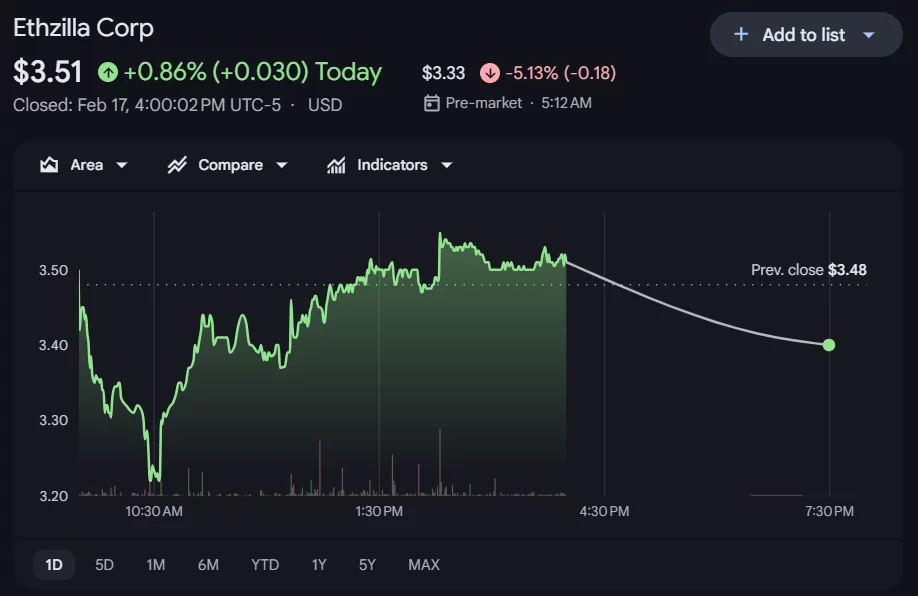
ETHZilla Corp (ETHZ) shares faced intense pressure in pre-market trading this Wednesday following news that billionaire investor Peter Thiel and his venture firm, Founders Fund, have completely liquidated their position.
Summary
- An SEC filing revealed that Peter Thiel and Founders Fund have completely liquidated their 7.5% stake in Ethzilla (ETHZ), triggering a 5.13% pre-market drop to $3.33.
- Originally a biotech firm (180 Life Sciences), Ethzilla’s high-leverage pivot to a “corporate Ethereum treasury” model has faltered, with the stock currently down 97% from its 2025 highs.
- Amidst heavy debt and market volatility, the company is attempting to stabilize by pivoting again, this time toward tokenizing jet engines and home loans, though investor confidence remains shaken.
The Thiel exodus: Founders Fund liquidates stake in ETHZilla
The stock, which has already plummeted over 97% from its 2025 highs, hit a pre-market low of $3.33, representing a 5.13% drop from its previous close.

The sell-off was triggered by a late Tuesday SEC filing revealing that Thiel’s entities now hold zero shares in the company. This marks a dramatic reversal from August 2025, when the fund disclosed a significant 7.5% stake.
At the time, Thiel’s entry was seen as a massive vote of confidence for ETHZilla’s pivot from biotechnology to a corporate Ethereum (ETH) treasury model.
The massive sell-off marks a dramatic fall from grace for the firm, which rebranded from 180 Life Sciences last year to become a high-leverage Ethereum treasury. While the initial pivot drew over $425 million in institutional backing, the recent liquidation of its ETH holdings has left investors questioning the sustainability of its ‘crypto-first’ balance sheet.
Crisis in the ETH treasury model
The full exit by Founders Fund underscores the growing skepticism surrounding companies that use high-leverage strategies to accumulate Ethereum. While similar “Bitcoin treasury” plays have remained popular, Ether-focused firms like ETHZilla have struggled under the weight of market volatility and debt obligations.
ETHZilla has recently attempted to diversify its business to stabilize its balance sheet. Recent moves include:
- Asset Tokenization: Launching “ETHZilla Aerospace” to tokenize leased jet engines.
- Debt Repayment: Liquidating over 24,000 ETH in late 2025 to settle convertible bond obligations.
- Real Estate: Acquiring modular home loan portfolios for on-chain yields.
Despite these efforts to pivot toward Real World Assets (RWA), the market appears focused on the loss of its most prominent institutional backer. For many investors, Thiel’s departure signals that the “Saylor-style” accumulation strategy for Ethereum may be facing a structural breakdown.
The divergence between Bitcoin and tech stocks is a warning sign of a potential artificial intelligence-driven credit crisis that could lead to more central bank money printing, says Arthur Hayes.
“Bitcoin is the global fiat liquidity fire alarm. It is the most responsive freely traded asset to the fiat credit supply,” said the crypto entrepreneur in his latest blog post on Wednesday.
Hayes went on to caution that the recent divergence between Bitcoin (BTC) and the tech-heavy Nasdaq 100 Index “sounds the alarm that a massive credit destruction event is nigh.”
When these two previously correlated asset classes diverge, “it warrants further investigation into any trigger that could cause a destruction of fiat” — mostly dollars and credit, which is also known as deflation, he said.
Hayes believes that job losses due to AI adoption will have a major impact on consumer credit and mortgage debt “because of the inability of white-collar knowledge worker debt donkeys to meet their monthly payments.”
“That’s a bold statement to call for a financial crisis because of job losses caused by AI adoption.”
AI job losses could trigger another banking crisis
In 2025, companies cited AI when announcing 55,000 job cuts, more than 12 times the number of layoffs attributed to AI just two years earlier, reported CBS News in early February.
“This AI financial crisis will restart the money printing machine for realz,” said Hayes.
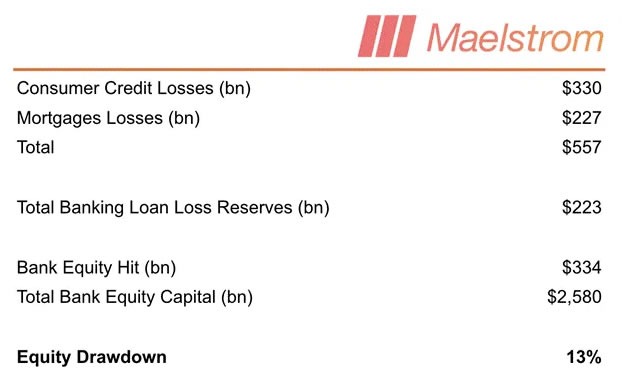
His loose model suggests that a 20% reduction in the 72 million “knowledge workers” in the US could produce around $557 billion in consumer credit and mortgage losses, representing a 13% write-down of US commercial bank equity.

Hayes speculates that weaker regional banks would buckle first, depositors would flee, and credit markets would seize. The Federal Reserve would eventually panic and start printing money.
“While the Fed is fighting windmills, AI-related job losses will destroy the balance sheets of American banks,” he said.
“Finally, the monetary mandarins panic and press that Brrrr button harder than I shred pow the morning after a one-meter dump.”
Related: 1 in 4 CEOs expect to sack staff due to AI this year
Hayes predicted that this surge in fiat credit creation would “pump Bitcoin decisively off its lows,” and that the future expectation of increased fiat creation to save the banking system would “propel Bitcoin to a new all-time high.”
In addition to Bitcoin, Hayes said there are two altcoins that his company, Maelstrom, will “deploy excess stables into once the Fed blinks.” Those coins are Zcash (ZEC) and Hyperliquid (HYPE).
More money-printing theories abound
However, this is not the first radical money-printing thesis Hayes has proposed.
In January, he said that the Federal Reserve would print money to alleviate the Japanese bond crisis.
In December 2025, he predicted that BTC would surge to $200,000 by March due to money printing through a new Fed liquidity tool called Reserve Management Purchases, which resembles quantitative easing.
Magazine: Chinese New Year boosts interest, TradFi buying crypto exchanges: Asia Express

Lawmakers, Wall Street executives, and cryptocurrency leaders will meet at US President Donald Trump’s private Mar-a-Lago club for a crypto “forum” organized by World Liberty Financial, the company backed by Trump and his sons.
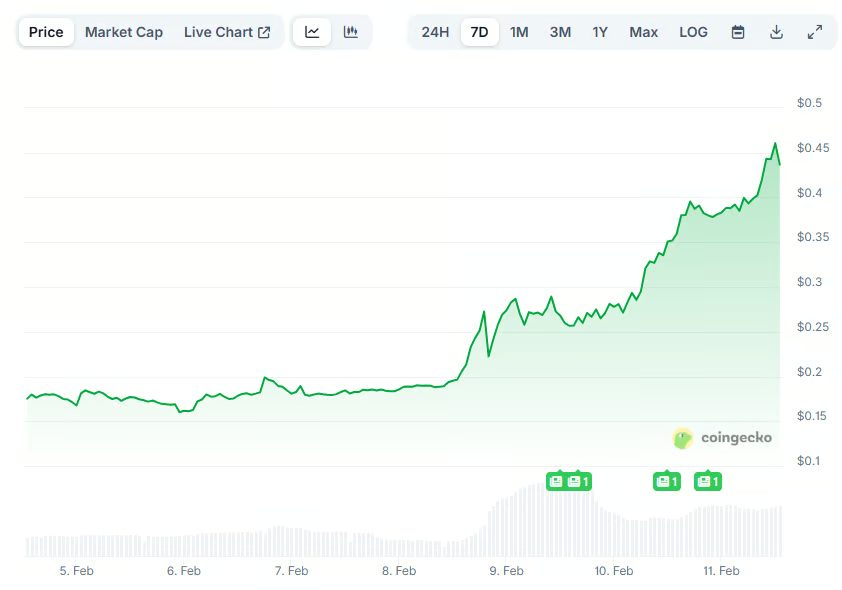
Ahead of the event, the price of World Liberty’s WLFI token surged by more than 23%, to about $0.12 from $0.10. Trading volume in the past 24 hours topped $466 million.
On Wednesday, the president’s sons, Eric Trump and Donald Trump Jr. — also the co-founders of World Liberty Financial — along with Coinbase CEO Brian Armstrong, BitGo co-founder and CEO Mike Belshe, CFTC Chair Michael Selig and others will gather to discuss crypto-related policy issues at Trump’s Florida property.

The event, described as a crypto-aligned “forum” by World Liberty, comes as US lawmakers consider a comprehensive digital asset market structure bill amid concerns about how to address stablecoin yield. Selig is scheduled to speak with New York Stock Exchange President Lynn Martin on the bill.
Although aligned with crypto policy and including lawmakers like Ohio Senator Bernie Moreno and Florida Senator Ashley Moody, the President was not slated to appear at the event as of Wednesday morning.
Meanwhile, many Democratic senators are still pushing for the market structure bill to include provisions addressing conflicts of interest for US lawmakers and elected officials profiting from the crypto industry while in office.
Related: CFTC chair doubles down on defending prediction markets from state lawsuits
Media outlets have reported that Trump and his family have generated more than $1 billion from crypto projects since he took office in January 2025. In contrast to the president’s second term, Trump in 2019 said he was “not a fan” of Bitcoin (BTC) and other cryptocurrencies, while referring to the coin as a “scam” after leaving office in 2021.
US market structure bill is under scrutiny
Passed as the CLARITY Act in the US House of Representatives in July, the market structure bill under consideration in the Senate is expected to provide clarification on oversight of digital assets by the Commodity Futures Trading Commission and Securities and Exchange Commission, Washington’s two main financial markets regulators.
In January, the Senate Agriculture Committee, which has CFTC oversight, advanced its version of the bill along partisan lines, with no Democrats voting for the legislation. The Senate Banking Committee postponed its markup of the bill in January after the Coinbase CEO said he could not support the legislation as written, citing concerns about tokenized equities and decentralized finance.
Magazine: Brandt says Bitcoin yet to bottom, Polymarket sees hope: Trade Secrets


Telegram use in Russia faces rising blocks and slowdown as regulators tighten controls.
Summary
- Telegram blocked 238.8k channels on Feb 15 and 187.3k on Feb 16, taking total blocked groups and channels to over 7.463m since Jan 1.
- Russia fully blocked WhatsApp and removed its domains from DNS, steering users toward the state-backed Max messenger amid broader social-media restrictions.
- Despite throttling and potential April 1 blocking, Russian users increasingly rely on VPNs and alternative apps like imo to keep messaging access.
Telegram has begun blocking illegal content and has sufficient time to meet Russian regulatory requirements, according to a senior parliamentary committee member overseeing the matter.
Andrey Svintsov, deputy chairman of the Committee on Information Policy at the State Duma, told state news agency TASS that the messaging platform has started actively complying with Russian Federation requirements. “Over the past week, Telegram has blocked more than 230,000 channels and pieces of content that violated current legislation,” Svintsov stated. “This indicates that Durov’s company has begun to interact more actively.”
Russian authorities slowed traffic to the messenger earlier this month, citing non-compliance with national regulations. Media reports emerged this week suggesting the platform could be fully blocked on April 1, though Russian officials have neither confirmed nor denied the reports.
Svintsov said Telegram could fulfill Roskomnadzor’s requirements within one to two months and continue operating in Russia. “In my opinion, Telegram will not be blocked before April 1,” he stated, referring to messenger founder and CEO Pavel Durov.
Roskomnadzor, the Federal Service for Supervision of Communications, Information Technology and Mass Media, serves as Russia’s telecommunications regulator and media oversight body. According to Svintsov, the requirements include opening a legal entity, storing data on Russian territory, paying taxes and blocking prohibited content. “Opening a legal entity takes a week at most. Moving personal data processing takes another two or three weeks,” the deputy said.
Last summer, reports that Telegram was preparing to establish an office in Russia under the country’s “landing law” were denied by Durov, either directly or indirectly, according to previous media accounts.
Yulia Dolgova, president of the Russian Association of Bloggers and Agencies, told TASS that determining whether Telegram will be fully blocked remains difficult at this stage. She noted that unlike WhatsApp, Telegram is actively taking measures to maintain service functionality. Roskomnadzor completely removed Meta’s WhatsApp domain from its DNS servers last week, effectively blocking access from Russia. Dolgova also noted widespread VPN usage among Russian users to bypass such restrictions.
Telegram, the government and crypto
The Telegram channel Baza, citing government sources, reported that Roskomnadzor is preparing to “begin a total blocking of the messenger” on April 1. In response to media inquiries, Roskomnadzor said it had “nothing to add” to previous statements threatening “sequential restrictions.”
TASS reported this week that Telegram’s administration blocked 238,800 channels and groups on February 15 and 187,300 channels and groups worldwide on February 16, according to updated statistics on the messenger’s website. As of February 17, more than 7.463 million groups and channels have been blocked on Telegram since the beginning of the year, the agency reported.
Telegram ranks as the second most popular messaging application in Russia with 93.6 million users, trailing WhatsApp, which had 94.5 million monthly users before being blocked. As Russia implements restrictive measures against both platforms while promoting the state-backed Max messenger, Russian citizens have increasingly turned to imo, a U.S.-made messaging alternative, according to reports.

US lawmakers may face a narrowing window to pass long-awaited crypto legislation. Speaking at the World Liberty Forum, Senator Bernie Moreno said a comprehensive market structure bill could pass “hopefully by the end of April.”
The Ohio Senator stressed that Congress must act within the next 90 days to maintain momentum.
Sponsored
A Compressed Timeline for Crypto Rules
The remarks, delivered at an event hosted by World Liberty Financial at Mar-a-Lago on February 18, highlighted both urgency and persistent friction between the banking sector and the digital asset industry.
According to live reporting, Bernie Moreno acknowledged the difficulty of negotiations, saying the process had “taken years off my life,” while reiterating that lawmakers “have to get it done in the next 90 days.”

Moreno has been one of the most vocal advocates for federal crypto legislation, particularly measures tied to frameworks such as the Digital Asset Market Clarity Act, which aims to define whether digital tokens fall under securities or commodities law and to establish clearer oversight of trading platforms and stablecoins.
Although elements of crypto legislation have already passed the House, Senate progress has slowed in recent months amid lobbying, technical disagreements, and partisan divisions.
Moreno’s timeline suggests lawmakers are attempting to push negotiations toward a decisive phase before the legislative calendar tightens further.
Sponsored
Stablecoin Yield Debate Remains a Sticking Point
One of the most contentious issues remains whether stablecoin issuers should be allowed to offer yield or rewards to users.
Banks have argued that yield-bearing stablecoins could draw deposits away from the TradFi system. Meanwhile, crypto firms maintain that such features are essential to innovation and competition.
At the forum, Moreno drew applause after vowing not to allow banks to reopen provisions already settled in the GENIUS Act.
“We’re not going to go back and revisit legislation that’s already passed,” Moreno said, adding that he would not permit changes in the digital asset space that could undermine prior agreements.
Sponsored
Sources familiar with negotiations indicated that talks between banks and crypto stakeholders have made little progress in recent weeks. This strengthens concerns that the legislative timetable could slip further.
Political Signals and Industry Pressure
Standing alongside Moreno, Ashley Moody injected a note of humor into the discussion, drawing laughter from the audience.
She also highlighted the intense scrutiny facing lawmakers as they attempt to finalize the bill.
Sponsored
“He’s in Banking. If they don’t get it done, we can blame Bernie,” she quipped.
Meanwhile, a potential White House meeting to advance negotiations may be postponed. One invitee reportedly described the planned gathering as likely to be “just for show,” suggesting that insufficient progress has been made to justify another high-level session.
The World Liberty Forum itself drew roughly 300 to 400 leaders from finance, technology, policy, and media.
This suggests growing institutional interest in how stablecoins, DeFi, and blockchain infrastructure could shape the future of the US dollar and global markets.
Moreno’s 90-day deadline serves less as a guarantee than a signal. After years of debate, the window for decisive US crypto regulation may finally be narrowing.

Christine Lagarde might not stick around until 2027. Reports suggest the ECB president is weighing an early exit.
If that happens, it is not just a personnel change. It could scramble the timeline for the digital euro and stablecoin oversight right as MiCA rules start taking effect.
A leadership shakeup at this stage would inject fresh uncertainty into Europe crypto roadmap.
Key Takeaways
- Early Departure: Lagarde is reportedly weighing an exit before October 2027 to align with French presidential elections.
- Succession Race: Top contenders include Dutch central bank chief Klaas Knot and Spain’s Pablo Hernández de Cos.
- Project Risk: A change in leadership threatens the continuity of the digital euro project and euro-stablecoin oversight.
Why Is The Timing Critical for Crypto?
Lagarde has been the driving force behind the ECB digital push. Since 2019, she moved the digital euro from theory into formal investigation. Now, just as MiCA stablecoin rules are being finalized, her potential exit lands at a sensitive moment.
Without her leading the charge, the sovereign payment narrative weakens. There are also political layers here. Aligning her departure with the April 2027 French election could give President Macron influence over who steps in next.
The bigger concern is policy drift. A new ECB chief could shift focus back to traditional tightening and slow down digital euro efforts. That would leave more room for private stablecoins to fill the gap.
Who Could Take The Reins?
Publicly, the ECB says she is fully focused on her job. But the timing being floated suggests this is more than random chatter. The idea is to step aside before political shifts in France and Germany complicate the process.
Names are already circulating. Spain’s Pablo Hernández de Cos. Dutch central bank chief Klaas Knot. Even Bundesbank head Joachim Nagel is in the conversation.
Officially, nothing is confirmed. ECB executive Piero Cipollone says he has no knowledge of an early exit plan. Still, markets tend to price political risk before headlines become formal announcements.
With 21 eurozone nations needing to approve a successor, whoever takes over could significantly shape Europe’s stance on crypto and the digital euro.
What Happens to the Digital Euro?
A leadership vacuum would leave the digital euro in a fragile spot. The project already faces pushback from banks and privacy advocates. Without Lagarde driving it forward, momentum could fade fast.
And this is happening while stablecoin liquidity is shifting quickly. If the ECB hesitates on building a serious euro alternative to US dollar tokens, private players will not wait.
At the same time, the US and other major economies are accelerating their crypto frameworks. Europe cannot really afford a slowdown. Leadership uncertainty rarely supports long term institutional projects.
Discover: Here are the crypto likely to explode!
The post Lagarde Exit Report Raises Questions Over Digital Euro Timeline and Stablecoin Policy appeared first on Cryptonews.

The European Central Bank is edging closer to a full-fledged digital euro pilot, signaling a shift from exploratory talks to concrete testing. In remarks delivered after an executive committee meeting of the Italian Banking Association, ECB Executive Board member Piero Cipollone outlined a staged timetable that prioritizes the selection of payment service providers (PSPs) in early 2026 and a 12-month pilot during the second half of 2027. The plan envisions a small group of PSPs, merchants and Eurosystem staff participating in the initial phase, with broader involvement contingent on legislative and technical readiness. The remarks underscore the bank’s aim to validate a central bank digital currency in practical settings while preserving the integrity of European card schemes and keeping banks at the core of the payments ecosystem. held
Cipollone stressed that the digital euro would be designed to protect European card schemes and preserve banks’ central role in Europe’s payments system, a framing that aligns with Reuters’ coverage of the central bank’s approach. The pilot is intended to be modest in scope at the outset, focusing on a limited number of PSPs, merchants and Eurosystem staff to test onboarding, settlement and liquidity management in a real-world environment. This phased approach is positioned to give participating PSPs an early-readiness edge should a broader rollout follow, while generating practical data on infrastructure, compliance and staffing costs for planning purposes.
Key takeaways
- PSP selection for the digital euro pilot is scheduled to begin in the first quarter of 2026, setting the stage for a 12-month trial in the latter half of 2027.
- The pilot will involve a limited cohort of PSPs, merchants and Eurosystem staff, enabling hands-on testing of onboarding, settlement and liquidity management within a controlled environment.
- European authorities emphasize that the digital euro is intended to shield domestic payment ecosystems and card schemes, rather than displace them, with a focus on preserving the role of banks in payments.
- Governance and cost visibility are key aims of the pilot, offering participating players clearer insights into future infrastructure, compliance and staffing needs.
- Industry expectations are shaped by a longer-term roadmap that includes potential broader rollout and a 2029 launch target, contingent on legislative progress in 2026 and subsequent regulatory steps.
Market context: The push for a digital euro sits within a broader European effort to modernize payments, reduce dependence on international card networks, and ensure a stable, centrally governed digital currency option for residents and businesses. The central bank’s framing of the pilot as a way to protect domestic systems while engaging with private sector participants mirrors ongoing debates around stablecoins and private payment solutions that could otherwise erode the traditional banking role in payments.
Why it matters
The ECB’s move toward a structured pilot signals a careful balance between innovation and incumbency. By enabling a controlled test environment that includes EU-licensed PSPs and direct Eurosystem involvement, the central bank aims to gather actionable data on how a digital euro could function in real commerce. This includes practical issues around onboarding new users, ensuring seamless settlement between participants, and managing liquidity—areas that have historically proven complex for central bank digital currency platforms to operationalize at scale.
From a banking perspective, the digital euro is envisioned not as a threat to banks, but as a mechanism to preserve their centrality in a payments landscape that increasingly incorporates digital solutions. Cipollone highlighted that the project would aim to protect domestic payment rails and card schemes while offering a more cost-efficient option for merchants. The stated goal is to place a cap on merchant fees for the digital euro network that would be lower than the charges typical of international card networks, yet higher than those charged by domestic schemes. This pricing dynamic is designed to keep EU-based payment ecosystems competitive while ensuring that the digital euro remains attractive to merchants and consumers alike.
European policymakers are also mindful of broader industry shifts. The plan explicitly notes the European Bancomat and Bizum-type networks as areas where the digital euro could help preserve domestic alternatives against private, cross-border payment rails. In this context, the pilot is less about displacing existing networks and more about integrating a central bank digital currency in a way that complements, rather than competes with, established infrastructures. This approach aligns with the broader aim of safeguarding financial stability and ensuring that Europe maintains strategic control over its payments architecture as new digital forms of money emerge.
What to watch next
- First-quarter 2026: Official PSP selection process begins, narrowing the field for the pilot.
- Second half of 2027: Primary 12-month digital euro pilot period commences with participating PSPs and merchants.
- 2026–2027: Legislation and regulatory steps to enable or adjust digital euro deployment, shaping the timeline for broader rollout.
- 2029: Potential full-scale launch if legislative and technical milestones are met and stakeholders achieve sufficient readiness.
- Ongoing infrastructure planning: ECB and Eurosystem continue to map future ecosystem costs, staffing needs and compliance requirements tied to the digital euro’s operation.
Sources & verification
- ECB press release and accompanying document outlining the PSP selection and pilot plans (Sp260218) and related materials.
- Reuters coverage detailing Cipollone’s remarks and the digital euro design goals to protect European banks’ card schemes.
- Cointelegraph reporting on the digital euro trajectory, including references to the 2029 launch plan and next-phase progression.
- Historical reporting on the ECB’s progression toward a digital euro, including discussions around legislation timelines in 2026.
ECB advances digital euro pilot as PSP selection begins in 2026
The European Central Bank is advancing toward a tangible digital euro pilot, signaling a transition from theoretical exploration to real-world testing. The plan, presented in the wake of a meeting with the Italian Banking Association’s executive committee, centers on naming payment service providers (PSPs) in early 2026 and launching a 12-month trial in the second half of 2027. The pilot’s initial footprint will be deliberately modest: a limited cadre of PSPs, a handful of merchants and Eurosystem staff will participate to validate core operational flows, including onboarding, settlement and liquidity management. This approach aims to deliver measurable insights while preserving the primacy of existing European card schemes and banks within the payments system.
In explaining the design philosophy, Cipollone stressed that the digital euro should bolster domestic payment networks rather than replace them. By anchoring the rollout in EU-licensed PSPs, the ECB seeks to ensure merchant access, interoperable settlements and a governance structure that keeps banks at the center of the payments ecosystem. The broader objective is to strike a balance between innovation and stability—allowing the digital euro to co-exist with established rails while mitigating the risk of private, non-government-controlled systems displacing traditional players.
A key element of the planned approach is the potential to test and refine future infrastructure, compliance and staffing costs. The pilot’s visibility into these cost dimensions could inform investment decisions for PSPs and banks, helping them plan capital deployment with greater certainty. Direct Eurosystem involvement is intended to yield practical feedback from participants, shaping both product design and governance arrangements as the project evolves.
Beyond the technical and financial considerations, the ECB’s digital euro initiative is framed as a strategic safeguard for Europe’s payments sovereignty. The project explicitly envisions protecting local networks, such as Italy’s Bancomat and Spain’s Bizum, from losing ground to private, cross-border platforms. In Cipollone’s view, the digital euro should offer an affordable alternative for merchants—pricing that is lower than the typical charges on international networks but higher than the minimums charged by domestic schemes. This pricing nuance reflects a deliberate effort to maintain domestic competitive advantages while embracing the efficiencies associated with central bank money in digital form.
As policymakers weigh the next steps, observers will be watching how the proposed timeline aligns with legislative developments in 2026 and how the pilot’s findings influence the path toward a broader rollout. The ECB’s timeline currently contemplates a 2029 launch under favorable regulatory and technical conditions, with a potential early start to the pilot if legislation is enacted in 2026. This braided timetable underscores the delicate balance the central bank must strike between experimentation, market readiness and fiscal prudence in a rapidly evolving digital payments landscape.

All-Time Greatest Space Series Siloed And Ruined By Broken, Low-Quality Streaming

Lalach Buri Bala#comedy #mayka #youtubeshorts #best #bestyoutuber #coupledailouges #ytshorts #money

Qarabag vs Newcastle live: Latest score and updates from Champions League play-off


-

 Sports7 days ago
Big Tech enters cricket ecosystem as ICC partners Google ahead of T20 WC | T20 World Cup 2026
-

 Video2 days ago
Bitcoin: We’re Entering The Most Dangerous Phase
-

 Tech4 days ago
Luxman Enters Its Second Century with the D-100 SACD Player and L-100 Integrated Amplifier
-

 Video5 days ago
The Final Warning: XRP Is Entering The Chaos Zone
-
 Tech2 days ago
The Music Industry Enters Its Less-Is-More Era
-

 Sports2 days ago
GB's semi-final hopes hang by thread after loss to Switzerland
-

 Crypto World1 day ago
Can XRP Price Successfully Register a 33% Breakout Past $2?
-

 Business18 hours ago
Infosys Limited (INFY) Discusses Tech Transitions and the Unique Aspects of the AI Era Transcript
-

 Video1 day ago
Financial Statement Analysis | Complete Chapter Revision in 10 Minutes | Class 12 Board exam 2026
-

 Entertainment4 hours ago
Kunal Nayyar’s Secret Acts Of Kindness Sparks Online Discussion
-
 Crypto World5 days ago
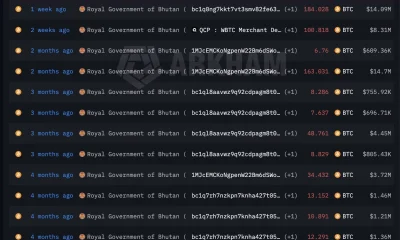
Bhutan’s Bitcoin sales enter third straight week with $6.7M BTC offload
-

 Tech9 hours ago
Retro Rover: LT6502 Laptop Packs 8-Bit Power On The Go
-
 Crypto World7 days ago
Pippin (PIPPIN) Enters Crypto’s Top 100 Club After Soaring 30% in a Day: More Room for Growth?
-

 Video7 days ago
Prepare: We Are Entering Phase 3 Of The Investing Cycle
-
 NewsBeat3 days ago
The strange Cambridgeshire cemetery that forbade church rectors from entering
-

 Business6 days ago
Barbeques Galore Enters Voluntary Administration
-

 Business10 hours ago
Tesla avoids California suspension after ending ‘autopilot’ marketing
-
 Crypto World6 days ago
Ethereum Price Struggles Below $2,000 Despite Entering Buy Zone
-
 NewsBeat3 days ago
Man dies after entering floodwater during police pursuit
-

 Crypto World5 days ago
Kalshi enters $9B sports insurance market with new brokerage deal