
Crypto World
XRP price breaks falling channel as bulls target $1.53

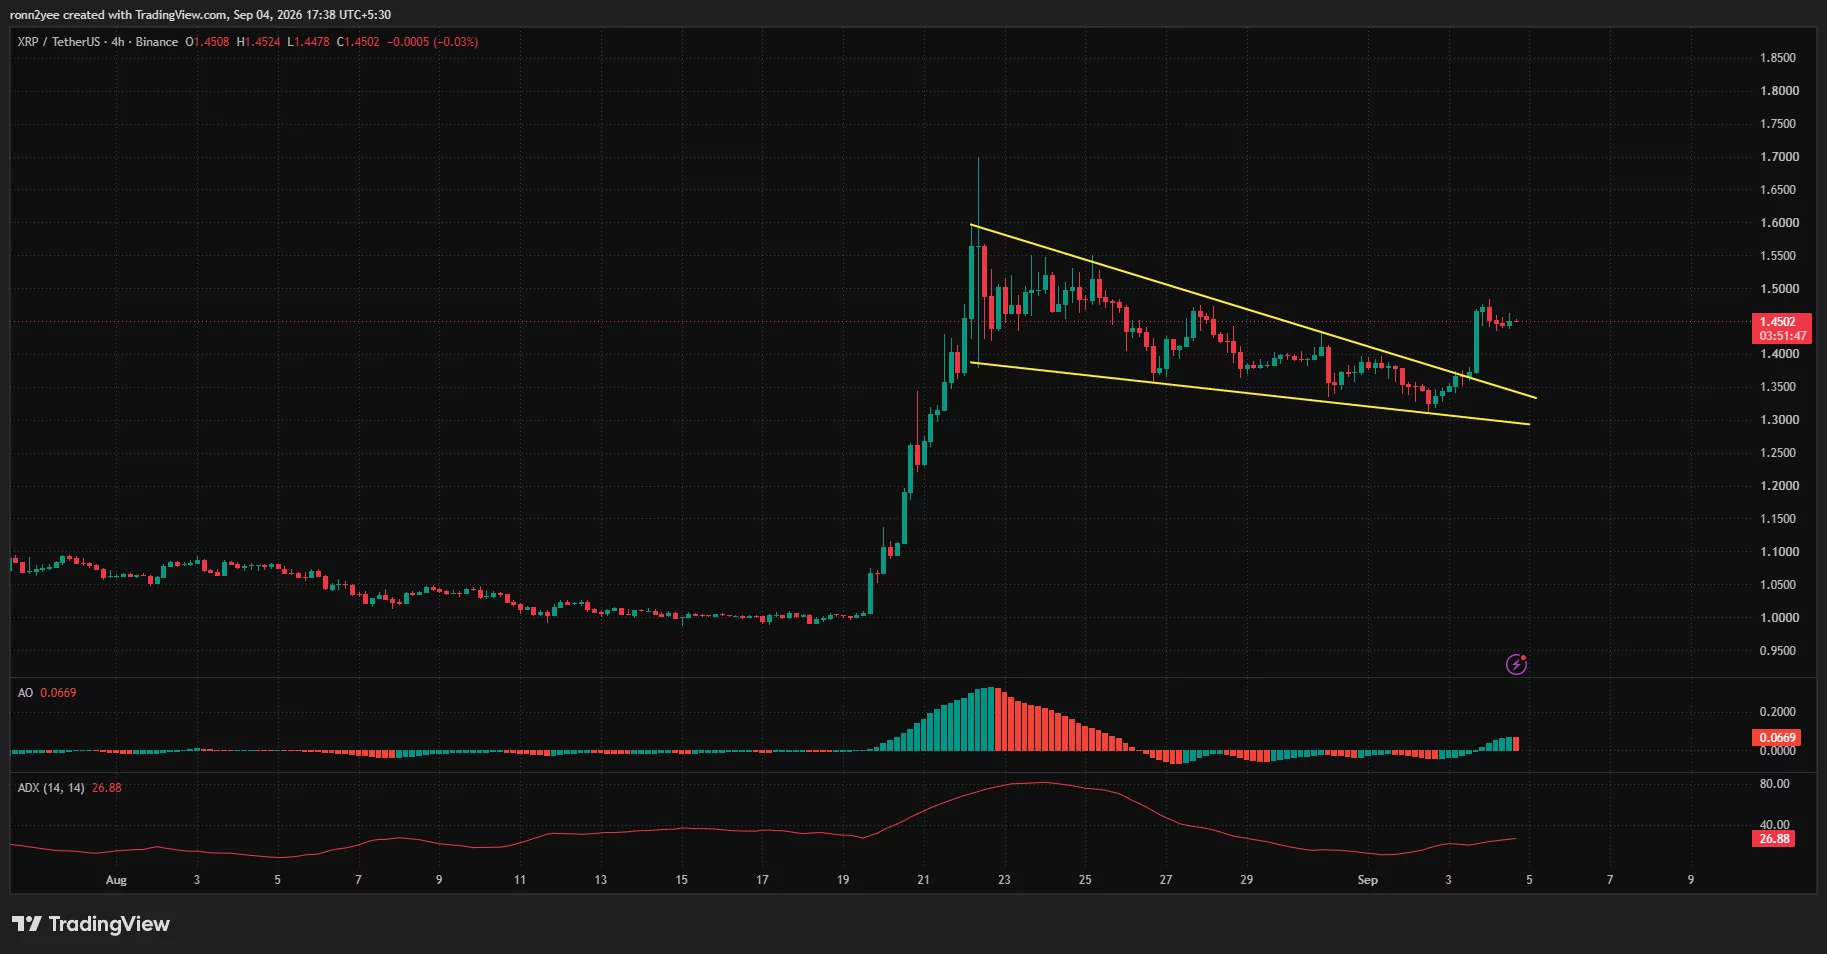
XRP price traded near $1.45 on Sept. 4 after breaking above a falling 4-hour channel, but resistance between $1.50 and $1.53 remains the next test for buyers.
Summary
- XRP price broke above a descending 4-hour channel after rebounding from support near $1.33.
- Daily RSI stands at 66.22, showing strong momentum without reaching the 70 overbought level.
- Liquidation clusters sit near $1.43 below price and between $1.48 and $1.53 above it.
- The Sept. 15 CLARITY Act vote and US inflation data could determine the next move.
XRP price action today
According to data from crypto.news, XRP (XRP) price was changing hands near $1.45 on Friday, consolidating after a sharp recovery from its early September low near $1.33.
The token briefly reached approximately $1.47 during the latest advance before losing some momentum. Even so, the pullback has remained shallow compared with the size of the breakout.
XRP’s 4-hour chart shows that price has moved above the upper boundary of a descending channel that had guided the market lower since its Aug. 22 rally. The channel formed after XRP spiked to a local high near $1.70 and then recorded a series of lower highs and lower lows.
The breakout occurred near $1.37 and was followed by a rapid move above $1.45. XRP is now holding above the former channel resistance, leaving the short-term bullish structure intact while that level remains defended.
The Awesome Oscillator stands at 0.0669 and continues to print positive bars. The reading indicates that short-term momentum remains stronger than longer-term momentum, although the latest bars show that the initial acceleration may be slowing.
The Average Directional Index has climbed to 26.88. An ADX reading above 25 normally points to a developing directional trend, giving the channel breakout more weight than a move occurring under weak trend conditions.
XRP faces resistance at $1.50 and $1.53
The first major barrier sits between $1.48 and $1.50, where XRP repeatedly struggled to hold gains following its August surge. A 4-hour close above the zone could allow buyers to challenge the descending channel’s starting area near $1.55.
The daily chart places additional resistance at $1.53. Crypto analyst ChartNerd identified that level as XRP’s 50-week exponential moving average, while the 20-week EMA sits much lower at approximately $1.28.
According to ChartNerd, XRP remains inside a large weekly compression range between the two averages. The analyst said a convincing move above the 50-week EMA could open the way toward $1.80, while repeated weekly closes below it would raise the risk of a deeper retracement.
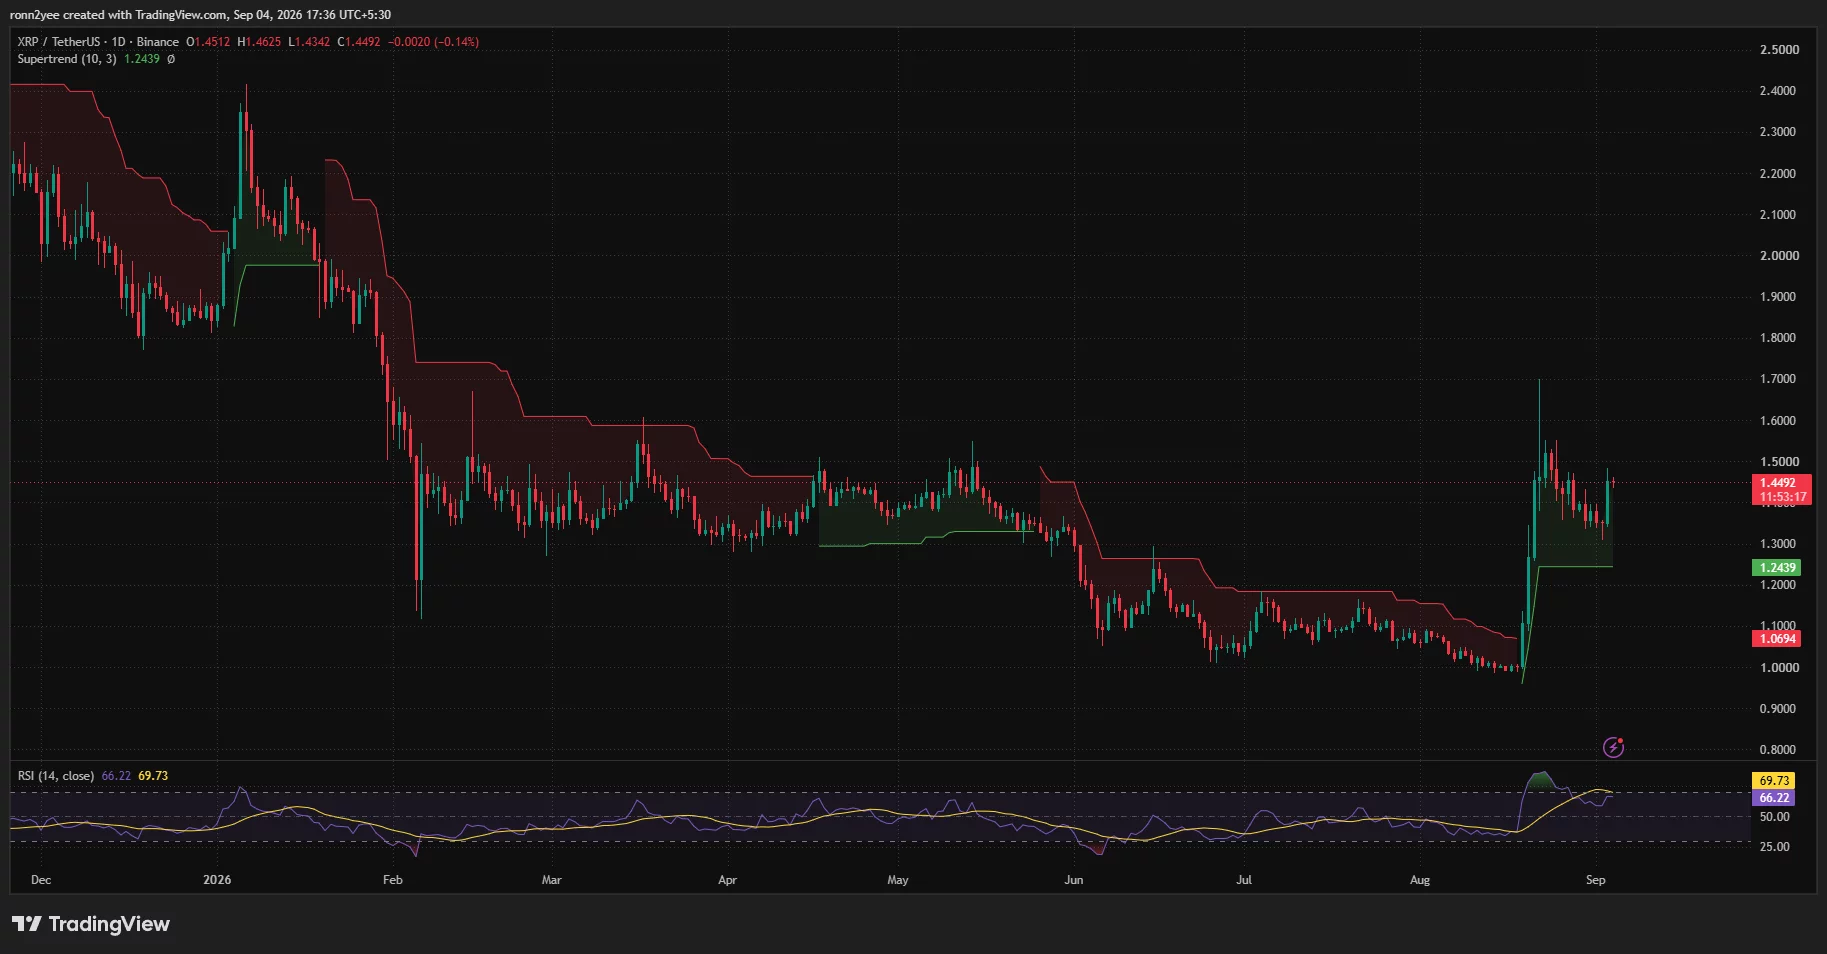
Daily momentum supports another resistance test but also calls for some caution. XRP’s 14-day Relative Strength Index is at 66.22, below its signal average of 69.73 and just under the conventional overbought threshold of 70.
The reading shows that buyers still control the broader move, although momentum has cooled since XRP reached $1.70. A push above 70 alongside a price close over $1.53 would provide stronger confirmation that the recovery is extending.
Liquidation map puts $1.43 support in focus
CoinGlass’ three-day XRP liquidation heatmap shows the nearest large concentration of leveraged positions around $1.425 to $1.435. That liquidity sits just below the current market price and could attract a short-term sweep if XRP fails to hold $1.45.
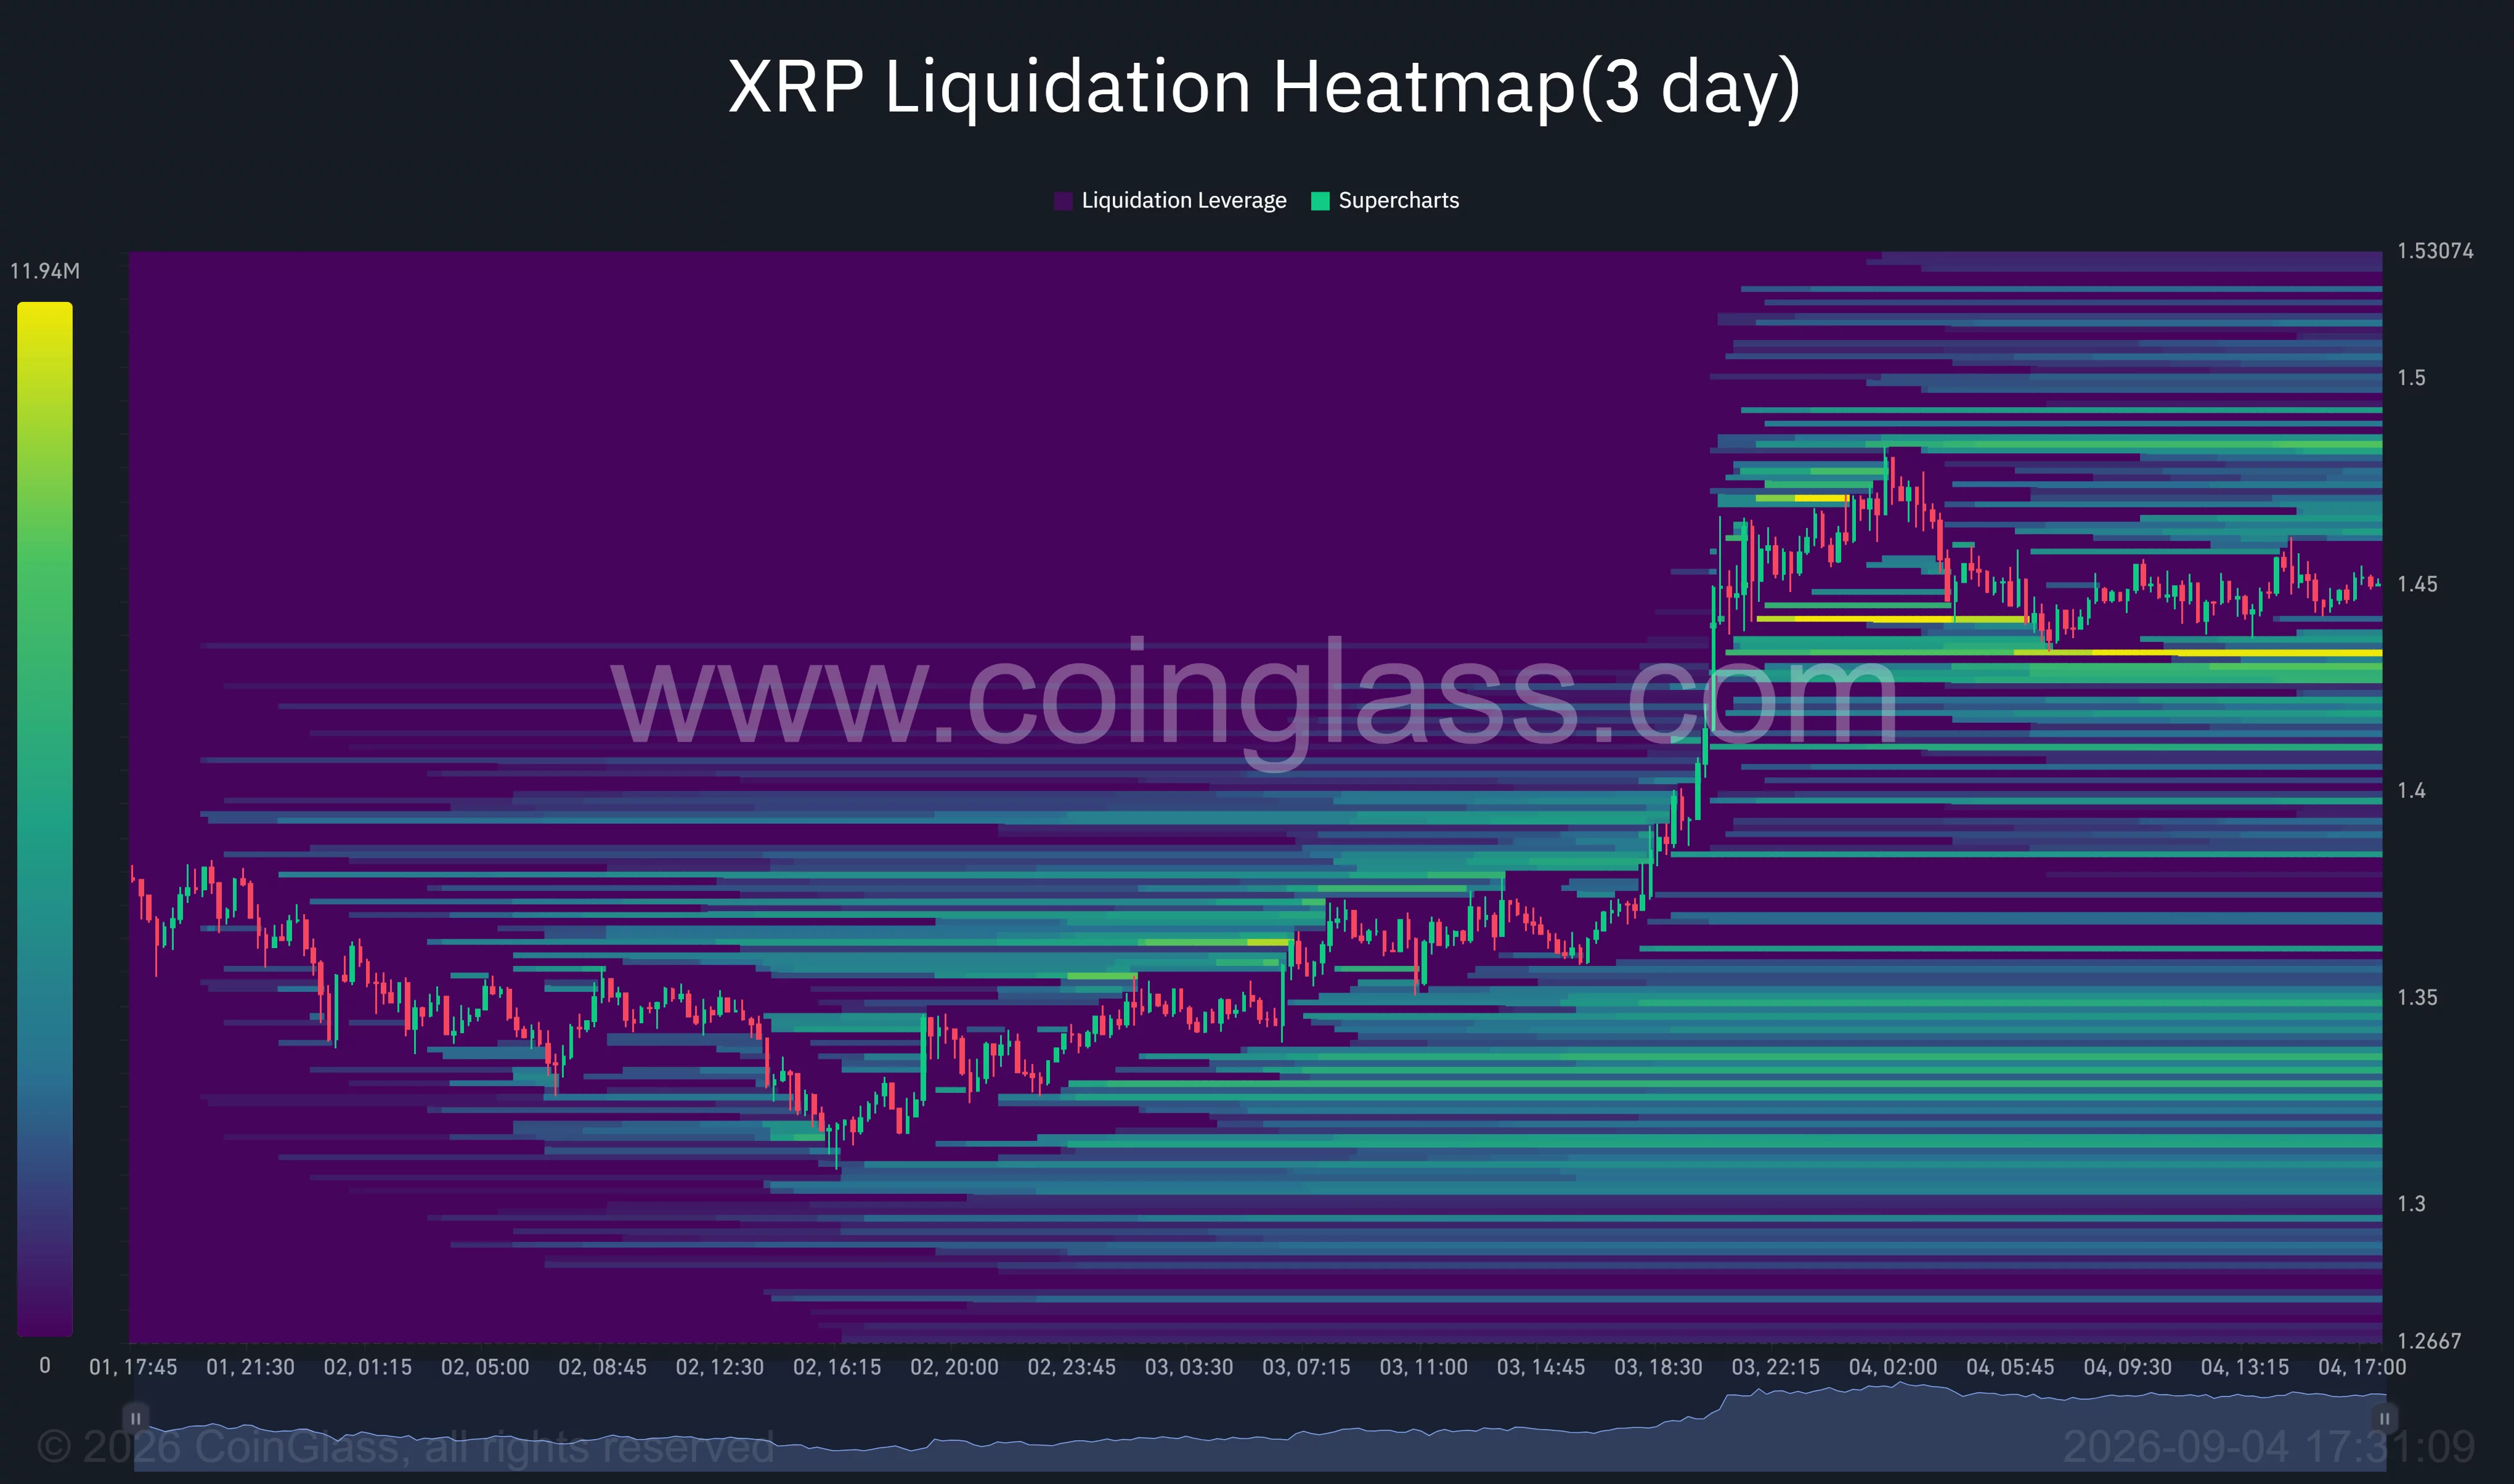
Further downside liquidity is spread across $1.40 and $1.37. The latter level is especially important because it overlaps with the former 4-hour channel resistance. A retest that holds above $1.37 would preserve the breakout structure.
A move below $1.37, however, would place the lower end of the former channel near $1.30 back in play. The daily Supertrend provides a wider structural support level at $1.2439, close to ChartNerd’s 20-week EMA near $1.28.
Above the market, liquidation positions are concentrated from approximately $1.48 to $1.53. A break into that zone could force short sellers to close their positions, adding market buy orders and potentially accelerating the move.
The heatmap does not guarantee that the price will reach either pool. It instead identifies areas where leveraged positions may be vulnerable if volatility increases.
Analysts see higher targets if the breakout holds
A separate analysis published by trader CW said XRP’s previous correction ended near the 0.5 Fibonacci retracement level. The token has since recovered above the 0.618 retracement, according to the analyst’s chart.
CW placed the next extended target at approximately $2.135, corresponding to the 1.618 Fibonacci extension. Reaching it would require XRP to clear several nearer barriers, including $1.50, $1.53, the August high near $1.70, and ChartNerd’s $1.80 target.
The nearer levels carry more importance for the current setup. A sustained move above $1.53 would complete the next stage of the breakout, while rejection could keep XRP confined between roughly $1.37 and $1.50.
US catalysts could raise XRP volatility
US-listed spot XRP exchange-traded funds recorded $110.49 million in net inflows during the week ending Aug. 28, their strongest weekly result of 2026. The figure followed an earlier increase in XRP ETF activity, with cumulative inflows reaching approximately $1.6 billion.
Traders are also watching the Senate’s Sept. 15 procedural vote on the CLARITY Act. The cloture motion requires 60 votes to advance and would end debate on the motion to proceed rather than pass the bill itself. The legislation could affect how US regulators divide oversight of digital assets.
Federal Reserve policy represents another near-term risk. Fed Governor Christopher Waller said on Sept. 3 that three-month core inflation had fallen from 4.76% in February to 3.05% through July.
Waller said he would support leaving rates unchanged if incoming inflation data confirms the cooling trend, but he did not rule out a hike if price pressures return. The August inflation report and the Fed’s Sept. 15–16 meeting could therefore influence liquidity across XRP and the wider crypto market.
For now, XRP’s 4-hour breakout favors buyers above $1.37. A close over $1.53 would strengthen the case for $1.70 and $1.80, while a loss of $1.37 would expose the $1.30–$1.24 support region.
Disclosure: This article does not represent investment advice. The content and materials featured on this page are for educational purposes only.

Robinhood Chain has stopped producing blocks for more than 14 minutes, preventing the Ethereum layer-2 network from confirming token transfers and smart contract transactions.
Summary
- Robinhood Chain stopped producing blocks for more than 14 minutes at around 12:57 p.m. UTC.
- Transfers and smart contract calls remained pending until block production resumed intermittently.
- Robinhood has not disclosed the cause or provided a detailed account of the disruption.
- HOOD shares fell as much as 5.1% from their previous close before recovering part of the loss.
Robinhood Chain stopped confirming transactions
Robinhood Chain block explorer data showed that the network stopped adding blocks at around 12:57 p.m. UTC on Sept. 4, leaving submitted transactions without confirmation for more than 14 minutes.
Transfers, smart contract calls, and router interactions could not move forward while the chain remained at the same block height. New transactions continued to appear in the explorer, but several stayed pending because the network was not producing blocks to process them.
News aggregator Aggr News was among the first to report the interruption on X.
Block production later restarted, although explorer records showed uneven activity during the first stage of the recovery. Robinhood had not disclosed the cause of the halt or published a technical account of the event at the time of reporting.
The company also had not provided a specific recovery schedule. Its main status page did not list an incident for the chain, leaving the explorer as the main public source for tracking whether blocks were being produced consistently.
No report indicated that balances were lost during the interruption. Transactions submitted while production was paused could not receive on-chain confirmation until the sequencer began creating blocks again.
A sequencer halt froze Robinhood Chain activity
As crypto.news explained in July, Robinhood Chain is an Ethereum layer-2 network built with Arbitrum Orbit technology. It runs transactions outside Ethereum’s main execution layer and posts data back to Ethereum.
Robinhood launched the public mainnet on July 1 with 95 tokenized stocks and access through Robinhood Wallet in more than 120 countries. The chain uses ETH for transaction fees and supports Ethereum-compatible wallets, applications, and smart contracts.
According to the network explainer, Robinhood Chain relies on a sequencer to order transactions and produce blocks. When the sequencer stops, users can submit transactions, but the network cannot confirm or settle them until block production returns.
Robinhood Chain normally produces blocks every 100 milliseconds. At that speed, a 14-minute interruption represents approximately 8,400 expected block intervals without normal production.
The halt affected blockchain activity rather than Robinhood’s conventional brokerage system. No evidence showed that customers lost access to U.S. stocks, exchange-traded funds, options, or other assets held in standard Robinhood brokerage accounts because of the chain interruption.
Block production is especially important for decentralized finance users. Without new blocks, traders cannot complete swaps, transfer collateral, repay loans or interact with smart contracts, even when their wallets continue displaying previously recorded balances.
Tokenized stock activity had climbed before the outage
The interruption arrived after a sharp increase in trading activity across Robinhood Chain. On Aug. 25, the network recorded approximately $945 million in daily decentralized exchange volume, according to a recent network analysis.
Cumulative DEX volume had surpassed $47 billion since the July 1 launch, while its 30-day total reached approximately $15 billion. The data placed Robinhood Chain fifth among tracked networks by 30-day decentralized exchange volume, behind Solana, BNB Chain, Ethereum, and Base.
A separate Sept. 2 report found that RWA-linked trading volume had reached $390 million. By July 27, Robinhood had accumulated approximately 328,000 tokenized-equity holders, equal to around 44% of the 752,000 holders tracked across five large tokenized-stock platforms at the time.
Robinhood represented about $44 million of the tokenized assets in that comparison. Ondo held approximately $857 million, while xStocks accounted for about $487 million, showing that Robinhood’s holder count did not give it the largest value of tokenized assets.
Uniswap has operated as the chain’s primary public automated market maker since launch. Uniswap founder Hayden Adams said in late August that combined stock-token trading volume on Robinhood Chain had reached $1 billion.
Robinhood Chain had also processed more than $12 billion in DEX volume and over 150 million transactions by the end of July, according to figures cited by Bernstein. The research firm used the figures when maintaining an Outperform rating and a $160 price target for Robinhood Markets.
HOOD shares fell as much as 5.1%
During Friday’s U.S. session, Robinhood Markets shares opened at $120.48 after closing at $124.72 on Thursday. HOOD then traded as low as $118.30, representing a decline of approximately 5.1% from the previous close.
Shares later recovered to around $122.81, cutting the daily loss to roughly 1.5%. Robinhood’s market data showed an intraday high of $124.60 and trading volume of 13.96 million shares, compared with an average daily volume of 24.82 million.
Available market data did not establish that the chain outage caused HOOD’s decline. The stock had already traded near $120 in the premarket session when reports of the network interruption appeared.
Friday’s trading also followed a 16.6% rally in HOOD on Thursday, when the stock closed at $124.72. Analyst upgrades and Robinhood’s expanding product range had supported the previous session’s advance.
U.S. investors cannot access Robinhood Stock Tokens
Robinhood Stock Tokens remain unavailable to U.S. residents, even though many of the products track U.S.-listed companies. The company offers the tokens in eligible overseas markets as derivative contracts that provide economic exposure to the referenced securities.
Token holders are not shareholders of record and do not receive voting rights attached to the underlying stock. Robinhood has said that a U.S.-licensed institution holds assets supporting the contracts.
In July, two securities transfer groups asked the SEC to distinguish between issuer-approved tokenized securities and products created by unrelated platforms. Continental Stock Transfer & Trust Company and the Securities Transfer Association said third-party tokens may not establish a direct legal relationship between buyers and the company whose shares determine the token’s value.
The groups also raised concerns about custody, shareholder records, voting, dividends, sanctions checks, and claims during insolvency. They asked the SEC to prioritize issuer-backed structures and impose investor safeguards before granting regulatory relief to unaffiliated stock-token products.
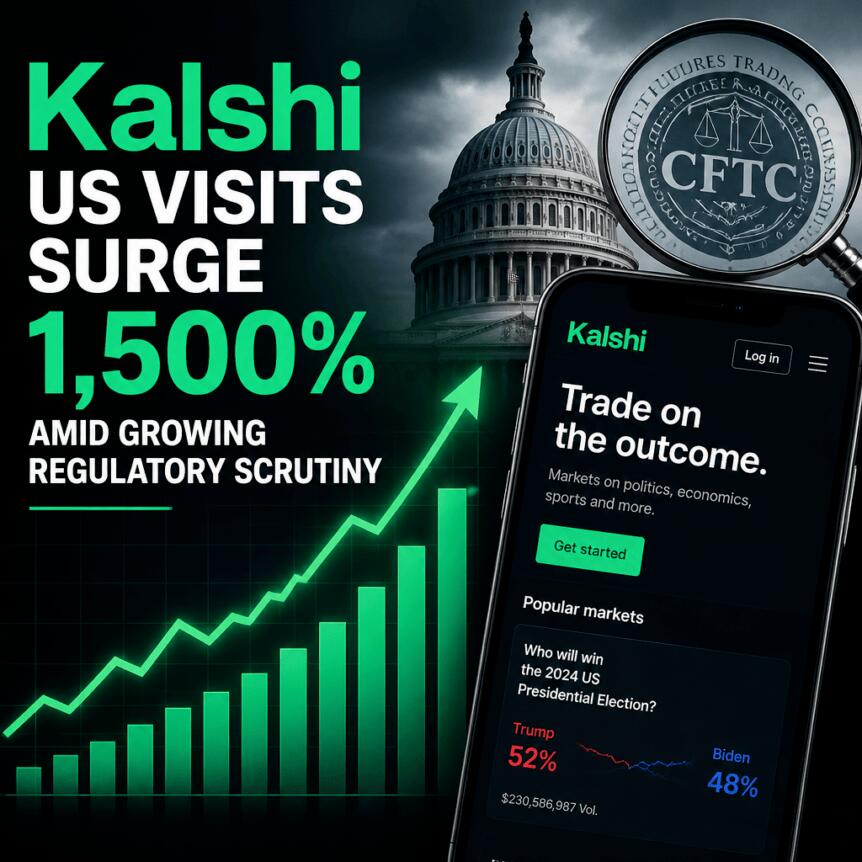
Kalshi’s rapid expansion in the U.S. is showing up clearly in web-traffic data, even as the company’s core business—event and prediction contracts—continues to face mounting legal scrutiny. According to Similarweb estimates reviewed by Cointelegraph, Kalshi logged 15.4 million visits from the United States in July, a dramatic jump from just under 1 million in August 2025.
The U.S. share of Kalshi’s traffic also remains dominant. In July, U.S. visitors accounted for nearly 80% of all visits, up from 72.8% in August 2025—an indicator that Kalshi’s growth is heavily concentrated in one market even as it draws some interest from elsewhere.
Key takeaways
- Kalshi reported 15.4 million U.S. visits in July, up roughly 1,520% from just under 1 million in August 2025, according to Similarweb estimates reviewed by Cointelegraph.
- U.S. traffic made up nearly 80% of Kalshi’s visits in July, rising from 72.8% in August 2025, showing continued concentration in the United States.
- Notional trading volume grew even faster than traffic, reaching about $40 billion in August versus $874 million a year earlier, per Dune Analytics.
- Sports-related contracts represented the majority of Kalshi trading activity in July, with sports accounting for 83% of volume, Barron’s reported.
- Canada and the UK generated meaningful traffic increases despite member-agreement restrictions, Cointelegraph reports it did not receive comment from Kalshi.
Traffic spikes, but trading is scaling faster
Web traffic has accelerated alongside Kalshi’s broader rise in prediction-market activity, but the trading numbers suggest the platform is expanding more sharply in market participation than in simple interest. Dune Analytics’ prediction market dashboard indicates Kalshi reached roughly $40 billion in monthly notional trading volume in August, compared with $874 million a year earlier—an increase of about 4,500%.
That same period also saw volume grow across the wider prediction-market sector, with monthly notional volume rising to $50.7 billion from about $2 billion. Kalshi accounted for nearly 79% of that latest total, underscoring that its platform has become the center of gravity for the industry’s trading flows as activity expands.
The composition of those trades matters, too. Barron’s reported Thursday that sports contracts were responsible for 83% of Kalshi’s trading volume in July. That detail is especially relevant given the legal backdrop: the dispute over whether certain contracts are regulated under federal authorities versus state gambling frameworks has repeatedly focused on the nature of the underlying events and how they should be classified.
Legal pressure remains tied to sports event contracts
Kalshi’s growth is unfolding while regulators and courts argue over the boundaries of oversight for prediction markets. The company’s expansion has been followed by increasing legal attention to whether its sports contracts are subject to federal supervision or fall within state gambling restrictions.
Earlier, Cointelegraph highlighted the fact that New Jersey has taken the dispute to the U.S. Supreme Court. The timing of Kalshi’s traffic and trading surge—at a moment when the legal process is still actively shaping how the business can operate—adds a layer of risk management pressure for users and counterparties watching what regulatory outcome could change market access.
Restricted jurisdictions still generate growing interest
Kalshi’s growth outside the United States is more modest, but the data shows that additional regions are contributing more visits than a year earlier. Canada generated about 450,000 visits in July, up from roughly 50,000 in August 2025. The UK increased to 296,000 visits from 31,000 over the same period.
These increases are notable because Kalshi’s member agreement currently prohibits users in certain jurisdictions from directly accessing or trading on the platform. Cointelegraph points to Kalshi’s published terms, which include restrictions on direct access and trading for members in jurisdictions where participation is not permitted.
In Canada’s case, Kalshi has also pursued an access pathway through partnerships. The company partnered with Canadian financial services firm Wealthsimple in June to provide access to nearly 4,000 eligible Kalshi contracts via a separate app. That arrangement may help explain why visits from Canada and other regions can rise even when direct platform participation is restricted.
Still, the traffic mix shifted in ways that complicate any simple read of demand. From August 2025 to July 2026, Canada’s share of Kalshi traffic slipped to 2.3% from 3.8%, while the UK’s share fell to 1.5% from 2.4%—even as visits from both countries increased in absolute terms. In other words, the rest of Kalshi’s user base grew so quickly that Canada and the UK lost relative share, despite higher traffic levels.
Cointelegraph said it reached out to Kalshi for comment about the traffic patterns from restricted jurisdictions, but did not receive a response by publication.
What investors and users should watch next
Kalshi’s surge in both U.S. attention and notional trading volume suggests demand for prediction contracts is scaling quickly, particularly in sports-linked markets. The next key variable is whether the legal pressure around classification and regulatory authority produces operational constraints—or clarity—that could affect market access and how quickly growth in restricted or regulated categories can continue.
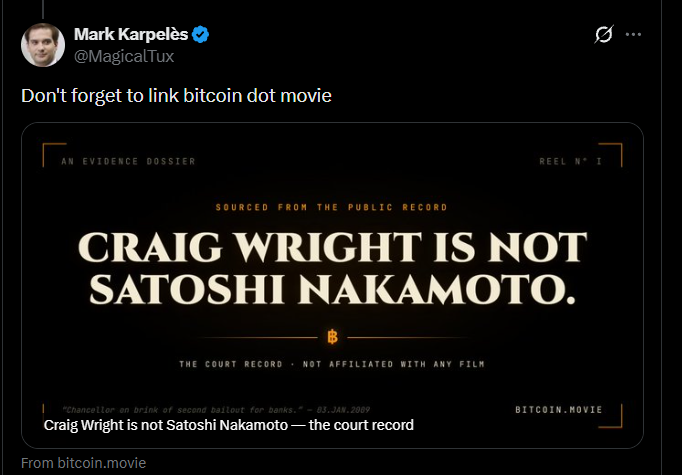
The Bitcoin movie, now in post-production, tells Craig Wright’s version of the Satoshi Nakamoto story. Former Mt. Gox chief Mark Karpelès answered by pointing viewers toward the court record instead.
Doug Liman directs the $70 million production. Casey Affleck plays Wright, while AI versions of Mark Zuckerberg, Jeff Bezos, and Jack Dorsey appear on screen. Gal Gadot, Calvin Ayre, Pete Davidson and Isla Fisher are star casts of the movie.
Why the Bitcoin Movie Splits Bitcoiners
Karpelès, who ran Mt. Gox until its 2014 collapse, replied to a thread mocking Wright’s supporters. His instruction was blunt. He told readers to link bitcoin.movie.

That page names no author. However, it leans entirely on public judgments, and it argues that the film inverts what judges actually found.
Artificial intelligence built the sets. Actors performed on a bare stage while software generated the environments, which producer Ryan Kavanaugh calls a big cost saving.
The timing matters. Bitcoin’s origin story keeps returning to the headlines, and each fresh claim travels fast. In April, a New York Times investigation named Blockstream CEO Adam Back, who denied it. Back has since challenged recent Satoshi documentary claims and the weight placed on early Bitcoin forum posts.
What the Court Actually Found
The Bitcoin movie frames Wright as a man hunted by powerful enemies. In 2024, however, the High Court of England and Wales ruled that he did not write the Bitcoin white paper and did not create the network. Mr Justice Mellor found forgery on a grand scale.
“Dr Wright lied to the Court extensively and repeatedly.” Mr Justice Mellor, judgment.
A contempt finding followed in December 2024. Wright drew a suspended 12-month sentence after filing a £900 billion claim against Bitcoin developers and companies.
Wright also has a history with Karpelès. In 2020, his lawyers claimed ownership of coins sitting in two hacked Mt. Gox wallets.
Despite that record, Wright still posts. His recent governance critique argued that Bitcoin’s base rules should never change.
Calvin Ayre, Wright’s longtime financial backer, reportedly helped fund the film. That gives the money behind the production a stake in the claim it dramatizes. Sellers pitched it at the Cannes market in April. No distributor has signed on since, so no release date exists.
Bitcoin’s origin story has drawn claimants, documentaries and lawsuits for years. Now it draws Hollywood money as well. The Bitcoin movie adds another version of events, not an answer.
The post Is Craig Wright Satoshi? A $70 Million Movie and a High Court Judge Disagree appeared first on BeInCrypto.


Pendle has launched its first yield-trading market on Robinhood Chain, giving sNET holders access to fixed and variable yield positions until the market matures on Sept. 17, 2026.
Summary
- Pendle has deployed on Robinhood Chain with sNET as its first supported market.
- The sNET market will let users separate and trade principal and future yield.
- Robinhood Chain launched on July 1 as an Ethereum Layer 2 built with Arbitrum technology.
- Pendle held about $1.23 billion in total value locked at the time of reporting.
Pendle opens its first Robinhood Chain market
Pendle said in a Sep. 4 announcement that its protocol is now live on Robinhood Chain, adding fixed-yield products and yield trading to the network’s decentralized finance ecosystem.
The deployment begins with one sNET market scheduled to mature on Sept. 17. Pendle did not identify the assets planned for subsequent markets or provide a timetable for adding them, saying only that more products would arrive as the ecosystem develops.
Issued by NetNet Capital, sNET is the staked form of NET, a reserve-backed token native to Robinhood Chain. NetNet’s public materials describe the protocol as a reserve manager for NET, with a treasury containing assets that include the USDG stablecoin. Users who stake NET receive sNET and become eligible for distributions generated under the protocol’s staking model.
NetNet also uses bond sales to acquire assets for its treasury. Its model draws from reserve-backed token systems in which market participants exchange selected assets for discounted NET, while the protocol controls the deposited liquidity. NetNet has described USDG as one of the assets held in the treasury, although the value of NET and returns from sNET remain exposed to the protocol’s reserves, market structure and smart contracts.
Adding sNET to Pendle allows traders to separate the asset’s principal from the yield it may generate before Sept. 17. The structure turns a single yield-bearing position into components that users can trade according to their expectations for future returns.
How Pendle splits sNET principal and yield
According to Pendle’s documentation, the protocol wraps supported yield-bearing assets through its Standardized Yield format before dividing a position into Principal Tokens and Yield Tokens.
A Principal Token, commonly shown as PT, represents the underlying principal that becomes redeemable when the market reaches maturity. PT can also trade before that date, allowing a buyer to purchase the future principal at the prevailing market price.
Yield Tokens, or YT, provide the right to yield generated by the underlying asset until maturity. Holders can claim accrued returns through Pendle’s interface, but YT stops earning once the market expires. Its remaining value, therefore, declines as maturity approaches unless changes in the underlying rate or incentives support demand.
For the sNET market, the Sept. 17 date establishes when PT becomes redeemable and YT stops collecting returns. Traders who buy PT can seek an implied fixed return by holding the position through maturity, while YT buyers take exposure to changes in sNET’s yield during the remaining term.
Pendle calculates the implied annual percentage yield from the relative prices of PT and YT. Although the platform describes the rate available through PT as a fixed APY, its terms state that the figure is an implied annualized return based on the purchase price and an assumption that the position remains open until maturity. It is not a contractual guarantee.
Buying YT can amplify exposure because a trader pays for the yield component rather than the full underlying asset. Pendle warns in its documentation that long-yield returns can be negative when the income collected before maturity falls below the amount paid for YT.
Liquidity providers face a different mix of returns. Pendle says its pools contain PT and Standardized Yield assets, with providers potentially receiving swap fees, underlying yield, an implied return from PT, and protocol incentives where available.
Robinhood Chain adds another DeFi protocol
Robinhood opened the chain’s public mainnet on July 1 as a permissionless Ethereum Layer 2 built using Arbitrum technology. The network uses ETH for transaction fees, supports Ethereum-compatible wallets, and posts transaction data to Ethereum.
Its first group of infrastructure and trading partners included Uniswap, Pleiades, Alchemy, BitGo, and Chainlink. Robinhood said the network was designed for tokenized financial assets, lending, trading, and applications that can use real-world assets inside smart contracts.
Robinhood Crypto executive Johann Kerbrat said during the mainnet announcement that decentralized finance had offered functions unavailable in traditional markets but had historically required technical knowledge to use.
“We’re bringing the best of traditional finance and DeFi together, and in doing so, expanding financial ownership to every corner of the globe.”
Activity grew quickly after the launch. As crypto.news previously reported, Robinhood Chain processed about $945 million in decentralized exchange volume on Aug. 25, up from its former daily record of $563 million on July 8. Cumulative DEX volume exceeded $47 billion in less than two months, while total value locked reached roughly $1.4 billion by late August.
Uniswap has served as a major liquidity venue since the mainnet opened. In August, its stock-token volume passed $1 billion, covering combined swaps across several tokenized equities rather than deposits or activity from a single asset.
Robinhood Chain generated $4.01 million in application revenue from $4.45 million in fees on Sept. 2, according to a recent revenue report. The DeFiLlama snapshot placed it above Solana, Ethereum and Tron for the measured day, although much of the fee activity came from trading applications and memecoin platforms rather than tokenized stocks.
Robinhood has covered gas costs for eligible transactions completed through Robinhood Wallet during a 90-day promotion that began with the mainnet launch. The subsidy is scheduled to end around Sept. 29, while people using third-party wallets already pay network fees in ETH.
U.S. access depends on the product
Robinhood describes its blockchain as permissionless, meaning users can connect with supported self-custody wallets without opening a Robinhood brokerage account. The company also states that activity on the network remains separate from investments and balances held through its brokerage and centralized crypto services.
Product restrictions still apply at the application and asset levels. Robinhood says its Stock Tokens are unavailable to U.S. residents even though they track companies listed on American exchanges, including Apple, Alphabet, and Nvidia.
Stock Tokens are debt securities issued by Robinhood Assets Jersey Limited and provide economic exposure to referenced securities. Robinhood’s disclosures state that token holders do not gain legal or beneficial ownership of the underlying shares, including shareholder voting rights.
Pendle’s announcement did not say whether its sNET market carries geographic restrictions or whether Robinhood Wallet will surface the product directly to American users. Access through the permissionless network does not establish that a particular interface or financial product is legally available in every jurisdiction.
Pendle expands its multichain presence
Before the Robinhood Chain deployment, Pendle operated across networks including Ethereum, Arbitrum, BNB Chain, Base, Mantle, Optimism, HyperEVM, Monad and Plasma. Its earlier Plasma expansion introduced five markets tied to assets such as USDe, sUSDe, USDai, and syrupUSDT.
DefiLlama data showed approximately $1.23 billion locked across Pendle products at the time of reporting, with Ethereum accounting for more than half of the total. The data provider also recorded about $542 million in Pendle decentralized exchange volume during the previous 30 days.
PENDLE traded near $1.90 on Sept. 4, rising about 1.2% over 24 hours and 9.1% across seven days. Its market capitalization stood near $327 million, based on roughly 172 million tokens in circulation.
NetNet’s NET changed hands near $1,012 on the same day, according to CoinGecko, after trading between approximately $863 and $1,371 over 24 hours. The data provider placed its circulating market capitalization near $4.5 million and identified NET-USDG on Uniswap V4 as its most active trading pair.


Billionaire Nvidia director Mark Stevens sold $410.84 million of the chipmaker’s stock across three days this week and didn’t even bother to note any predetermined trading plan or reason for his disposal.
It was the largest insider Nvidia stock sale in history by dollar value, clearing the previous record by $175 million.
He disclosed his sales on a single SEC Form 4 with his Third Millennium Trust executing seven separate transactions. Stevens and his wife are co-trustees of Third Millennium Trust.
Stevens’ trust sold 585,000 NVDA shares on Monday, 63,501 on Tuesday, and 1.2 million on Wednesday. All told, Stevens disposed of 1,848,501 NVDA at a weighted average price of $222.26, netting him approximately $411 million.
CEO Jensen Huang has sold more absolute stock across a much longer time period — $713 million from June 14 through September 12, 2024 — but across a contiguous series of days, Stevens sold the most this week.
Moreover, as discussed below, he has filed his intention to imminently dump even more shares.
His three-day selling spree exceeds all other NVDA insider sales that Protos staff could electronically retrieve from the SEC website as well as the insider trading monitoring services OpenInsider and InsiderScreener.
Interestingly, electronic SEC Form 4 filing became mandatory only in mid-2003, and Nvidia IPO’d in 1999.
Stevens’ massive sales overtook the self-enrichment record from Tench Coxe, another Nvidia director who took the record with a 2024 sale. Coxe’s September 2024 filing reported $235.74 million of stock sales across two days.
Stevens sold 74% more this week. And he might be selling even more.
Read more: Crypto miners blamed for Nvidia GPU price hikes — again
An Nvidia insider selling record, with plans to sell more
Separately, Stevens notified the SEC on Wednesday of an additional proposed sale of up to $1.09 billion more NVDA, which would shatter his own record earlier this week.
For these additional 5 million shares, he named Merrill Lynch as broker with Stevens’ Third Millennium Trust and his 970 Foundation as sellers.
Importantly, the 970 Foundation is a registered charity, so any of its sales would not go to Stevens personally. Stevens form didn’t specify the mix of proposed shares from Third Millennium Trust relative to the 970 Foundation.
Wednesday’s Form 144 records his entities’ intention to sell. It allowed him to sell as early as September 2, but it doesn’t establish that all 5 million shares actually sold.
Stevens’ filing did not identify his sales prior to Wednesday as predetermined transactions under a SEC Rule 10b5-1(c) trading plan. That detail, however, doesn’t prove Stevens lacked another grandfathered, pre-2023 trading arrangement.
Got a tip? Send us an email securely via Protos Leaks. For more informed news and investigations, follow us on X, Bluesky, and Google News, or subscribe to our YouTube channel.


Crypto hardware wallet Trezor says it’s “terribly sorry” after revealing today that another 67,000 US users were leaked in last month’s mailing partner breach. This brings the total number of affected users to over 80,000.
Trezor initially revealed last month that the personal details of 13,689 of its customers had been leaked after bad actors infiltrated ShipMonk’s systems.
At the time, Trezor downplayed the scale of the incident by claiming its 90-day data policy, which its partners follow, deleted old user data and helped mitigate the leak.
However, Trezor now claims that this policy was never enforced, and that the data was never deleted.
“Throughout our entire relationship with ShipMonk, we repeatedly requested and received written assurance confirming the deletion of the data, in line with our contract, data policy, and past communications,” Trezor claimed.
Read more: If you filled in a form from Trezor, you may have to change your wallet
It added, “We’re terribly sorry to everyone affected. We take this matter very seriously and are working to ship anonymous delivery ASAP, so you can protect your personal information when placing an order.”
Leaks such as this one can lead to criminals targeting crypto users thanks to the extra information they have at hand to tailor their attacks.
Trezor says it did not expect further leaks
Trezor told Protos that it’s too early to decide what it will do in repsonse to ShipMonk’s actions and that it’s working to arrange an additional audit of the mailing partner.
The company claims that on August 10, ShipMonk made it aware of the initial leak that covered orders within the last 90 days. It then informed Trezor on September 2 that the leak actually went back to 2019 and 2021.
“Our understanding is that our cooperation from those years was overlooked when the original scope was established,” Trezor said.
When asked why it took ShipMonk to reveal the further leaks, Trezor claims it had “no reason to expect it” thanks to ShipMonk’s repeated assurances.
Trezor initially reached out to Protos last month to reveal the details of the leak, but it hasn’t done so this time around.
When asked why, it said, “The information is public and it is not behind anything. Our priority was reaching the people actually affected.”
Got a tip? Send us an email securely via Protos Leaks. For more informed news and investigations, follow us on X, Bluesky, and Google News, or subscribe to our YouTube channel.

Three key economic events could shape market sentiment in the second week of September: the ECB interest rate decision, the latest UK GDP data and US inflation figures.
In this video, Gary Thomson looks at what these releases could mean for monetary policy expectations and major currency, gold and equity markets.
👉 Key topics covered:
✔️ ECB Interest Rate Decision — 10 September — Markets are pricing in a 25-basis-point rate hike after Eurozone inflation accelerated to 3.3%. With the move largely expected, the ECB’s guidance on future policy could be more important for the euro.
✔️ UK GDP — 11 September — The UK economy grew by 0.4% in Q2, while June GDP expanded by 0.3%. Could the latest data confirm the resilience of the UK economy or point to a loss of momentum?
✔️ US Inflation — 11 September — US annual inflation slowed to 3.4% in July, while core inflation eased to 2.5%. The latest figures could influence expectations for the Federal Reserve’s next policy move and trigger volatility across USD pairs, gold and equity indices.
With both the ECB and Federal Reserve facing important monetary policy decisions, traders will be watching closely for any signals that could change expectations for future interest rates.
💬 Don’t forget to like, comment, and subscribe for more market insights every week.
Watch it now and stay updated with FXOpen.
This article represents the opinion of the Companies operating under the FXOpen brand only. It is not to be construed as an offer, solicitation, or recommendation with respect to products and services provided by the Companies operating under the FXOpen brand, nor is it to be considered financial advice.


The law enforcement association said it has pivoted its position regarding the Clarity Act to neutral, months after it warned against a law it said would shield crypto crime.
The Dow Jones Industrial Average fell with the Nasdaq reversing direction and slipping into the red in late-morning trade Friday after a stronger-than-expected August jobs report. Several chip names bucked the broader weakness as Nvidia (NVDA) headed higher in a buy zone but Ambarella (AMBA) proved an exception as it stumbled on the stock market today. In morning trade Friday,…
Copyright ©2026 Investor’s Business Daily, LLC. All rights reserved. 87990cbe856818d5eddac44c7b1cdeb8
Crypto World
BTC Stopped at $82K as Strong US Jobs Report Shakes Markets, Strategy Resumes Buying: Weekly Recap
It was another eventful week in the cryptocurrency markets as August closed, with BTC ending in the green for the first time during a bear market, further signaling a major shift in sentiment. However, Friday’s jobs report flipped the script again.
Before we dive into all of that, let’s rewind the clock by a week and see what the landscape was last Friday. Despite briefly surging past $81,000 on a couple of occasions, BTC was quickly halted and driven south to just under $80,000. Most altcoins, though, produced major weekly gains.
The rejection at the time came after the hawkish stance taken by Fed Chair Kevin Warsh, and the leg down drove BTC to just under $77,000 on Saturday morning. However, the asset rebounded swiftly and tapped $79,000 on Sunday. Another leg down to $77,000 took place on Monday morning as the US and Iran initiated new attacks against each other.
The primary cryptocurrency remained volatile in the following few days, but was contained in a relatively tight range between $76,400 and $79,000. It last tested the upper boundary on Wednesday morning, and the bulls managed to defend it. The subsequent leg up came on Thursday and was significantly more successful.
Bitcoin broke out of its $79,000 barrier and surged past $80,000. It kept going during the early hours on Friday and jumped to $82,400 for the first time since mid-May. Although it was stopped there, it remained above $81,000 until earlier today, when the much stronger-than-expected US jobs report came out.
BTC slumped immediately by two grand as the general assumption is that the Fed will be more inclined to raise the hikes at the end of the month. The weekly performance shows a few clear winners – ZEC has gained 20%, and it even surpassed $1,000 earlier today, XMR is up by 10%, while UNI has rocketed by almost 40%.
Market Data

Market Cap: $2.775T | 24H Vol: $121B | BTC Dominance: 57.6%
BTC: $79,270 (-0.35%) | ETH: $2,450 (-2.5%) | XRP: $1.39 (-1.5%)
This Week’s Crypto Headlines You Can’t Miss
Strategy Is Buying Bitcoin Again After 2-Month Pause: Here’s How Much. Monday began with a bang as the world’s largest corporate holder of BTC resumed its purchases for the first time in over two months, accumulating 4,603 BTC for $370 million. The problem for the company is that it sold at low prices only to buy back at much higher levels.
Gold Just Erased All Its August Gains – Bitcoin Is Holding Up Better at $77K. The precious metal exploded alongside BTC in the middle of August, hitting $4,700 for the first time in months. However, it lost all gains, even dipping below its starting price of $4,360 earlier this week. In contrast, BTC is up by roughly 25% even after today’s correction.
Arthur Hayes Says Ignore Warsh and Watch EUR/JPY for Bitcoin’s Next Move. BitMEX’s former CEO believes the Fed and Kevin Warsh are not the most important factors to determine BTC’s next move. Instead, he urged investors to pay more attention to the euro-yen exchange rate.
Trezor Breach Is Much Bigger Than Initially Thought: Another 67,000 Customers Exposed. The hardware wallet manufacturer admitted today that the ShipMonk breach was significantly more worrisome than initially believed. Its latest update showed that the actual number of affected US customers from the data leaks is over 80,000, not 13,689.
Bitcoin Makes History With First-Ever Green August During a Bear Market. As mentioned above, bitcoin ended August in a highly unexpected manner. History suggested that the asset wouldn’t enjoy the eighth month of the year, but reality was much different. BTC closed with a near-25% surge for the first time in bear market years.
Bitcoin Is Back Above $80,000, But Fidelity Says the Bear Market May Not Be Over Yet. The flagship digital asset surged past $80,000, as explained earlier, but analysts at Fidelity weren’t convinced BTC is out of the woods. They outlined some historical references and determined that the bear market might not be over yet.
Charts
This week, we have a chart analysis of Ethereum, Ripple, Cardano, Binance Coin, and Hyperliquid – click here for the complete price analysis.
The post BTC Stopped at $82K as Strong US Jobs Report Shakes Markets, Strategy Resumes Buying: Weekly Recap appeared first on CryptoPotato.

Croydon woman, 20, died after Turkey surgery and emergency plane landing

Jennifer Aniston’s Boyfriend Jim Curtis Opens Up About Decades-Long Battle With Paralysis, Shame

Robinhood Chain suffers 14-minute network outage





-

 Fashion7 days ago
Weekend Open Thread: Maeve – Corporette.com
-

 Crypto World7 hours ago
IMF Says El Salvador’s Post-Review Bitcoin Purchases Used No Public Funds
-

 Crypto World2 days ago
CLARITY Act could advance within weeks, Atkins says
-

 Politics9 hours ago
A new European chapter for Gibraltar
-

 Tech7 hours ago
JLab goes big on new headphones at IFA 2026
-

 Politics7 hours ago
33 Cosy Autumn Home Decor Ideas: Blankets, Pumpkin Decorations, And Candles
-

 Sports8 hours ago
Commanders’ Chig Okonkwo is a top breakout fantasy football candidate
-

 Sports7 hours ago
Alexandre Pato consortium’s Northampton Town investment approved
-

 Crypto World7 hours ago
IMF Says El Salvador’s Bitcoin Buying After Audit Used No Public Funds
-

 Business7 days ago
Onto Innovation Stock: AI’s Next Bottleneck Is Yield (NYSE:ONTO)
-

 Sports11 hours ago
Devon Dampier throws for 3 TDs as No. 21 Utah demolishes Idaho
-
Crypto World11 hours ago
XRP Trading Activity Hits Highest Level Since February as Price Jumps 8%
-
 Crypto World8 hours ago
Bitcoin News: BTC to Gold Ratio Hits 18 as Both Assets Rally
-

 Tech7 hours ago
Project Tube Shot Features Spark II Rocket and the Five-Foot Pipe That Gave a B Motor Extra Sky
-

 Politics7 hours ago
The House Article | When Nigel Farage enters No 10, he will not fall into Whitehall’s trap
-

 Crypto World2 days ago
Elon Musk Says Grok 4.7 Lands in 10 Days and Will Beat Every Model
-

 Tech7 hours ago
US law firm accuses UK AI software firm of unwanted contract renewal when it tried to leave
-

 Sports8 hours ago
Seven wickets in 21 balls: Sri Lanka’s Chamari Athapaththu scripts history with record-breaking spell
-
 Tech6 days ago
Hugging Face built a $4.5 billion empire on free AI models. Now Nvidia is buying it for $12.9 billion
-

 Crypto World7 days ago
Bitcoin price tests $82K resistance as Brandt stays long
You must be logged in to post a comment Login