
Crypto World
XRP Price Prediction: Can $1 Be Reclaimed This Week?



XRP price prediction has it trading at $0.9956, down -0.3% over the past 24 hours after swinging between $0.9897 and $1.0044, a range tight enough to make even patient bulls nervous. The token’s remarkable 635-session streak of closing above $1 nearly snapped twice this month, and today’s print puts it right back on the edge. What happens if that streak finally breaks?
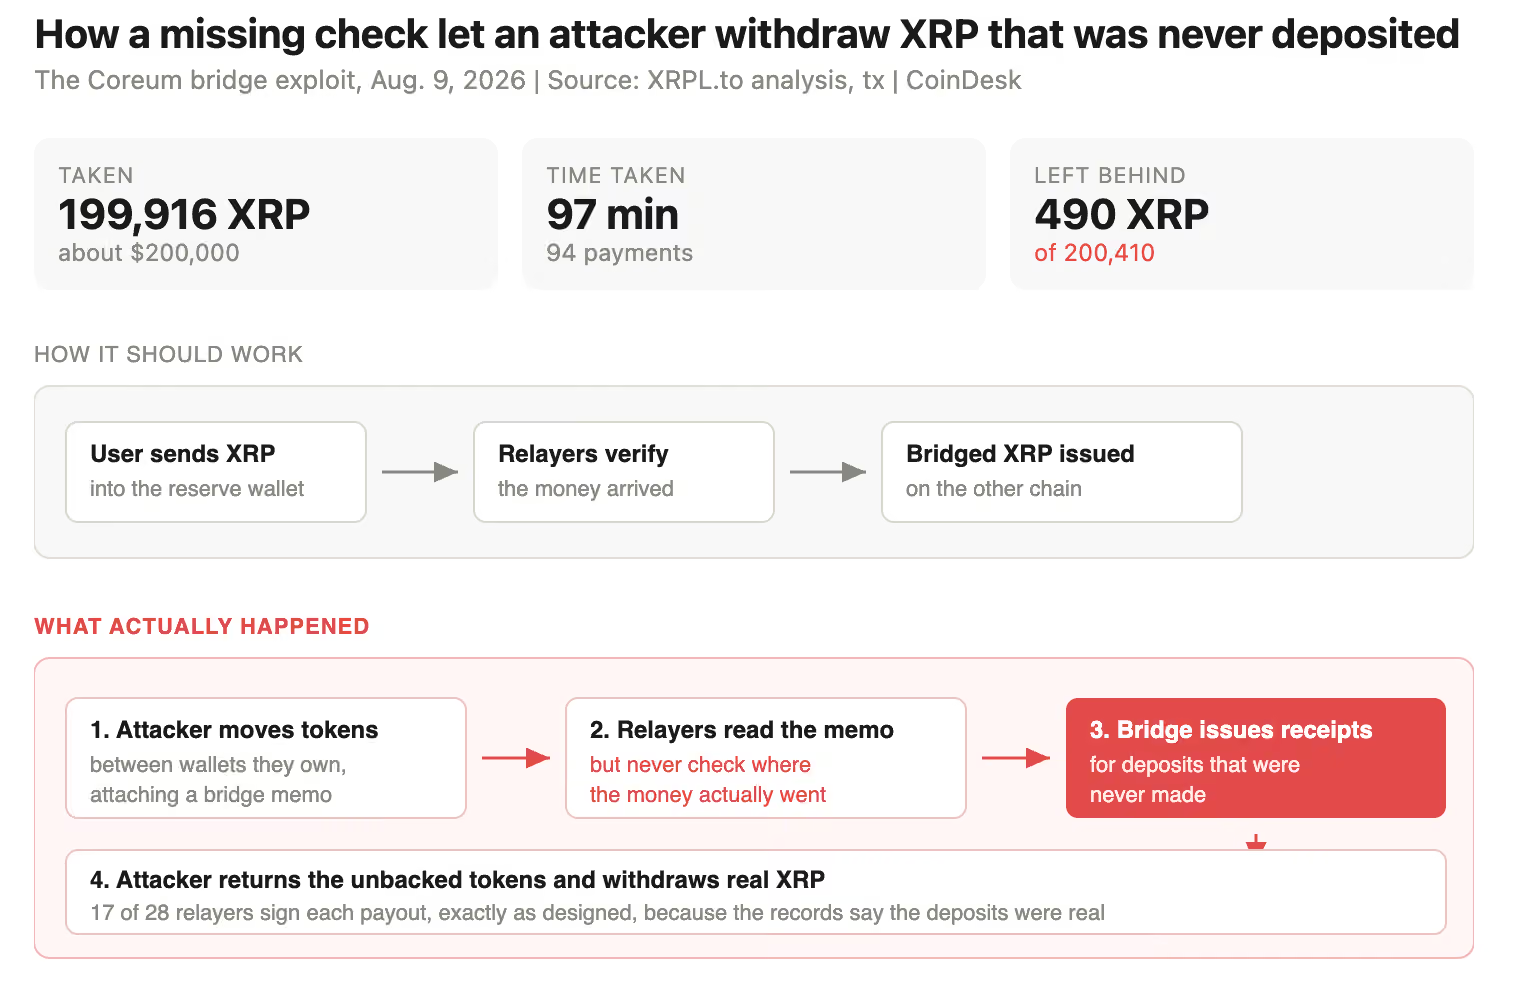
A bridge exploit that drained roughly $200,000 via a connection between the TX Chain and XRP Ledger briefly pushed XRP under $1 on August 11 and again on August 14.
Buyers stepped in both times before the daily close, but the technical damage lingers: XRP’s 50-day EMA now sits below its 200-day EMA, a death cross that confirms sellers have controlled the short to medium-term trend for weeks.
Meanwhile, Wall Street posted a completely different Monday, with the S&P 500 and Nasdaq hovering near highs on AI-driven momentum, a divergence that’s left crypto looking increasingly isolated from broader risk appetite.
Institutional flows tell a more nuanced story, though: recent XRP ETF activity from major players like Jane Street suggests some smart money isn’t fully bailing on the setup, even as retail sentiment sours.
XRP Price Prediction: Can Ripple Hit $1.06 This Week?
At $0.9956, XRP sits almost exactly on its most contested psychological level in a year. The $1.00 zone has functioned as the primary demand area since November 2024, and price has spent most of August oscillating between $1.00 and $1.18, with no decisive break in either direction. Bollinger lower bands cluster around $0.99–$1.01, reinforcing that this is where buyers have consistently shown up.
Bull case: A reclaim of $1.04–$1.06 opens the door to the 50-day EMA zone near $1.09–$1.11, with $1.18 as the next real test.
Base case: continued chop between $0.99 and $1.06 as the market waits for a catalyst.
Bear case: a clean daily close below $1.00 invalidates the floor entirely, with FXLeaders analysis pointing toward $0.80 as the next technical magnet.
Ripple CEO Brad Garlinghouse’s appearance at the Wyoming Blockchain Symposium adds a wildcard; any regulatory clarity commentary could move price fast in either direction.
Traders watching for confirmation should track whether XRP can close above $1.06 on volume before committing to the bull thesis; some analysts have also floated more aggressive 2026 targets, citing whale accumulation and shrinking exchange supply.
Bitcoin Hyper Targets Early Mover Upside as XRP Tests Key Levels
XRP price prediction shows a death cross on the chart and repeated sub-$1 scares, which isn’t confidence-inspiring for anyone holding through this chop. A token that’s already spent two years compounding needs a genuinely new catalyst to break its current range.
And even a clean bounce to $1.18 only recovers ground lost; it doesn’t create new upside. That’s the math pushing traders toward earlier-stage infrastructure plays where the ceiling isn’t already priced in.
Bitcoin Hyper ($HYPER) is positioning itself as the first Bitcoin Layer 2 with full SVM integration, aiming to process transactions faster than Solana itself while inheriting Bitcoin’s underlying security.
The presale has raised $33,032,316.79 at a current token price of $0.0136848, with staking rewards offered at a high APY (exact rate undisclosed).
Its Decentralized Canonical Bridge targets one of Bitcoin’s core limitations, the total absence of programmable smart contracts, without routing through custodial intermediaries.
Visit the Bitcoin Hyper Presale Website Here.
This article is not financial advice. Crypto markets are highly volatile and unpredictable. Always conduct independent research before making investment decisions.
The post XRP Price Prediction: Can $1 Be Reclaimed This Week? appeared first on Cryptonews.

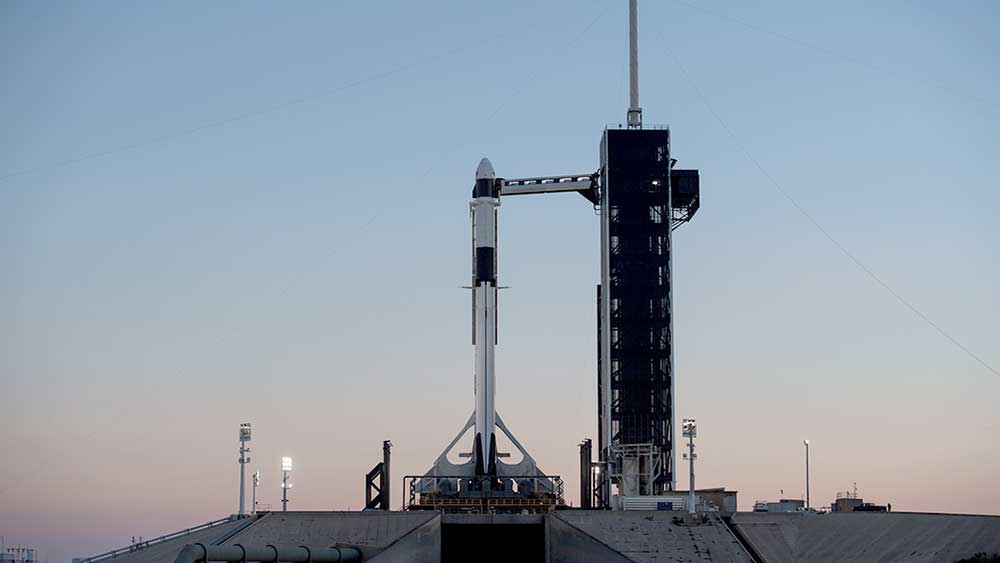
NASA on Monday awarded payload services contracts to Blue Origin, Firefly Aerospace, L3Harris and All Points Logistics for future missions. SpaceX prepares for another Starlink launch tonight. SPCX shares slid on a test of resistance early Tuesday. Space stocks trended lower early Tuesday. NASA on Monday selected All Points Logistics, Firefly Aerospace (FLY), L3Harris (LHX) and Blue Origin, the space…
Copyright ©2026 Investor’s Business Daily, LLC. All rights reserved. 87990cbe856818d5eddac44c7b1cdeb8
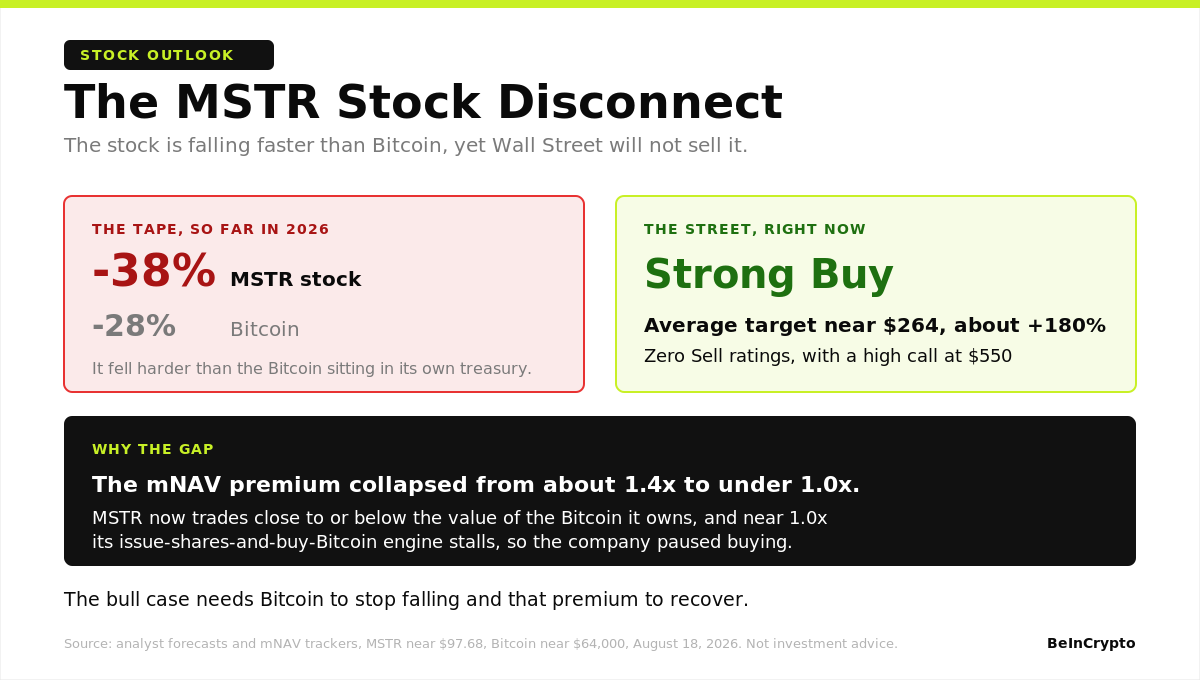
Strategy (MSTR) stock is climbing back toward $100, closing Monday near $97.68 after a 5% jump, even though the Bitcoin behind it has barely moved near $64,000.
The stock is down about 38% in 2026, a steeper fall than Bitcoin’s 28% slide. Yet almost every analyst covering MSTR stock still rates it a Strong Buy. Three forces explain that gap, and they all trace back to one number, a premium called mNAV.

MSTR Stock Has Fallen Faster Than Bitcoin
First, the damage. MSTR has dropped roughly 38% so far in 2026, while Bitcoin, the asset that fills its treasury, is down about 28%. The stock fell harder than the thing it owns.

That is the opposite of what buyers signed up for. Strategy was built to act as leveraged Bitcoin, rising more in rallies, so trailing the coin in a slump is the puzzle the bull case has to solve. But MSTR can still do it without Bitcoin’s help, and 3 reasons explain how.
Reason One, a Premium That Can Rebound
The recovery starts with mNAV, the one number that drives the stock. MSTR is worth the Bitcoin it holds, its net asset value, times a premium investors pay on top, a multiple you can track live. When sentiment runs hot, the premium swells. When it sours, the premium shrinks.
Right now it has shrunk hard. Strategy holds 840,447 BTC, worth about $54 billion at today’s price, yet it paid roughly $63 billion for them, leaving the stack around $9 billion underwater.

The premium that once reached 1.4 times of Bitcoin has since collapsed, and here the math splits in two. On a basic basis, which counts only the common stock, mNAV slipped under 1 to about 0.7, so the shares were worth less than the Bitcoin behind them.

Trackers that also fold in Strategy’s preferred shares and convertible debt read higher, closer to 1.05, which is why you will see both numbers quoted.
That discount is the setup. If sentiment steadies and the premium re-rates back toward 1.5, the stock could climb by half with Bitcoin doing nothing at all.
Want more insights like this? Sign up for Editor Harsh Notariya’s Daily Newsletter here.
How can that premium rise while Bitcoin holds still? Because it is a demand multiple, not a fixed amount, so it swells when more money wants MicroStrategy as a convenient, leveraged Bitcoin bet than wants the coin itself. Index buying, share buybacks that shrink the supply, or a simple return of risk appetite can each lift it.
Reason Two, Strategy Buys Back Its Own Stock
The second reason is what the company now does with its cash. When the premium sat above 1, Strategy could sell new shares at a markup, buy Bitcoin, and hand holders more Bitcoin per share. Near 1, that accretion engine stalls, so the buying stopped.
Strategy’s last Bitcoin purchase came in mid-June, and it has since gone about eight weeks without adding a coin. Instead, it funnels cash into its STRC preferred stock, a share class that pays a rich dividend and is built to trade near $100, buying it back to defend that price.
The move is deliberate.

Retiring stock below its value lifts the Bitcoin behind each remaining share, so holders can gain even while Bitcoin sits flat.
Reason Three: The Sellers Have Quit
The third reason sits on the chart. MSTR has traded inside a rising channel since late June, carving higher lows while Bitcoin drifted sideways. Monday’s 5% candle bounced off the lower edge near $92.

The volume seals it. Trading is down about 63% from June, and since early August, the selling has thinned while buyers have crept back to July levels. Tired sellers and steadier buyers point to seller exhaustion, not fresh mania.
What the Price Action Says Now
All three reasons now meet at one line, $100. A clean break above the round number exposes $101.96, and clearing it opens $104.73 and then $108.26.
The bigger signal sits higher. A push above $118.46 would give the stock room to run toward $134.95 and even $151.44. That zone only reaches the low end of Wall Street’s target range, and the average target sits far above even that.

Below the action, $98.07 and $95.66 are the first supports, and a daily close under $91.77 breaks the channel and voids the case.

Analyst’s View: So the bullish case for the MSTR stock is possible but conditional. MSTR stock only rewards the Strong Buy if Bitcoin steadies. And also if the premium heals and the price clears $118, the upper trendline of the bullish channel.
The post 3 Reasons MicroStrategy (MSTR) Stock Could Climb While Bitcoin Remains Flat appeared first on BeInCrypto.
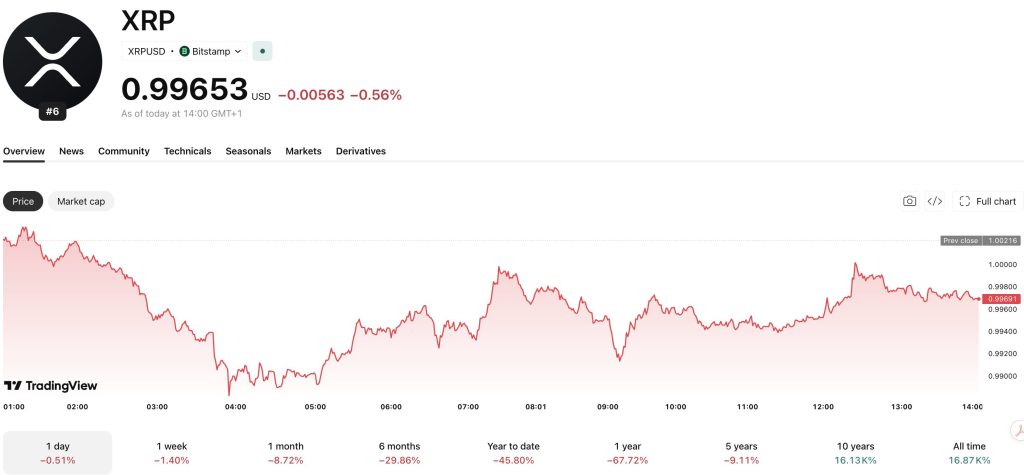
XRP enters the second half of 2026 in an unusual position: legally cleared, institutionally adopted, and yet stuck near the same $1 level it has hovered around for months. We put the question to Claude, asking it ‘AI predicts XRP’, and it gave a measured and interesting response.
As of mid-August 2026, XRP trades around $1.00, down roughly -72% from its July 2025 all-time high near $3.65. Daily trading volume for Ripple is currently at $728M, up from $680M yesterday.

Understanding where it might go from here means combining technical data, macro catalysts, and, crucially, the real money being wagered on prediction markets like Kalshi.
Check out Claude AI’s response below on where it believes XRP will end up over the remainder of 2026. Ripple bulls may not be too happy with the answer, but there is a good amount of data to back up its claims.
Claude AI Predicts XRP Price in 2026
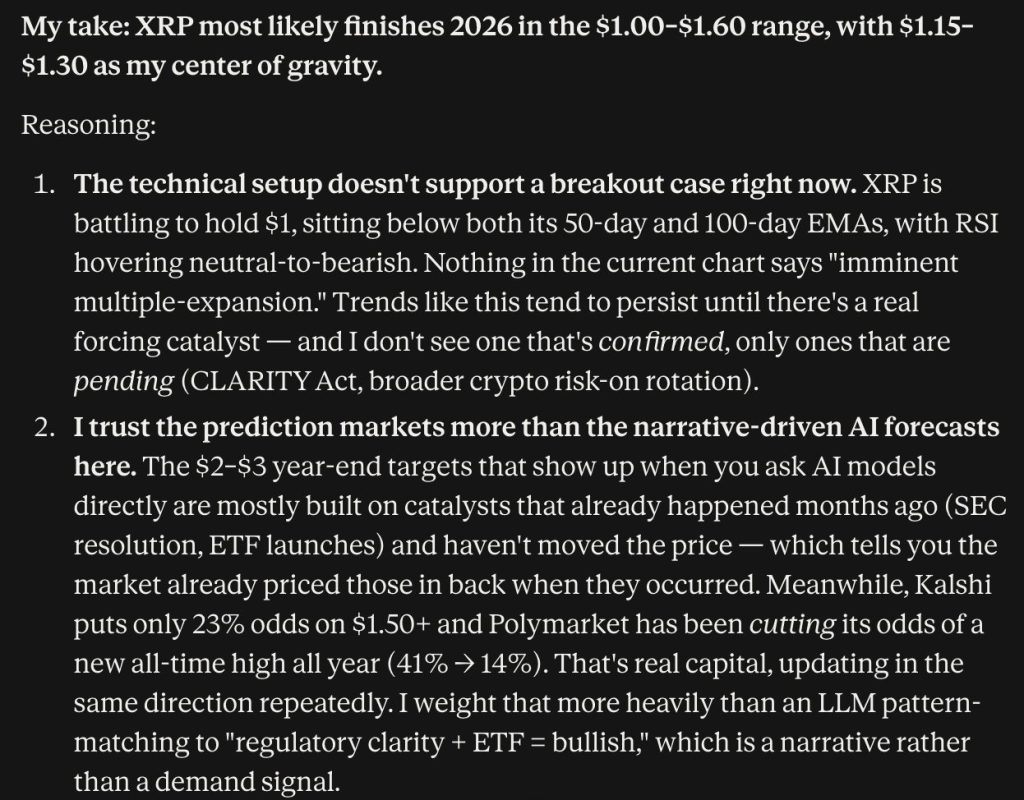
When asking Claude AI to predict the XRP price through the remainder of the year, this is what it had to say:
The technical setup doesn’t support a breakout case right now. XRP is struggling to hold $1, sitting below both its 50- and 100-day EMAs, with RSI hovering between neutral and bearish.
Nothing in the current chart says “imminent multiple-expansion.” Trends like this tend to persist until there’s a real forcing catalyst, and I don’t see one that’s confirmed, only pending ones (CLARITY Act, broader crypto risk-on rotation)
I trust the prediction markets more than the narrative-driven AI forecasts here. The $2–$3 year-end targets that show up when you ask AI models directly are mostly based on catalysts that happened months ago (SEC resolution, ETF launches) and haven’t moved the price, which suggests the market already priced them in when they occurred.
Meanwhile, Kalshi puts only 23% odds on $1.50+, and Polymarket has been cutting its odds of a new all-time high all year (from 41% to 14%). That’s real capital, updating in the same direction repeatedly.
I weigh that more heavily than an LLM pattern-matching to “regulatory clarity + ETF = bullish,” which is a narrative rather than a demand signal.
What would change my mind: sustained ETF inflows breaking meaningfully above the recent ~$2M/week pace, XRP reclaiming and holding the 100-day EMA, or a genuine macro risk-on move dragging the whole crypto market up together. Absent one of those, I don’t see the setup for XRP to run.
Downside case: if $0.99 support fails decisively, $0.85–$0.95 is plausible before finding new footing, but I don’t think a collapse toward the $0.50 zone is likely; liquidity and ETF structural demand act as a floor.
So my honest single number, if forced: XRP ends 2026 at around $1.20, with meaningfully more probability mass below $1.50 than above.
Trade Ethereum on Bybit and Get a Chance to Win Our $1,000 USDT Airdrop
What Kalshi and the Prediction Markets Are Saying
Aside from ‘AI predicts XRP’ and other prediction markets, Kalshi’s annual contract on XRP has a target of closing above $1.50 by the end of 2026 and has been climbing, recently moving from 18% to 23%, a sign that some traders are warming to a stronger back half of the year.
A smaller but notable 10% of bettors are pricing in XRP reaching $2.50, a scenario that would likely require multiple bullish catalysts to align at once, such as broader crypto market strength and further regulatory clarity in Washington.
At the same time, a separate Kalshi market has indicated a 59% probability that XRP will drop below $1 before year-end — underscoring genuine uncertainty rather than consensus.
Shorter-dated Kalshi contracts, which settle in as little as two weeks, have shown roughly 66% odds of XRP closing above $1.35 in the near term, though that probability fell to 43% for the $1.37 threshold, a reminder that short-term sentiment can shift quickly and shouldn’t be read as a year-end forecast.
Polymarket data tells a more cautious story on the high end: the probability of XRP setting a new all-time high before January 2027 has fallen sharply over the year, from around 41% to just 14%, while the odds of XRP even reaching $3 sit near 23%. That’s a notably wider gap than many analysts’ price targets, which have historically clustered at higher levels.
Discover: Trade the odds on Kalshi and get a free $25
The post AI Predicts XRP: Claude Makes a Prediction that May Anger the Ripple Maxis appeared first on Cryptonews.
Satoshi Bitcoin scaling quotes prove nothing, Adam Back argues, because the pseudonymous creator contradicted himself repeatedly and was sometimes simply wrong.
The Blockstream CEO fired back this week at a viral thread citing old forum posts as proof that Satoshi Nakamoto always wanted bigger blocks.
What the Satoshi Bitcoin Scaling Quotes Actually Say
The fight reopened after a developer interview drew criticism on X. Big-block advocates recirculated two Satoshi lines they treat as settled doctrine, starting with this one from BitcoinTalk.
“We can phase in a change later if we get closer to needing it.”
Satoshi Nakamoto, BitcoinTalk, October 3, 2010
The context complicates that reading. Satoshi wrote it while urging users to reject a patch that raised the block size limit.
A December 2009 post predicted Moore’s Law would soon outgrow the chain. That rule of thumb holds that computing power roughly doubles every two years.
Consequently, advocates argue, the design always assumed rising capacity.
Back answered with one word. He wrote “no,” then explained why the archive cuts both ways.
Why Back Wants First Principles Instead
Back traces those Satoshi Bitcoin quotes to a defensive exchange with critic James A. Donald, who argued in 2008 that the design would never scale. Satoshi’s answer that November pointed away from bigger blocks entirely.
“as the network grows beyond a certain point, it would be left more and more to specialists with server farms of specialized hardware”
Satoshi Nakamoto, Cryptography Mailing List, November 2008
There sits the contradiction. One Satoshi tells users the chain can simply grow, while another hands the load to specialists and lightweight clients.
The Moore’s Law claim aged worse still. Satoshi expected download times to peak within eight months, yet the chain kept outrunning hardware. It now spans about 744 gigabytes.
Back reads those later remarks as an early case for second layers, which settle payments off-chain.
The Blockstream founder has spent 2026 attacking similar appeals to authority. In July, he ridiculed the BIP-110 fork fight, a failed push to rewrite consensus rules through miner signaling.
He later called the case for lifting Bitcoin’s 21 million cap a trap. Back has also argued that Bitcoin was discovered, not invented, weakening any author’s claim to the roadmap.
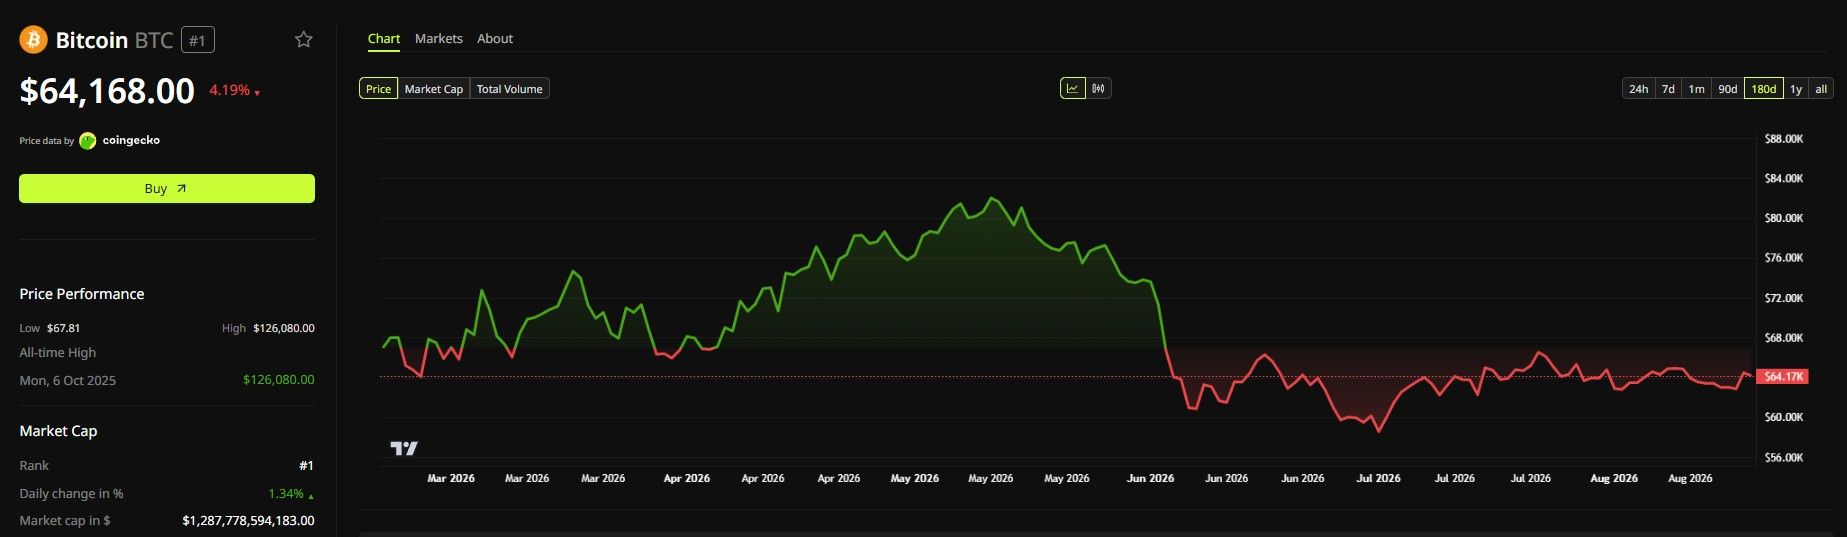
Meanwhile, the market offers little comfort. Bitcoin (BTC) trades near $64,168, roughly 49% below the record of $126,080 set in October 2025.

The argument resurfaces because both sides need Satoshi. Coinbase CEO Brian Armstrong recently claimed stablecoins, not Bitcoin, delivered Satoshi’s payments vision.
Craig Wright pushed the opposite line in his Bitcoin governance critique, insisting the base layer must never change.
Back lands somewhere between them. Old Satoshi Bitcoin posts can inform the debate; however, they cannot end it.
His conclusion abandons the archive. Developers should reason from first principles themselves, he argues, rather than mine a decade-old forum for permission.
The post Adam Back Rejects Satoshi Nakamoto as Bitcoin’s Final Word appeared first on BeInCrypto.


Cash App’s cryptocurrency service is extending beyond bitcoin and stablecoin USDC for the first time by being added to crypto payments platform MoonPay.
This means eligible U.S. Cash App users will be able to use their balances to purchase a host of other digital assets offered by MoonPay, including ether , solana (SOL), XRP and the largest stablecoin, USDT.
Users will also be able to fund wallets on MoonPay through their Cash App balances, including Ledger, BitPay, Trust Wallet, MetaMask and Uniswap, among others.
Cash App, the mobile payment service developed by Jack Dorsey’s fintech company Block (XYZ), is one of the premier mainstream gateways into cryptocurrency, given its customer base of over 50 million users.
The gateway has, however, historically been open only for bitcoin purchases. Cash App added support for USDC, the second-largest stablecoin by market cap, earlier this year.
Bitcoin maximalist Dorsey said he didn’t like supporting stablecoins, but Cash App’s “customers want to use them.”
“I don’t think it’s wise to go from one gatekeeper to another,” he said in March.


The Korea Media and Communications Commission said Polymarket’s structure and operations amount to illegal gambling despite its noncustodial design and smart contracts.


Visa is looking for a new stablecoin settlement partner with licensing capabilities across multiple regions, according to documents seen by CoinDesk. This would fill the role previously held by BVNK, the stablecoin firm acquired by Mastercard earlier this year.
Visa’s request for product (RFP) talks about the ability to swap and support a range of stablecoins, as well as handle settlement for the newly introduced Open USD stablecoin project, fronted by Stripe, Visa and Mastercard, which plans to support multiple stablecoins.
The need for a stablecoin partner licensed in all major markets means the scope of potential partners has narrowed somewhat, Visa said. The payments giant said it is looking at one settlement and an over-the-counter (OTC) partner in particular, with cryptocurrency exchange licenses in the U.S., Canada, the UK and Singapore.
The stablecoin race hasn’t slowed down despite a flat bearish market persisting across the rest of the crypto industry. As such, stablecoins have become a focal point for the large card networks and payments players. The total stablecoin market cap is about $300 billion, according to CoinGecko data.
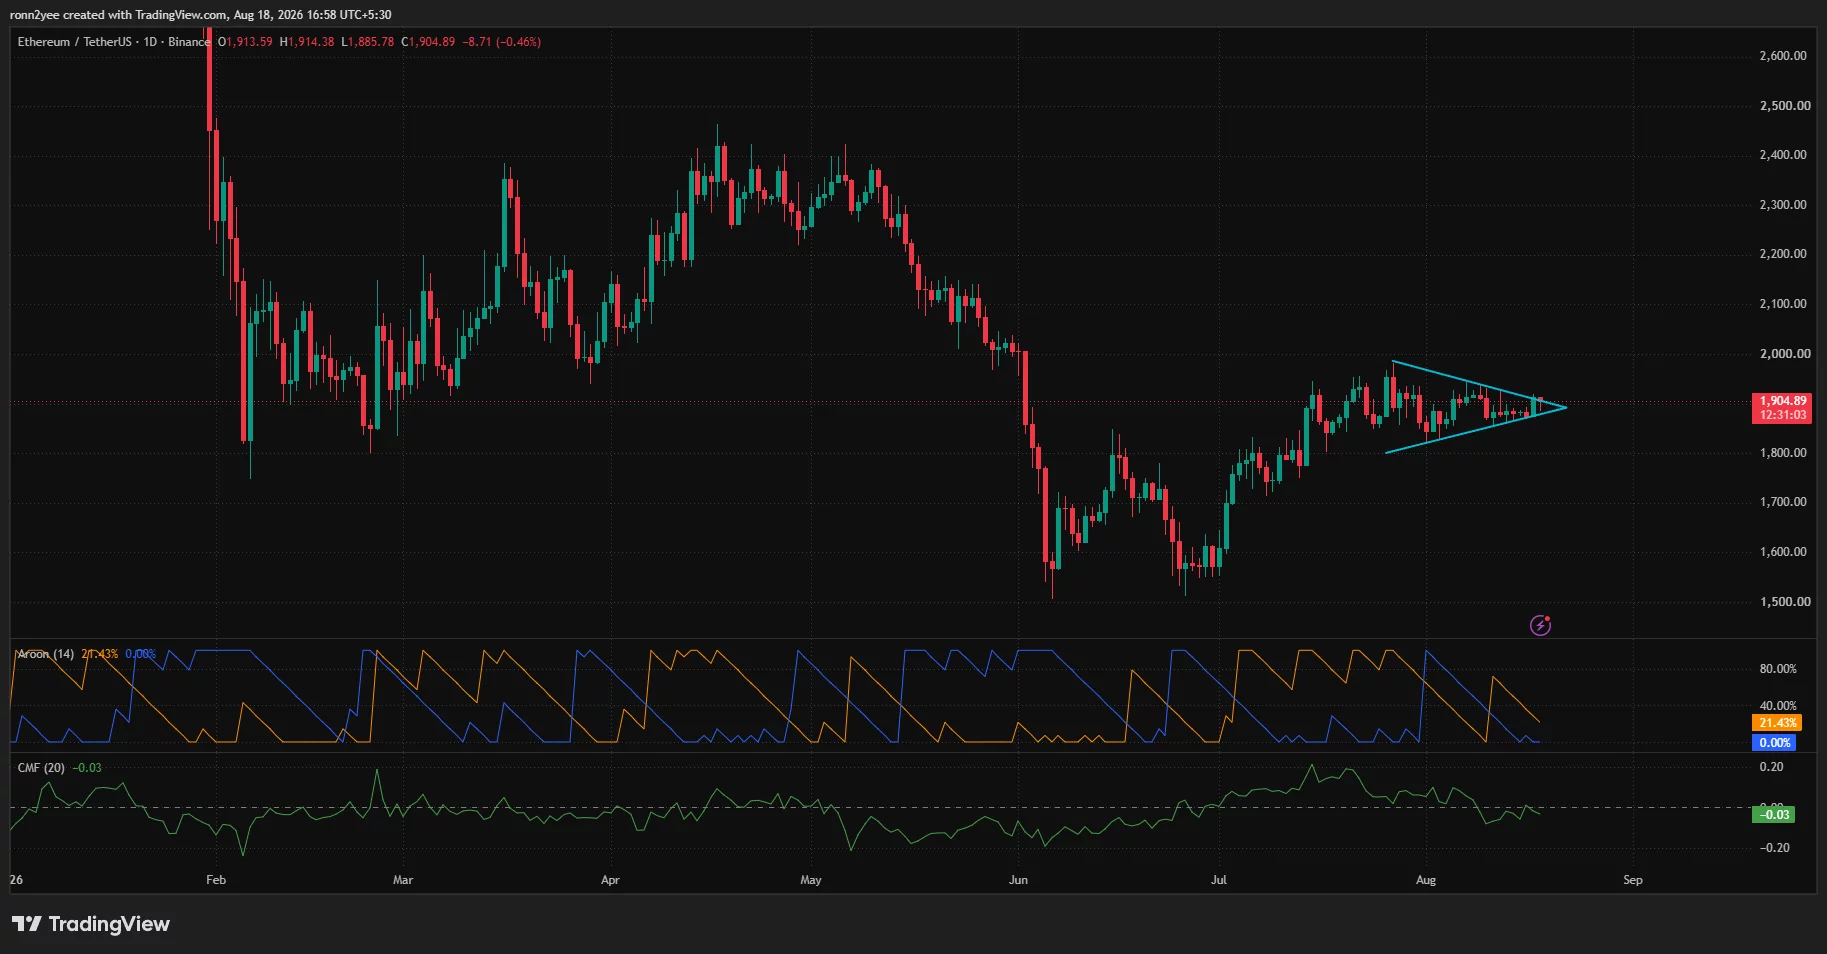
Ethereum price traded near $1,905 on Aug. 18 as tightening daily and 4-hour ranges placed the $1,920 resistance level at the center of its next major move.
Summary
- Ethereum price has formed a symmetrical triangle between roughly $1,850 and $1,930.
- A 4-hour close above $1,909 could expose the stronger $1,920 resistance level.
- Liquidation clusters are concentrated near $1,925–$1,930 and below $1,890.
- Analysts see $2,000 as the next target if Ether breaks its current range.
Ethereum price tightens inside a symmetrical triangle
According to data from crypto.news, Ethereum (ETH) price was trading at $1,904.89 after moving between an intraday low of $1,885.78 and a high of $1,914.38. The price was down about 0.5% on the day but remained inside the narrow range established since late July.
Ether’s recent lower highs and higher lows have created a symmetrical triangle on the daily chart. The upper trendline has fallen from near $1,980 toward $1,920, while the lower boundary has risen from around $1,800 toward $1,880.
Price has now moved close to the triangle’s apex, where shrinking space between the two boundaries typically precedes a wider move. The formation remains neutral until ETH closes outside either trendline, meaning confirmation matters more than intraday movement within the pattern.
Momentum readings have not yet provided a clear directional signal. The daily Aroon readings were weak, with one line at 21.43% and the other at 0%, reflecting a lack of a strong recent high or low.
Chaikin Money Flow stood at -0.03, slightly below the neutral line. The reading shows that selling pressure has a small advantage, but the figure is not low enough to confirm strong capital flight.
Ether’s inability to break higher comes as large holders reportedly sold around $3 billion in ETH since Aug. 10. Decentralized exchange trading volume has also contracted by about 42% over recent months, while a negative Coinbase Premium Index has pointed to weak demand from US-based buyers.
4-hour chart puts $1,909 and $1,870 in focus
The 4-hour chart shows a more immediate battle between Supertrend resistance at $1,908.59 and support at $1,869.92. Ether briefly traded above $1,905 but had not secured a candle close over the upper Supertrend level at the time of the chart.
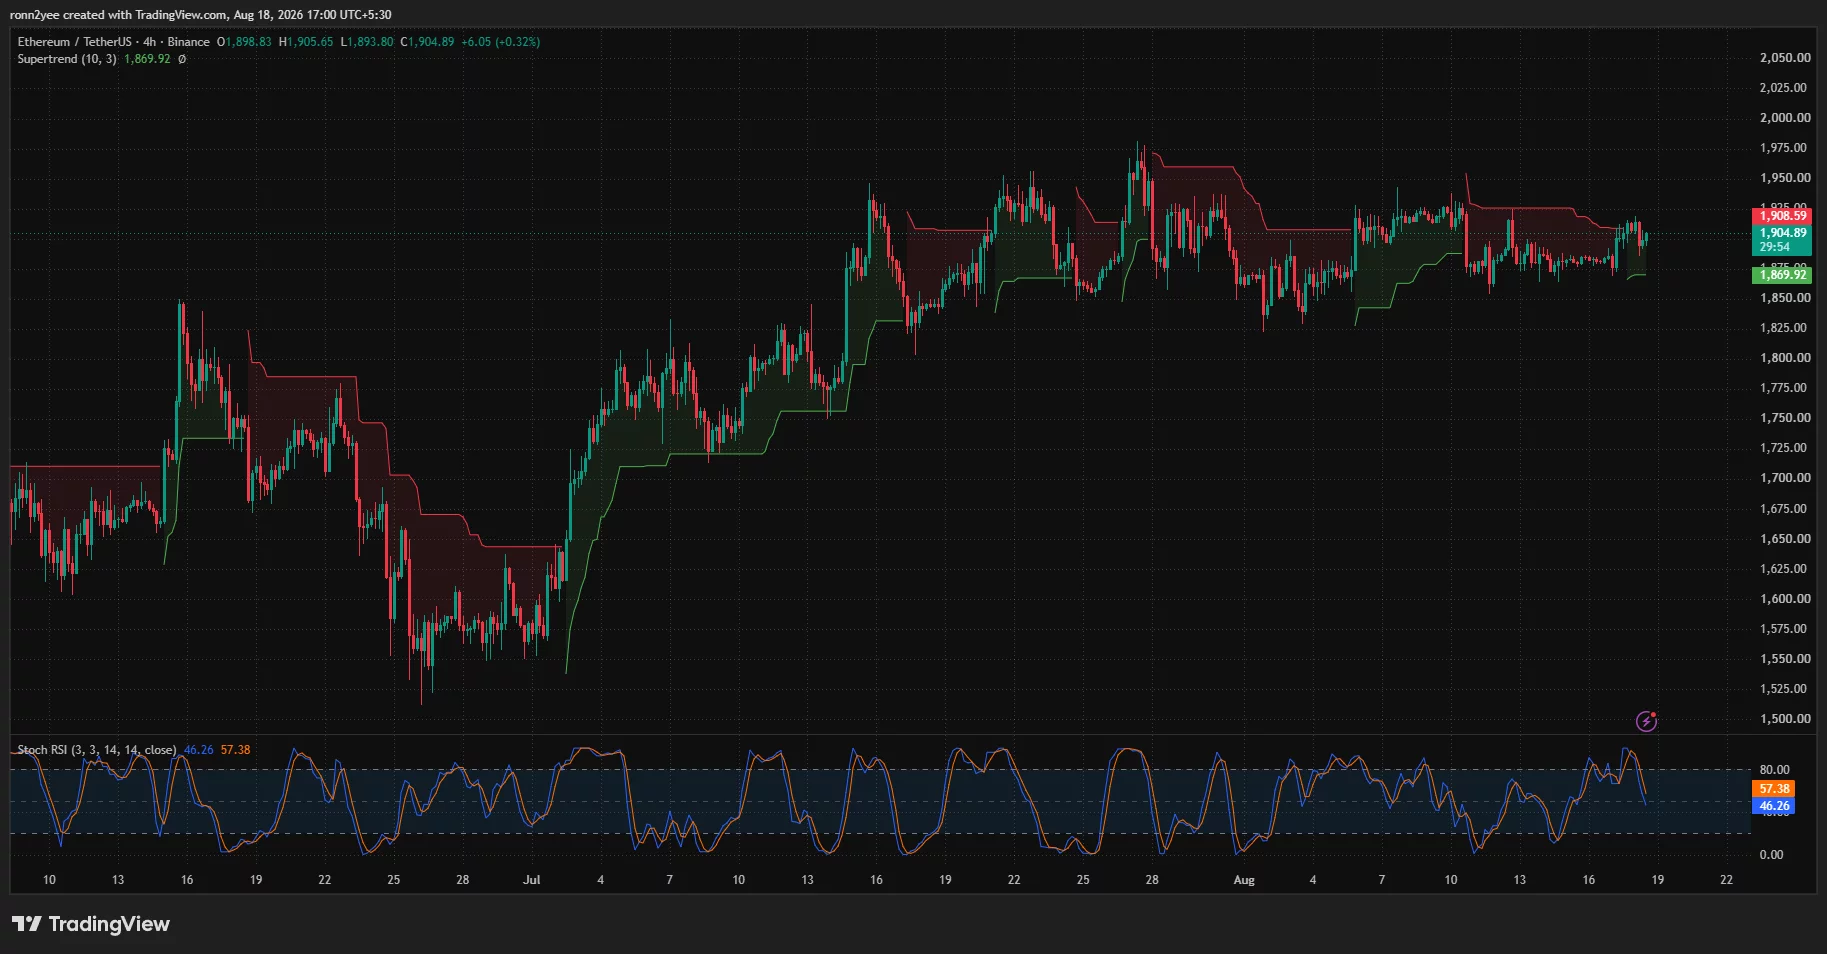
A confirmed move above $1,909 would weaken the short-term bearish signal and bring $1,920 into view. ETH has repeatedly struggled between $1,915 and $1,930, making that area the first meaningful test for buyers.
The Stochastic RSI has also turned lower after approaching overbought territory. Its two lines stood at 46.26 and 57.38, with the faster line below the slower one. The crossover shows that short-term momentum cooled during the latest push toward resistance.
However, the oscillator remains near the center of its range rather than in oversold territory. Bulls could regain momentum without requiring a deeper reset if ETH holds above $1,890 and breaks through $1,909.
Failure to clear the Supertrend barrier would keep the price exposed to $1,890, followed by the $1,870 support line. A 4-hour close below $1,870 would weaken the sequence of higher lows and shift attention toward $1,850.
Ethereum liquidation map points to $1,925
CoinGlass’ three-day liquidation heatmap shows the largest nearby concentration of leveraged positions above the market between roughly $1,925 and $1,930. Additional liquidity appears around $1,940–$1,950 and close to $1,980.
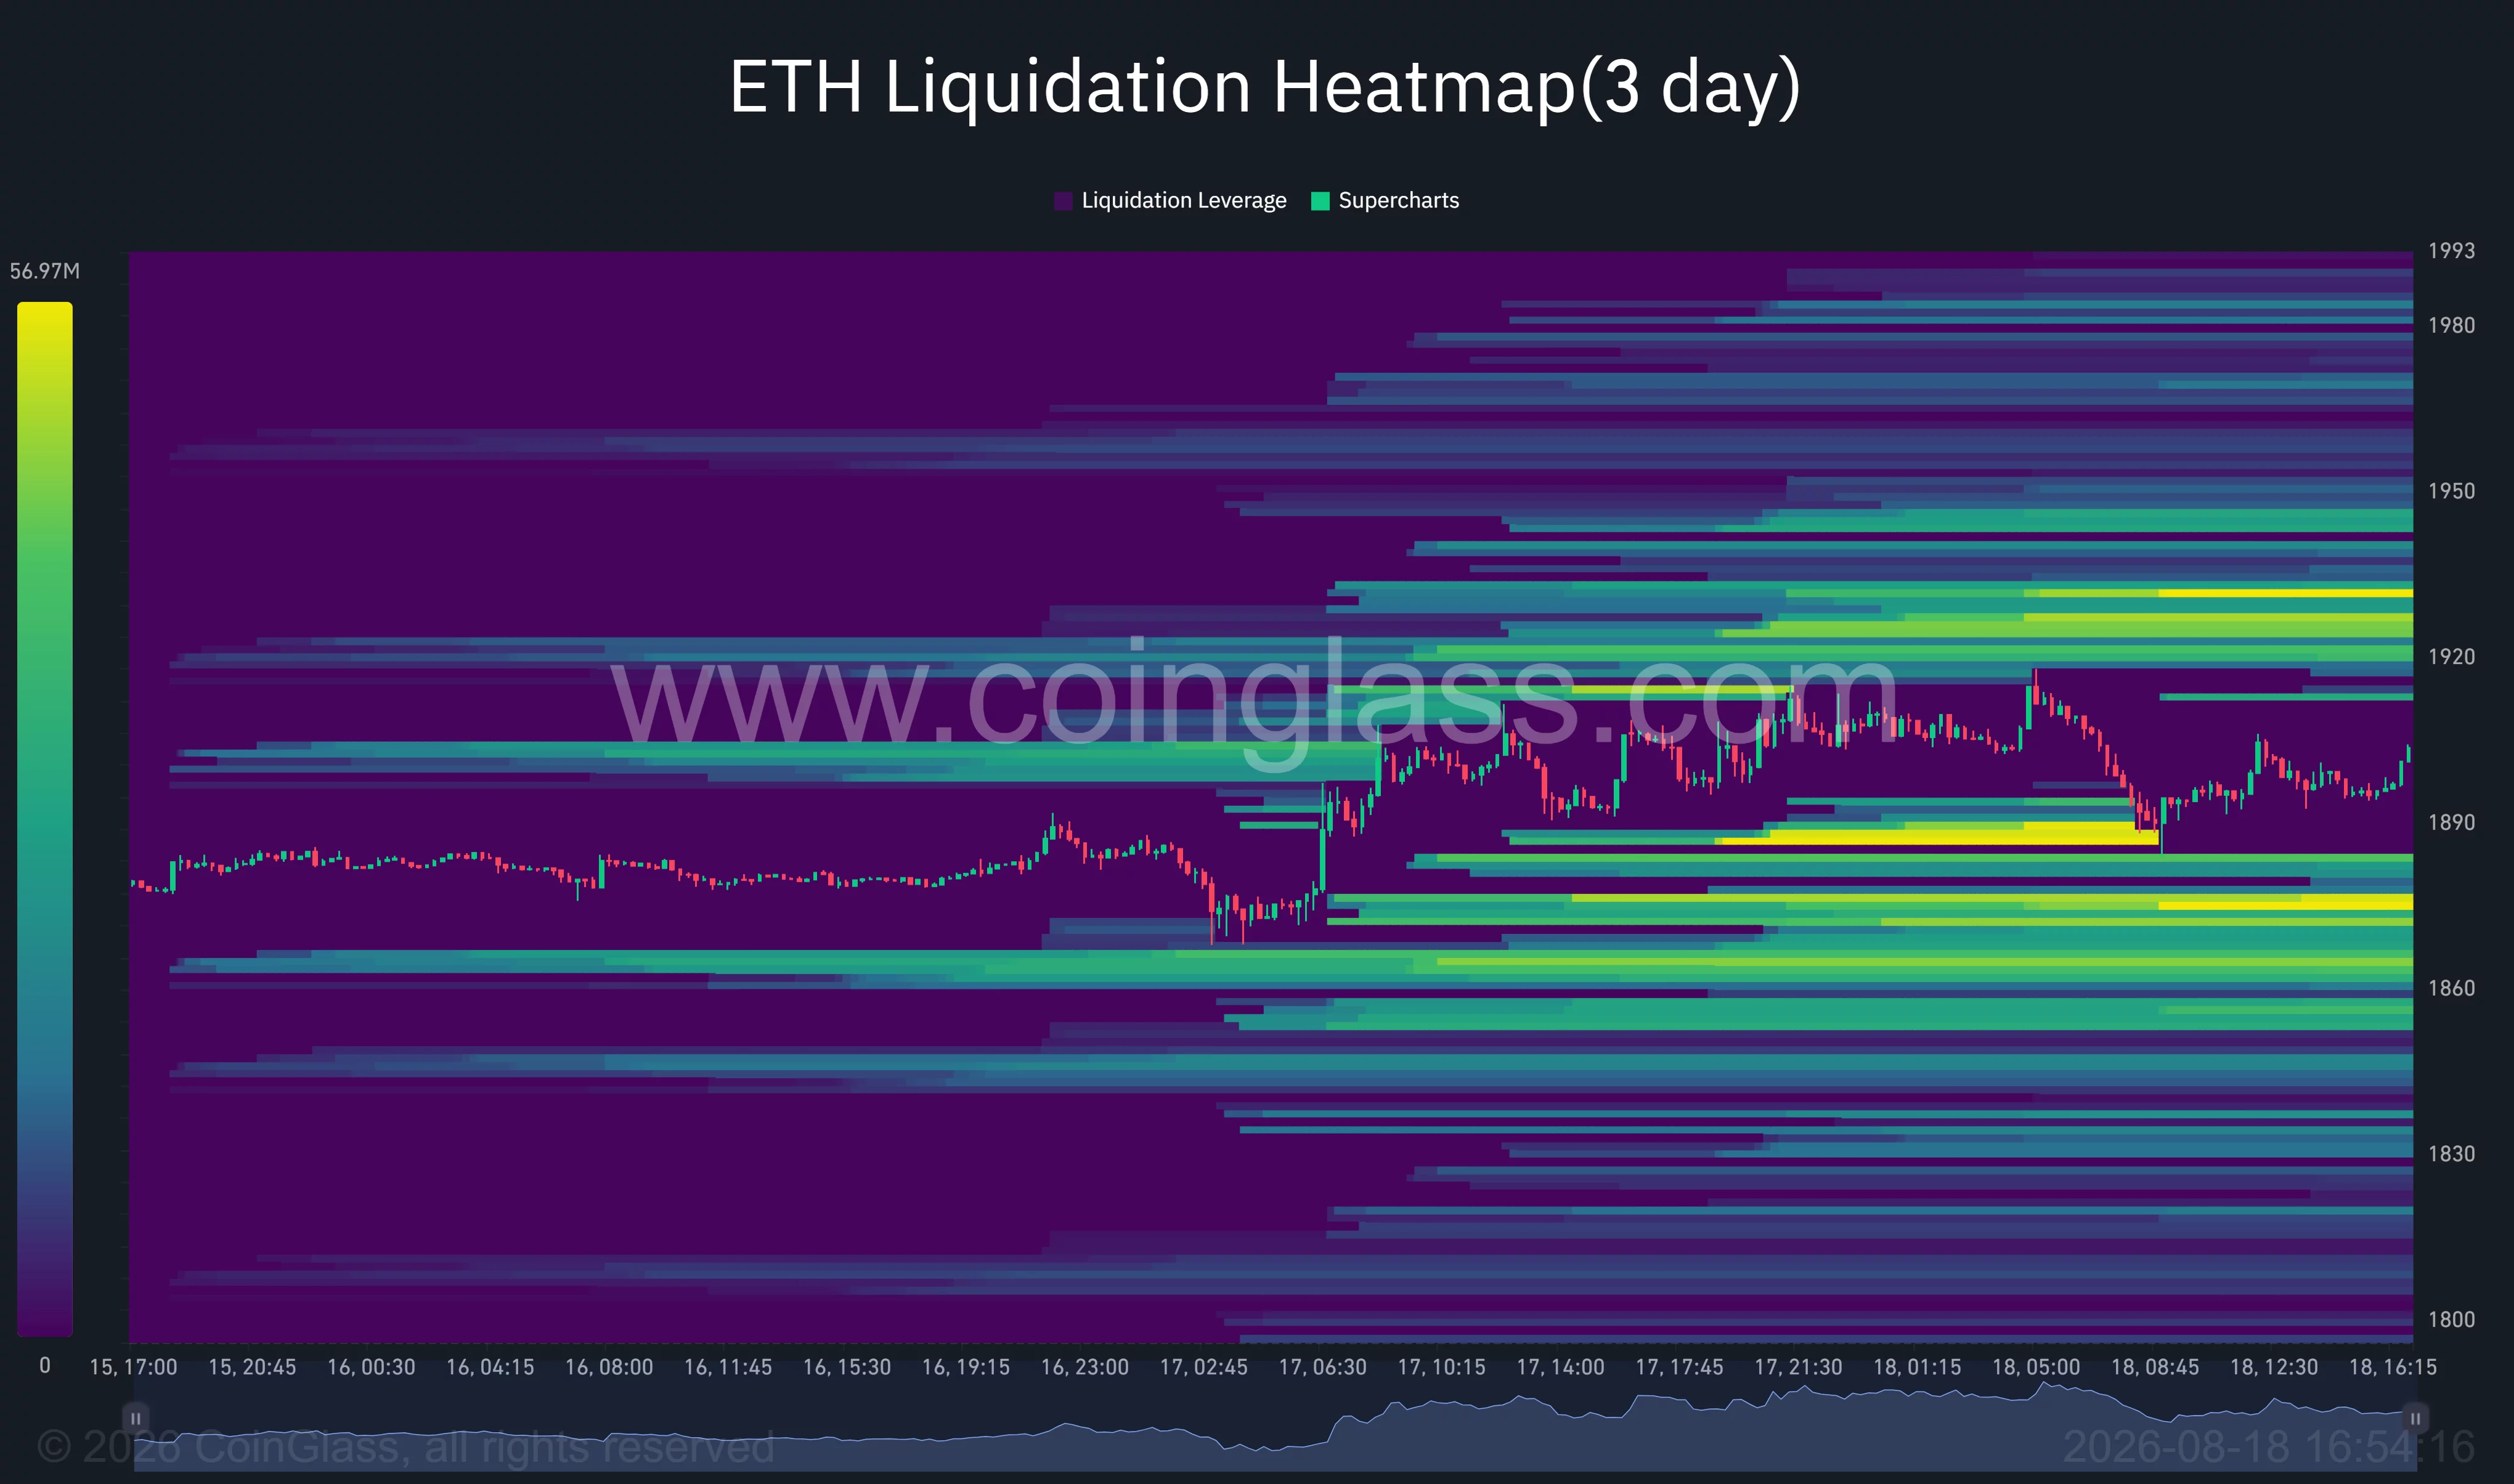
A move through $1,920 could force short positions to close around the first cluster. Such liquidations may add market buying and help ETH accelerate toward the $1,940–$1,950 region.
The downside also contains several active liquidity zones. The closest cluster sits around $1,885–$1,890, followed by stronger concentrations near $1,870 and $1,860.
Price briefly moved into the $1,885 region earlier on Aug. 18 before recovering above $1,900. The rebound suggests buyers remain active near the lower liquidation band, although repeated tests could weaken that defense.
A sweep below $1,885 could therefore pull ETH toward $1,870, which aligns with the 4-hour Supertrend support. The overlap between technical support and liquidation liquidity makes $1,870 the main short-term invalidation level for the bullish setup.
Analysts target $2,000 after a $1,920 breakout
Analyst Michaël van de Poppe said Ethereum remained stuck in a range and had not matched Bitcoin’s larger move. He identified $1,920 as the resistance level that could unlock a stronger advance.
“However, once it cracks through the resistance at $1,920 I would assume we’re going to see a big move happening towards $2,000 here.”
His target matches the daily chart, where the psychological $2,000 level sits above the triangle and recent swing highs. ETH would first need to clear the supply zone between $1,920 and $1,950 before testing that target.
Analyst Ted Pillows presented a longer-term threshold, arguing that a weekly close above $2,500 would confirm that Ethereum’s bear market had ended. Such a close would allow ETH to reclaim its 200-week simple and exponential moving averages, according to his chart.
The $2,500 condition remains well above the current market and does not affect the immediate range. It instead shows that even a break above $2,000 would represent an early recovery step rather than confirmation of a full long-term trend reversal.
US flows remain a barrier for Ethereum
US-listed spot Ethereum exchange-traded funds recently recorded $2.26 million in net outflows, interrupting a multi-week inflow streak. The negative Coinbase premium also shows that US demand has not yet provided enough support to drive ETH through its current resistance.
Investors are waiting for the upcoming Federal Reserve minutes after annual US inflation slowed to 3.4%. Any signal that policymakers are moving closer to lower interest rates could affect demand for risk assets, including Ether.
For now, Ethereum remains compressed between nearby liquidity on both sides of the market. A sustained break above $1,920 would favor a move toward $1,950 and $2,000, while rejection followed by a loss of $1,870 would expose $1,850 and potentially $1,800.
Disclosure: This article does not represent investment advice. The content and materials featured on this page are for educational purposes only.
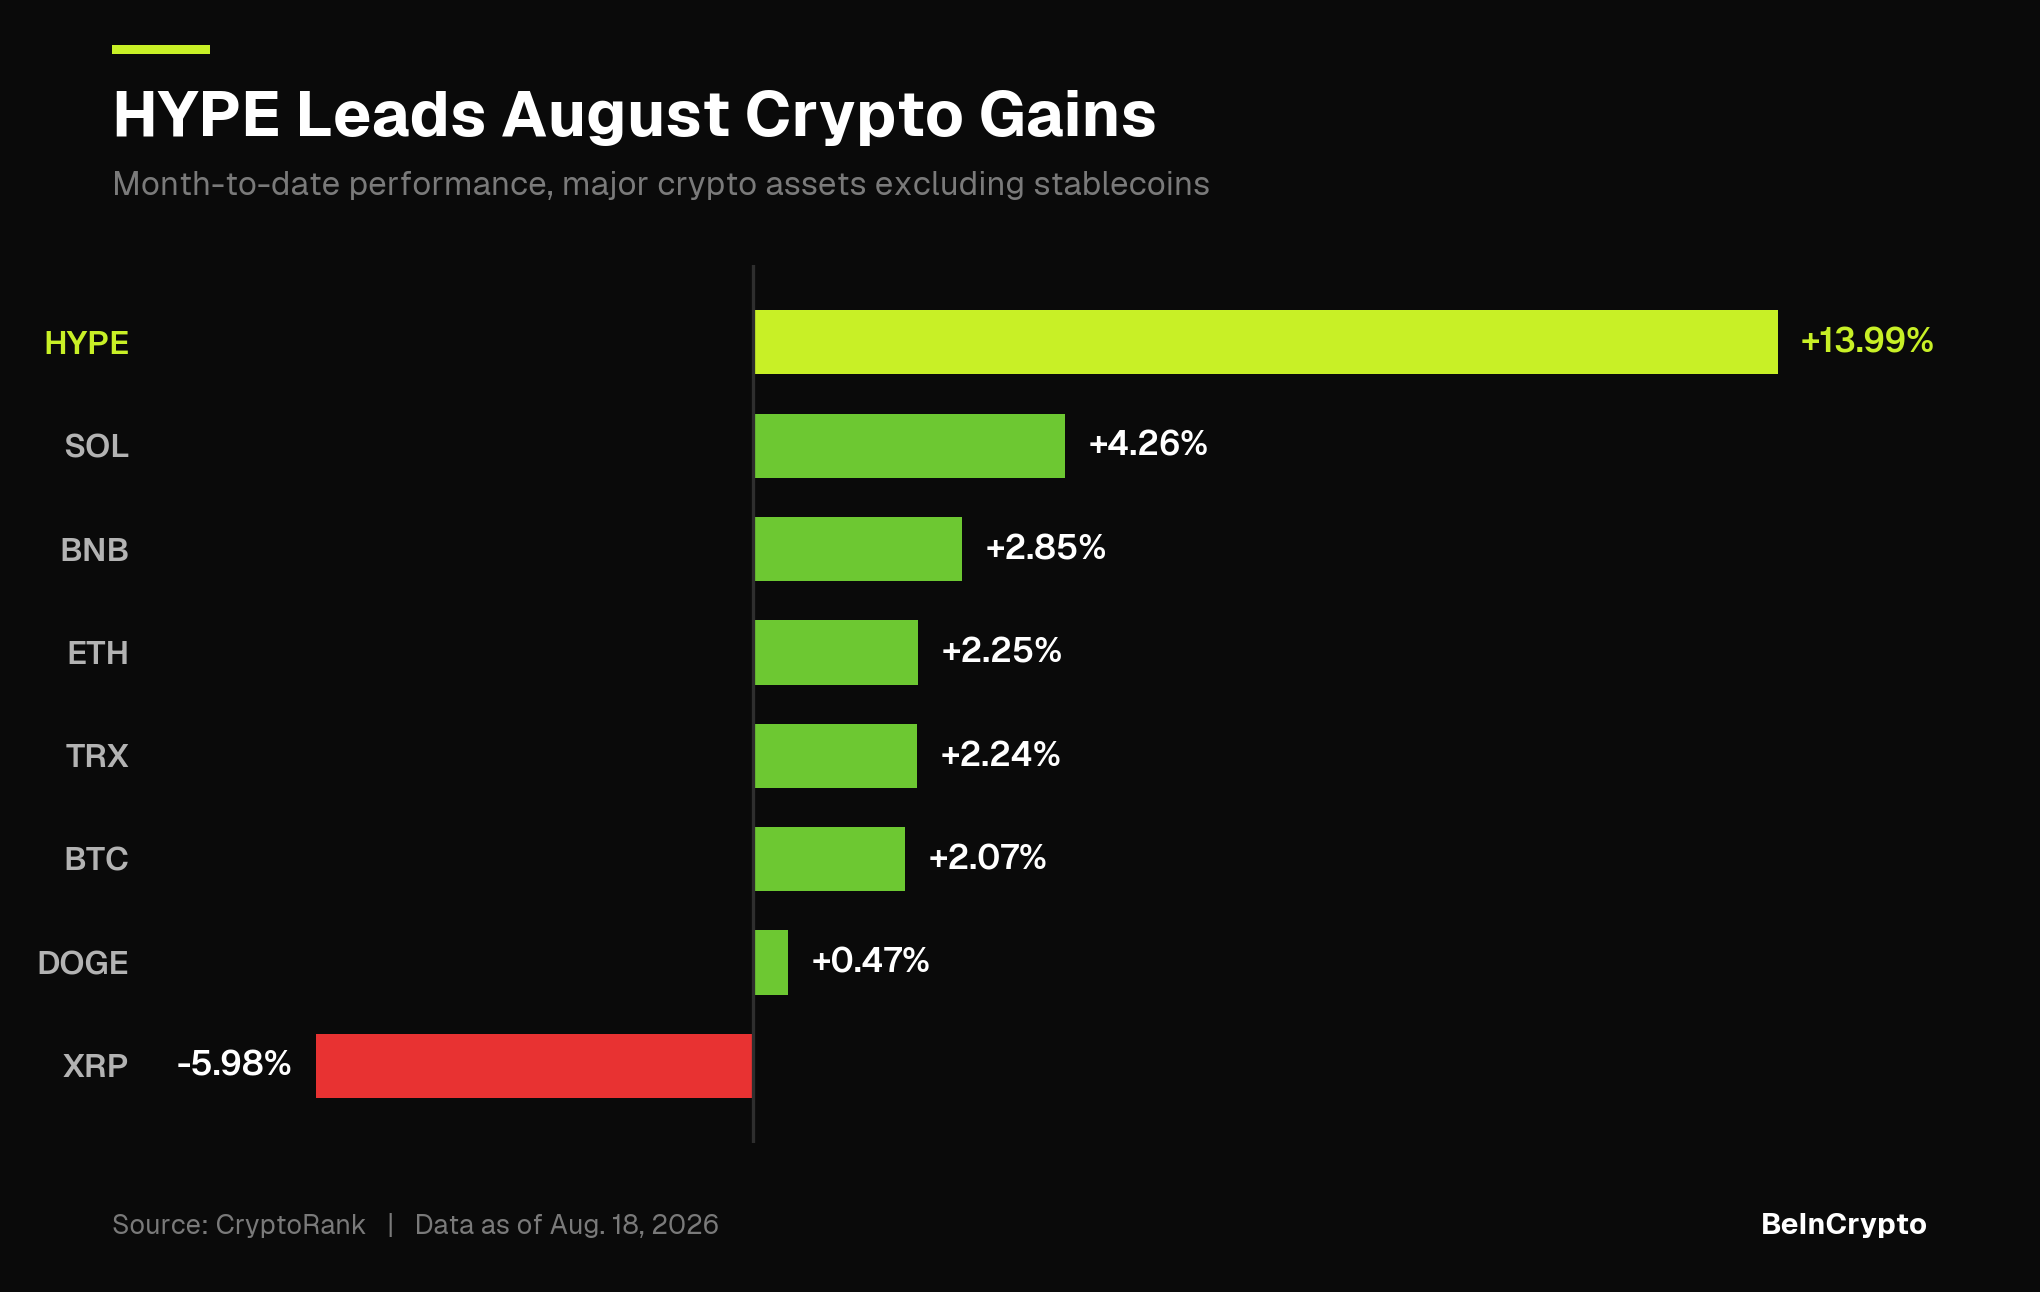
Hyperliquid (HYPE) price has gained 13.99% in August, making it the strongest performer among the top 10 crypto assets this month.
However, exchange-traded fund flows, large holder activity, and derivatives positioning now point in different directions.
HYPE Outpaces Bitcoin and Ethereum as ETF Demand Slows
CryptoRank data show HYPE up 13.99% for the month. This runs roughly 3.3 times Solana’s (SOL) 4.26% gain and 6.8 times Bitcoin’s (BTC) 2.07% uptick.
Follow us on X to get the latest news as it happens

XRP (XRP) is the only major asset in the red, down 5.98%. It has spent the month trailing its major peers while large holders kept buying.
The latest gain comes after a period of decline. HYPE fell 21.94% from its record high until early August, before rebounding. A 13.99% gain off a 21.94% drawdown still leaves the token short of its prior mark.
Meanwhile, institutional demand has yet to return in any sustained form. SoSoValue data shows that HYPE ETFs saw three consecutive weeks of outflows through July 31.
Flows turned positive in the first two weeks of August. The recovery has since stalled, with no new inflows recorded since August 10.
Holders Show Mixed Behavior
Large holders moved in both directions this month. On-chain trackers recorded several wallets buying while others sold.
A wallet linked to Maven11 Capital withdrew 202,705 HYPE from OKX last week. Monetalis-linked wallets sold 3.72 million Uniswap (UNI) via Cumberland and bought 171,543 HYPE, worth $9.56 million, over the weekend.
Selling ran in parallel. One whale sold 923,743 HYPE worth $53.02 million last week.
“HyperLabs unlocked another 433,025 HYPE ($23.46M) and has been gradually depositing the tokens into exchanges, including Flowdesk and OKX, likely to sell,” Lookonchain reported in early August.
Sophisticated Traders Lean Short
Derivatives positioning leans the other way. Nansen data show whales, smart traders, and public figures all net short. Funding stands at 0.00125% per hour, near 10.95% annualized, so longs currently pay shorts.
Spot flows offer no tiebreaker. Nansen recorded $5.7 million in HYPE leaving exchanges over seven days, alongside heavy accumulation on centralized exchanges and over-the-counter across 30 days.
Each dataset answers a different question, and none confirms the others. Renewed ETF creations would show institutional buyers returning. A shift in the whale cohort to net long would signal the same from derivatives. Neither has happened yet.
Subscribe to our YouTube channel to watch leaders and journalists provide expert insights
The post Hyperliquid (HYPE) Leads the Top 10 in August, Yet Smart Money is Short appeared first on BeInCrypto.

Key takeaways
- Chainlink trades around $9.42 after gaining more than 14% last week.
- A long-to-short ratio of 0.76 and negative funding point to weakening derivatives sentiment.
- Spot LINK ETFs attracted $2.07 million on Monday, their largest daily inflow since July 22.
- Losing support at $9.39 could trigger a pullback toward $8.94 and the $8.60–$8.50 region.
Chainlink (LINK) is struggling to overcome resistance near $9.56 on Tuesday, pausing after rallying more than 14% during the previous week.
Weakening derivatives indicators suggest that bullish momentum may be losing strength. However, renewed institutional demand through spot LINK exchange-traded funds could support another attempt to move higher.
Derivatives traders adopt a bearish stance
CoinGlass data shows early signs of weakening sentiment in Chainlink’s derivatives market.
LINK’s long-to-short ratio stands at 0.90 on Tuesday, close to its lowest level in a month. A reading below one indicates that short positions outnumber long positions, suggesting more traders expect the price to decline.
Chainlink’s funding rate also turned negative, falling to minus 0.0050%. Negative funding means short-position holders are paying traders with long exposure, reflecting a bearish imbalance in the perpetual futures market.
Together, the indicators suggest that derivatives traders are becoming more cautious after LINK’s double-digit weekly rally.
However, heavily bearish positioning could also increase the possibility of a short squeeze if Chainlink breaks through its nearby resistance levels.
Institutional demand showed improvement at the beginning of the week. Data from SoSoValue shows that spot Chainlink ETFs recorded $2.07 million in net inflows on Monday. This represented the products’ largest single-day inflow since July 22.
The increase suggests that institutional investors are rebuilding exposure to LINK following its recent recovery.
Continued ETF inflows could help absorb profit-taking and provide the demand needed for Chainlink to overcome the 200-day Exponential Moving Average. However, a single day of positive flows is insufficient to establish a lasting trend.
A sustained series of inflows throughout the week would provide stronger confirmation of renewed institutional interest.
Chainlink price outlook: LINK tests the 200-day EMA
Chainlink trades around $9.42 on Tuesday and remains above its 50-day and 100-day EMAs, positioned at $8.50 and $8.60, respectively.
Holding above these moving averages supports a mildly bullish medium-term outlook. However, LINK remains below the 200-day EMA at $9.56, which is limiting the current recovery.
The token has reclaimed the 61.8% Fibonacci retracement at $9.39, establishing this level as immediate support.
Momentum indicators remain constructive but show that LINK may be approaching stretched conditions. The Relative Strength Index is near 67, just below the overbought threshold of 70, while the Moving Average Convergence Divergence indicator remains positive.
These readings suggest that buyers retain control but may encounter increasing resistance following last week’s sharp rally.
A decisive daily close above the 200-day EMA at $9.56 would strengthen Chainlink’s bullish outlook and bring the horizontal resistance at $9.92 into focus.

Clearing both barriers could allow LINK to test the 78.6% Fibonacci retracement at $10.04. Beyond that, the cycle-high region around $10.87 represents the next major bullish objective.
On the downside, the 61.8% Fibonacci level at $9.39 provides the first line of support. A break below this area could trigger a pullback toward the 50% retracement at $8.94.
Stronger support is concentrated between the 100-day EMA at $8.60 and the 50-day EMA at $8.50. Holding this zone would preserve the medium-term recovery structure, while a decisive breakdown could return control to sellers.

Mum who killed her three children ‘expressed thoughts of harming them’, court told | News US

Regulatory tailwinds to boost growth for MCX, says HDFC Securities, retains Buy for 18% gains

NASA Taps Blue Origin, Firefly For Services. SpaceX Stock Hits Resistance.





-

 Fashion4 days ago
Weekend Open Thread: Ann Taylor
-
 NewsBeat7 days ago
Communication cards help banking customers access services or report scams
-
 Sports5 days ago
This U.S. Amateur is a glimpse into golf’s future in more ways than you think
-
 NewsBeat3 days ago
Myanmar says over 300,000 Rohingya refugees verified for repatriation as exodus enters ninth year
-

 Sports3 days ago
Birmingham 2026: Day 6 Timetable for Irish Athletes
-

 Politics3 days ago
SEQ Code: The Three Letter Boarding Pass Code That Could Give You The Worst Seat
-
 Tech4 days ago
11 Ways to Rank Your Videos
-
 Entertainment6 days ago
Keke Palmer Subtly Hints At Sean Evans Drama With Cryptic Post
-

 Fashion7 days ago
Coffee Break: The Fonteyn Jane Flat
-

 Tech7 days ago
Zoom Screen-Sharing Bug Let People Fully Take Over Other Devices On A Call
-

 Fashion7 days ago
Should you refinance your debt? Pros, cons, and real numbers
-

 Fashion7 days ago
Claire Life: Kicking Off MVAAFF With the C Suite Luncheon Featuring Phylicia Rashad, Letoya Luckett, and More!
-
 Crypto World6 days ago
XRP bridge drained after software mistook fake deposits for real ones
-

 Sports6 days ago
DeQuan Jones in ‘high spirits’ after successful leg surgery
-

 Tech5 days ago
DeepSeek Harness launches as open source rival to Claude Code, alongside V4-Pro on API with higher prices
-
 Crypto World6 days ago
Perplexity AI Predicts an XRP Scenario Few Analysts Are Discussing
-

 Politics6 days ago
How Average Are You In The UK?
-

 Tech6 days ago
SpaceXAI’s Grok Bot turns agents into persistent digital coworkers that can operate your apps for $120-per-month
-

 Politics7 days ago
In the Chris Kaba case, the police watchdog capitulated to the mob
-
 Entertainment6 days ago
2026’s Most Ambitious Fantasy Movie Officially Scores Sequel Update
You must be logged in to post a comment Login