
Crypto World
XRP Quietly Loses Its Last Line of Support
XRP is sliding toward its last major support near $1.04 as its weekly Relative Strength Index sinks into oversold territory unseen since 2022.
The XRP price trades around $1.04, down roughly 3.7% over the past 24 hours and more than 11% on the week. Both technical and on-chain readings now point in the same direction.
On-Chain Activity Offers No Rescue
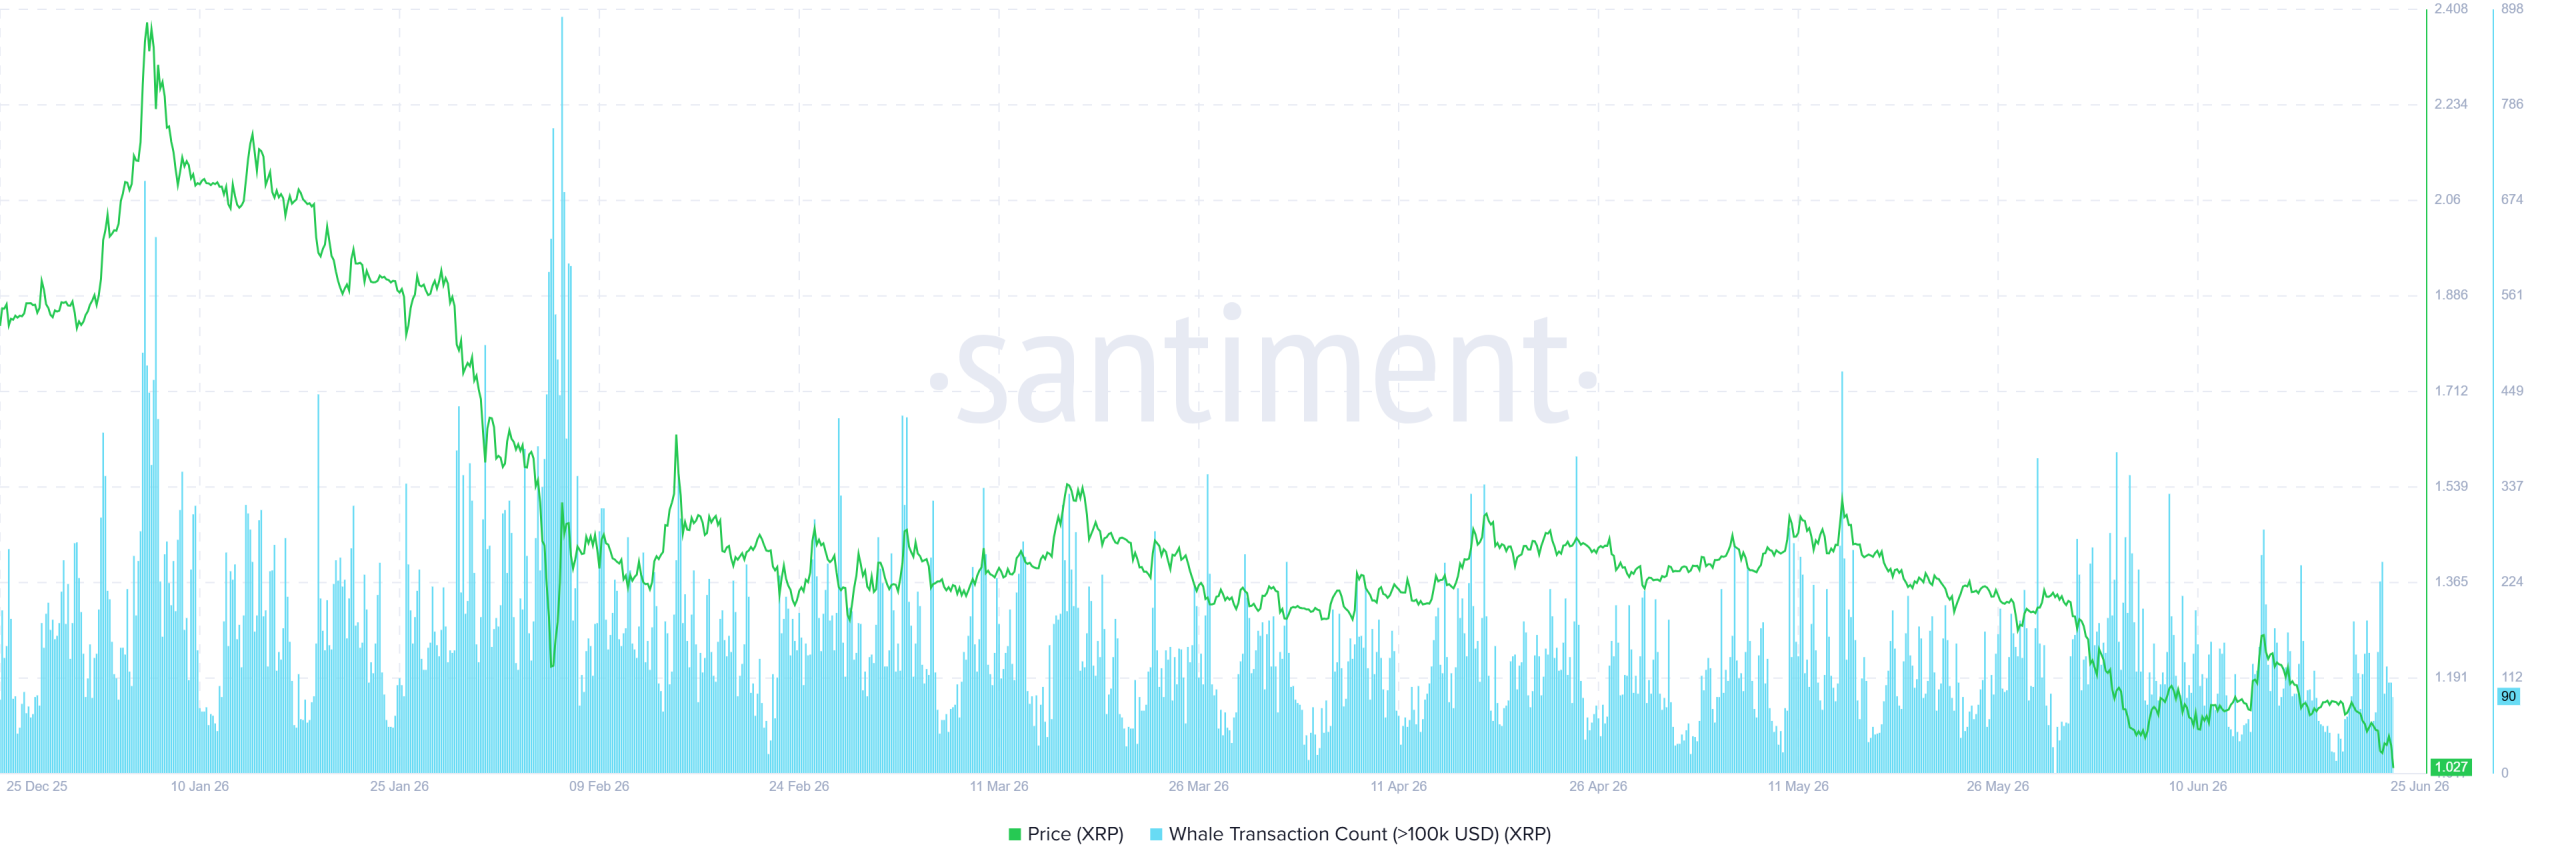
Whale transaction counts above $100,000 have thinned toward the low end of their range. Santiment data shows the metric near 90, far below the early-February peak around 898.
Fewer large transfers point to weak conviction among major holders. Recent on-chain reports also show top whales trimming positions rather than buying the dip.

Social dominance tells a similar story. The metric sits near 0.259%, well below its spring spikes in late March and mid-May.
Those attention spikes failed to halt the decline. Chatter flared as the price fell, then faded, signaling little fresh demand from retail holders.

Both metrics fall together as the price drops. That combination often accompanies distribution, not accumulation, and removes a key prop for any recovery.
On-chain reports for early June describe the same shift. The largest whale cohort trimmed its share of supply through late May rather than adding to positions.
XRP Price and Weekly RSI Both Break Down
On the weekly chart, the XRP price trades below a descending resistance line drawn from the $3.66 top. Sellers have rejected the price at that line four times.
XRP has now fallen more than 50% from that July 2025 record high. The trend has produced a steady stair-step lower since then.
The structure shows consistently lower highs and lower lows. Price also broke down from a symmetrical triangle, projecting a measured target near $0.73.
XRP is now losing its last major support near the 0.786 Fibonacci level around $1.17. Weekly volume continues to decline, suggesting buyers lack conviction.
Below $1.17, the chart shows little structural support before the $0.73 target. A weekly close under the level would confirm the breakdown.

The weekly RSI confirms the weakness. It had ridden an ascending support line since 2022, holding in July 2024 and again in late 2025.
That line broke early in 2026. RSI retested it from below in May, met resistance, and then slid toward oversold readings near 28.
Levels below 30 last appeared in 2022. The reading suggests momentum favors sellers for now.

XRP Outlook Stays Bearish Without a $1.17 Reclaim
The combined picture keeps the near-term bias bearish. The setup may keep XRP under pressure for at least a couple of months.
Deep oversold readings can sometimes precede short-term bounces. Yet the broken trendline and fading demand keep the larger trend pointed lower.
A weekly close back above $1.17, paired with RSI reclaiming its broken trendline, would weaken the bearish case. Until then, the path of least resistance points toward $0.73.
For now, XRP sits on the edge of its last support, and the next weekly close could decide the trend.
The post XRP Quietly Loses Its Last Line of Support appeared first on BeInCrypto.

South Korea confirmed a 22% crypto tax starting in 2027, just as trading volume across its five main exchanges collapsed nearly 55% during the first half of the year.
The timing raises an uncomfortable question about taxing a market that is already shrinking fast.
How the 22% Crypto Tax Will Work
Other income is a tax category covering gains that fall outside wages or business revenue. Under the Income Tax Act, profits from transferring or lending virtual assets will sit in that bracket.
Deputy Prime Minister and Finance Minister Koo Yun-cheol confirmed the schedule on July 29 during a National Assembly committee meeting, saying the government is pushing forward as planned.
The mechanics are straightforward. Annual gains above 2.5 million won, roughly $1,740, face a 20% national tax, while a local levy raises the combined rate to 22%.
Follow us on X to get the latest news as it happens.
Investors below that threshold owe nothing. First returns are expected in May 2028, covering income earned throughout 2027. The measure has a long history of delays. Lawmakers approved it in 2020 for a January 2022 start, postponed it to 2025, then pushed it to 2027.
Opposition remains active. People Power Party lawmaker Kim Sang-hoon criticized the design because investors cannot offset losses against gains earned in later years.
That restriction could push traders offshore. Kim warned activity might migrate toward overseas exchanges, decentralized platforms, or peer-to-peer markets, reducing both volume and tax visibility at home.
Koo acknowledged the concern but resisted changes. Moving crypto into a capital-gains framework would require a review of the broader tax treatment of financial markets, he argued.
Why Is South Korean Trading Volume Collapsing
A separate opposition bill filed in March seeks to remove crypto income from the Income Tax Act entirely. Lawmakers referred it to a subcommittee, keeping repeal or another delay legally possible.
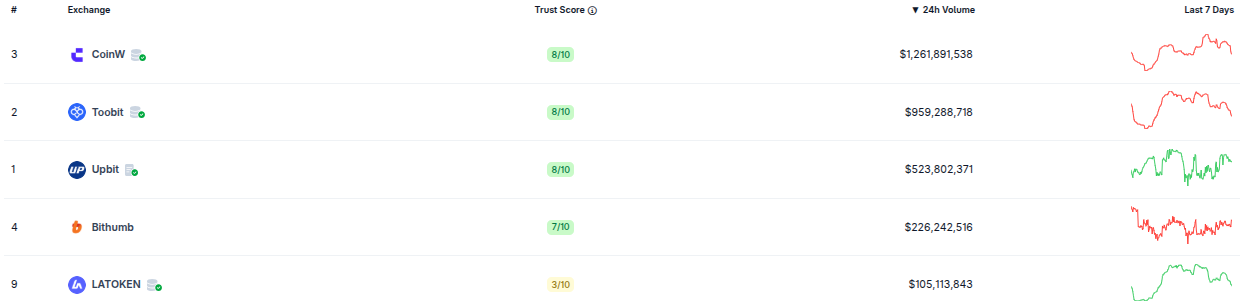
The volume figures explain the anxiety. Upbit, Bithumb, Coinone, Korbit, and Gopax generated roughly $366.58 billion in combined trading volume during the first six months.
That marked a 54.6% drop from the same period in 2025. The contraction continued through July, with cumulative volume falling by 16.9% compared with June.
Concentration is reshaping the market. Upbit processed about 11.69 trillion won in July, and while its volume fell 10%, its market share climbed from 62.3% to 67.4%.
Bithumb moved in the opposite direction. Its share slipped from 30.7% to 27.1%, widening the gap with Upbit to 40.3 percentage points.
Subscribe to our YouTube channel to watch leaders and journalists provide expert insights.

These figures may be attributable to the shift in liquidity concentration toward larger platforms during periods of slowdown.
Deeper order books absorb bigger trades with less slippage, reinforcing dominance when overall activity falls.
Smaller exchanges face real pressure. Coinone, Korbit, and Gopax are reportedly exploring partnerships with securities firms, institutional services, and restructuring.
Future competition may hinge less on raw volume. Stablecoin liquidity, regulatory compliance, and institutional access could matter more than retail spot trading alone.
The post South Korea’s 22% Crypto Tax Crashes Trading Volume appeared first on BeInCrypto.


While exploits in crypto often grab headlines because of the sheer amount of money that gets stolen, Coates emphasized that many of these hacks actually originate outside of blockchain compromises themselves. “In many cases, it is an operational security issue or a Web2 issue that led to a key compromise,” he said.
This will only prove to be more difficult as artificial intelligence advances gives attackers better tools to exploit security practices.
“The social engineering piece is going to get a lot worse because of the power of AI and deepfakes,” Coates said. “We should expect full spoofed phone calls with voices of people that we know… there’s really no reason this won’t hyperscale.
To prevent that, Coates thinks crypto needs to come up with better systems that remain secure and work when people fall for these scams.
“You cannot fully prevent anyone from falling victim,” he said. “Eventually, you will be fooled because the cons are that good.” Organizations should thus have multiple layers of various degrees of security controls, so “when someone gets fooled, the other things take over to protect you.”
For the longer-term, the question of quantum computing largely looms on various crypto ecosystem’s futures, including that of Solana.


The obvious objection is that this is leveraged speculation in new language, and that traditional markets keep their frictions for good reasons. Both points have force. A funding rate is not a substitute for the price discovery that settlement enforces, and continuous leverage on volatile assets concentrates risk in ways periodic markets do not. But those are arguments for building the structure carefully, not for assuming it will not be built. The demand is already here, and it moves toward the venue that offers universal access to global assets, whether stocks, crypto or FX.
There is one place crypto’s progress this cycle has not yet reached. Over the past year, tokens acquired real economic rights, revenue shares, buybacks and votes, while projects with nothing behind them were delisted and some of the strongest teams chose IPOs over token launches. Even the IPO no longer sits outside this system: SpaceX’s shares changed hands as synthetic pre-IPO perpetuals on Hyperliquid for weeks before its June 2026 listing, trading tens of millions of dollars a day in May and swelling to roughly $1.3 billion on debut day as investors shut out of the traditional allocation turned to crypto rails. The market structure beneath perps has not fully followed. The next stage is to build that alignment in, with the transparency now expected across the rest of crypto. That consolidation is happening on centralized venues as much as onchain: the largest exchanges now run multi-asset books where equities, crypto and FX clear side by side, and a single centralized platform accounted for more than half of all real-world-asset perp volume in May 2026. The pull is structural rather than speculative, with 52% of Bitget’s users already holding both stocks and crypto.

Galaxy Research, the research arm of Galaxy Digital, has expanded the on-chain footprint linked to the Coldcard wallet incident that reportedly resulted in the loss of 1,082.65 bitcoin. In a new analysis, the firm identified 1,196 addresses that were involved in transactions tied to that event, widening the estimated scale beyond earlier preliminary figures.
The activity Galaxy Research points to took place between 1:10 AM and 1:51 AM UTC on July 30, spanning blocks 960,183 to 960,191—roughly 30 hours before Coldcard published its first security advisory, as referenced in Galaxy Research’s post on X.
Key takeaways
- Galaxy Research traced a cluster of 1,196 addresses tied to the Coldcard incident, connected to losses of 1,082.65 BTC.
- The movements were observed across blocks 960,183–960,191 between 1:10 AM and 1:51 AM UTC on July 30.
- Galaxy Research says the transactions share a recognizable on-chain pattern (including identical fees and no change outputs), though later attacks may not reuse the same fingerprint.
- Earlier estimates from Rob Hamilton and related analysis suggested a smaller, tighter window of activity that has since been superseded by the larger Galaxy Research mapping.
- Coinkite has said it released a hotfix for a firmware bug, but users who created seeds using the vulnerable firmware may still need to move funds to a new seed.
Galaxy Research widens the address set
According to Galaxy Research, the incident’s impact is visible on-chain in a larger set of wallets than first documented publicly. The firm said it identified 1,196 addresses linked to the Coldcard wallet incident that ultimately resulted in 1,082.65 BTC being moved in the span it analyzed.
Galaxy Research’s tracing work focused on how those funds moved through the network during a specific period. It reported that the key transaction activity occurred between 1:10 AM and 1:51 AM UTC on July 30, crossing blocks 960,183 to 960,191.
That timing is also notable in terms of disclosure. Galaxy Research indicated this took place about 30 hours before Coldcard’s first security advisory was published.
From a smaller estimate to a larger on-chain pattern
Prior to Galaxy Research’s broader mapping, a preliminary view of the incident suggested a more limited sweep. Earlier analysis by AnchorWatch CEO and co-founder Rob Hamilton estimated that 594.48 BTC—worth around $38 million at the time—moved across roughly 500 transactions within a narrow three-block window.
Galaxy Research’s later work does not necessarily contradict the existence of that tight burst; instead, it expands the scope of what can be linked to the event by pointing to a repeatable transaction fingerprint.
In posts on X, Galaxy Research said the identified transactions share specific characteristics, including identical 30 satoshis per virtual byte fees and the absence of change outputs. Galaxy Research described these features as part of the method that allows the initial attack activity to be identified on-chain.
Importantly for users trying to assess exposure, Galaxy Research also cautioned that future attacks targeting Coldcard-generated addresses may not always follow the same on-chain “fingerprint.” That means wallet owners should not assume that the first set of identifiable traits will be reused in later attempts.
What Coinkite says about the firmware bug and the limits of updates
Coinkite co-founder Rodolfo Novak publicly addressed the issue via an X post on Friday, saying the company takes responsibility for the firmware bug and is working to determine the full scope of the problem.
Novak also said Coinkite released a hotfix intended to remove the software fallback path. However, he warned that installing the fix does not retroactively protect seeds that were generated using vulnerable firmware.
In practical terms, Novak advised users who created seeds on the vulnerable firmware to move their funds to a new seed. That distinction—between fixing a flaw going forward and securing already-generated keys—appears to be central to how users should interpret the incident response.
This is also a reminder that “device firmware updates” and “seed security” are not always interchangeable. If the vulnerability affected how seeds were generated or handled, a patch may stop new risk but cannot undo the exposure that may have occurred when the vulnerable firmware produced the original seed material.
Why the expanded tracing matters for incident assessment
The difference between Hamilton’s earlier estimate of 594.48 BTC and Galaxy Research’s later identification of 1,082.65 BTC underscores how incident accounting can evolve as analysts refine clustering techniques and expand time windows. Early on-chain forensics often focus on the clearest bursts; later work may connect additional wallets and transactions using shared traits like consistent fee patterns and transaction structure.
For traders and users, this matters because it changes how incident exposure can be understood. Wallet owners who are evaluating whether they need to move funds may face a moving target: a larger set of addresses suggests that more wallets could have been impacted than initially thought, while Galaxy Research’s warning about fingerprint variability implies that on-chain searches may not capture everything using a single pattern.
For developers and auditors, the episode also highlights the importance of both preventive controls and disclosure timing. Galaxy Research’s observation about the 30-hour gap between the analyzed activity and Coldcard’s first advisory publication frames the timeline in which users may have been acting on incomplete information.
As more details are verified, the key question for the broader ecosystem will be whether subsequent investigations confirm additional waves of activity beyond the identifiable on-chain pattern described by Galaxy Research—and whether Coinkite’s technical findings fully explain how the firmware behavior led to the reported losses.
Readers should watch for further updates from Coinkite on what the bug impacted at the seed level and for additional on-chain analysis that tests whether other clusters of transactions match or diverge from the fee and “no change output” fingerprint outlined by Galaxy Research.
A wallet made for a BNB Chain training video came back to life. BNB Chain says a former employee still had the keys, and used them to launch a meme token nobody at the company approved.
The company is now suing that person. It says it does not own the token, does not back it, and cannot control the wallet.
How a Training Video Created a Real Wallet
It all started with a lesson. An employee set up a wallet address and made a token on it, all for a BNB Chain how-to video.
The token was a demo. It was never meant to trade. The wallet was meant to sit unused.
Then the employee left the company. BNB Chain says they kept the wallet’s seed phrase.
A seed phrase is a short list of words. Anyone holding it owns the wallet forever. Using those words, the former employee made a new private key, according to BNB Chain.
That is the risk. Staff leave, but the words stay in their notebook. Some wallet makers say seed phrase security risks are the biggest flaw in self custody.
BNB Chain Says the Token Is Not Theirs
Months later, the old address showed up again. This time it was tied to a brand new meme token. BNB Chain moved fast to deny any link.
“We are now aware that the same address is being used independently in connection with a new meme token. BNB Chain did not create, authorize, promote or participate in the creation of this token and has no control over the token or wallet address,” the team wrote in a statement.
Follow us on X to get the latest news as it happens
Why the rush? Because a meme coin’s price often rests on who is behind it. Traders on BNB Chain will pile into a token on the smallest hint of official backing.
That happened during the meme coin trading frenzy around tokens named after Binance founder Changpeng Zhao. He also had to shoot down rumors about BNB Chain meme coins earlier this year.
A wallet address can look like an endorsement. Often nobody at the company ever signed off.
“The guy is basically a scammer,” chimed CZ, Binance founder and former CEO.
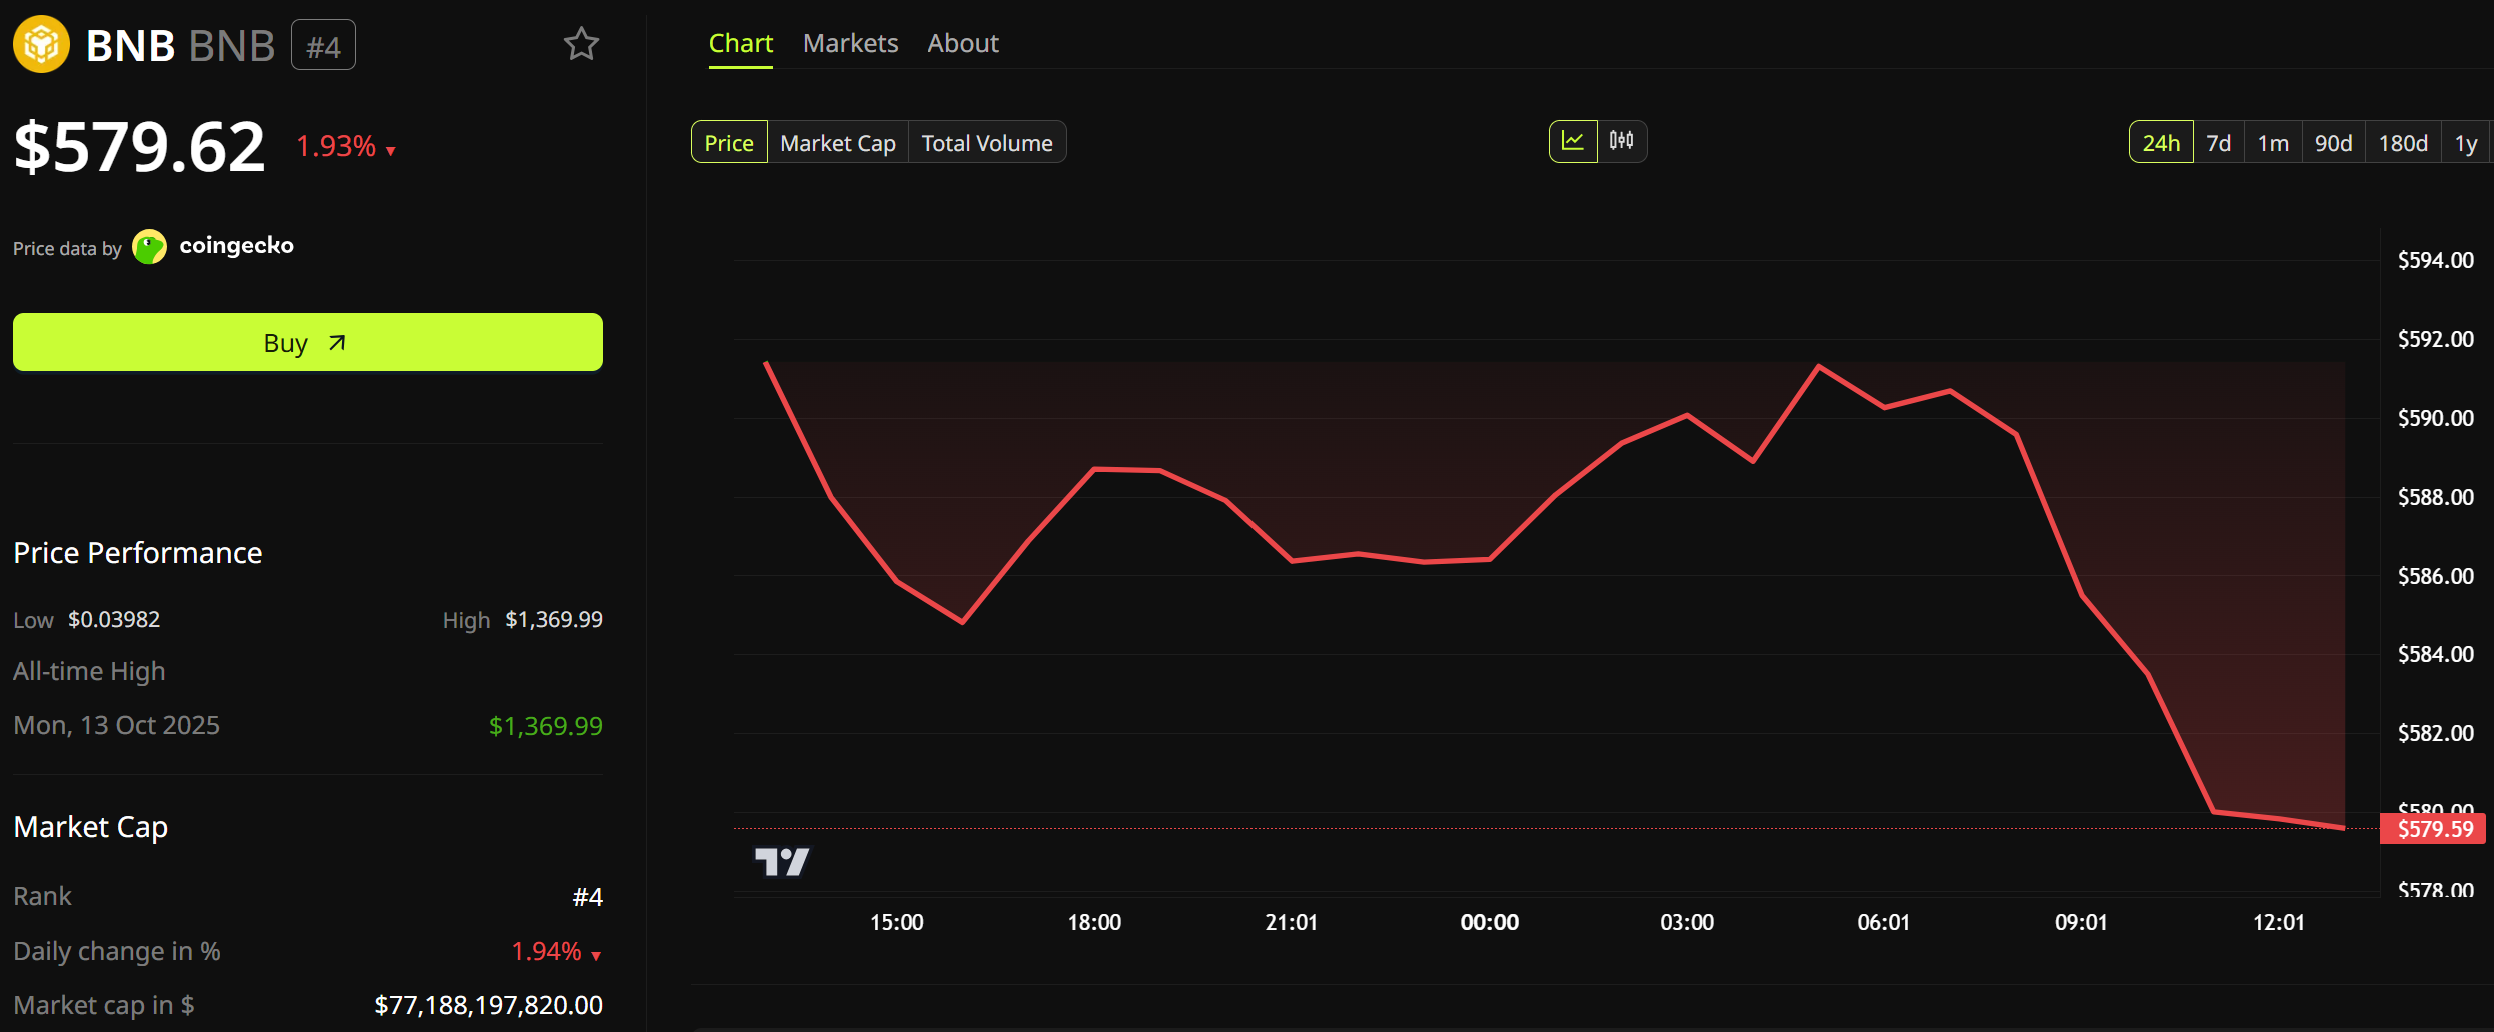
BNB traded lower on Saturday. It sat at $579.62 as of this writing, down 2% in a day, with a market value near $77.2 billion.

What Happens Next
BNB Chain has not named the person nor the new meme token. It has not said where it is filing either. It confirmed only that lawyers and police are both involved.
The case is odd. Most crypto lawsuits deal with hacks or fraud. This one deals with a set of words an ex-employee never handed back.
Courts have barely tested that. A judge may call it theft. Or a broken contract. Or illegal computer access.
The answer could change how crypto firms handle staff exits, but in the meeting, the filings are what to watch.
The post BNB Chain Sues Ex-Employee Over A Tutorial Wallet That Became a Meme Coin appeared first on BeInCrypto.
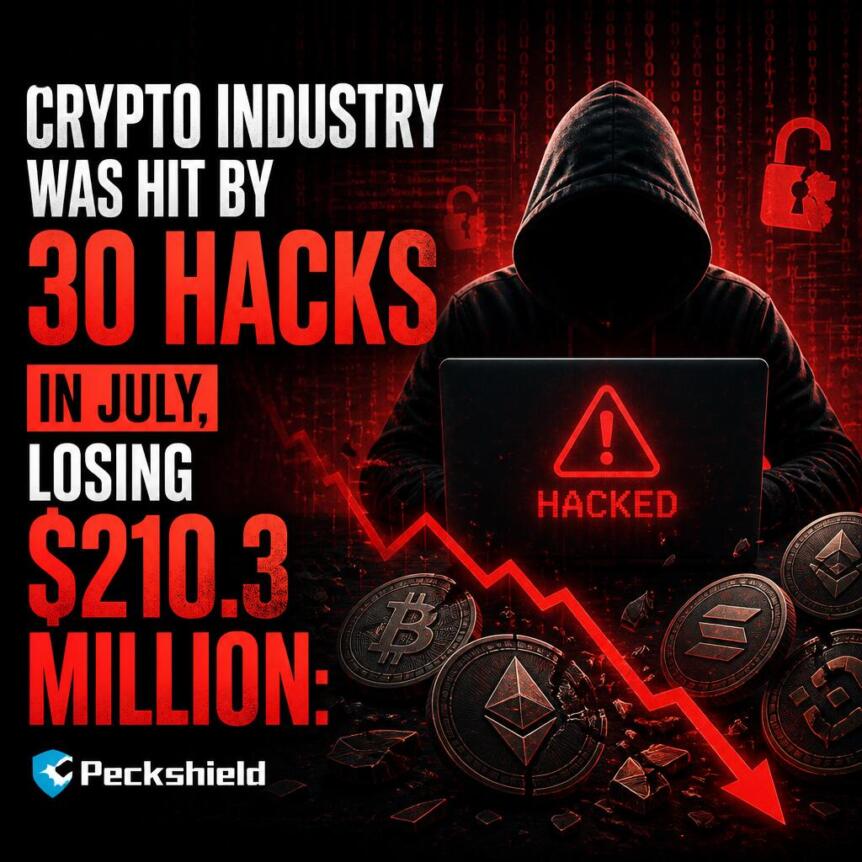
The crypto industry suffered 30 major hacking incidents in July, leading to losses totaling $210.3 million, a significant increase from the $75.87 million reported in June.
The industry has lost $1 billion during the first half of the year, and recorded a record number of hacks within six months, with Ethereum and Solana leading the losses.
Crypto Industry Reports A Surge In Hacking Incidents
PeckShield has reported that the cryptocurrency industry suffered a loss of $210.3 million from 30 major exploits in July, a 177.2% increase from the $75.87 million reported in June. The exploits highlight the persistent security challenges faced by the industry. The losses were driven by a handful of high-profile incidents. The Coldcard Wallet exploit was the largest incident this month, and the third-largest this year, resulting in $70 million in losses.
Other notable security incidents in July include the AFX Trade exploit ($24 million), Ostium ($24 million), BONK ($21.2 million), Wanchain ($13 million), Triple-A ($10 million), Bonzo Lend ($9.05 million), Verus ($7.5 million), WEMIX ($6.25 million), and Summer.fi ($6 million).
Crypto Hacks Cross $1 Billion For 2026
According to Blockaid, an on-chain security platform, the cryptocurrency industry recorded a record number of exploits in the first half of 2026, with losses from these hacks exceeding $1 billion. The attacks were primarily concentrated on Ethereum and Solana, which lost $332 million and $326 million, respectively, to various exploits. Hackers used code exploits to target Ethereum-based protocols, and key and infrastructure breaches on Solana-based protocols.
Hackers Target Ethereum And Solana-Based Applications
Hackers targeted vulnerabilities in Ethereum-based applications. BlockAid stated in its Q2 2026 report that code exploits were the most common tactic used by hackers. However, Ethereum-based protocols such as Humanity Protocol and StablR were targeted through private-key exploits. BlockAid also highlighted other attack vectors on Ethereum, including privilege account exploits, market manipulation, smart contract, and bridge vulnerabilities.
Meanwhile, Drift Protocol, a Solana-based protocol, was targeted through social engineering, with hackers spending months building a relationship with the protocol team before using Solana’s “durable nonces” feature to get members to sign transactions giving them admin control. This allowed the hackers to drain $285 million, over half its TVL, from the protocol. On-chain indicators suggest North Korean hackers were behind the heist. The Step Finance exploit was also attributed to North Korean hackers. The hackers siphoned off $40 million after gaining access to devices belonging to the project’s team. The team then unstaked 261,854 SOL and moved them, causing the value of the STEP token to plummet 80%. However, Solana also saw code-based exploits involving Volo and Raydium.
Disclaimer: This article is provided for informational purposes only. It is not offered or intended to be used as legal, tax, investment, financial, or other advice.

ChatGPT AI predicts a multi-year breakout for XRP, with the price prediction extending all the way to the end of 2027. From today’s $1.07, the model lays out a credible bull-case target of $8 to $15, with an extreme, cycle-driven upside above $20 if crypto enters a genuinely euphoric bull market.
Full regulatory clarity sits at the top of the catalyst list. Increasing institutional adoption of Ripple Payments is cited alongside the expanding use of the XRP Ledger for real-world asset tokenization, the kind of use that would finally give XRP a function beyond speculation.
Broader adoption of RLUSD and potential inflows into a spot XRP ETF are identified as two additional pillars. Growing cross-border settlement volume, improving US crypto regulation, declining interest rates boosting risk assets, and renewed retail participation in a late-cycle bull market round out the full list of tailwinds.
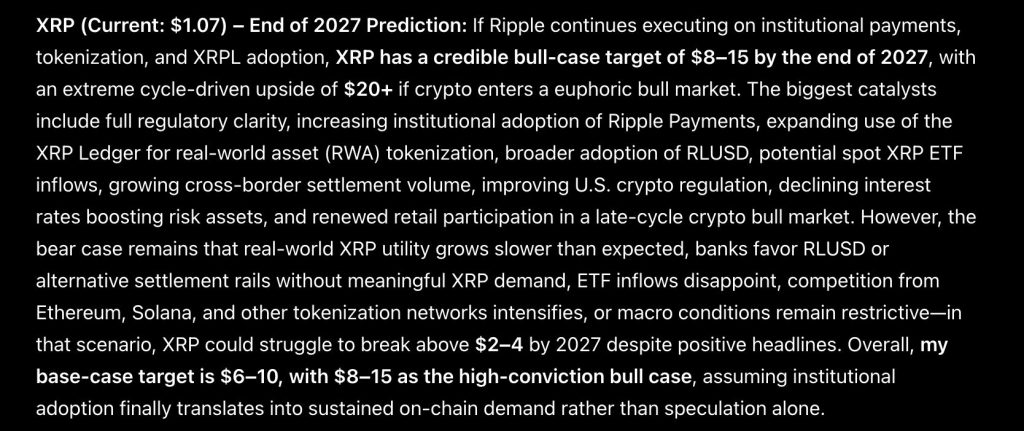
The bear case is treated with real specificity rather than glossed over. Real-world XRP utility could simply grow slower than expected, or banks could favor RLUSD or alternative settlement rails without generating meaningful demand for XRP itself.
ETF inflows being disappointing, intensifying competition from Ethereum, Solana, and other tokenization networks, or macro conditions remaining restrictive are all cited as real risks. In that scenario, ChatGPT sees XRP struggling to break above $2 to $4 by 2027 despite positive headlines along the way.
The overall framing lands on a base-case target of $6 to $10, with $8 to $15 reserved for the high-conviction bull case. ChatGPT is direct that this all assumes institutional adoption finally translates into sustained on-chain demand rather than speculation alone.
Discover: Everyone’s Got a Take. Get Free $25 to Actually Trade Yours
XRP Price Prediction: XRP Has Been In A Downtrend For A Full Year With No Real Break Yet
Price closed at $1.07013, down 1.09%, in a session ranging between $1.06976 and $1.08900. That quiet red day sits at the tail end of one of the longest sustained declines in this coin’s recent history.
Zoom out, and XRP peaked near $3.65 in July 2025, then began a decline that has barely paused since. October brought the first real structural break, gapping down from above $3.10 to under $2.40 in a matter of days, and the slide continued through the rest of the year with only brief, shallow bounces along the way.
February marked a second major leg down, breaking from above $2.00 to under $1.60 before XRP price spent the following months compressing into an increasingly narrow range between roughly $1.30 and $1.60. That range finally broke lower in June, sliding toward current levels near $1.05 to $1.20 where price has been stuck since.
Support sits right at $1.05, the level XRP has tested repeatedly over the past two months. Resistance stacks at $1.20, then $1.40, then the much heavier ceiling near $1.60 that capped every recovery attempt earlier this year.
Momentum here is flat and has been for weeks, with price grinding along a narrow band rather than building toward any real breakout. For ChatGPT’s bull case to have any grounding on this chart, XRP first needs to reclaim $1.60, a level it has not closed above since before the June breakdown, let alone approach the $8 to $15 range this prediction is built around.
Discover: The Best Crypto to Diversify Your Portfolio
Here is What ChatGPT AI Predicts About LiquidChain
Most people will only see this rotation in hindsight. The smart money has already moved.
Large caps are not failing. They are out of room. Bitcoin, Ethereum, and XRP keep pressing against the same ceilings with nothing breaking through. Every macro tailwind has a new arrival date. Every institutional wave lands next quarter. Sitting in assets where the upside depends entirely on someone else’s decision is not a strategy. It is a waiting room.
Capital that has survived enough cycles knows one thing. It moves before the destination becomes obvious.
Early-stage infrastructure plays by completely different rules. A small market cap means that a modest rotation can produce dramatic price movement. The returns live in the gap between what something is genuinely worth and what the market has assigned it so far. That gap exists only while the project remains undiscovered. Once found, it closes permanently.
Multi-chain fragmentation is bleeding DeFi every single day. Bitcoin, Ethereum, and Solana exist as completely isolated systems. No native bridge between them. Every user crossing those boundaries absorbs the cost directly in fees, slippage, and failed transactions. Every single crossing. Every single time.
ChatGPT AI predicts LiquidChain fixes that entirely. All 3 networks within a single execution layer. One deployment reaches everything. Zero cross-chain tax on any interaction.
The presale is at $0.01454 with just over $890,000 raised. The market has not found this yet. That is exactly the point.
Execution is unproven. Adoption is unknown. Established assets offer a predictable ride toward a ceiling everyone can already see. LiquidChain is an entry point that disappears the moment the market looks up.
Trade Memecoins on Bybit and Get a Chance to Win Our $1,000 USDT Airdrop
The post Sam Altman ChatGPT AI Predicts a Historic XRP Price Move Before End of 2026 appeared first on Cryptonews.
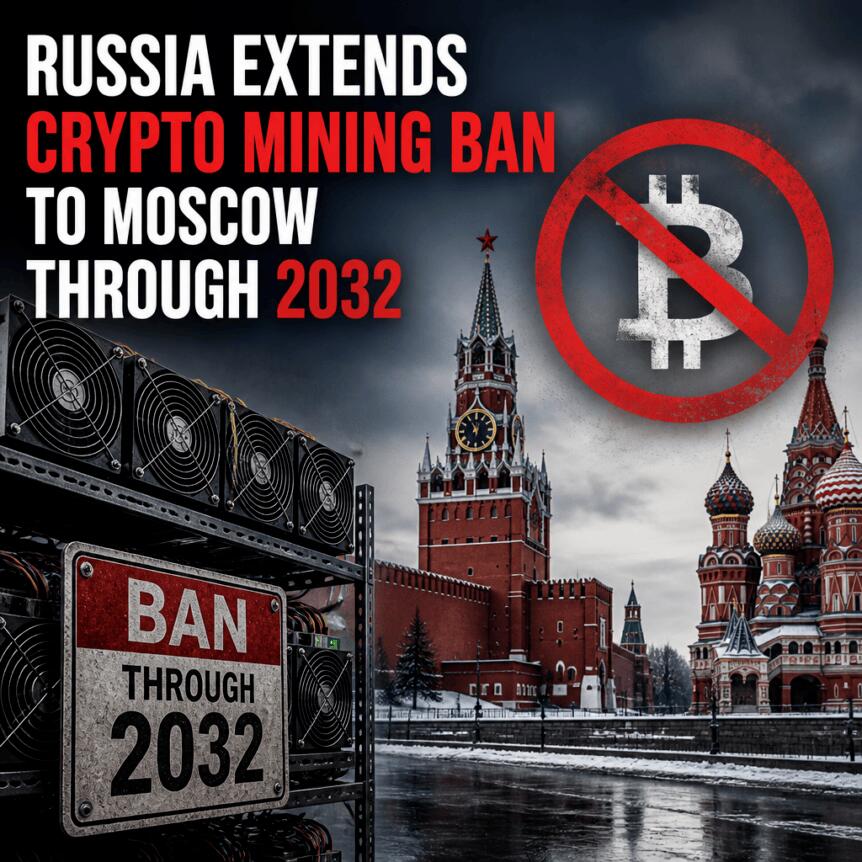
Russia is tightening its cryptocurrency mining rules by expanding a ban that will apply in Moscow and surrounding areas. The restriction takes effect on Aug. 15, 2026, and is scheduled to run through Dec. 31, 2032, according to a government resolution published on Pravo.ru.
The updated measure, signed July 25, 2026 by Prime Minister Mikhail Mishustin, amends earlier restrictions adopted in December 2024. It broadens the list of regions where mining is prohibited, citing electricity supply and demand pressures in power-constrained territories.
Key takeaways
- Russia’s Resolution No. 936 (signed July 25, 2026) extends crypto mining restrictions to Moscow and the Moscow Region.
- The Moscow-area ban starts Aug. 15, 2026 and runs through Dec. 31, 2032.
- Additional affected areas include several territories within Russia’s Kursk Region, plus eight municipal districts and the city of Lgov.
- The Kremlin-linked restrictions build on an earlier Dec. 2024 mining curbs order, and follow region-by-region bans introduced since early 2026.
Resolution expands mining ban into Moscow and nearby territories
Under the revised framework, mining restrictions now include Moscow, the Moscow Region, and multiple areas within Russia’s Kursk Region. The document also lists eight municipal districts and the city of Lgov as part of the restricted zone.
The changes are formalized in Resolution No. 936, referenced in records published on Pravo.ru. The resolution amends an earlier order issued in December 2024, which had already established limitations on cryptocurrency mining in specific parts of Russia.
Electricity demand remains the policy rationale
Russian officials have previously connected mining restrictions to grid strain and rising electricity demand. According to reporting by TASS, the Moscow Region’s energy authorities said a ban was needed as consumption increased.
TASS also cited power infrastructure figures, stating that Moscow and the Moscow Region have 65 data centers linked to the grid with a combined capacity of 734 megawatts (MW). Within that total, 19 data centers are located in the Moscow Region, totaling 233 MW of capacity.
While the new resolution expands the restricted geography, the underlying logic mirrors earlier steps: authorities are attempting to limit additional load from mining activities in areas where power supply and demand are already under pressure.
Earlier regional restrictions set the stage for a broader move
This Moscow-focused expansion follows a broader pattern of state action against crypto mining in selected regions. The updated rules amend the December 2024 restriction order, which had already begun shaping where mining could operate.
Earlier restrictions were also introduced in parts of Russia, including areas in Buryatia and Zabaykalsky Krai. As described in the Pravo.ru records, those bans were set to run from April 1, 2026 through March 15, 2031.
In other words, Russia is not simply imposing a new nationwide approach; it is layering restrictions by region—first in selected territories and now into major urban and power-dependent areas like Moscow and its surrounding region.
What to watch next for miners and operators
For mining companies and energy-intensive operators, the key practical implication is that compliance will depend heavily on location rather than a single countrywide rule. With the start date set for Aug. 15, 2026 and a long time horizon through 2032, operators in or near the newly restricted areas will need to plan for regulatory compliance well ahead of implementation.
Investors, traders, and builders should watch whether authorities continue expanding the banned geography beyond Moscow and Kursk, and whether grid-capacity reporting becomes more central to future policy decisions. Additional region-specific amendments would further reinforce Russia’s approach of using electricity supply constraints as the deciding factor for mining permissions.

In the latest Bitcoin news, Gelephu Mindfulness City, Bhutan’s southern special administrative region, has named Toronto-based 3iQ Corp. as the first institutional manager for a portion of its Bitcoin treasury, formalizing what had been a state-level BTC accumulation strategy into an active, named-mandate arrangement.
The announcement, dated July 30, 2026, marks the first concrete step toward deployment since Bhutan announced in December 2025 that up to 10,000 Bitcoin from its national holdings would be allocated to support GMC’s long-term development.
The mandate grants 3iQ discretionary management over a defined portion of GMC’s Bitcoin reserves, though the press release does not disclose the specific amount of BTC, the custody arrangement, permitted strategies, or the fee structure.
That opacity is notable for a sovereign-linked reserve mandate; operational details that traders would typically expect to accompany an institutional announcement of this scale remain absent.
Discover: Crypto prediction markets, regulated and live
Bitcoin News: What the Mandate Actually Covers
Per the announcement, 3iQ’s role extends beyond conventional asset management. The firm has committed to investing in local talent development, knowledge transfer, and establishing a permanent office in Gelephu, positioning itself as a founding institutional partner in building GMC into what the city describes as “Bhutan’s new digital offshore financial hub.
” 3iQ CEO Pascal St-Jean said the firm would put Bhutan’s capital to work “responsibly, transparently and for the long term.”
Jigdrel Singay, a board director at GMC, described 3iQ as one of the city’s founding institutional partners and specifically cited the firm’s commitment to building local capabilities as a differentiating factor in the selection process, not just its track record in digital asset management.
GMC’s choice of 3iQ reflects a deliberate approach of pairing national capital with institutional-grade external expertise rather than managing reserves purely in-house.
3iQ is a subsidiary of Coincheck Group N.V. (NASDAQ: CNCK), a NASDAQ-listed holding company based in the Netherlands.
Founded in Toronto in 2012, 3iQ built its reputation as Canada’s first regulated digital asset fund manager and was the first to launch a Bitcoin and Ethereum ETP on a major global stock exchange. The Gelephu mandate represents a significant expansion of the firm’s client profile into sovereign and quasi-sovereign territory.
Discover: Turn your market view into a position on Kalshi
Bhutan’s BTC Position and the GMC Build-Out
Bhutan’s Bitcoin reserves were accumulated primarily through hydropower-backed mining and managed by Druk Holding and Investments (DHI), the kingdom’s sovereign investment arm.
Arkham Intelligence data shows Bhutan’s sovereign holdings have shifted significantly over the past two years – from roughly 13,390 BTC in October 2024 to an estimated 5,600 BTC by mid-2026, with more than $237 million moved out of reserve addresses since January, likely to fund domestic infrastructure priorities, including GMC itself
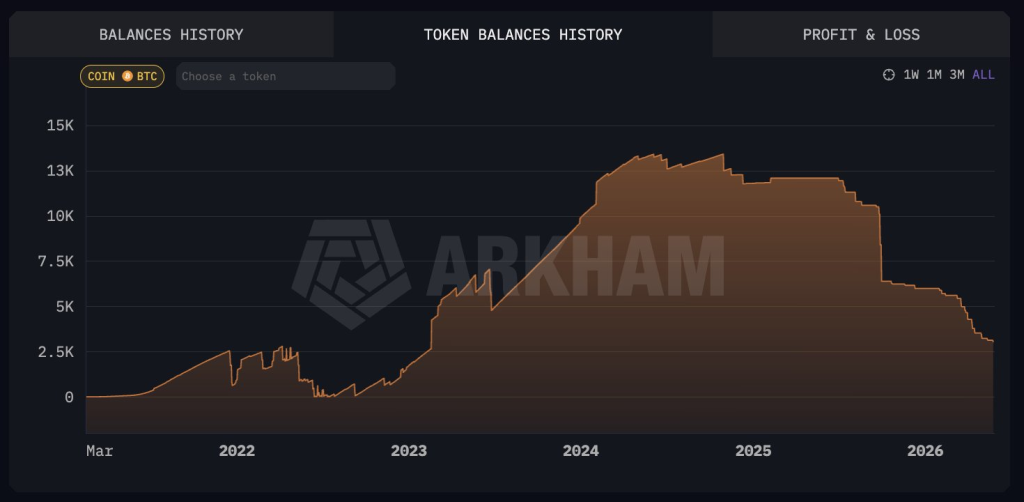
The 3iQ partnership represents what the primary source calls “the next step” in deploying the Bitcoin earmarked for Gelephu, signaling that at least a portion of GMC’s BTC allocation is being held and professionally managed rather than liquidated.
That distinction matters: Bhutan has been simultaneously selling part of its stack while now institutionalizing management of the remainder – a shift from pure accumulation toward active portfolio deployment.
GMC has been constructing the broader regulatory infrastructure to attract additional operators. According to supplementary reporting, the zone introduced a fast-track licensing route for firms already regulated in Singapore, Hong Kong, and Abu Dhabi, offers zero corporate tax in selected sectors, and provides access to banking through DK Bank.
The 3iQ mandate is framed as the first of several milestones the two organizations plan to announce as GMC pursues its goal of becoming a competitive digital offshore financial center, placing it in the same strategic conversation as established hubs, but with a sovereign BTC-mining backstory as its capital base.
Discover: Think you know where this ends up? Trade it on Kalshi
The post 3iQ Corp Named Institutional Manager of Bhutan’s Bitcoin Reserves appeared first on Cryptonews.


Bitget has upgraded its Bitcoin-backed BGBTC asset with daily BTC-denominated rewards, cross-chain transfers through Chainlink CCIP, and independent oversight from Gauntlet.
Summary
- BGBTC holders will receive daily rewards denominated in Bitcoin following the upgrade.
- Chainlink CCIP will serve as BGBTC’s canonical cross-chain infrastructure.
- Gauntlet will independently oversee the asset’s underlying yield strategies.
- BGBTC remains backed by Bitcoin at a 1:1 ratio, according to Bitget.
Bitget adds daily Bitcoin rewards to BGBTC
Bitget said the upgraded BGBTC will distribute daily rewards denominated in BTC to token holders. The asset is designed to maintain a 1:1 peg with Bitcoin while allowing users to earn yield without selling their underlying exposure.
The exchange is positioning BGBTC as an alternative to holding idle Bitcoin or moving BTC into separate yield strategies. Those strategies can require users to transfer assets between platforms, manage additional protocols, or accept reduced liquidity.
BGBTC already has several uses within the Bitget ecosystem. Holders can use the asset as futures margin, lending collateral or for participation in the exchange’s Launchpool and PoolX products.
The upgrade also introduces support for large-volume and faster redemptions, according to Bitget. The company said it has added institutional-grade risk controls and greater transparency, although specific reward rates and redemption thresholds were not provided in the announcement.
Rewards remain tied to the performance and sustainability of the underlying yield strategies. A Bitcoin-backed token can also carry platform, custody, smart-contract and liquidity risks that differ from holding BTC directly.
Chainlink CCIP supports cross-chain BGBTC transfers
Bitget selected Chainlink’s Cross-Chain Interoperability Protocol as the canonical infrastructure for distributing BGBTC across multiple blockchain networks.
CCIP provides the messaging layer needed to move the asset between supported chains. The integration could allow holders to access decentralized applications and financial services outside Bitget’s centralized platform while retaining exposure to the Bitcoin-backed token.
Bitget already uses Chainlink Proof of Reserve to verify the assets supporting BGBTC. Proof of Reserve provides on-chain data intended to help users assess whether sufficient collateral exists behind the issued supply.
Combining Proof of Reserve with CCIP addresses two separate functions. The reserve system focuses on collateral verification, while CCIP handles communication and token transfers across blockchains.
Bitget did not identify every blockchain that will initially support BGBTC through CCIP or provide a schedule for additional network deployments.
Gauntlet will oversee BGBTC yield strategies
Gauntlet has been appointed as BGBTC’s independent curator and will supervise the strategies used to generate rewards for holders.
The quantitative risk-management firm will monitor the underlying portfolio, assess risks and help determine how capital is deployed. Bitget said the framework is intended to support the long-term sustainability of BGBTC’s yield rather than relying on an unmanaged set of strategies.
Independent curation adds another layer of oversight, but it does not eliminate losses. Reward levels may change based on market conditions, available strategies, and the performance of the assets or protocols involved.
Bitget is also working with infrastructure providers, including Chainlink and Morph, as it seeks to connect centralized and decentralized financial services through a broader Bitcoin yield network.
The company cited USDGO Holderyield as another part of its effort to let users earn returns from assets that would otherwise remain idle.
What the upgrade means for Bitcoin holders
BGBTC combines Bitcoin exposure, daily rewards and cross-chain utility in a single token. Users can potentially earn BTC-denominated returns while deploying the asset as collateral, margin or capital in supported decentralized applications.
For US investors, access to BGBTC and related Bitget services may depend on geographic and product restrictions. Users should confirm whether the exchange, token, and associated yield products are available in their jurisdiction before transferring funds.
Yield paid in BTC may also create tax-reporting obligations for US holders, depending on how the rewards are classified and when users gain control of them. Bitget did not announce any US-specific rollout or regulatory approval alongside the upgrade.
Future adoption will depend on the reward rate, redemption performance, supported networks, and transparency around the underlying strategies. Bitget has not yet disclosed a fixed annual yield or a complete cross-chain deployment timeline.

Nvidia’s Vera CPU and the Olympus cores that power it: Deep dive

Amsr unboxing 1 million dollars money cash dinero. #money #motivation #dinero

A great 12-mile walk from Masham to Middleham in the Dales


-
 Sports6 days ago
Commonwealth Games boxing: Jadumani Singh seals dominant 5-0 win over Pakistan’s Sumama Rehman to enter quarter-finals | Commonwealth Games News
-

 Business3 days ago
Why Trees Belong on the Risk Register
-

 Fashion20 hours ago
Weekend Open Thread: Wit & Wisdom
-

 Politics16 hours ago
Meta enters AI-training agreement with far-right ‘propaganda rag’ Newsmax
-

 Tech6 days ago
Intel is reversing course and bringing hyper-threading back to its server chips
-

 Crypto World7 days ago
Ripple bought a bank in pieces. The $4 billion audit
-

 Politics5 days ago
Luke Littler dismantles Gerwyn Price to retain title in Blackpool
-

 Politics4 days ago
The Part of the Electric Transition Nobody Wants to Discuss
-

 News Videos6 days ago
BITCOIN JUST ENTERED THIS CRITICAL ZONE…
-
 Entertainment4 days ago
‘Stargate’ Creator’s New Sci-Fi Series Returns for Season 3 Tomorrow
-

 Business3 days ago
Major shareholder moves on Canyon
-

 Crypto World6 days ago
XRP Ledger adds $2.6B as RWA inflows rank second
-

 Politics6 days ago
Spain sweeps the board at 2026 World Cup with individual awards
-

 News Videos2 days ago
Bitcoin Enters the 3rd Stage of the Bear Market
-
Crypto World7 hours ago
XRP Ledger v3.3.0 brings five institutional features
-

 Entertainment7 days ago
Sara Gilson Killed By Husband After Viral “Pedophile” TikTok Video
-

 Crypto World4 days ago
Kraken Enables Retail Access to Jersey Mike’s IPO via Tokenized Shares
-

 News Videos4 days ago
Claude: Build Financial Dashboards in Minutes (2026)
-

 Tech5 days ago
New macOS Sequoia & Sonoma security updates for older Macs
-

 Politics2 days ago
Luke Littler’s dominance sparks GOAT debate
You must be logged in to post a comment Login