We passed the mathematical halfway point of the season last week and we’re less than two weeks away from the All-Star break. The trade deadline is only a month away. Are the various postseason races any clearer now than they were a month ago? No, not really. That could make swinging deals at the deadline even more challenging because there are fewer willing sellers.
Until the trade market really heats up, here are three trends around the league to keep an eye on as we head into the dog days of summer.
By any measure, Pirates ace and reigning NL Cy Young winner Paul Skenes is having a fantastic season. Going into Tuesday, he ranked fifth among qualified starters with 2.8 WAR and was second with a 30.6% strikeout rate. His expected ERA, which factors in contact quality allowed (exit velocity, etc.), was second only to Jacob Misiorowski. Skenes has been terrific.
It is also true that Skenes this year has not been quite as dominant as in the last two years. His 3.10 ERA is more than a full run higher than 2024-25, his 2.75 FIP is up almost half a run from 2025, and his overall pitching value per Statcast has slipped from the 100th percentile last season to the 95th percentile this season. Still excellent, obviously, but a step down from 2024-25.
In his last eight starts, Skenes has a 4.40 ERA and 3.45 xERA, and he’s allowed four runs three times. Already three times this year, he’s allowed five runs, and five times he’s allowed at least four runs. Last year, Skenes allowed five runs once and at least four runs only four times. That has prompted a round of “what’s wrong with Skenes?” questions, understandably.
Advertisement
There are two big and pretty obvious reasons 2026 Skenes has been a (slight) step down from 2024-25 Skenes. Let’s examine.
1. Pittsburgh’s defense is awful. The eye test says it and the numbers confirm it. The Pirates, with an outfield full of DHs, have -12 outs above average as a team. Their Defensive Efficiency, which is simply the percentage of batted balls converted into outs, is sixth-worst in baseball at 0.691 (69.1%). The MLB average is 0.700.
The defense has hurt Skenes more than most. Among the 168 pitchers who’ve had at least 100 defensive opportunities behind them, only three have been hurt more by their defense than Skenes.
The Pirates are at -12 OAA as a team, remember, which means they’re at -6 behind Skenes alone and -6 behind every other pitcher on the staff. They’ve channeled half their poor defense behind a guy who’s thrown 12% of their innings. xERA and barrel rate tell us Skenes doesn’t give up much hard contact, yet the Pirates aren’t making plays behind him.
Advertisement
2. There’s some sample size noise with men on base. With the bases empty, Skenes is holding hitters to a .178/.244/.342 batting line. With men on, those numbers jump to .254/.286/.328. This is a new issue. Skenes held hitters to a .187/.257/.251 line with men on base from 2024-25 and that looks a lot like his 2026 numbers with the bases empty.
Because he doesn’t allow many baserunners in general, only about one-third of the batters Skenes has faced this year have come with men on base. Those batters have a .319 batting average on baseballs in play, up from .262 with men on the last two years and his .276 career average overall. In a relatively small sample with men on, more balls have found grass this year.
This ties back to Pittsburgh’s shaky defense. We saw it right in the first inning on Opening Day. Surely you remember this:
It is notable that Skenes has lost velocity. His average fastball has dipped from 98.8 mph in 2024 to 98.2 mph in 2025 to 97.0 mph in 2026. Velocity loss is normal. Most pitchers never throw harder than they do in their first year in the big leagues. The velocity loss only shows up in Skenes’ fastball. It’s not an across-the-board decline, suggesting he may be taking something off to locate better.
Advertisement
Even with the velocity loss, Skenes is getting great results with his fastball. The swing-and-miss and hard contact numbers are not just in line with 2024 and 2025; they’re better. This is the most effective Skenes’ fastball has ever been, really. I understand pointing to the velocity loss and worrying about it, but it’s not the root cause of his recent problems. His fastball’s plenty good.
More than anything, the Pirates have to do a better job catching the ball behind their ace. Playing just below-average defense would be an improvement. The numbers with runners on base scream small sample size weirdness. Skenes showed us the last two years he can dominate in those situations. As long as he’s healthy, and by all accounts he is, I wouldn’t worry about him at all.
“I’m happy with it overall,” Skenes said about his season to date last week (via MLB.com). “I think it’s been a little bit odd. But in terms of the controllables, I’ve been happy with how I’ve been throwing, and just gonna continue to get better.”
For several years now, the Guardians boasted one of baseball’s best and deepest bullpens. By OPS+, Cleveland has not had even a league-average offense since 2022. The formula has been good starting pitching, scratch out a few runs, then smother the other team with the bullpen. It’s worked well for them. The Guardians have won the last two and three of the last four AL Central titles.
This year, things are not quite going according to plan. José Ramírez’s hamate injury has, predictably, been a significant blow. Going into Tuesday, the Guardians were averaging 3.46 runs per game since Ramírez’s injury. It was 4.01 runs per game before that, and even that is well below the 4.49 league average. Cleveland has very little margin of error with this offense now.
To make matters worse, the bullpen is no longer the dominant, best-in-the-league force. It isn’t a bad bullpen by any means, but it’s closer to middle of the pack now rather than elite. Here are the bullpen’s numbers going into Tuesday:
ERA
2.57 (1st in MLB)
Advertisement
3.44 (3rd in MLB)
3.94 (13th in MLB)
xERA
3.38 (2nd)
Advertisement
3.63 (3rd)
4.03 (14th)
K rate (per batter faced)
26.0% (3rd)
Advertisement
24.6% (5th)
26.4% (1st)
BB rate (per batter faced)
8.1% (7th)
Advertisement
8.6% (9th)
9.7% (15th)
HR rate (per 9 IP)
0.75 (1st)
Advertisement
0.81 (3rd)
1.07 (18th)
WAR
7.8 (1st)
Advertisement
6.6 (3rd)
2.6 (11th)
Win probability
14.89 (1st)
Advertisement
8.45 (3rd)
2.69 (7th)
By win probability added, the 2024 Guardians had the best bullpen in baseball history. That was a dominant, suffocating unit that carried a not-quite-league-average offense to 92 wins and an ALCS berth. Last year’s bullpen was not 2024 good, but it was very good, and one of the best in baseball. Manager Stephen Vogt has almost no bad options out there.
This year’s bullpen piles up strikeouts but is middle of the pack everywhere else. xERA, or expected ERA, incorporates exit velocity, and tells us Cleveland’s bullpen is giving up more hard contact this year than in the past. That shows up in the home run rate too. Closer Cade Smith has given up three homers already this year. He gave up five over the previous two years combined.
Advertisement
Last week, Smith gave up home runs on back-to-back pitches to blow a save against the White Sox. The Guardians came back to win that game, but it was the sort of ninth-inning meltdown that a) Cleveland can’t afford with their current offense, and b) is uncharacteristic for Smith, who has otherwise been terrific this season.
The elephant in the room here is Emmanuel Clase, who will almost certainly never pitch in MLB again given the gambling scandal. Clase’s last game was last July 26 and he was a top closer right up until he was put on administrative leave. He’s gone now and that’s one fewer high-end reliever the Guardians have to work with. Clase’s on-field production has been missed.
Without a top-tier bullpen, the plan becomes much harder to execute. Only the Padres average fewer runs scored per game than the Guardians. Whatever leads they can build, the bullpen must make stand up, and the bullpen hasn’t always made things easy this year. Again, it’s a good bullpen. It’s just not a great bullpen, and the Guardians were built around great bullpens for years.
The sudden drop in ‘drag’
Three months into the season, offense has been up and down league-wide. Up and down and then up again, more accurately. It’s easiest if I just show you the numbers:
Advertisement
April
4.51
1.07
.243/.323/.393
Advertisement
May
4.30
1.07
.239/.314/.390
Advertisement
June
4.65
1.29
.249/.320/.419
Advertisement
The league’s home run rate and thus overall offense always tick up in the summer. The weather warms up and the ball flies farther, plus hitters get into midseason form. There’s also attrition on the pitching side. Whenever a pitcher gets hurt, he is replaced by someone who was in Triple-A. A diluted pitching pool contributes to the league’s offensive environment as well.
Offense ticks up as we get into the summer, though it rarely dips in May like it did this year. It dipped significantly. The difference between April (4.51 runs per game) and May (4.30 runs per game) is one run per team every five games, give or take. It’s six additional runs each night across the league for an entire month. It adds up. For whatever reason, offense dipped in May.
It’s also notable that the offensive uptick in June came with a decline in “drag” on the baseball. In English, drag measures how the baseball interacts with the air. When there’s more drag, the ball doesn’t fly as much. When drag is low, the ball carries. The seams on the baseball, how tightly wound the core of the ball is, things like that affect the drag on the baseball.
On Wednesday, MLB issued a statement to The Athletic saying there was a recent aesthetic issue related to “excess oil from the yarn inside the baseball,” and added they don’t see any evidence showing this issue is causing the decline in drag. Here is the league’s statement:
In early February, Rawlings notified MLB of an aesthetic issue with the baseballs that shipped for 2026 Spring Training and the Regular Season. In approximately 50% of the baseballs, some excess oil from the yarn inside the baseball filtered through the leather cover of the ball, creating some yellow discoloration. Both Rawlings and MLB’s independent laboratory at UMass-Lowell completed testing on these baseballs, and the baseballs were within specifications and performed consistent with prior years. We notified the Clubs and the MLBPA of the issue in February, and consistent with baseball chain of custody procedures, MLB’s gameday compliance monitors remove any baseballs that show cosmetic imperfections after the pregame mudding process. Rawlings has resolved the issue with the yarn supplier, but due to the necessary lead times associated with baseball production, the balls without the staining will not be shipped to Clubs until late in the 2026 season or early 2027.
MLB makes drag data available to the public on Baseball Savant and we are aware of the recent reduction in drag. To be clear, there has been no change in the materials or manufacturing process of the baseball. Because the baseball is hand-sewn and is made with natural materials, we expect variation in performance both throughout the season and between seasons. Rawlings and our scientists do not see any evidence to date that the yellow staining is related to this change in drag. We will continue to monitor the performance of the baseball as the season progresses.
Every baseball is handmade at the Rawlings factory in Costa Rica (MLB owns Rawlings) and every handmade process will come with variations. Some baseballs have higher seams than others, a tighter core, etc. The league has specification ranges for the baseball and even little variations within those ranges (seam height, etc.) can have a big impact on the way the baseball plays.
Advertisement
Whatever the reason, drag on the baseball has declined these last few weeks, and when drag is down, the ball carries more. We’re seeing that show up in the league’s home run rate. Drag is one of several factors explaining why offense was up last month. Drag, the weather, pitching talent, games in Las Vegas, all that contributes to the state of offense.
The new 2026/27 football season is almost here, with the Scottish Premiership kicking off on 31 July and the Premier League starting on 21 August.
This article contains affiliate links, we will receive a commission on any sales we generate from it. Learn more
The World Cup concluded barely three weeks ago, yet football supporters have little time to rest – the new club season is almost upon us and promises to be an exciting one.
Advertisement
With the Scottish Premiership kicking off this week and the Premier League not far behind, now is the perfect moment to ensure you’re ready to watch all the action unfold.
Sky Sportsremains the premier destination for live football in the UK, broadcasting at least 215 Premier League fixtures throughout the season – and that’s merely the beginning. From the opening whistle in Scotland to the dramatic final day in May, there’s an abundance of football to anticipate.
The new Scottish Premiership season begins on Friday with an enticing opener as Derek McInnes starts his spell as Rangers manager, leading his team to face Dundee United. Just three weeks afterwards, the Premier League commences with an appetising curtain-raiser as Arsenal, aiming to retain their title, host Frank Lampard’s Coventry City.
To ensure you don’t miss any of the action, Sky TV’s Essential TV package with Sky Sports is available from £35 monthly with no upfront costs. The package provides access to Sky Stream, Netflix and Sky Sports, although it’s important to note there’s a minimum 24-month contract on this offer and prices may vary during the term.
Advertisement
Countdown to Kickoff: The Ultimate 26/27 Sky Sports Bundle
Sky’s Ultimate TV and Sky Sports bundle includes at least 215 live Premier League clashes across the 2026/27 season with more than 1,400 live games across the EFL and beyond, plus F1, golf and darts.
Every subscription now comes with 135 channels alongside free subscriptions to HBO Max, Netflix, Disney+, discovery+ and Hayu.
With the Essential package, supporters can enjoy a minimum of 215 live Premier League matches, over 1,000 EFL fixtures – including all the Carabao Cup action – plus a dedicated F1 channel and coverage of all the major golf tournaments.
Fans may also wish to add TNT Sportsto the package for an additional £25 per month – fixed for 24 months – with Champions League, Europa League and Europa Conference League action all available at the touch of a button, beginning with Aston Villa’s UEFA Super Cup clash with PSG on Wednesday (August 12).
Advertisement
Further packages are also on offer, including theUltimate TV package from just £24 a month, which incorporates HBO Max, Netflix, Disney+, discovery+, Hayu, and 135 live channels. Sky Sports can also be added for an extra £20 a month, though the same conditions still apply.
TNT Sportswill also broadcast selected Premier League games on TV and its new streaming platform HBO Max. TNT typically holds the broadcast rights to one fixture per gameweek, with Hull vs Man United the first to be aired next season.
Supporters will require a separateTNT Sports subscription to access its coverage, priced at £30.99 via HBO Max or Prime Video’s TNT Sports channel.
Alternatively, fans may prefer to soak up the atmosphere of the opening fixtures this season by purchasing tickets through Seat Unique, which offers a wide range of hospitality options throughout the campaign.
Advertisement
Key TV Fixtures & Dates
Here are the list of the football matches to be shown live on TV from this weekend’s Scottish Premiership opener to to the opening weekend of the Premier League next month:
Friday 31st July: Start of the Scottish Premiership — Dundee United v Rangers ( Sky Sports )
Saturday 1st August: Carabao Cup Preliminary Round — Tranmere v Rochdale ( Sky Sports )
Thursday 6th August: Carabao Cup First Round — Bristol City v Walsall ( Sky Sports )
Wednesday 12th August: UEFA Super Cup — PSG v Aston Villa ( TNT Sports )
Friday 14th August: Start of the Championship and EFL — Wolves v Blackburn ( Sky Sports )
Sunday 16th August: Community Shield — Arsenal v Man City ( TNT Sports )
Friday 21st August: Start of the Premier League — Arsenal v Coventry ( Sky Sports )
Saturday 22nd August: Premier League — Hull City v Man United ( TNT Sports )
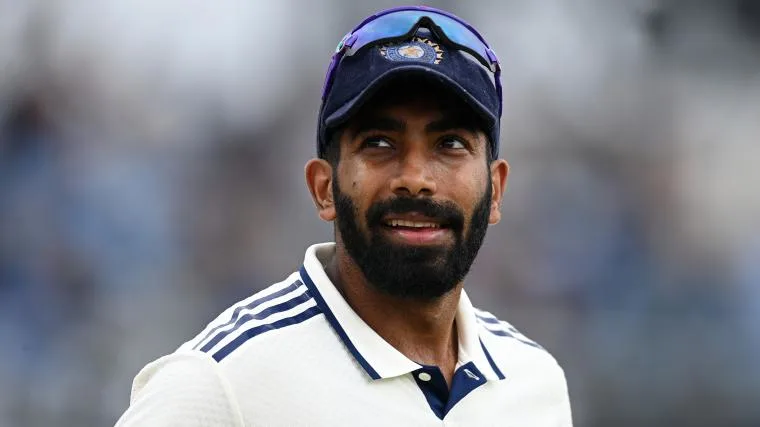
Auqib Nabi favourite to replace Bumrah in India’s Test squad.
Advertisement
Jasprit Bumrah set to sit out Sri Lanka Tests as knee recovery drags on
India’s premier fast bowler Jasprit Bumrah will reportedly miss the upcoming two-match Test series against Sri Lanka, scheduled to begin in Galle on August 15.
According to The Times of India, the pacer is still experiencing discomfort in his left knee. It is a concern that surfaced during the second ODI against England.
Advertisement
The medical team at the BCCI Centre of Excellence has concluded that rushing him back onto the field wouldn’t be worth the risk, and has chosen instead to prioritise a complete recovery.
Earlier reports this week had already indicated that BCCI’s medical staff recommended Bumrah undergo an injection to address the knee trouble.
Advertisement
The 32-year-old received that injection as planned last month, but his full recovery now appears to be taking longer than doctors initially anticipated. There had been some internal discussion around getting him fit in time for the second Test in Colombo, but the medical team at the Centre of Excellence has opted against taking any chances with his fitness.
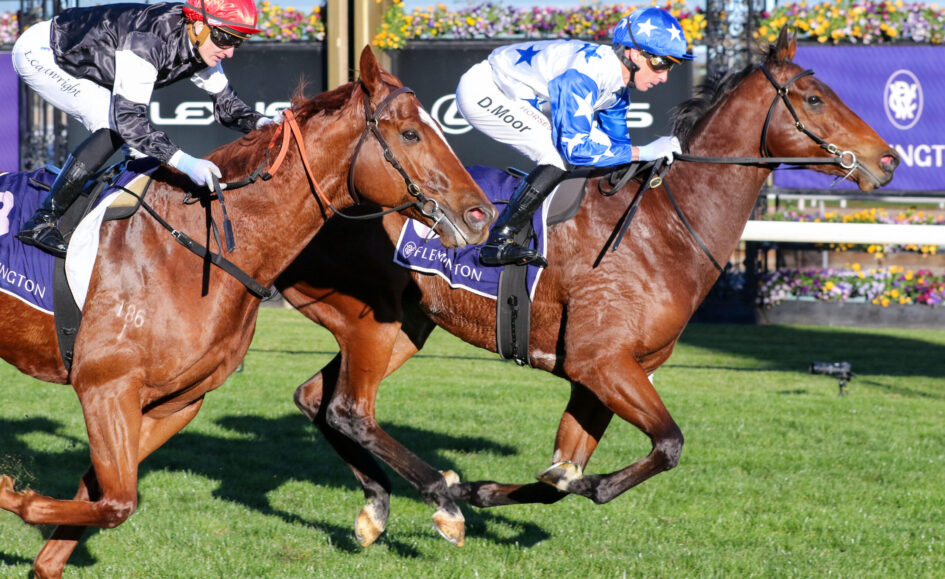
Tony Gollan’s strategic decision to transfer the gelding Boomtown Boss to the southern states has resulted in an immediate triumph, with the Queensland sprinter capturing the first black-type race of the current Australian racing season, the Group 3 Aurie’s Star Handicap (1200m) at Flemington.
Following a truncated Brisbane winter campaign, Gollan elected to freshen the gelding after his effort in the Eye Liner Stakes before relocating him to Ciaron Maher’s Cranbourne base, preparing him for a campaign on the iconic Flemington straight.
The relocation proved to be a masterstroke, as Boomtown Boss, sent out at $13, produced a determined effort to narrowly defeat Royal Insignia ($8.50), with Arkansaw Kid finishing in third position.
Gollan commented that the expansive Flemington layout was always expected to suit the gelding’s racing style.
Advertisement
“He profiles as a horse who loves big tracks and a lot of room so I felt that for a little while he would make a nice straight horse,” Gollan stated.
“During his winter prep, he was going nowhere and when I zigged I should have zagged, everything was going wrong.”
“I knew this race was on the cards so I backed off him (after the Eye Liner Stakes) and sent him to Ciaron’s (Maher) at Cranbourne to really settle him in.”
“I thought the trip away, and with straight racing, I thought it would suit him and through the race he was travelling alright.”
Advertisement
Pre-race excitement turned to drama when the original favourite, War Machine, was scratched after escaping through the starting barriers. Further controversy ensued after the race when the connections of runner-up Royal Insignia lodged a protest against winning rider Daniel Moor, alleging excessive whip use.
Stewards noted the excessive whip use but determined it was not sufficient to alter the race’s final result, confirming Boomtown Boss’s victory by a neck.
Moor admitted that the gelding was still gaining experience in straight-track racing.
“He came here a bit unknown down the straight and he did wander about a bit and change legs a lot, but you just know that when you’re on a Tony Gollan horse that they are well prepared,” Moor commented.
Advertisement
This significant win represents Gollan’s second success in the Aurie’s Star Handicap, with his previous victory coming via Temple Of Boom in 2011.
Compare the latest spring carnival markets with Australia’s leading online bookmakers.
Oh, you’re telling me the best pitcher of the past three years is available for trade? Gee, I wonder who might get him. Could it be the organization that’s landed every top prize of the past few years, the one with farm system that never seems to run out and the financial firepower to make homegrown talent entirely optional? Or would the Dodgers simply decide to sit this one out?
That was me about two days before the trade. It wasn’t the boldest take, but my point was that those entertaining alternate possibilities were setting themselves up for disappointment. This couldn’t have gone any other way. The organizations with the prospect capital to outbid the Dodgers require a pipeline of cheap talent to remain competitive, and the organizations that can buy talent don’t have the prospect capital to outbid the Dodgers (or aren’t even contenders, in the case of the Mets).
The only thing that could have stopped the Dodgers was their own follow-through, and we’ve all seen they have no shortage of that.
Advertisement
So what did it take for them to complete the deal? Ultimately, three prospects: one who’s pretty close to top tier, one who would also be if he wasn’t 27 years old, and one who’s lesser known but has the sort of numbers that could raise his stature in the future. Their names are Zyhir Hope, River Ryan and Brady Smith.
Maybe that package seems light to you, but you have to remember that Skubal is only rental. Whoever got him was getting him for this year alone. It’s the sort of all-in move that only one organization was in a confident enough position to make. They’re already heavy favorites, and again, spending that prospect capital wouldn’t hurt them nearly as much as it would anyone else. For the Dodgers, it’s a pin prick for what’s likely to be a third straight World Series title. For anyone else, it’s foreclosing the future for what’s likely to be uphill battle against the Dodgers. The Tigers were under no obligation to make the Dodgers sweat here. They just needed them to give up more than anyone else, and Hope alone, for as good as he is, probably clinched that.
Hopefully, that spells it out for you. You may not like it, but everyone is acting rationally here. And if rational behavior by all parties can lead to such a dissatisfying outcome for fans, then there’s a fundamental flaw in the league’s core financial structure, just in time for new CBA negotiations. Goody.
Well, what does it mean for Fantasy Baseball? You turn to me more for that than my rosy disposition, I presume. You already know what I’m going to say here, though. Skubal joins the best supporting cast in baseball. If you didn’t already have him as the top starting pitcher rest of season, even for as good as he’s looked coming back from a midseason elbow procedure, you should now. Over his past six starts, he has a 1.95 ERA, 0.78 WHIP and 12.2 K/9.
I’m not even sure anyone loses their job here, at least not immediately. The Dodgers recently had to pull Shohei Ohtani from the starting rotation for a balky knee, with no timetable for a return given, so Skubal probably just slots into his spot, keeping the Dodgers on a six-man rotation. True, Blake Snell and Tyler Glasnow are both on the road to recovery, but Eric Lauer is expendable enough. Meanwhile, Emmett Sheehan, Justin Wrobleski and Roki Sasaki are all likely to have their innings curtailed at some point. This trade ensures that even without Ohtani, the Dodgers are poised to enter the postseason with a rotation of Yoshinobu Yamamoto, Skubal, Glasnow and Snell. Goody.
Advertisement
What about the rest-of-season impact for the Tigers, you ask? Presumably, we’ll see Ryan before the year is done, though he’s currently recovering from a hamstring strain. I suspect we would have seen him even if he had stayed with the Dodgers, but there’s obviously less competition in Detroit. Injuries and the Dodgers’ perpetual surplus have kept him in the minors to age 27, so don’t hold that against him too much. He looked good in four starts for the big club in 2024 and was also pitching well earlier this year, despite being newly recovered from Tommy John surgery. He had a 2.81 ERA, 1.13 WHIP and 11.3 K/9 in seven starts at Triple-A before injuring his hamstring in his eighth start.
Again, Hope is the biggest prize going back to Detroit and likely pushes for a roster spot as soon as next spring. He’s a physical player with significant power who just wrapped up a monster July, batting .372 with 10 homers, six steals and an 1.184 OPS. His removal from the Dodgers system frees up a logjam of outfield prospects highlighted by Josue De Paula, Mike Sirota, Eduardo Quintero and James Tibbs. Clearly, Dodgers fans still have plenty more to look forward to.
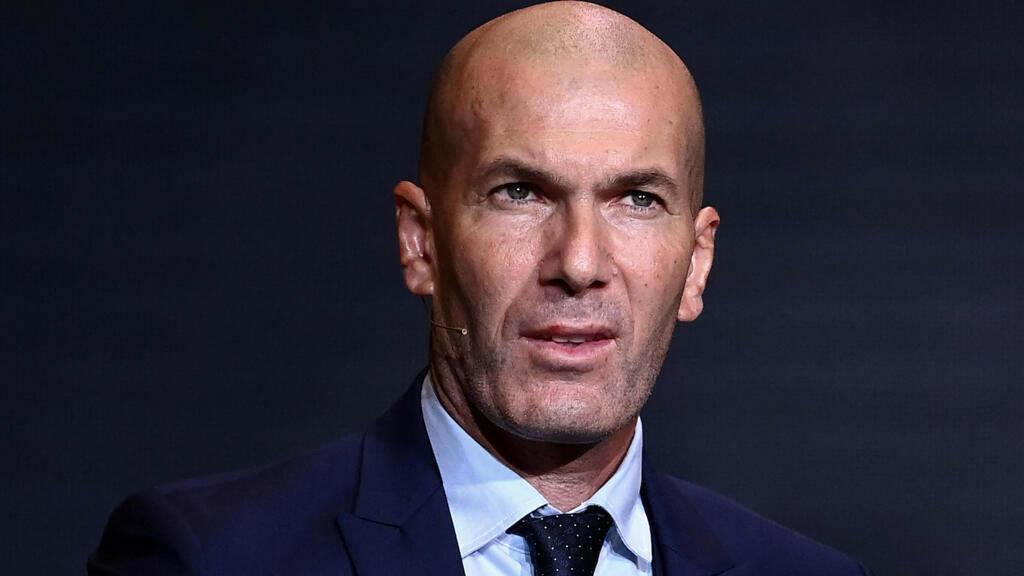
The French Football Federation (FFF) is set to unveil its new manager for ‘Les Bleus’ squad – but the secret is only secret by name. The new coach is expected to be Zinedine Zidane, star player of the mythical 1998 football squad captained by France’s last coach, Didier Deschamps. FRANCE 24’s Emily Boyle is on the ground and tells us about Zidane’s legendary status.
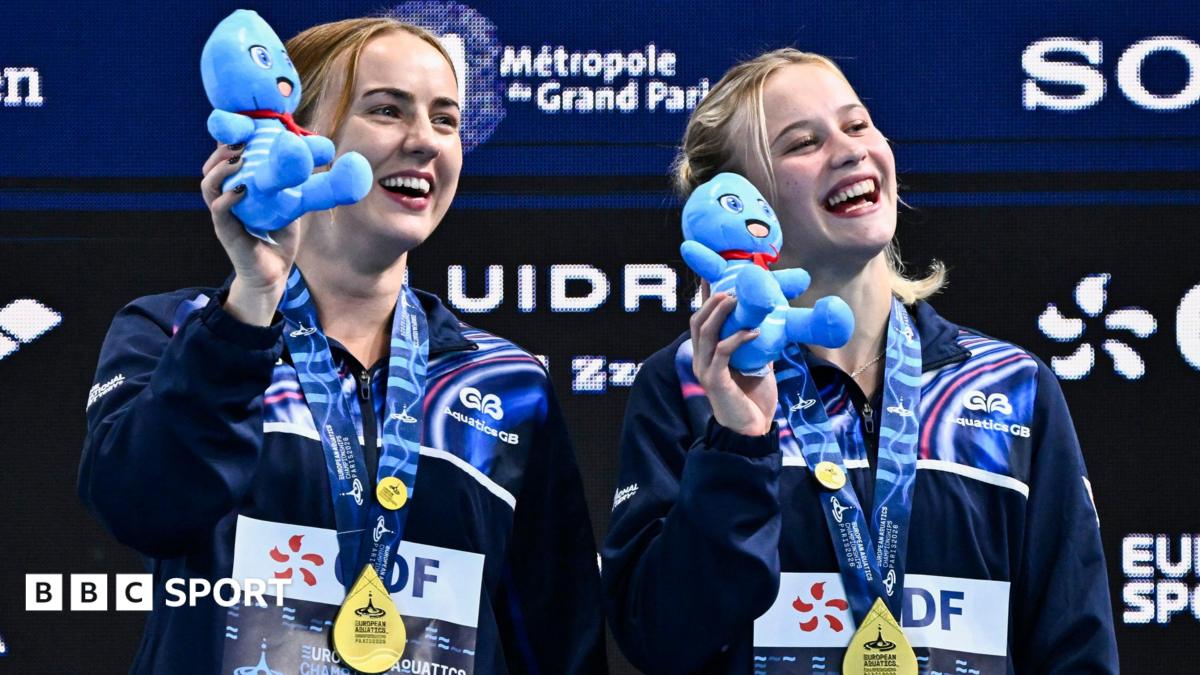
Great Britain won golds in the women’s synchronised 10m diving and artistic swimming mixed duet at the European Aquatics Championships in Paris.
Maisie Bond and Lois Toulson achieved a score of 300.06 to clinch the women’s 10m – just ahead of second-placed Germany (298.20) and Ukraine (286.20) in third.
“We came into these championships wanting to win and knowing it was possible,” said Toulson. “We’d been training really hard and looking good I think.
“That was a [personal best] for us. To be able to do that and get a gold medal – we’re really proud.”
Advertisement
In the mixed duet, Isabelle Thorpe and Ranjuo Tomblin narrowly claimed their first European title in the event.
The pair won with a score of 258.2383 as they beat Spain by just 0.2650 to take victory, with Italy (255.1641) in third.
“It’s incredible. I’m really happy and to have done it with Ranjuo is incredible.” said Olympic silver medallist Thorpe.
“We didn’t have the most smooth sailing preparation due to injury, but it’s good we have been able to come through it and be on top.”
Advertisement
Tomblin, who defended his title in the men’s solo technical event on Friday, added: “Today is more special because I get to do it with Izzy, so it’s incredible.”
In the men’s 1m springboard diving final, Jack Laugher claimed silver with a score of 418.25 and fellow Briton Jordan Houlden took bronze with 410.30 as they finished behind winner Germany Moritz Linus Wesemann (431.45).
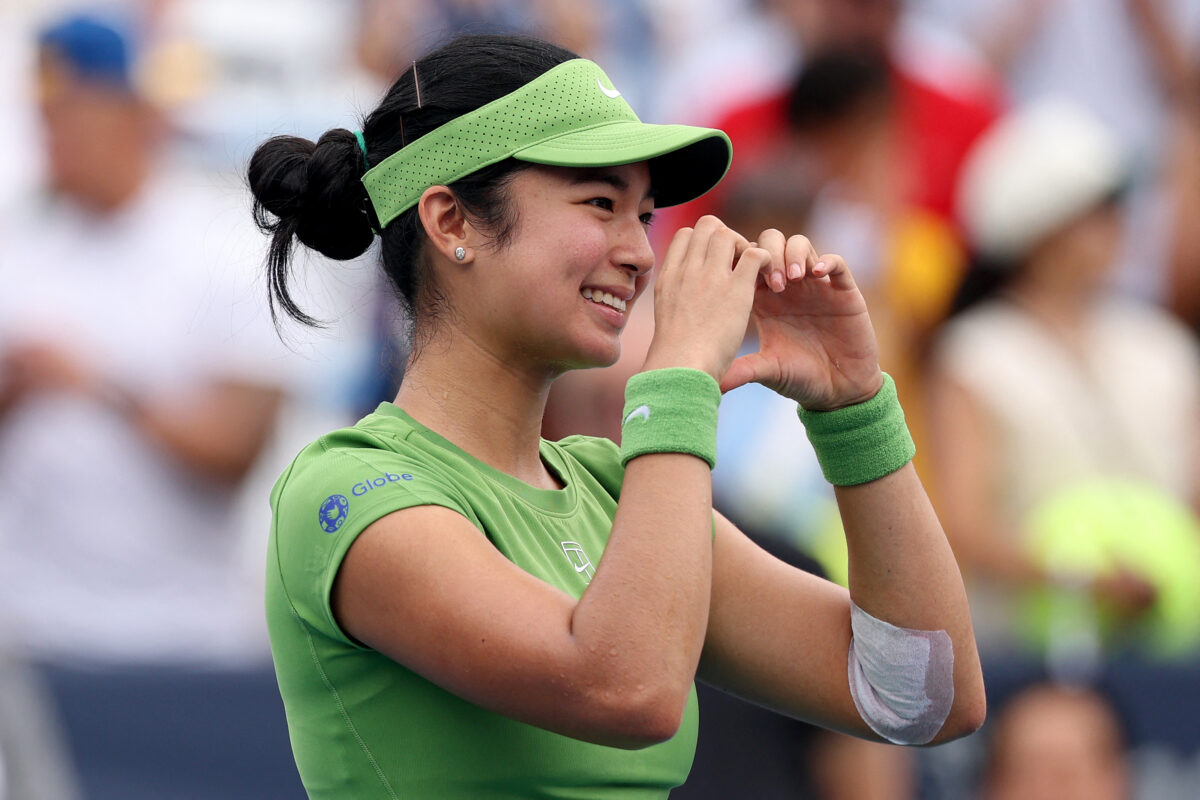
Alex Eala of the Philippines celebrates after winning a women’s singles match against Naomi Osaka of Japan on day six of the Mubadala DC Open 2026 at William H.G. FitzGerald Tennis Center on August 01, 2026 in Washington, DC. Emilee Chinn/Getty Images/AFP
MANILA, Philippines — Amid the fame and her continuous rise in tennis, Alex Eala always makes sure to keep her feet on the ground.
The 21-year-old Eala is playing her best tennis yet, and despite her rapidly growing popularity, she has also remained steadfast and focused on becoming better on and off the court.
“For one, I still have so much motivation to become a better player, become a better person. I’m 21, so it’s not like I’m the queen of the world or anything,” Eala said.
Advertisement
“I think another thing is that tennis is such a humbling sport. Another thing is I look back at how far I’ve come or where I’ve come from. And I’ve come a long way. That’s another thing that keeps me grounded.”
Article continues after this advertisement
Having a solid support system plays a big factor in keeping Eala grounded.
“There are so many things. My family keeps me grounded. My team keeps me grounded. Every error I hit on the court keeps me grounded. Every time I’m mad on the court keeps me grounded,” Eala said. “When I wake up in the morning, I have bad hair. There are so many things that keep you grounded. And I feel like these people, they’re here with me. And of course, they’re here for me.”
Apart from her family, Eala said her coach Joan Bosch is also a vital piece in her career.
Article continues after this advertisement
“He’s the best, and I trust him so, so much on court.I trust him so much with my tennis and, lowkey, just in life. I’ve been telling him everything, and it makes me feel like I’m not alone on court, along with the rest of my team,” Eala said. “All of us have that dedication and that drive for us to improve. I would think of all the people on tour, you would feel the least alone on court.”
Eala also attributed her rise to the Rafa Nadal Academy.
Advertisement
“I’ve been there for a really long time, and I spent a lot of my formative years there. I’ve made so many great relationships. And of course, the coaching staff at the academy are so knowledgeable, so experienced. And of course, Rafa himself. So I’ve learned so many things. I left at 13, and now I’m 21. So how much has improved from then to now? I think tactically, physically, technically, so many aspects,” she said.
Your subscription could not be saved. Please try again.
The 29-year-old is also set to undergo a medical on Monday before the transfer is officially announced.
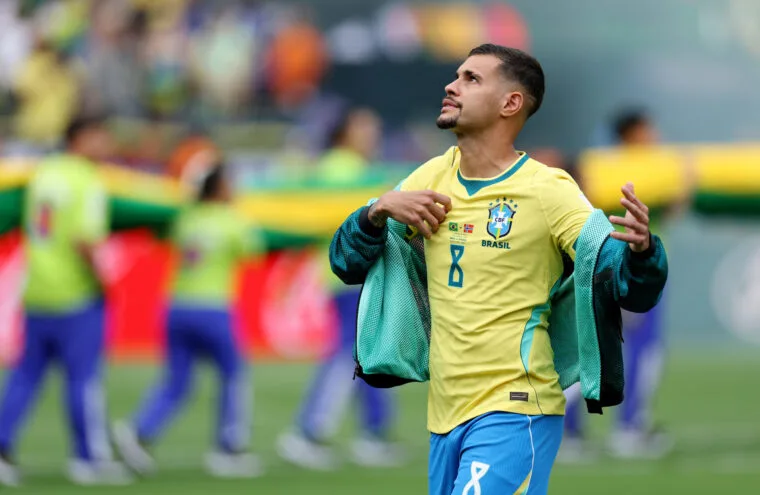
Newcastle have been picked apart this summer, with Guimaraes the latest key figure on the way out of St. James’ Park in what has been a chaotic transfer window for the Magpies.
With Guimaraes on his way out, Newcastle will need significant investment to rebuild an already depleted squad to boost their chances of competing at the top end of the table this season.
Advertisement
Advertisement
They’ve already sorted out their managerial dilemma, with Matthias Jassle set to replace Howe.
Guimaraes’ desire to join Arsenal reportedly played a huge role in helping the transfer move forward, while Newcastle were prepared to consider offers after missing out on Champions League football.
The Brazilian has been a talismanic figure for Newcastle since joining from Olympique Lyon in January 2022 in a deal worth around £40m.
Advertisement
Over the past few years, he has established himself as one of the team’s leaders and a fan favourite.
He’s also considered one of the best midfielders in the Premier League, which explains why Arsenal were ready to pay a premium fee to secure his services.
Advertisement
Despite missing two months of last season through injury, the Brazilian still finished as Newcastle’s top Premier League goalscorer with nine goals.
Advertisement
He’d become Arsenal’s third signing of the summer, following the arrivals of Greek winger Christos Tzolis from Club Brugge and goalkeeper Illan Meslier, who joined on a free transfer after leaving Leeds United.
Welcome to our special cricket edition of our Who am I? game.
The rules are simple. Each day of The Hundred there’s a new cricketer taking part in the tournament who we want you to guess in as few attempts as possible.
After each wrong guess you unlock a new clue. Guess the answer after as few clues as possible to score more points.
Three is a good score, four or five points is exceptional.
Advertisement
So take part and return for more tomorrow.
Today’s player and clues set by BBC Sport’s Callum Matthews.
After more quizzes? Go to our dedicated Sports Quizzes page and sign up for notifications to get the latest quizzes sent straight to your device.
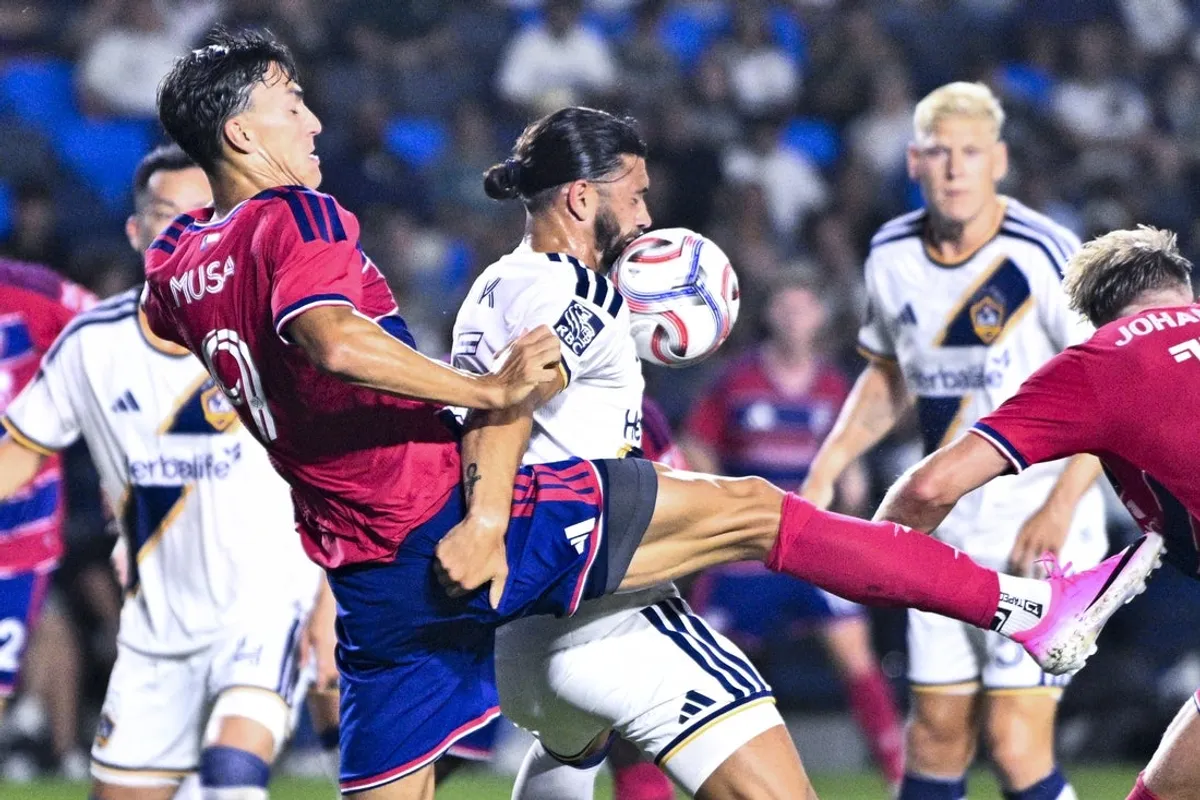
Aug 1, 2026; Carson, California, USA; FC Dallas forward Petar Musa (9) kicks the ball into the face of LA Galaxy midfielder Justin Haak (15) during the first half at Dignity Health Sports Park. Mandatory Credit: Kelvin Kuo-Imagn Images
Jonathan Sirois made nine saves to help FC Dallas preserve a 0-0 draw against the Los Angeles Galaxy on Saturday night at Carson, Calif.
It was only Dallas’ fifth clean sheet, and the first of the season for the 25-year-old Canadian, who returned to the net last weekend when new acquisition Daniel had to depart with a hamstring injury.
Sirois’ performance helped Dallas (7-5-6, 27 points) improve to 2-2-1 five matches into a stretch of nine consecutive away league fixtures during the latest phase of an ongoing construction project at its home stadium.
J.T. Marcinkowski made four stops to keep his second clean sheet and a third for the Galaxy (5-7-7, 22 points), who are winless in their last five.
Los Angeles led 18-16 in shots and 9-4 in efforts on target, but missed a chance to go above the playoff line had it been able to find a goal and earn a third home win of the season.
Advertisement
Sirois’ best moment in the first half came on saves of John Nelson and Marco Reus in the 37th and 38th minutes before Harbor Miller followed with another attempt that missed high of the frame.
He was even busier after the break.
He denied Joseph Paintsil in the 58th minute with a lunging stop to his left, and substitute Kyogo Furuhashi 10 minutes later with a comfortable save from the Galaxy newcomer’s first real involvement in the game.
Advertisement
Then came the dying stages, when the Galaxy finally showed some desperation but could not solve Sirois.
In the 90th minute, he arched back to push Jakob Glesnes’ arcing header over the crossbar for arguably his finest stop of the match.
Just a moment later in second-half stoppage time, he intervened on what may have been an intended cross by Paintsil from the right side of the penalty area, nonetheless providing an important pair of sure hands for the visitors.
After that, he easily handled another effort from Nelson that came in at a catchable height, and punched away Reus’ free-kick service on what was the final kick of the game.


You must be logged in to post a comment Login