
Crypto World
Hyperliquid price confirms market structure break
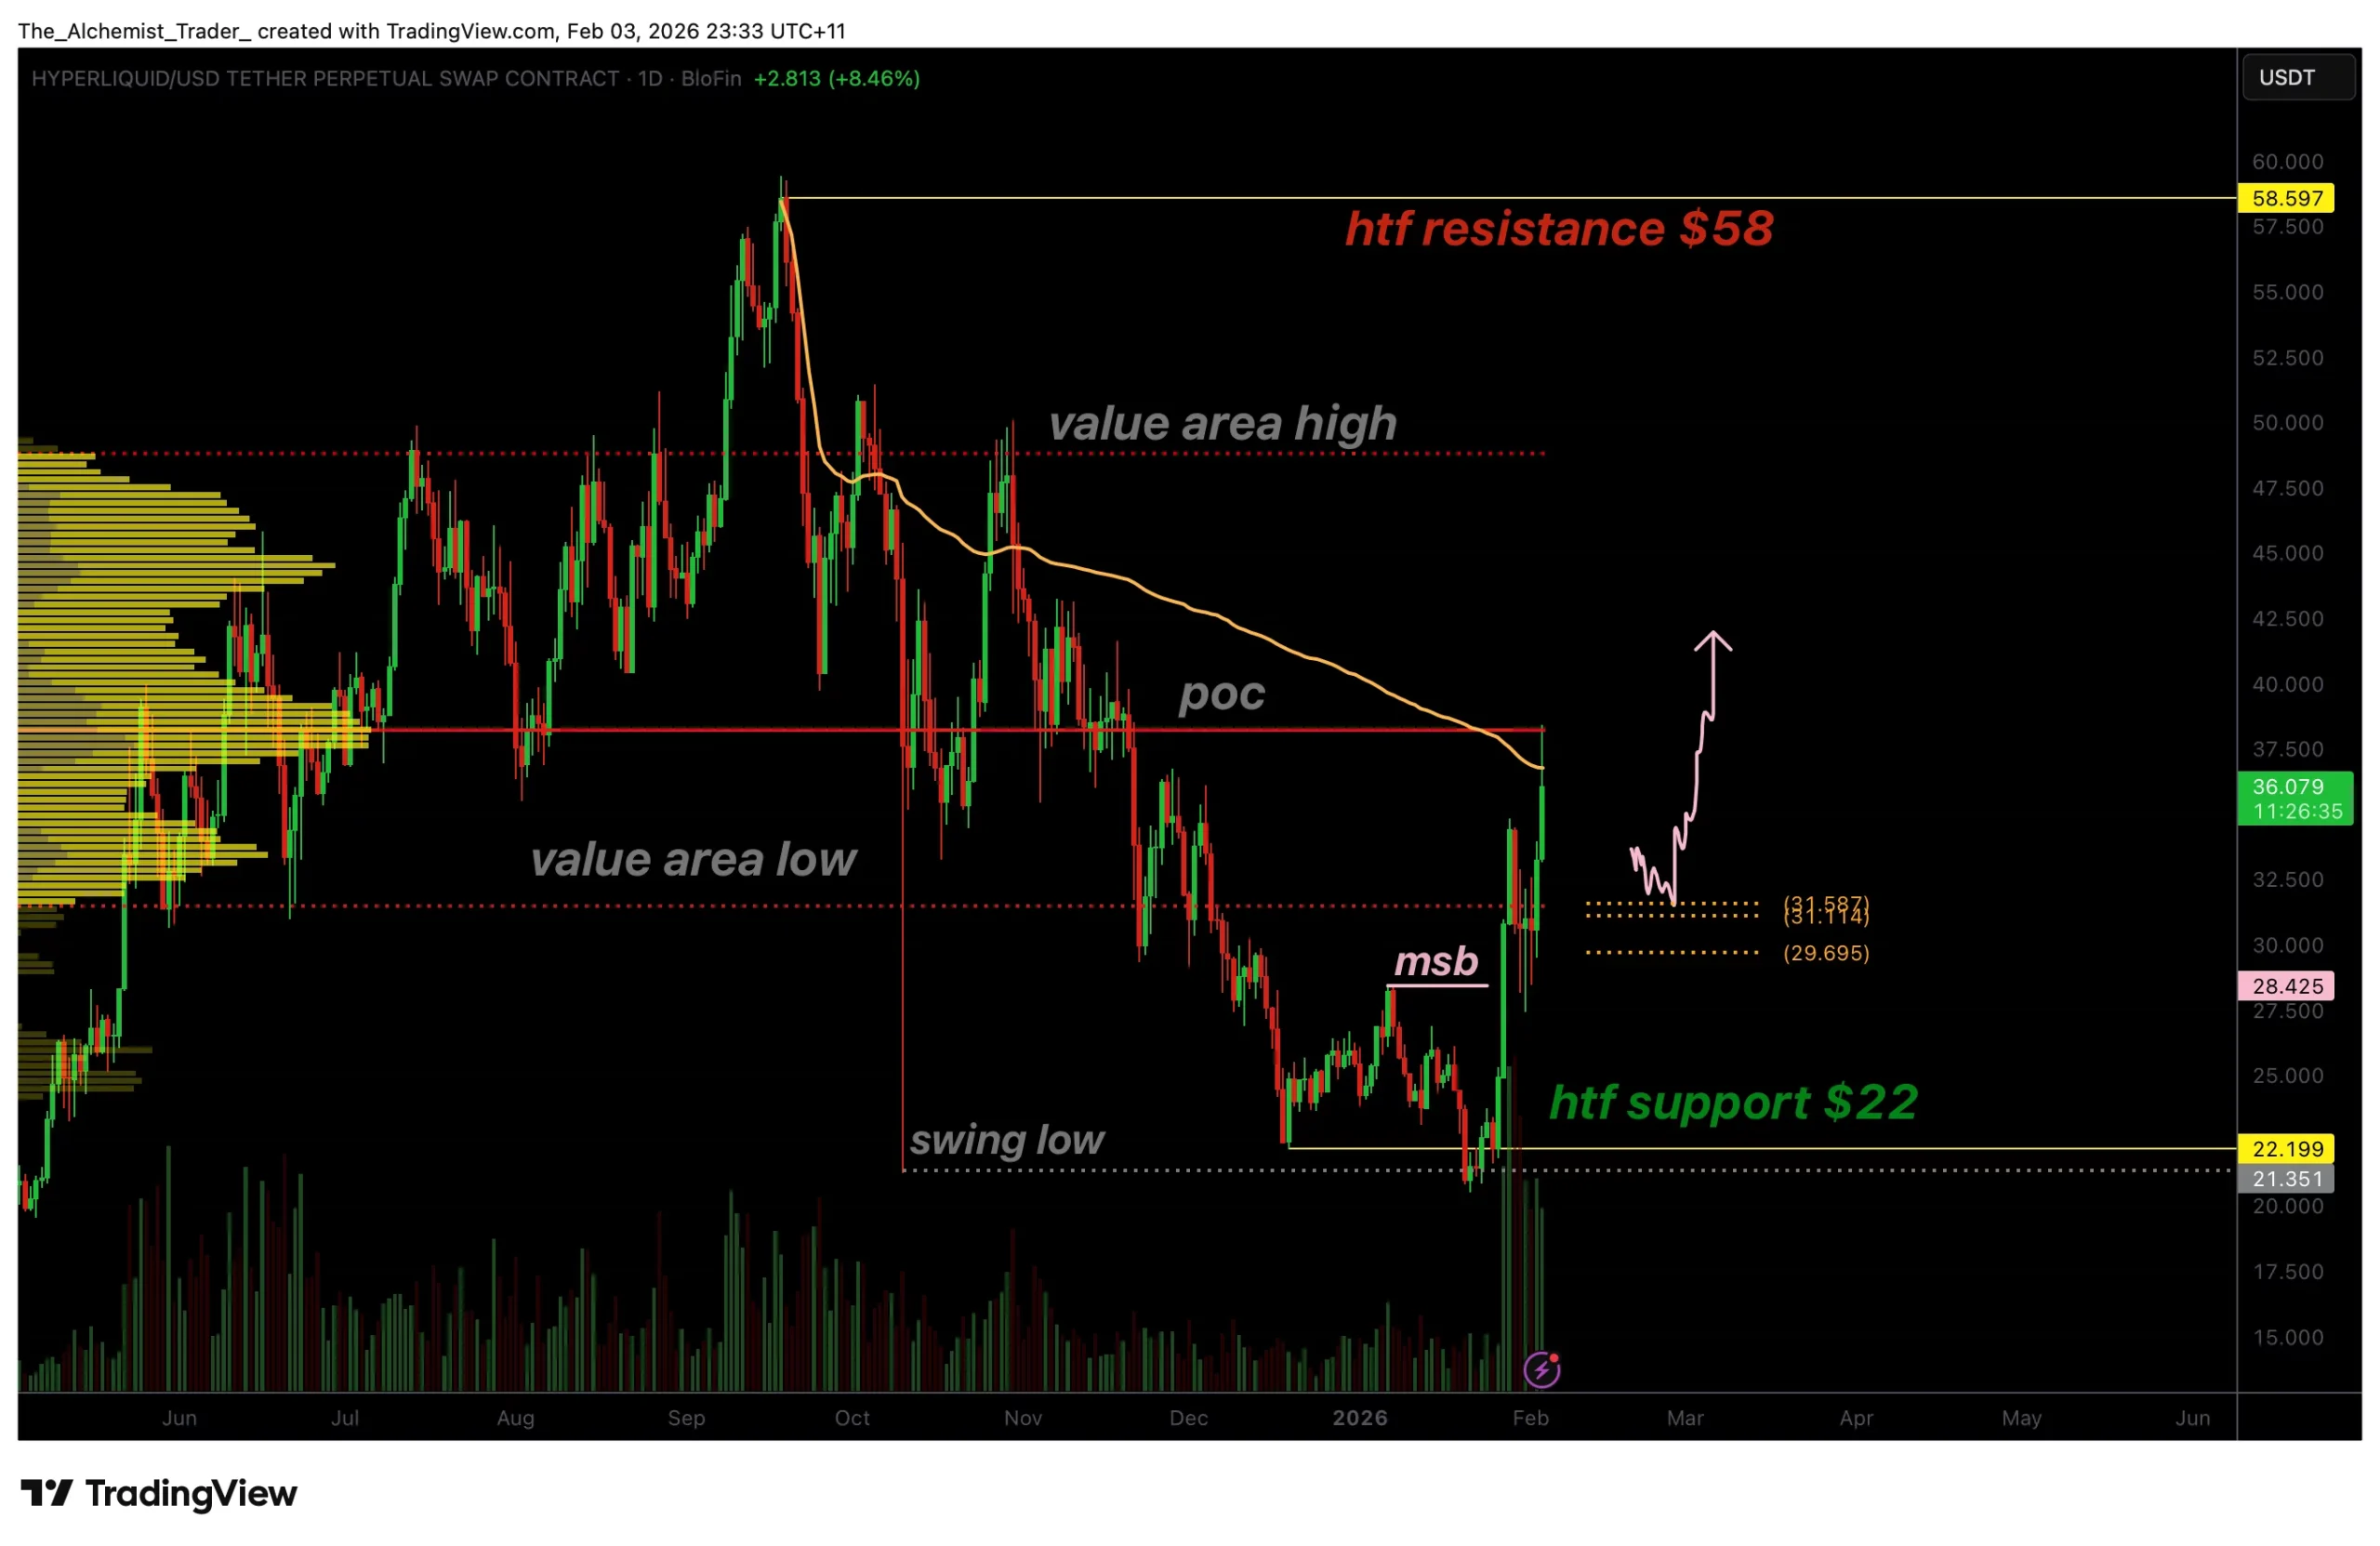
Hyperliquid price has rallied sharply from the $22 swing low, breaking bearish structure and reclaiming key levels, putting a potential macro bottom in focus if demand and volume continue to build.
Summary
- Bullish reversal emerged from a swing failure at $22
- Market structure shifted with a new high established
- Higher low and strong volume needed to confirm continuation
Hyperliquid (HYPE) price action has shifted meaningfully over recent sessions, marking a potential turning point after an extended period of downside pressure.
Following months of consecutive lower lows and lower highs, the market has produced a technically significant bullish response from a major support zone. This reaction has altered the broader structure and raised the question of whether Hyperliquid is in the early stages of forming a macro bottom.
The catalyst for this shift came after price swept the $22 region, a key support level where a swing failure pattern emerged. That failure to sustain acceptance below support triggered an impulsive upside expansion, suggesting seller exhaustion and renewed buyer interest.
Since then, Hyperliquid transitioned from a purely bearish framework into a developing recovery phase that now requires confirmation.
Hyperliquid price key technical points
- Swing failure at $22 sparks bullish expansion: Price rejected lower levels and reversed aggressively.
- Market structure shifts from bearish to neutral-bullish: A new high has formed after months of lower highs.
- Volume confirmation remains critical: Sustained bullish demand is needed to validate continuation.

From a market structure perspective, Hyperliquid has delivered its first meaningful change in character in months. The impulsive move higher following the $22 swing low broke the prior sequence of lower highs, establishing a new local high. This alone does not complete a full trend reversal, but it does confirm a market structure break, a necessary prerequisite for any sustained upside continuation.
Price expanded toward the point of control, the level where the highest volume has historically traded. This move reflects a re-engagement with fair value after an extended period of imbalance to the downside.
However, price has since experienced a modest $1 rejection in this region, highlighting that supply remains active and that buyers must now demonstrate commitment.
This rejection does not invalidate the bullish thesis. Instead, it emphasizes the importance of the current consolidation zone. For the structure to fully flip bullish, Hyperliquid must now establish a higher low above the $22 base, confirming that buyers are defending higher prices rather than allowing another deep rotation.
Role of volume and demand
Volume behavior will play a decisive role in determining whether this move develops into a sustained trend or fades into a corrective rally. The initial impulse from $22 showed strong bullish participation, signaling genuine demand rather than a low-liquidity bounce. For continuation toward higher resistance levels, these bullish volume influxes must persist.
If volume contracts significantly while price consolidates, the rally risks losing momentum and reverting to lower-value areas. Conversely, expanding volume during higher-low formation would confirm accumulation behavior and strengthen the case for further upside exploration.
This dynamic is particularly important when prices trade near equilibrium zones. Markets transitioning from bearish to bullish phases often stall around value before resolving higher. Volume is the key differentiator between accumulation and distribution at these levels.
Upside targets and resistance zones
Should Hyperliquid successfully form a higher low and reclaim acceptance above the point of control, attention will shift toward higher time-frame resistance zones. The value area high represents the first major upside objective, acting as a gateway back into premium pricing.
Beyond that, the $58 resistance stands out as a critical high-timeframe level. This region previously acted as a major supply zone and would likely require sustained momentum and strong volume to overcome. A move toward these levels would confirm that the market structure break is evolving into a broader bullish trend rather than remaining a short-term corrective move.
What to expect in the coming price action
From a technical, price-action, and market-structure perspective, Hyperliquid is at a pivotal stage. The bullish rally from $22 has confirmed a new high and broken the prior bearish structure. However, full confirmation requires a higher low supported by continued bullish volume.
If demand remains and buyers defend current levels, the probability increases of a rotation toward the value-area high and eventually the $58 resistance. Failure to hold higher lows or a clear drop in volume would weaken the bullish case and risk a return to range-bound or corrective behavior.
For now, Hyperliquid’s price action suggests that a macro bottom may be forming, but confirmation will depend on how the market behaves during this consolidation phase.

Chainlink whale activity has surged to a three-month high, with addresses holding 100,000 LINK crypto or more increasing transfers by nearly 25% above the weekly average in the past 24 hours, while LINK price itself trades in a tight consolidation band around $9.20.
Approximately 1.2 million LINK tokens have migrated off exchanges in the past 48 hours, suggesting a deliberate shift toward cold custody or staking rather than imminent selling.
The accumulation looks like conviction, but it could also be front-running a sell-the-news setup – and that tension is worth sitting with.
Chainlink Whale Transactions: What the On-Chain Data Actually Shows
Santiment data shows that addresses holding 1,000 or more LINK reached 25,420, an eight-month high, up from a Q1 2026 average of roughly 24,100.
That’s not noise; that’s a steady, deliberate climb by high-net-worth participants across a period when prices gave them little reason for optimism.
The wallet-count expansion mirrors a pattern Santiment flagged in early December 2025, the last time this threshold was breached, which preceded a multi-week price recovery.
The dollar-value specifics add weight. Over the two months leading up to LINK’s prior peak above $29, whales holding 100,000 or more tokens accumulated 5.69 million LINK, almost perfectly offsetting retail outflows of 5.67 million tokens.
In early April 2026, that dynamic compressed into a single window: whales added 1.01 million LINK worth approximately $9 million, absorbing fear-driven retail distribution in real time.
“Whales added roughly 1.01 million LINK worth about $9 million, a clear signal they see value where others see only red,” reads one market analysis circulating on the accumulation setup.
The exchange withdrawal data reinforces the read. When 1.2 million tokens leave exchange hot wallets in 48 hours, the directional signal is self-custody or staking, neither of which implies near-term selling pressure.
This pattern of large-holder withdrawals ahead of market-moving catalysts has appeared repeatedly across major assets this cycle. The on-chain data here is consistent: high-conviction holders are positioning, not distributing.
Chainlink Price Prediction: Can LINK Break $9.55 Resistance After the Whale Surge?
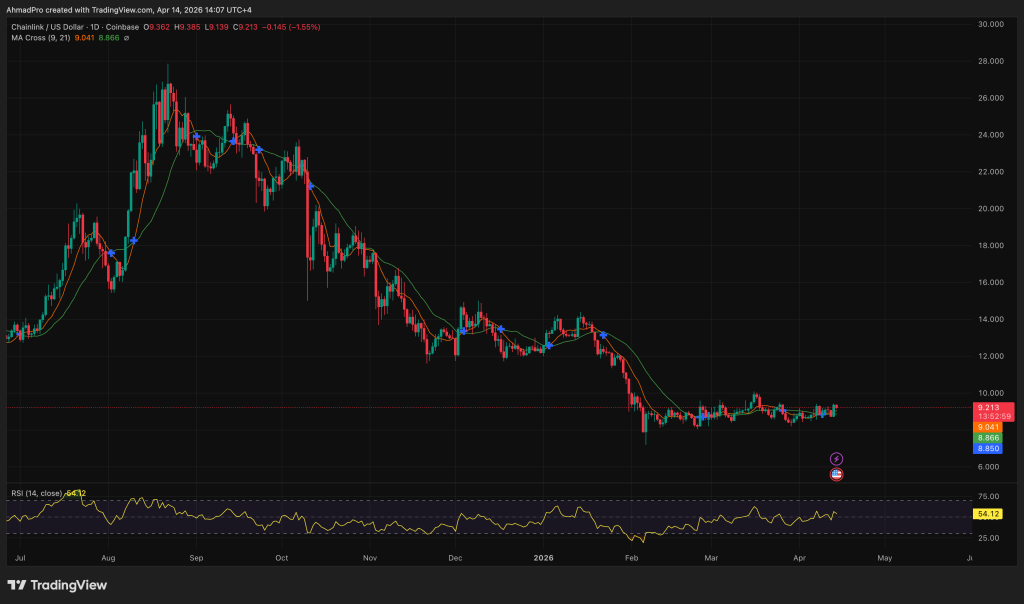
LINK is currently trading near $9.20, wedged below a resistance level analysts have flagged at $9.55, the threshold required to shift the bearish structure on the daily chart.
The 4-hour RSI is building a bullish divergence against price, a configuration that preceded 20% rallies in prior accumulation windows, according to on-chain crypto market analysis tracking LINK’s technical setup.
The 50-day SMA sits above the current price and has been acting as a ceiling since the Q1 pullback; the 200-day SMA remains further overhead, roughly in the $11–12 range depending on the lookback.
A clean break above $9.55 opens the path toward the $9.97–$10.00 resistance cluster, where prior consolidation and psychological round-number selling tend to converge.
Bitcoin’s April seasonal strength, historical average gain of +12.4% – provides a macro tailwind, but LINK’s correlation means a Bitcoin reversal would complicate the thesis quickly.
Close below $8.30 support puts the entire accumulation narrative at risk; that’s the level where whale cost-basis estimates from the April buy window start showing losses.
The technical picture and on-chain data are aligned in a way that doesn’t happen often. Whether that alignment resolves upward or simply marks a prolonged base before another leg down depends almost entirely on whether Bitcoin cooperates and open interest stabilizes.
On-chain whale signals in Ethereum have shown similar setups recently, with results that took longer than the chart implied to materialize – which is either very reassuring context or a reminder that timing these setups is harder than identifying them.
Discover: The best pre-launch token sales
LiquidChain Targets Early Mover Upside as Chainlink Tests Key Levels
LINK at $8.72 with a multi-billion-dollar market cap means even a bullish outcome – say, a move back toward $29 – represents roughly a 3x from current levels.
That’s meaningful, but it’s not the asymmetric upside profile that earlier-stage exposure to the same ecosystem thesis could offer. For traders who believe in the LiquidChain infrastructure narrative but want a different risk/reward entry point, LiquidChain is running a presale at $0.01449 per token.
LiquidChain describes itself as a Layer 3 Unified Liquidity Layer designed to fuse Bitcoin, Ethereum, and Solana liquidity into a single execution environment, a Deploy-Once architecture, Single-Step Execution, and Verifiable Settlement.
The presale has raised meaningful early capital, the project has completed a CertIK audit, and staking during the presale window carries a headline APY of 1,600% – a figure that will compress as participation scales, which is standard for early-stage staking incentive structures.
Institutional accumulation patterns in major assets this cycle suggest the appetite for earlier-stage infrastructure plays is growing alongside the large-cap trades.
Early-stage L3 infrastructure projects carry meaningful risk; token utility depends entirely on developer execution and liquidity adoption post-launch.
The 1,600% APY is an incentive structure, not a yield guarantee – and presale tokens require the project to deliver on the ecosystem thesis before that staking rate means anything in dollar terms. DYOR applies in full.
Join the LiquidChain presale here
The post Chainlink Whale Accumulation Hits 3-Month High Amid Liquidchain Listing Buzz appeared first on Cryptonews.
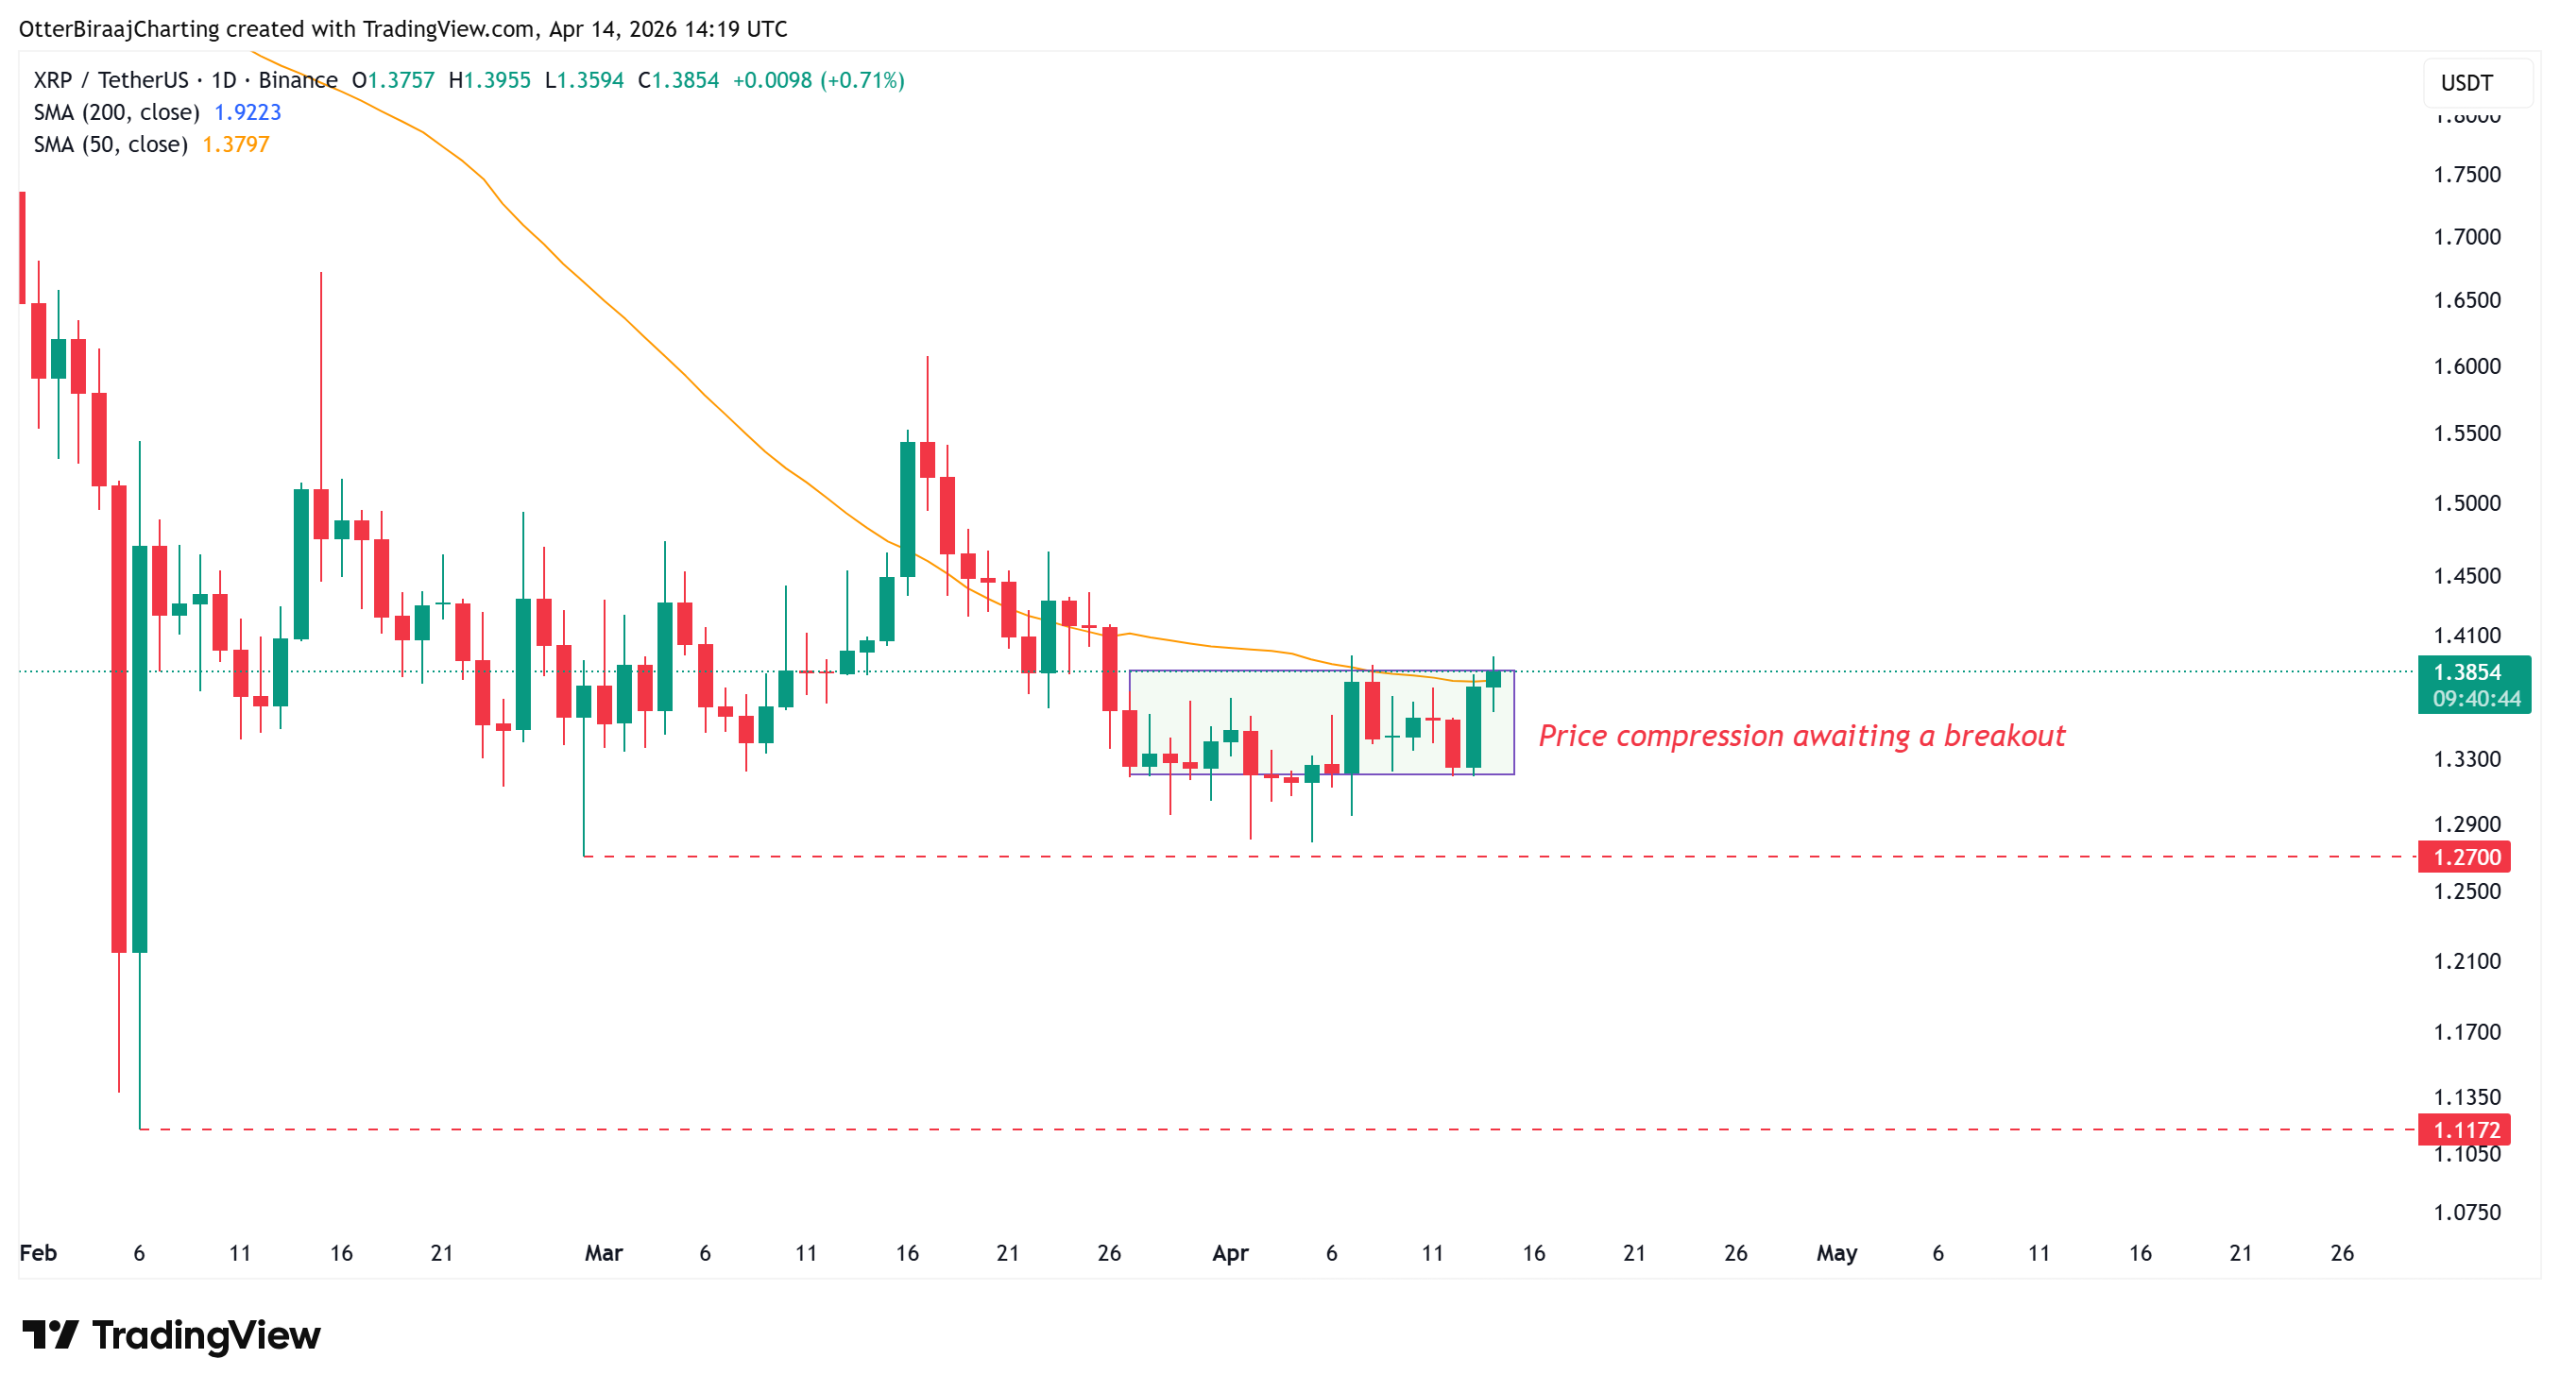
XRP (XRP) has consolidated within a tight price range below $1.40 over the past 20 days, but new data suggests it may be poised for a bullish breakout after a shift in Binance activity signals reduced sell-side pressure.
Binance’s withdrawal and deposit activity is flashing a setup that mirrors June 2025, when the altcoin embarked on a rally to $3.65.

XRP Binance deposits drop to 2025 lows
Crypto analyst Amr Taha noted a shift in XRP activity on Binance, with transaction flows moving away from deposit-heavy behavior. The seven-day average shows XRP withdrawals rising to 53% while deposits dropped to 46%, returning to the levels last seen in June 2025.

That prior setup aligned with a 65% XRP rally to all-time highs of $3.65 in July 2025, placing the current shift on traders’ radar.
The falling deposit activity signals fewer coins moving onto exchanges, while rising withdrawals indicate assets leaving exchanges. This reduces immediate sell-side pressure if sustained over multiple trading sessions.
Currently, XRP flow on Binance is no longer dominated by incoming supply. This indicates a change in trader positioning, with fewer participants preparing to sell into the market.
Meanwhile, liquidity has contracted sharply. CryptoQuant data shows XRP’s 30-day liquidity index on Binance dropping to 0.053, the lowest level since 2021. The 30-day trading volume stands at nearly 3.77 billion XRP, marking one of the weakest periods of activity in recent years.

The price action aligns with this slowdown. XRP trades near $1.38 with limited movement over the past three weeks, consistent with a quieter order book and reduced trader participation. These lower-liquidity phases may coalesce momentum and precede a stronger directional move once activity returns.
Related: Bitcoin’s struggle to build long-lasting uptrend continues: Here’s why
XRP traders position in futures markets
While XRP price consolidates, onchain data shows an aggregated spot cumulative volume delta (CVD) of -$153 million and a futures CVD near -$295 million, pointing to a reduction in aggressive selling.

The buy-side activity has not expanded, keeping the price movement muted. The funding rates have turned slightly positive at 0.06%, signaling a mild long bias.
Open interest has climbed to nearly $769 million, suggesting fresh positions are entering the market.

From a technical perspective, a daily close above $1.40 opens the door to $1.60–$1.67. That $1.40 level also aligns with the 50-day moving average, which may flip into support on a bullish breakout.
The liquidation data shows roughly $250–$300 million in cumulative long/short positions at risk within a 10% move in either direction. Compared to larger assets like BTC (BTC) and Ether (ETH), the liquidity is relatively small, suggesting lower trader participation near $1.40.
Related: XRP Ledger taps Boundless for bank-grade privacy on public blockchains
This article is produced in accordance with Cointelegraph’s Editorial Policy and is intended for informational purposes only. It does not constitute investment advice or recommendations. All investments and trades carry risk; readers are encouraged to conduct independent research before making any decisions. Cointelegraph makes no guarantees regarding the accuracy or completeness of the information presented, including forward-looking statements, and will not be liable for any loss or damage arising from reliance on this content.

Jamie Dimon, chief executive officer of JPMorgan Chase & Co., right, departs the US Capitol in Washington, DC, US, on Wednesday, Feb. 25, 2026.
Graeme Sloan | Bloomberg | Getty Images
JPMorgan Chase CEO Jamie Dimon said Tuesday that while artificial intelligence tools could eventually help companies defend themselves from cyberattacks, they are first making them more vulnerable.
Dimon said that JPMorgan was testing Anthropic’s latest model — the Mythos preview announced by the AI firm last week — as part of its broader effort to reap the benefits of AI while protecting against bad actors wielding the same technology.
“AI’s made it worse, it’s made it harder,” Dimon told analysts on the bank’s earnings call Tuesday morning. “It does create additional vulnerabilities, and maybe down the road, better ways to strengthen yourself too.”
When asked by a reporter about Mythos, Dimon seemed to refer to Anthropic’s warning that the model had already found thousands of vulnerabilities in corporate software.
“I think you read exactly what is it,” Dimon said. “It shows a lot more vulnerabilities need to be fixed.”
The remarks reveal how artificial intelligence, a technology welcomed by corporations as a productivity boon, has also morphed into a serious threat by giving bad actors new ways to hack into technology systems. Last week, Treasury Secretary Scott Bessent summoned bank CEOs to a meeting to discuss the risks posed by Mythos.
JPMorgan, the world’s largest bank by market cap, has for years invested heavily to stay ahead of threats, with dedicated teams and constant coordination with government agencies, Dimon said.
“We spend a lot of money. We’ve got top experts. We’re in constant contact with the government,” he said. “It’s a full-time job, and we’re doing it all the time.”
‘Attack mode’
Still, the CEO warned that risks extend beyond any single institution, given the interconnected nature of the financial system.
“That doesn’t mean everything that banks rely on is that well protected,” Dimon said. “Banks… are attached to exchanges and all these other things that create other layers of risk.”
JPMorgan Chief Financial Officer Jeremy Barnum said the industry has long been aware that AI cuts both ways in cybersecurity.
“These tools can make it easier to find vulnerabilities, but then also potentially be deployed by bad actors in attack mode,” Barnum said on the earnings call. Recent advances from Anthropic and others have simply intensified an existing trend, he said.
Dimon also said that while advanced AI tools are important, old-school cybersecurity practices remain essential.
“A lot of it is hygiene… how do you protect your data? How do you protect your networks, your routers, your hardware, changing your passcode?” he said. “Doing all those things right dramatically reduces the risk.”
Goldman Sachs CEO David Solomon said Monday during an earnings call that his bank was testing Mythos, though he declined to comment further.

Blockchain investigator ZachXBT has linked a fake Ledger Live app to over 50 victims, who have lost a total of $9.5 million worth of crypto between them.
He traced stolen funds to KuCoin deposit addresses and called out the crypto exchange via Telegram and X.
Over 150 addresses tied to a known money laundering service were reportedly used to deposit stolen funds to the exchange.
App Store honeypot
Garrett Dutton of the band G. Love & Special Sauce initially drew attention to the fake wallet app, previously available on Apple’s App Store, when he took to X on Saturday to lament losing his retirement fund “in an instant.”
Dutton’s thread explains that he lost 5.9 bitcoin (BTC),worth approximately $440,000, after being “tricked” into entering his seed phrase into the app.
Read more: Thai police want Interpol to track alleged KuCoin money launderer
Around 12 hours after Dutton’s post, ZachXBT flagged nine transaction IDs which the sleuth claims show Dutton’s BTC being “laundered” via crypto exchange KuCoin.
Two days later, ZachXBT published a follow-up community alert to his Investigations Telegram group. It linked the fake app to “$9.5M stolen from 50+ suspected victims between April 7–13 across Bitcoin, EVM, Tron, Solana, & Ripple.”
The top three victims reportedly lost a combined total of $7.25 million in various cryptocurrencies.
KuCoin under fire
ZachXBT’s Telegram post also tied over 150 KuCoin deposit addresses to money laundering service AudiA6.
He also called out KuCoin on X, where he highlighted both these fake Ledger Live app-linked thefts and the recent Bitcoin Depot loss, accusing the exchange of allowing money launderers to “operate freely.”
Read more: Bitcoin Depot didn’t spot 50 BTC hack for three days, report
The exchange eventually replied to ZachXBT’s list of theft addresses in the Dutton case, 48 hours after it was posted. Other on-chain investigators have flagged addresses allegedly linked to scams who have deposited significant sums to KuCoin over recent weeks.
Just over two years ago, KuCoin and two of its founders were charged with flouting U.S. anti-money laundering laws.
Protos reached out to KuCoin, but it did not respond immediately, we will update this piece if we hear back.
Got a tip? Send us an email securely via Protos Leaks. For more informed news, follow us on X, Bluesky, and Google News, or subscribe to our YouTube channel.
Crypto World
White House Signals Breakthrough on ‘Clarity Act’: Federal Stablecoin Floor Nears Reality

Patrick Witt, executive director of the President’s Council of Advisors for Digital Assets and the White House’s chief crypto adviser, said on Monday that negotiations on the Digital Asset Market Clarity Act have advanced well beyond the stablecoin yield impasse, with multiple outstanding issues being resolved in parallel behind the scenes.
The signal is the clearest indication yet that a federal regulatory floor for payment stablecoins is within legislative reach.
The question isn’t whether the White House wants this bill passed. It clearly does. The question is whether the Senate Banking Committee can hold a markup hearing before the political window closes, analysts warn that missing a May 2026 advancement deadline risks pushing the entire legislative effort past the November midterms.
- Yield Compromise Holding: A bipartisan deal on stablecoin yield – the primary bank-industry flashpoint – is intact, per Witt, who called it a “must-have” precondition for tackling remaining issues.
- Secondary Issues Closing: DeFi illicit finance protections and restrictions on senior government officials profiting from crypto – a Democratic demand targeting President Trump – are both reportedly near resolution.
- Senate Banking Committee Markup Pending: The Clarity Act requires a committee markup before reaching a full Senate floor vote; that hearing was derailed in January 2026 by bank lobbyist objections and has not been rescheduled.
- Federal Reserve Role Contested: A core negotiating tension remains over whether the Fed retains veto power over state-chartered stablecoin issuers – a provision that would materially affect whether issuers like Circle’s USDC gain direct access to federal payment infrastructure.
- Banking Sector Split: The American Bankers Association responded critically Monday to a White House economic report downplaying yield-bearing stablecoin risks to bank deposits – signaling the industry remains internally divided.
- Midterm Clock Running: Sen. Bill Hagerty and Sen. Cynthia Lummis have flagged a late-April markup target; failure risks post-election delay until 2027.
- Watch: Updated stablecoin yield legislative text expected after Easter recess following final industry-bank talks.
Discover: Best Crypto Presales to Watch Amid Stablecoin Regulatory Clarity
What the Clarity Act Federal Floor Actually Changes for Stablecoin Issuers and Market Infrastructure
The core structural shift embedded in the Clarity Act is the establishment of a federal minimum standard , a regulatory floor, that all payment stablecoin issuers must meet regardless of their state charter status.
Before this framework, issuers operated under a patchwork of state money transmission licenses with no unified federal reserve, capital, or transparency requirements.
That ambiguity has been the primary barrier preventing institutional adoption at scale for settlement and cash management.
Under the proposed framework, issuers would be required to maintain 1:1 reserve backing with high-quality liquid assets, meet federal safety-and-soundness standards, and comply with AML and illicit finance controls, including, critically, new DeFi-specific protections that Witt confirmed are still being finalized.
— JackTheRippler © (@RippleXrpie) April 13, 2026
 HUGE NEWS:
The CLARITY ACT will be presented to the Banking Committee THIS WEEK, confirmed by Senator Bill Hagerty.
Regulatory clarity is coming in 2026! pic.twitter.com/d9yl8CGiVY
The DeFi provisions are not cosmetic. They determine whether decentralized protocols that route stablecoin liquidity face issuer-level compliance obligations or are treated as distinct actors, a distinction that shapes the entire secondary market architecture for USDC and its competitors.
The Federal Reserve dimension carries the highest institutional stakes.
Negotiations are reportedly centering on whether the Fed retains override authority over state-regulated issuers, a mechanism that would function as a systemic risk check but would also effectively give the central bank leverage over which issuers can access federal payment rails.
For Circle, that access would reduce counterparty risk at the settlement layer and open institutional corridors currently closed to non-bank entities.
Deputy Treasury Secretary Scott Bessent has publicly urged rapid spring 2026 passage, citing midterm urgency, a signal that Treasury views this not as incremental cleanup but as foundational market infrastructure legislation.

The stablecoin yield compromise, reached between key senators from both parties, addresses what banks had framed as an existential threat to their deposit base.
Bank of America CEO Brian Moynihan warned in February that trillions in deposits could migrate to yield-bearing stablecoins if Congress authorized interest-like returns.
Witt proposed language at ETHDenver in February limiting stablecoin rewards to “activities or transactions” rather than balances, with violations penalized up to $500,000 per day, a formulation that appears to have formed the basis of the current bipartisan compromise.
This dynamic mirrors what’s unfolding in Japan’s reclassification of crypto as a financial instrument, where the core legislative tension also centered on where digital assets fit within existing banking and payment system hierarchies.
Discover: Best Crypto Exchanges for Stablecoin Trading and Settlement
The post White House Signals Breakthrough on ‘Clarity Act’: Federal Stablecoin Floor Nears Reality appeared first on Cryptonews.

CoW Swap has warned users to stay away from its frontend at swap.cow.fi after Web3 security firm Blockaid detected malicious activity on the cow.fi domain.
The team is actively investigating the issue, which may involve a compromise that tricks users into signing harmful transactions designed to drain their wallets.
What Happened to CoW Swap’s Frontend
Blockaid, which provides transaction screening for major wallets and DeFi platforms, flagged the cow.fi domain after its dApp scanning engine identified suspicious behavior.
CoW Swap confirmed the alert shortly after, urging users to avoid interacting with the site entirely while the investigation continues.
“We are currently experiencing an issue with the CoW Swap frontend (https://swap.cow.fi). While we are investigating, please DO NOT use CoW Swap,” they wrote.
The CoW Protocol (COW) token, which trades at roughly $0.22 with a market cap near $120 million, has not yet seen a significant sell-off in response.
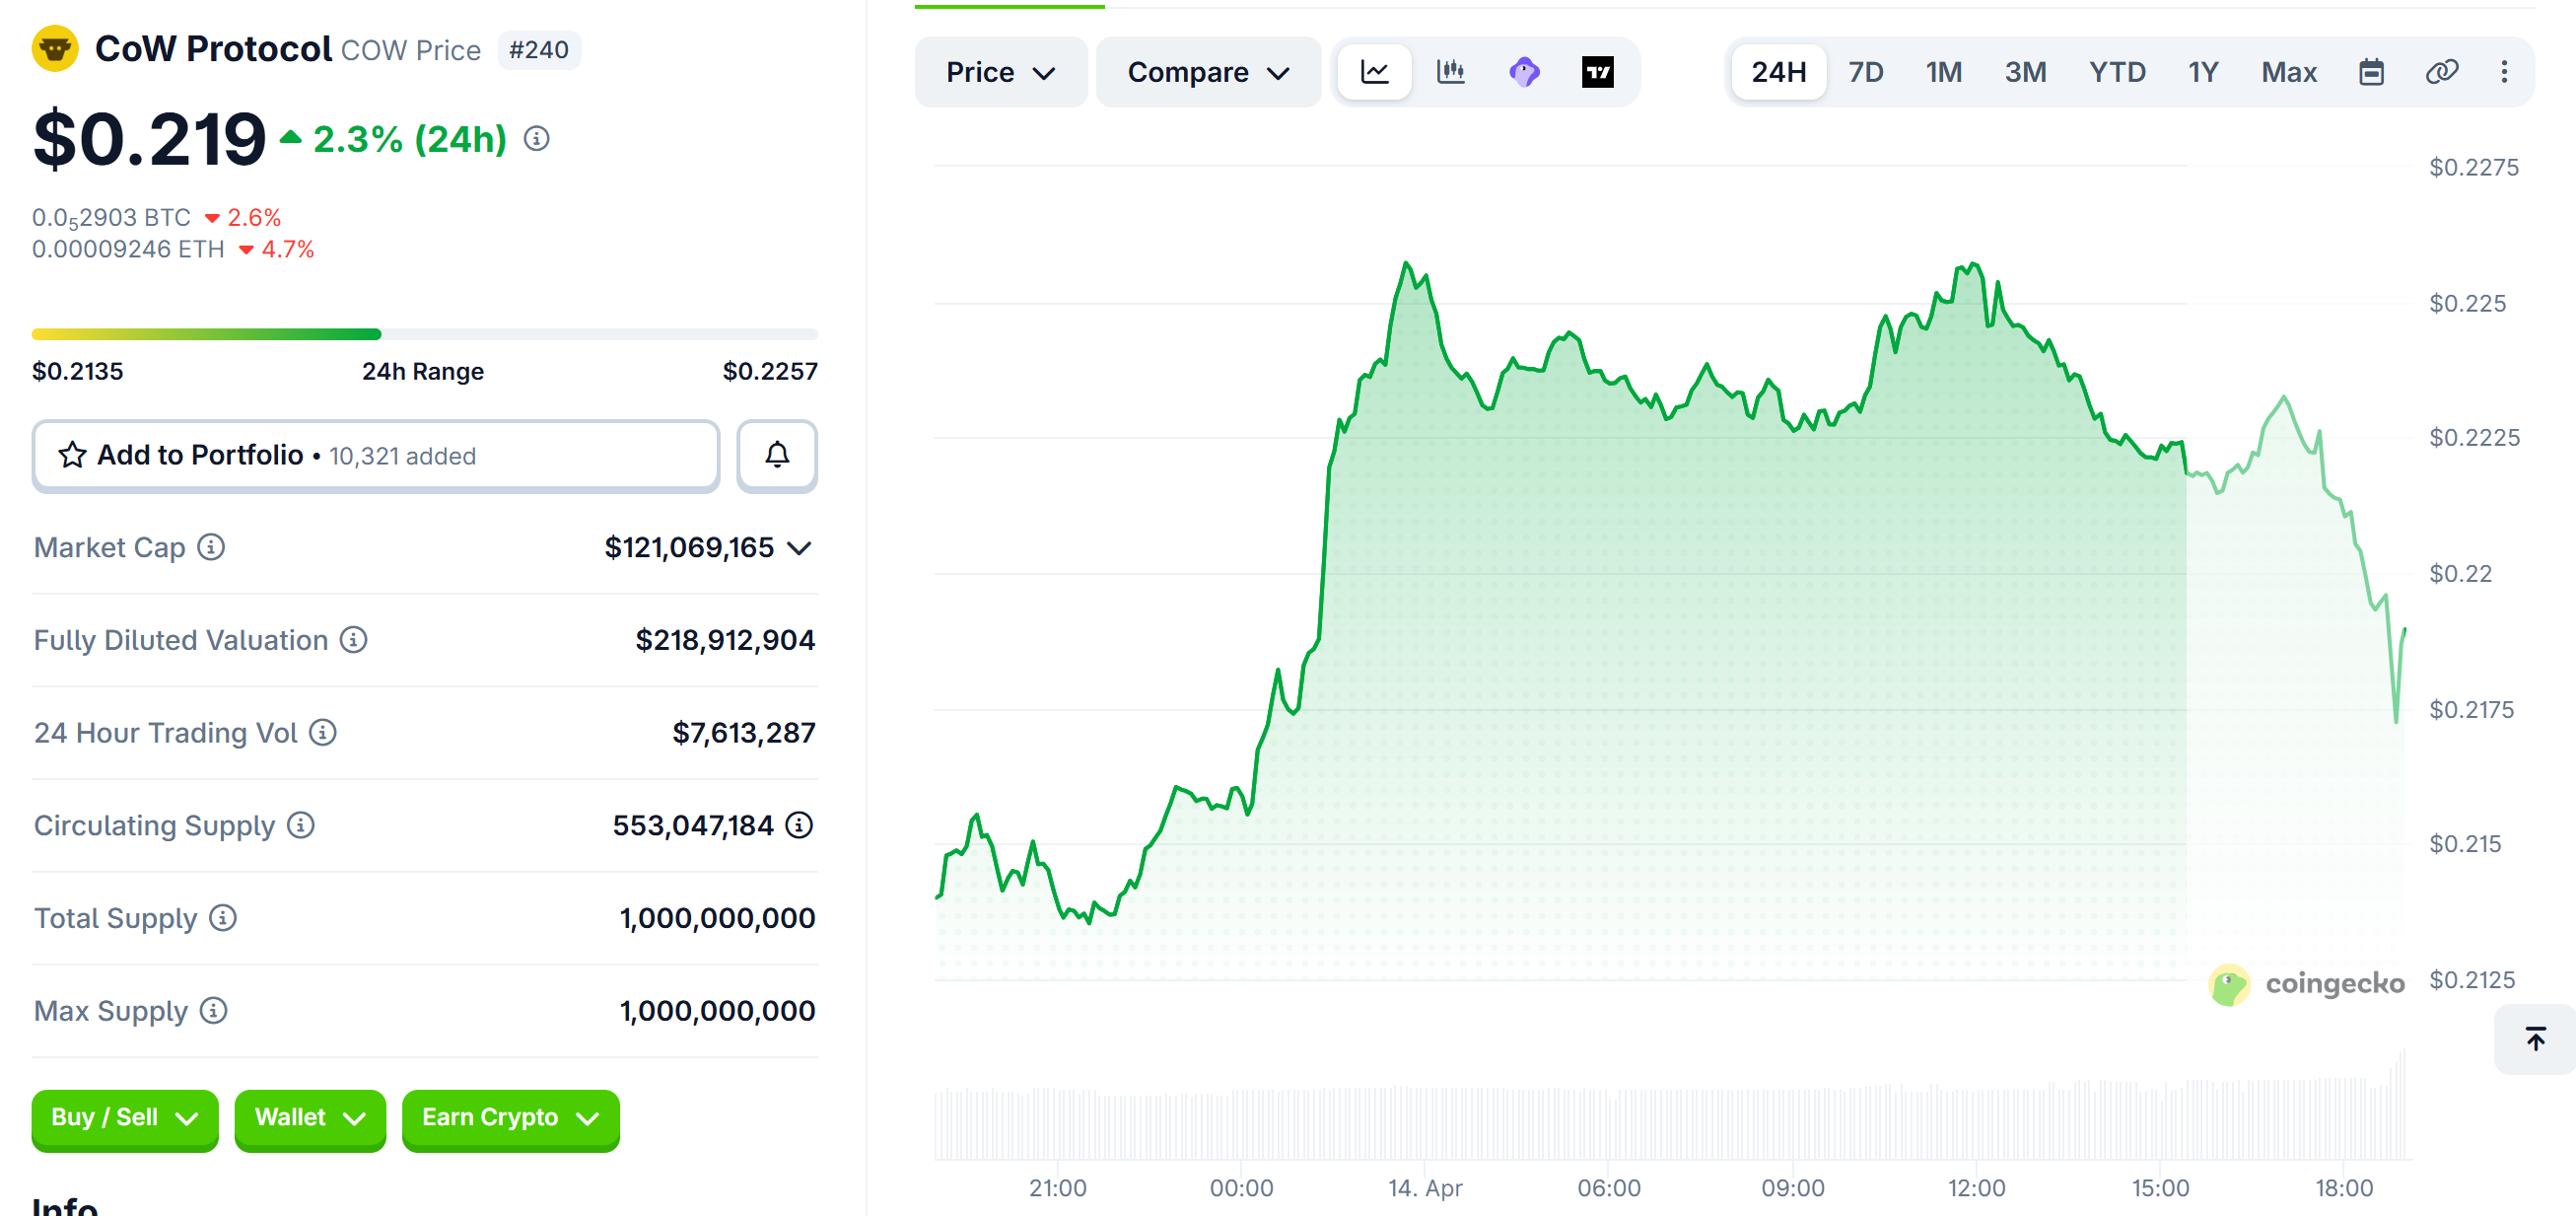
However, the risk to users who interact with the compromised frontend remains high.
Frontend attacks do not target smart contracts directly. Instead, they alter the interface users see, potentially injecting malicious transaction requests that appear legitimate.
Users who sign these transactions may unknowingly grant attackers access to their funds.
How Users Should Protect Themselves
CoW Swap advised all users to disconnect wallets from the platform and review any recent transactions for suspicious approvals.
Revoking token approvals through tools like Revoke.cash or Etherscan’s approval checker is a critical first step.
This is not the first time CoW Swap has faced security challenges. In 2023, an exploiter drained over $180,000 from the protocol’s settlement contract, though user funds were not directly affected in that incident.
Frontend compromises have become an increasingly common attack vector in DeFi. The 2025 Bybit hack, which exploited Safe Wallet’s frontend infrastructure, resulted in $1.5 billion in losses and underscored how even trusted interfaces can become entry points for attackers.
Users should wait for an official all-clear from the CoW Swap team before reconnecting wallets or resuming activity on the platform.
The post CoW Swap Warns Users to Avoid Frontend After Blockaid Flags Malicious Activity appeared first on BeInCrypto.

Nexo, a digital assets wealth platform for crypto holders, has been named the Official Regional Digital Asset Partner of the Argentina Football Association (AFA), marking a major step in the company’s South American expansion ahead of the 2026 FIFA World Cup.
The AFA x Nexo partnership positions Nexo alongside one of the most celebrated national teams in global football, reinforcing its ambitions in Latin America, where the company has recently strengthened its footprint through the acquisition of local platform Buenbit and the establishment of a regional hub in Buenos Aires.
Federico Ogue, CEO at Buenbit by Nexo, emphasized the alignment between the two organizations: “Argentina’s national team represents the highest level of sporting excellence, built on talent, conviction, and an unrelenting will to win. At Nexo, we share that standard. As we grow our presence in Argentina and across South America, partnering with AFA is a statement of commitment to this region and the clients we serve here.”
Strategic Expansion Meets Global Football Excellence
The agreement was formally unveiled during a high-profile signing ceremony in Buenos Aires, attended by executives, media, and invited guests. The event marks the official start of a collaboration that blends digital finance innovation with elite sports branding on a global stage.
Leandro Petersen, Chief Commercial & Marketing Officer of AFA, highlighted the broader significance of the partnership: “We are excited to announce a new partnership with a strong global reach that aligns with the Argentine Football Association’s international growth strategy, which we have been building in recent years through agreements with leading companies in innovation and technology.”
He also added: “Nexo’s arrival as the Official Digital Assets Partner of the Argentine National Team reflects not only the growth of our brand globally, but also the growing interest of international companies in partnering with Argentine soccer and one of the world’s most prominent national teams.”
Petersen also drew parallels between business and sport performance: “Success in elite sports, just as in business, is based on a clear strategy, discipline, and the ability to perform at the highest level when it matters most.”
The partnership comes at a pivotal time, with Argentina entering the upcoming World Cup cycle as defending champions and competing across North American venues, further amplifying global visibility for both AFA and Nexo.
Discover: The best pre-launch token sales
Nexo Argentina Partnership is not the Only one this World Cup
Far from a single sponsorship, the 2026 tournament is emerging as one of the most crypto-integrated sporting events in history. FIFA has already signed a landmark deal with blockchain-powered prediction platform ADI Predictstreet as an official partner, enabling fans worldwide to engage with matches through data-driven prediction markets built on crypto.
Introducing @Predictstreet — ADI Chain (@ADIChain_) April 2, 2026

The Official Prediction Market Partner of the @FIFAWorldCup 2026
More than 5 billion fans will watch the World Cup.
ADI Predictstreet was built to reach every single one of them.
The first consumer-facing ecosystem project on ADI Chain is going… pic.twitter.com/oYJpD2eElv
This follows FIFA’s Web3 push, including the development of its own blockchain ecosystem for digital collectibles and fan engagement.
Even fan access and monetization are being reshaped by blockchain rails. FIFA has experimented with NFT-based ticketing and digital ownership models in the lead-up to 2026, blending collectibles with access rights and creating new commercial layers around the tournament experience.
Want to be at the FIFA World Cup 2026 — FIFA Collect (@FIFACollect) March 9, 2026
?
Here's how to get there with an RTT 
1⃣ Sign in/Sign up your FIFA Collect account
2⃣ Browse RTT listings & choose your match
4⃣ Buy or make an offer
5⃣ Be there. 
Go to the Marketplace  https://t.co/JtpS3Pz4nn pic.twitter.com/Mxb8WCRhvV
Discover: The best crypto to diversify your portfolio with
The post Nexo Named Official Digital Asset Partner of Argentina Ahead of 2026 FIFA World Cup appeared first on Cryptonews.

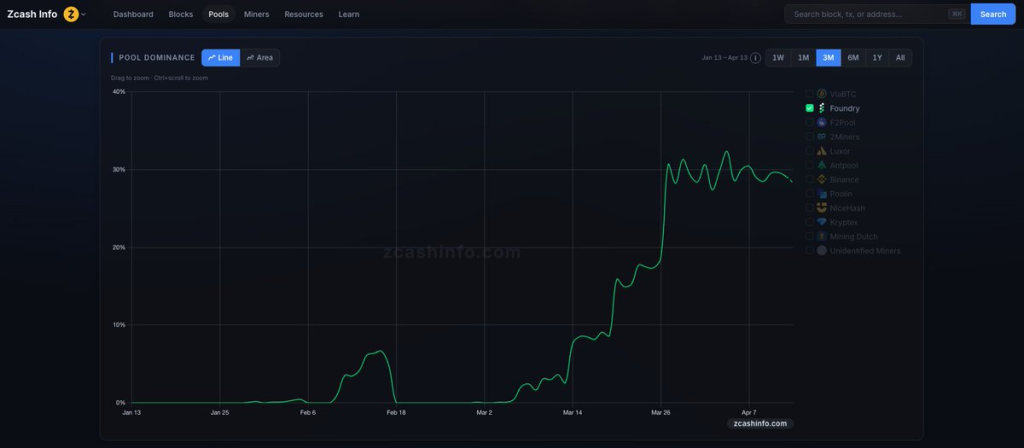
Foundry Digital’s newly launched Zcash (ZEC) mining pool captured approximately 29% of the network’s total hashrate within a month of going live, a rate of consolidation that rivals what ViaBTC, the prior dominant pool, took considerably longer to establish.
The pool went public in April 2026 after Foundry announced the initiative on March 11, onboarding institutional miners ahead of the public launch.
The speed of that hashrate capture is the signal worth examining. Foundry didn’t inch into Zcash mining, it arrived and immediately held roughly the same share that ViaBTC had built as the incumbent leader, sitting at around 30% of network hashrate before Foundry’s entry.
- Hashrate Capture: Foundry’s Zcash pool seized ~29% of network hashrate within one month of launch, per company data and the new Zcashinfo.com block explorer.
- Zcash Network Context: Zcash’s total hashrate had risen from 8.1 GSol/s to 13.8 GSol/s since early September 2025 before Foundry’s entry, with ViaBTC previously holding ~30% dominance.
- Pool Structure: The pool uses a PPLNS payout model, distributes rewards via transparent ZEC addresses, enforces KYC/AML checks, and requires no minimum hashrate, a deliberate institutional access design.
- Compliance Infrastructure: Foundry’s pool mirrors the SOC 1 Type 2 and SOC 2 Type 2 compliance framework of Foundry USA Pool, its dominant Bitcoin mining operation.
- Zcashinfo.com Launch: Foundry released a dedicated Zcash block explorer alongside the pool, providing real-time hashrate distribution, pool rankings, and mining difficulty tracking.
- What to Watch: Whether Foundry’s share continues climbing past 30% – the threshold at which centralization risk becomes a live network security debate – is the next data point that matters.
Discover: How sovereign and institutional actors are reshaping proof-of-work network economics
What Does 29% Hashrate Capture in One Month Actually Mean for Zcash Network Security?
A single pool controlling 29% of a PoW network’s hashrate is not inherently dangerous, but it concentrates block production risk in ways that demand monitoring.
At 29%, Foundry cannot unilaterally execute a 51% attack, but it is close enough to the threshold that any further organic growth changes that calculus.
The fact that ViaBTC was already sitting at ~30% before Foundry launched means the network now has two pools each holding roughly three-tenths of total hashrate. That’s a different concentration structure than existed six months ago.
Foundry Zcash Pool is officially live! Since our announcement last month, we've seen rapid hashrate growth reaching ~30% of network hashrate. Institutional miners have been looking for compliant, purpose-built $ZEC infrastructure, and we're proud to deliver it.
Additionally,… pic.twitter.com/GOXyKrqhhH— Foundry (@FoundryServices) April 13, 2026
Foundry CEO Mike Colyer framed the launch as an infrastructure gap play: Zcash has “matured into an institutional-grade asset, but the mining infrastructure supporting it hasn’t kept pace.”
The data supports the premise that Zcash’s hashrate growth from 8.1 GSol/s to 13.8 GSol/s since September 2025 reflects expanding miner interest that the existing pool infrastructure wasn’t built to absorb at an institutional scale.
What Foundry has built operationally is notable for its compliance architecture. The pool’s PPLNS payout model, mandatory KYC/AML checks, SOC 1 and SOC 2 audit equivalency, and 24/7 U.S.-based support aren’t features designed for hobbyist miners.
No minimum hashrate requirement means the access floor is low, but the compliance overhead signals this is targeting miners who need defensible regulatory positioning, the same institutional cohort driving volume on Foundry USA Pool in Bitcoin.
Zooko Wilcox, Zcash founder and now Chief Product Officer at Shielded Labs, directly addressed the centralization angle: “This will spread out the Zcash mining hashpower from its current concentration in a single pool, and hopefully it will bring in new Zcash miners who trust Foundry to operate a high-quality service.”
That framing treats Foundry’s entry as a decentralization event relative to ViaBTC’s prior dominance. Whether it remains that depends on where Foundry’s share stabilizes. If it climbs past 35%, the narrative flips.
The data shows rapid institutional onboarding. That implies pre-existing demand from miners who were waiting for a compliant U.S.-based option, not that Foundry manufactured the hashrate from scratch.
The post Foundry Captures 29% of Zcash Hashrate Within a Month of Pool Launch appeared first on Cryptonews.

Bitget, the world’s largest Universal Exchange (UEX), today launched CFD Copy Trading, expanding access to traditional financial markets and allowing users to automatically follow professional traders across forex, commodities, and indices directly from the Bitget platform.
The launch follows strong growth in Bitget’s CFD business, which recently surpassed $6 billion in single-day trading volume as users responded to heightened volatility across global markets. Recent price movements in gold, oil, major currency pairs, and equity indices have drawn increased participation from crypto-native traders seeking broader market exposure as macro conditions become more interconnected.
While that growth has largely been driven by experienced traders able to react quickly to macroeconomic signals, access remains uneven for everyday users who do not actively track market developments or trade across multiple asset classes. CFD Copy Trading is designed to reduce that barrier by allowing users to mirror the strategies of top-performing traders starting from 50 USDT, using the same copy trading framework already familiar across Bitget’s futures and spot products.
“More users are paying attention to macro movements because the opportunity set has widened beyond crypto alone,” said Gracy Chen, CEO of Bitget. “What matters now is making that access practical. Copy trading lowers the execution barrier for users who want exposure to global markets without needing to build that expertise from scratch.”
The product is built on Bitget’s MT5-integrated CFD infrastructure and introduces several mechanisms designed to improve execution and transparency for both traders and followers. MT5 account creation and withdrawal processing are completed in under three seconds through a fully automated backend process, reducing friction at onboarding and settlement. Bitget also applies a High-Water Mark profit-sharing model, under which expert traders only receive profit share when a follower’s account reaches a new net profit high after fully recovering prior losses. This means traders are rewarded only when followers have reached net profitability, aligning incentives more directly across both sides of the strategy.
Performance data including ROI, follower count, and profit-sharing figures refresh hourly, replacing the delayed reporting model still common across much of the market. Profit-sharing settlements are processed daily, and eligible traders can receive up to 30% in profit share, with VIP structures also allowing restricted access portfolios for invited followers.
The launch also expands Bitget’s broader Universal Exchange strategy, which is built around giving users access to multiple asset classes under a single account structure. Through USDT-based margin, users can move between crypto, commodities, forex, and indices without transferring funds between external brokers or converting capital across separate platforms. For crypto users, CFD Copy Trading creates a simpler entry point into traditional financial markets. For experienced MT5 and forex traders, it also creates a new entry point into Bitget’s broader ecosystem, where traditional and digital asset markets increasingly overlap within a single trading environment.
To know more about CFD copy trading, please visit here.
About Bitget
Bitget is the world’s largest Universal Exchange (UEX), serving over 125 million users and offering access to over 2M crypto tokens, 100+ tokenized stocks, ETFs, commodities, FX, and precious metals such as gold. The ecosystem is committed to helping users trade smarter with its AI agent, which co-pilots trade execution. Bitget is driving crypto adoption through strategic partnerships with LALIGA and MotoGP™. Aligned with its global impact strategy, Bitget has joined hands with UNICEF to support blockchain education for 1.1 million people by 2027. Bitget currently leads in the tokenized TradFi market, providing the industry’s lowest fees and highest liquidity across 150 regions worldwide.
For more information, visit: Website | Twitter | Telegram | LinkedIn | Discord
Risk Warning: Digital asset prices are subject to fluctuation and may experience significant volatility. Investors are advised to only allocate funds they can afford to lose. The value of any investment may be impacted, and there is a possibility that financial objectives may not be met, nor the principal investment recovered. Independent financial advice should always be sought, and personal financial experience and standing carefully considered. Past performance is not a reliable indicator of future results. Bitget accepts no liability for any potential losses incurred. Nothing contained herein should be construed as financial advice. For further information, please refer to our Terms of Use.
The post Bitget Launches CFD Copy Trading as Demand for Cross-Market Exposure Accelerates appeared first on BeInCrypto.
Crypto World
Nvidia Stock Extends Winning Streak Ahead Of Two Key Reports| Investor’s Business Daily
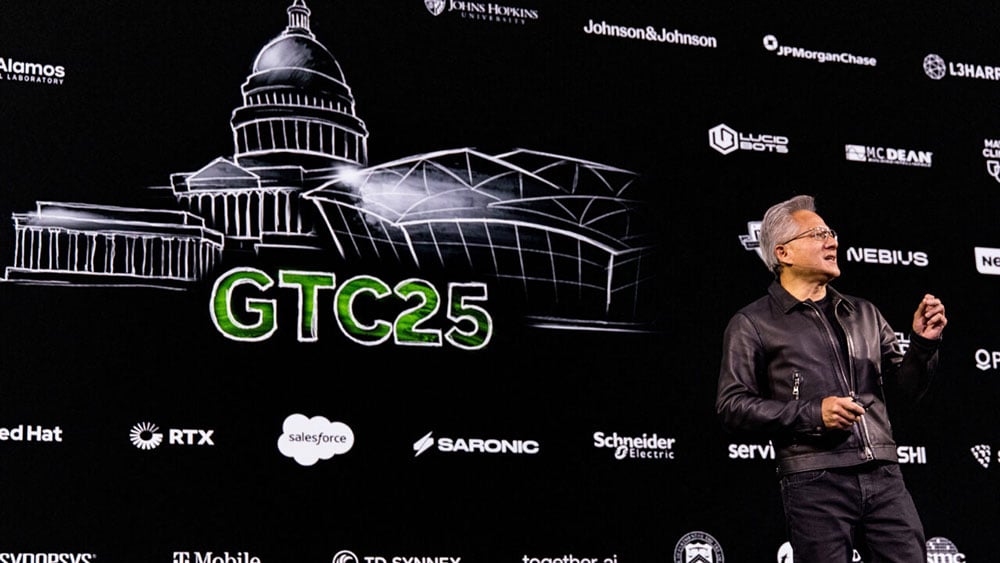
Nvidia (NVDA) extended gains Tuesday even as the broader stock market fluctuated following the U.S. imposition of a blockade on ships in the Strait of Hormuz after peace talks between the U.S. and Iran failed. Shares are on track for matching their longest string of advances made on Nov. 14, 2023, when they marked 10 consecutive wins. Is Nvidia stock…

A city united to resist Britain First – hundreds to protest against far right

Help Our Grandkids?
Pope Leo slams ‘wicked’ figures in furious swipe amid Donald Trump feud


-

 Politics4 days ago
US brings back mandatory military draft registration
-
 Sports4 days ago
Man United discover Nico Schlotterbeck transfer fee as defender reaches Dortmund agreement
-

 Fashion4 days ago
Weekend Open Thread: Veronica Beard
-

 Tech7 days ago
How Long Can You Drive With Expired Registration? What Florida Law Says
-

 Politics4 days ago
Malcolm In The Middle OG Turned Down ‘Buckets Of Money’ To Appear In Reboot
-

 Politics2 days ago
World Cup exit makes Italy enter crisis mode
-

 Crypto World5 days ago
Canary Capital Files SEC Registration for PEPE ETF
-

 Business4 days ago
Tesla Model Y Tops China Auto Sales in March 2026 With 39,827 Registrations, Beating Cheaper EVs and Gas Cars
-

 Crypto World23 hours ago
The SEC Conditionalises DeFi Platforms to Be Avoided for Broker Registration
-

 Crypto World19 hours ago
SEC Signals Exemption for Crypto Interfaces From Broker Registration
-

 Crypto World6 days ago
Bitcoin recovers as US and Iran Agree a Ceasefire Deal
-
 NewsBeat2 days ago
Pep Guardiola and Gary Neville agree over Arsenal title problem that benefits Man City
-

 Business4 days ago
OpenAI Halts Stargate UK Data Centre Project Over Energy Costs and Copyright Row
-

 Business3 days ago
Ireland Fuel Protests Enter Day 5 as Blockades Spark Shortages and Government Prepares Support Package
-

 Politics4 days ago
LBC Presenter Mocks Trump Over Iran War Failures
-

 Crypto World4 days ago
Federal judge blocks Arizona from bringing criminal charges against Kalshi
-

 Tech5 days ago
A version of Windows 10 released a decade ago is now eligible for additional security patches
-
 NewsBeat2 days ago
JD Vance announces ‘no agreement’ with Iran over nuclear weapons fear
-

 Business4 days ago
IMF retains floor for precautionary balances at SDR 20 billion
-

 NewsBeat8 hours ago
Trump and Pope Leo: Behind their disagreement over Iran war
You must be logged in to post a comment Login