
Crypto World
XRP Price Rally Needs to Absorb 1.2 Billion Tokens, but Buying Power Is Fading
XRP price trades at $1.33 on April 6, up 3% over the past 24 hours, but sitting inside a developing head and shoulders pattern on the daily chart. The right shoulder is forming, and any rally from here needs to push through a 1.24 billion token supply wall overhead.
The problem is that the buying pressure, which would normally drive that kind of move, has halved since late March, raising the question of whether the current bounce has enough fuel to absorb the supply or will simply complete the bearish pattern.
A Right Shoulder Is Forming, and Two EMAs Stand in the Way
The daily chart shows a clear head and shoulders structure. The left shoulder formed in late February, the head peaked near $1.60 in mid-March, and the right shoulder is currently developing as XRP price consolidates around $1.33. The neckline sits near $1.26. A confirmed break below that level would activate a near 19% measured move.
Before the bearish pattern can be invalidated, XRP needs to reclaim two Exponential Moving Averages (EMAs), which are trend indicators that give greater weight to recent price action. The 20-day EMA sits at $1.35 and the 50-day at $1.42. The last clean reclaim of the 20-day EMA happened on March 13, after which prices rallied 15.26% and also recaptured the 50-day.
Want more token insights like this? Sign up for Editor Harsh Notariya’s Daily Crypto Newsletter here.
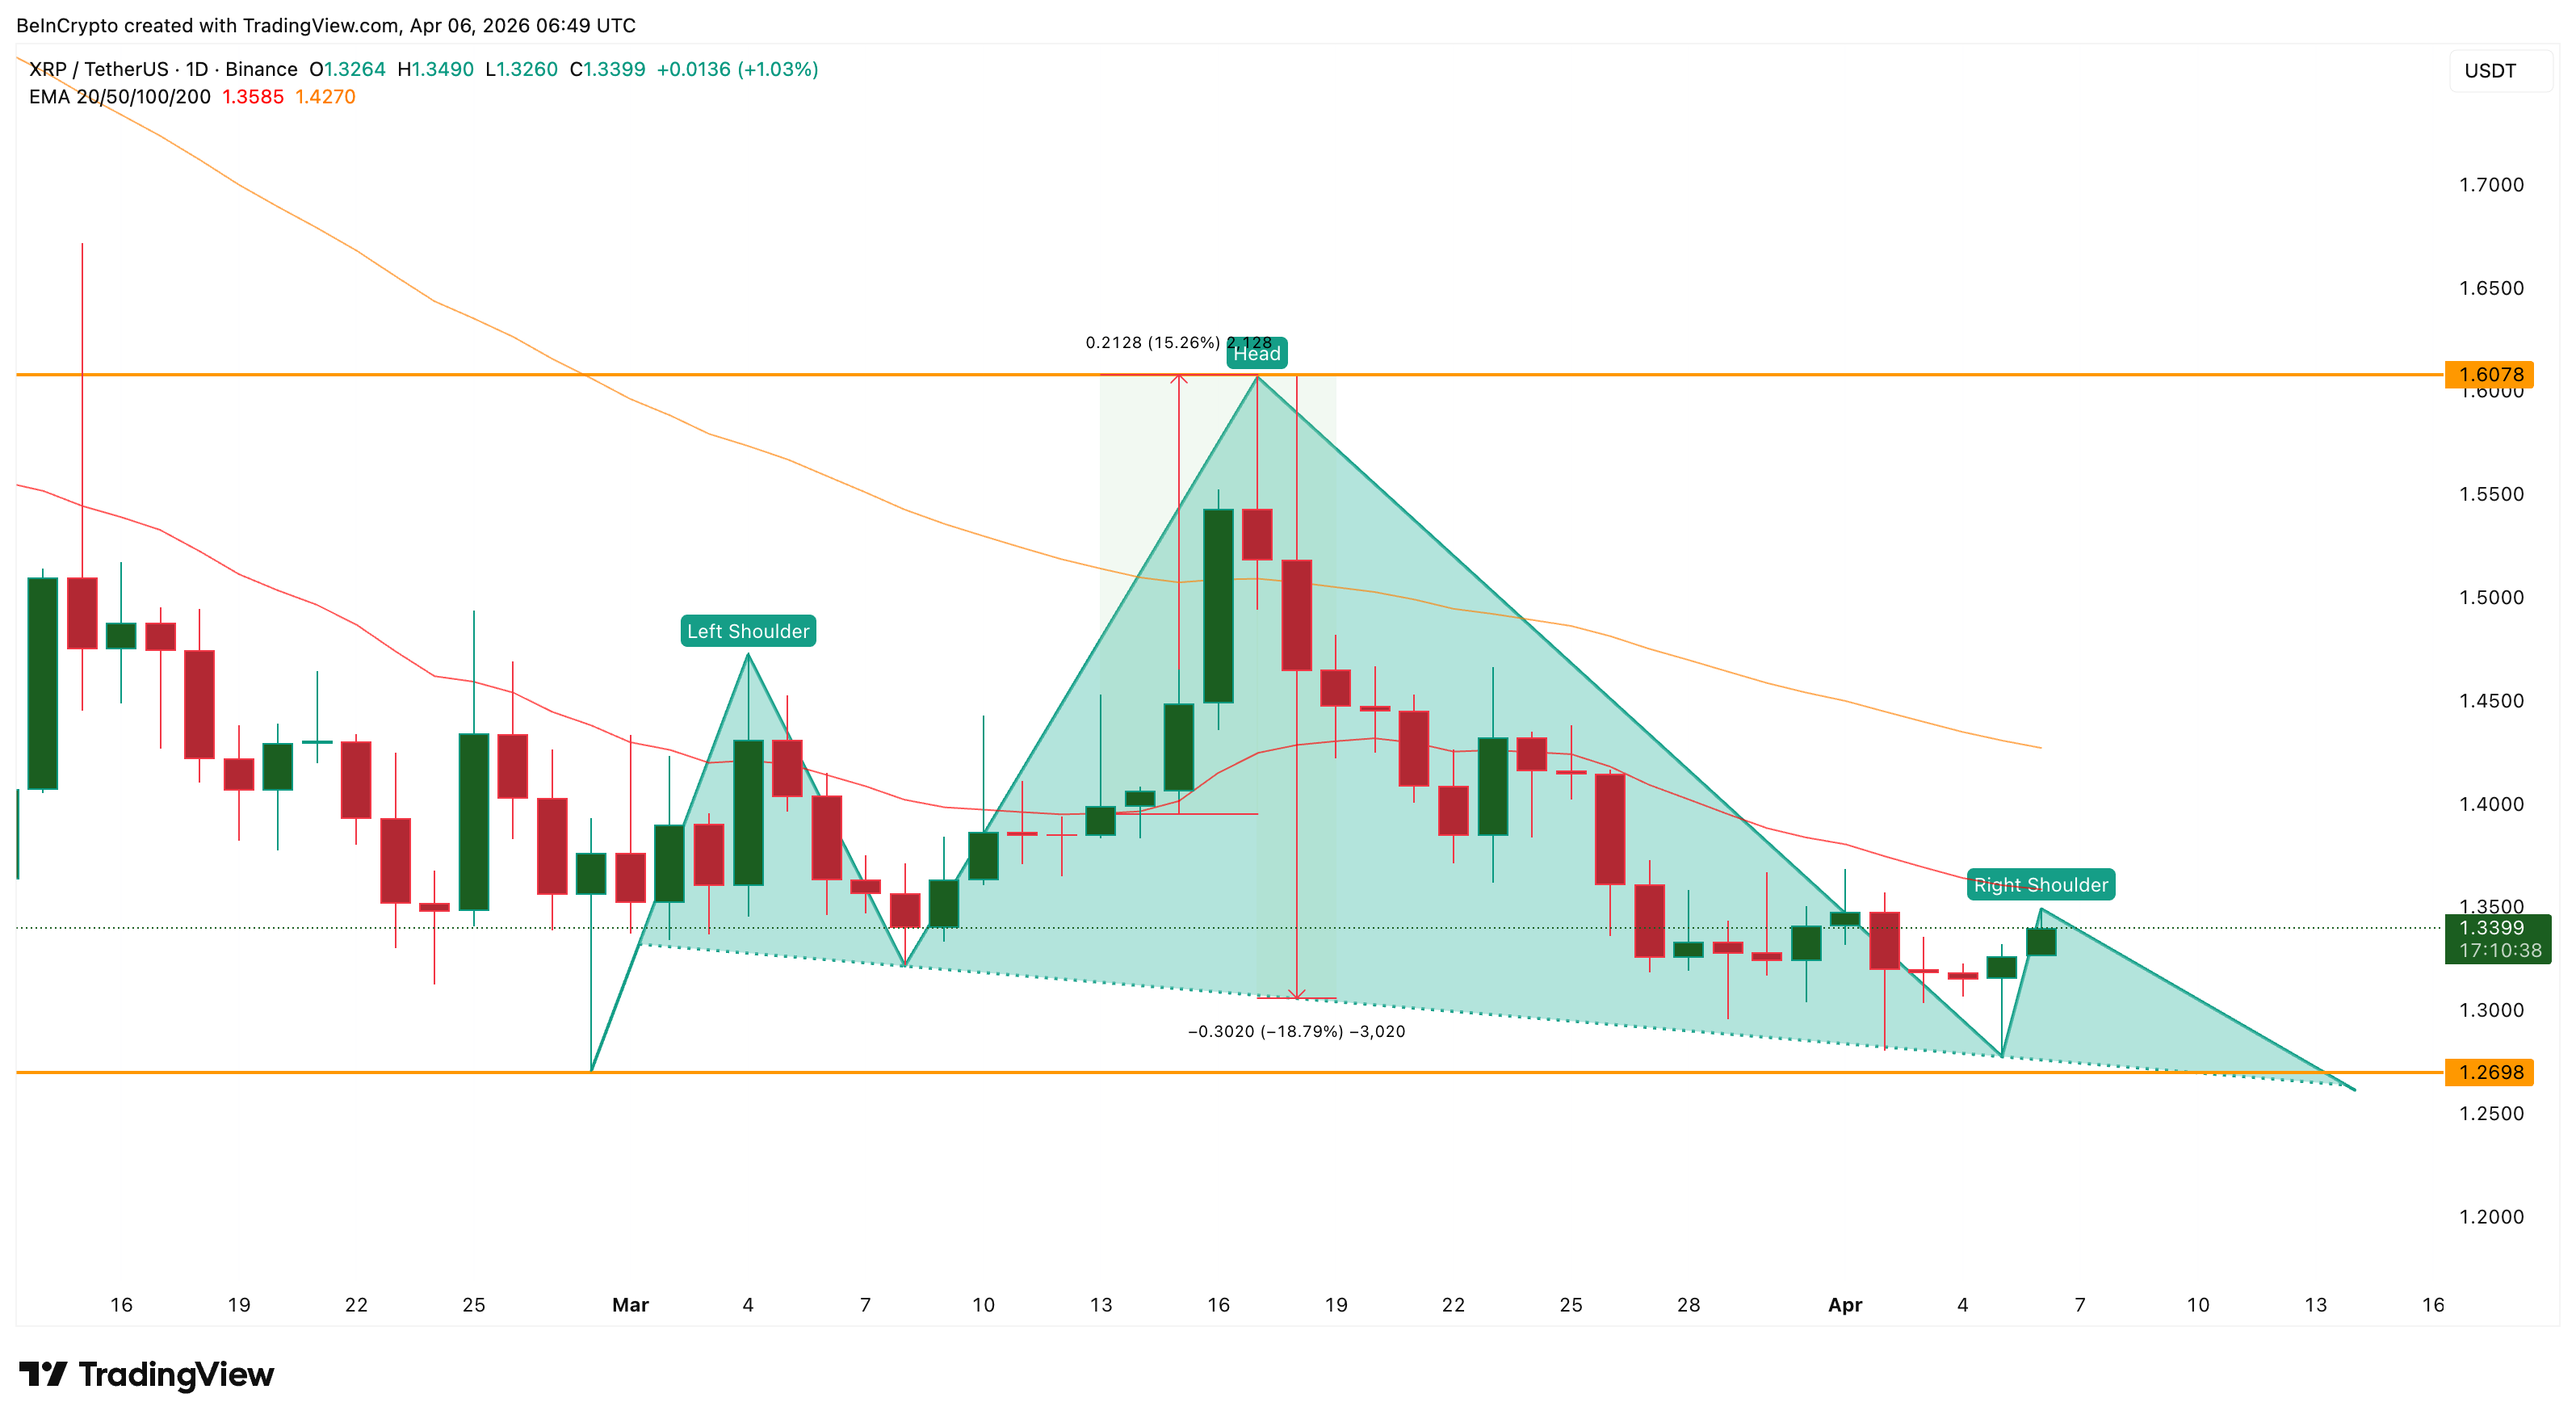
A daily close above $1.35 would reclaim the 20-day EMA and provide the first signal of short-term strength. However, any price peak that stays below the head at $1.60 remains inside the head and shoulders structure and risks forming the right shoulder rather than breaking the pattern. The supply data reveals exactly where the resistance begins (as the shoulder develops) and why absorbing it will be difficult.
1.2 Billion Tokens and Fading Conviction
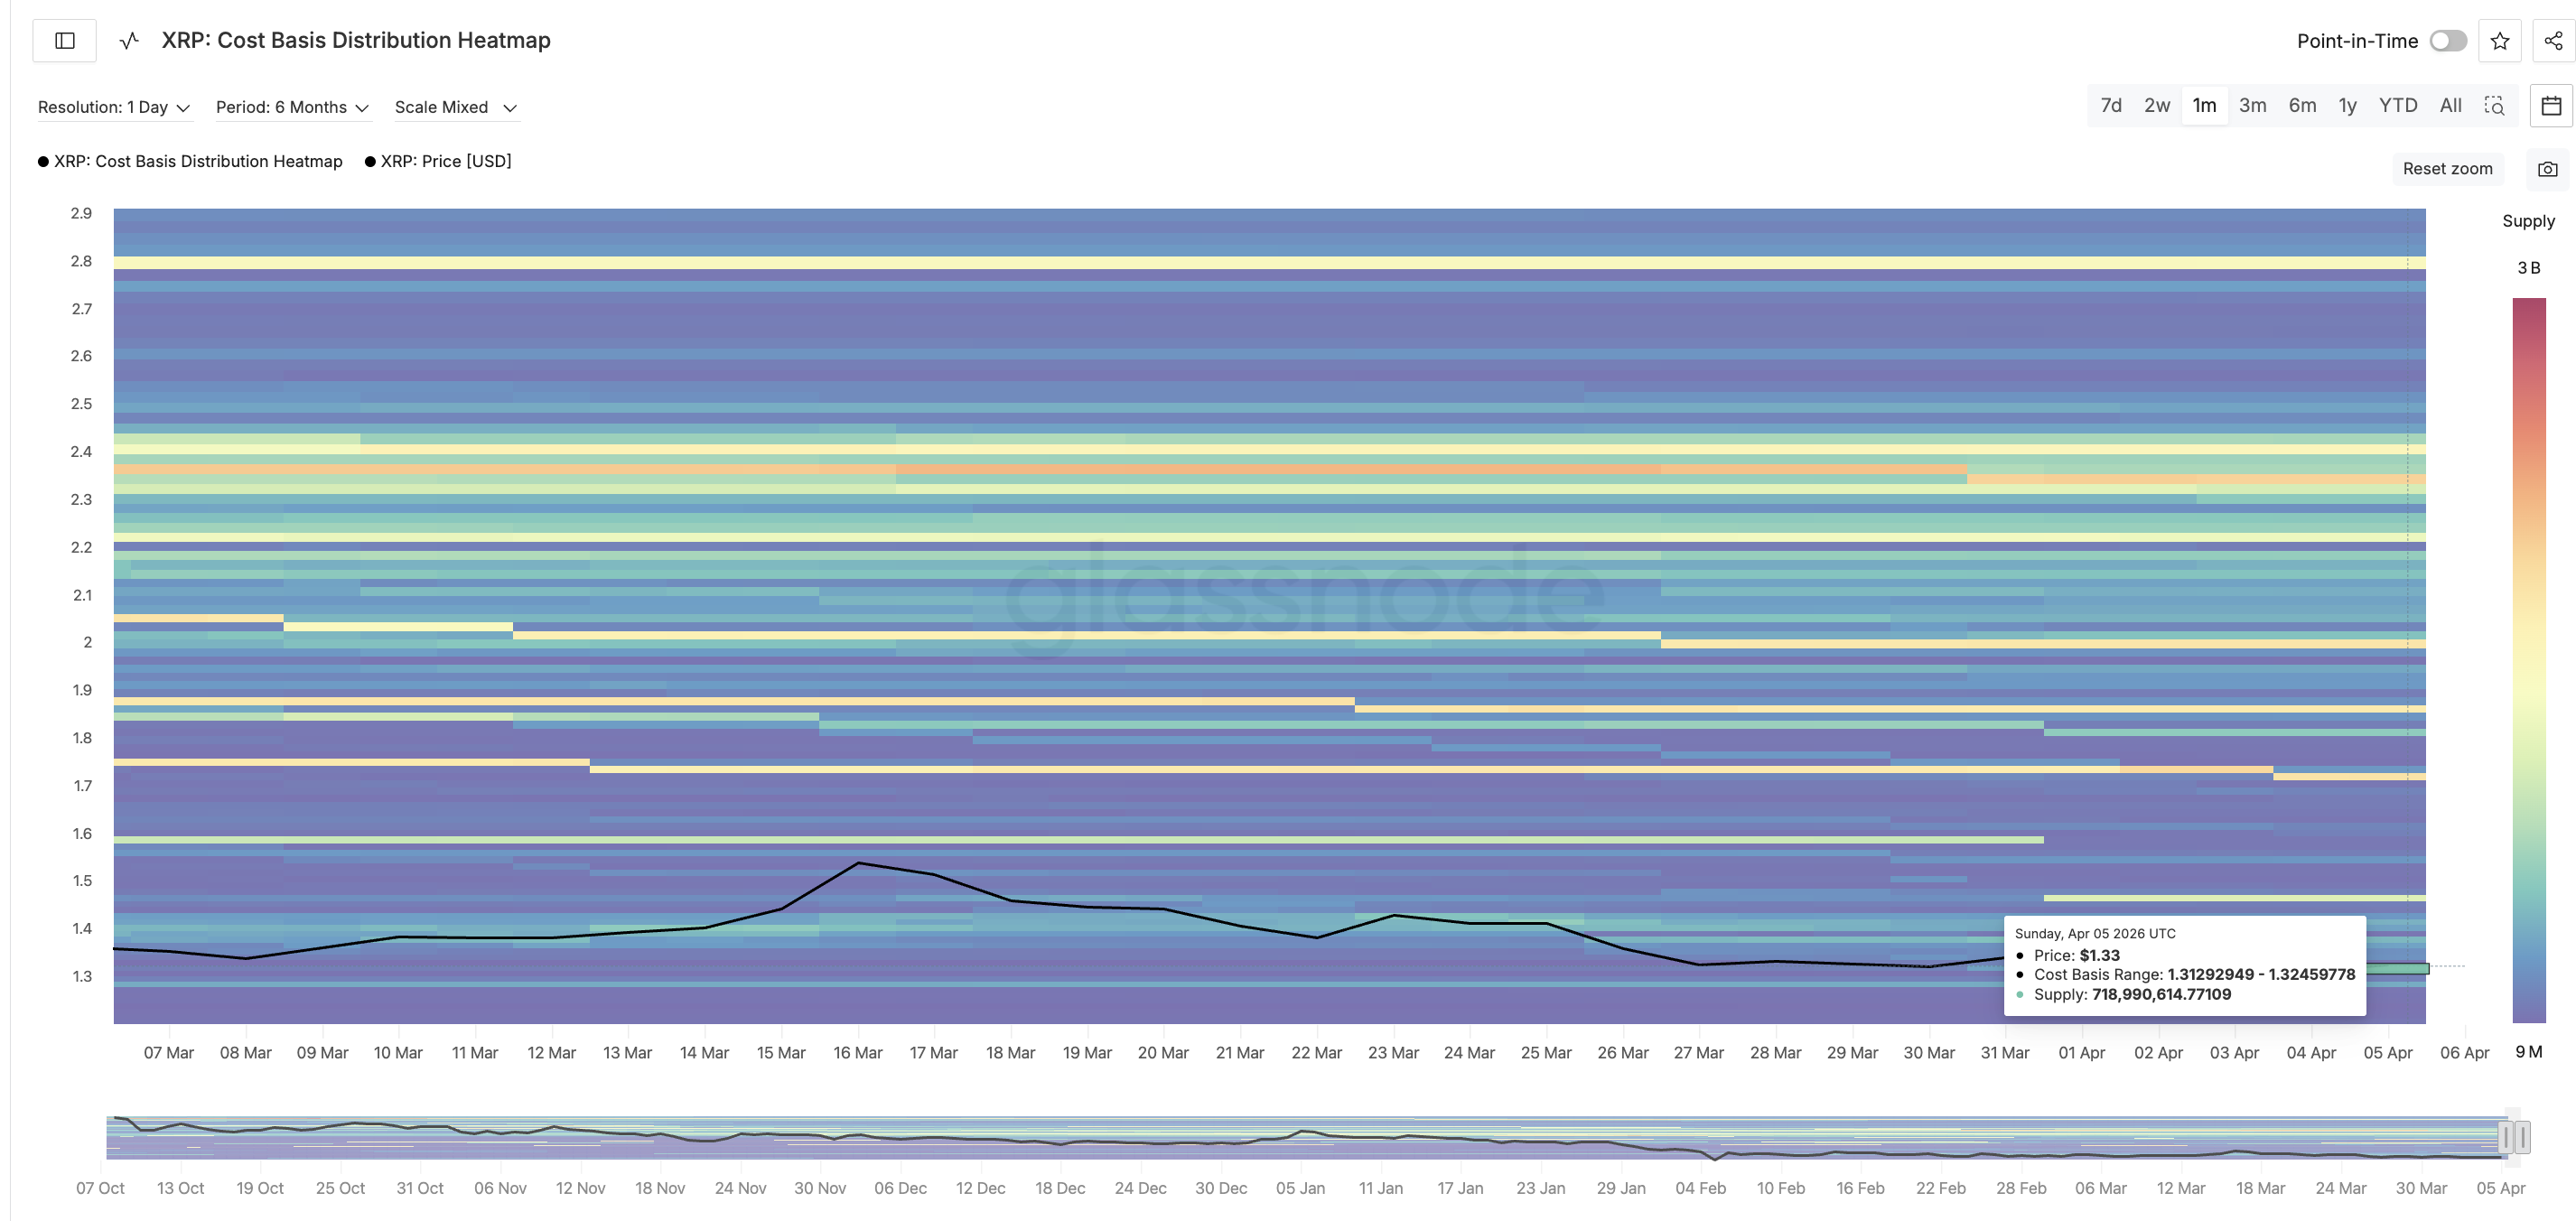
The Cost Basis Distribution Heatmap, which maps how much XRP supply was last acquired at each price level, identifies two critical clusters that frame the current setup.
The first sits between $1.31 and $1.32, where approximately 719 million XRP has its cost basis. This cluster acts as the floor supporting the right shoulder. As long as these holders remain confident and do not sell, the XRP price maintains its current level.
If this cluster begins distributing, the right shoulder would erode quickly and the neckline at $1.26 comes under direct threat.
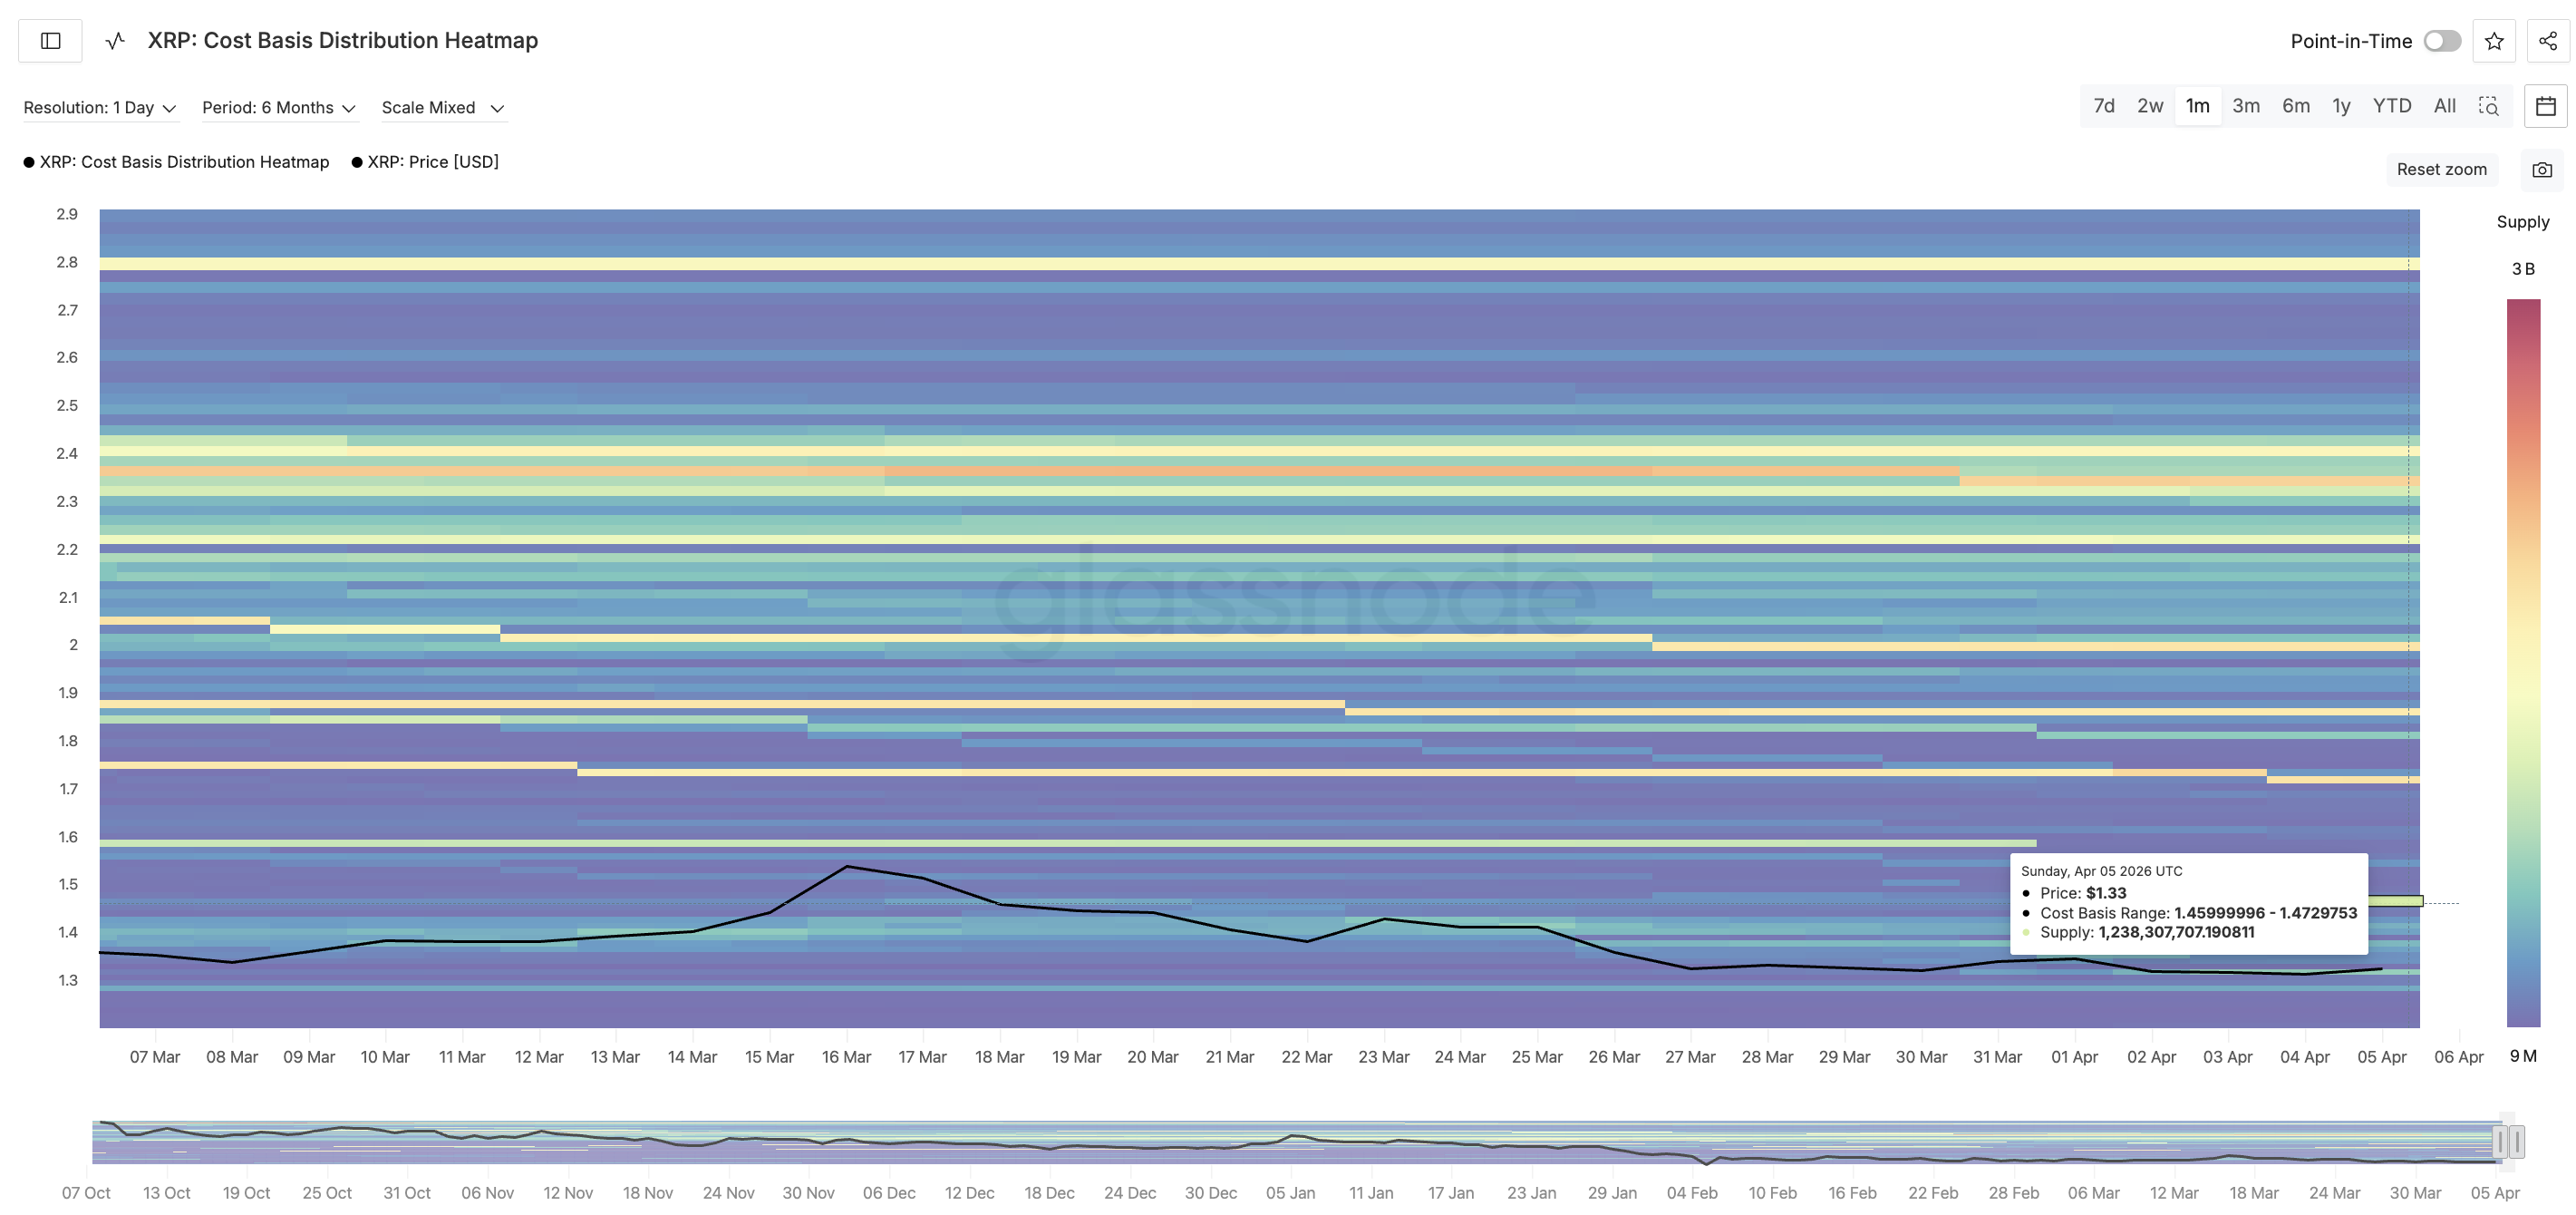
The second and larger cluster sits between $1.45 and $1.47, holding approximately 1.24 billion XRP. This is the overhead wall that any meaningful rally must absorb. These holders acquired their positions at higher prices. And they might look to exit at or near breakeven if price approaches their cost basis. Pushing through 1.24 billion tokens worth of potential selling pressure requires sustained and aggressive buying.
The Exchange Net Position Change, which tracks whether tokens are moving onto or off exchanges, reveals whether that buying power exists. A negative reading means more XRP is leaving exchanges than entering, which signals accumulation. The metric peaked at approximately -117 million XRP around late March, indicating strong buying conviction. By April 5, it had dropped to -57 million XRP, a decline of roughly 51%.
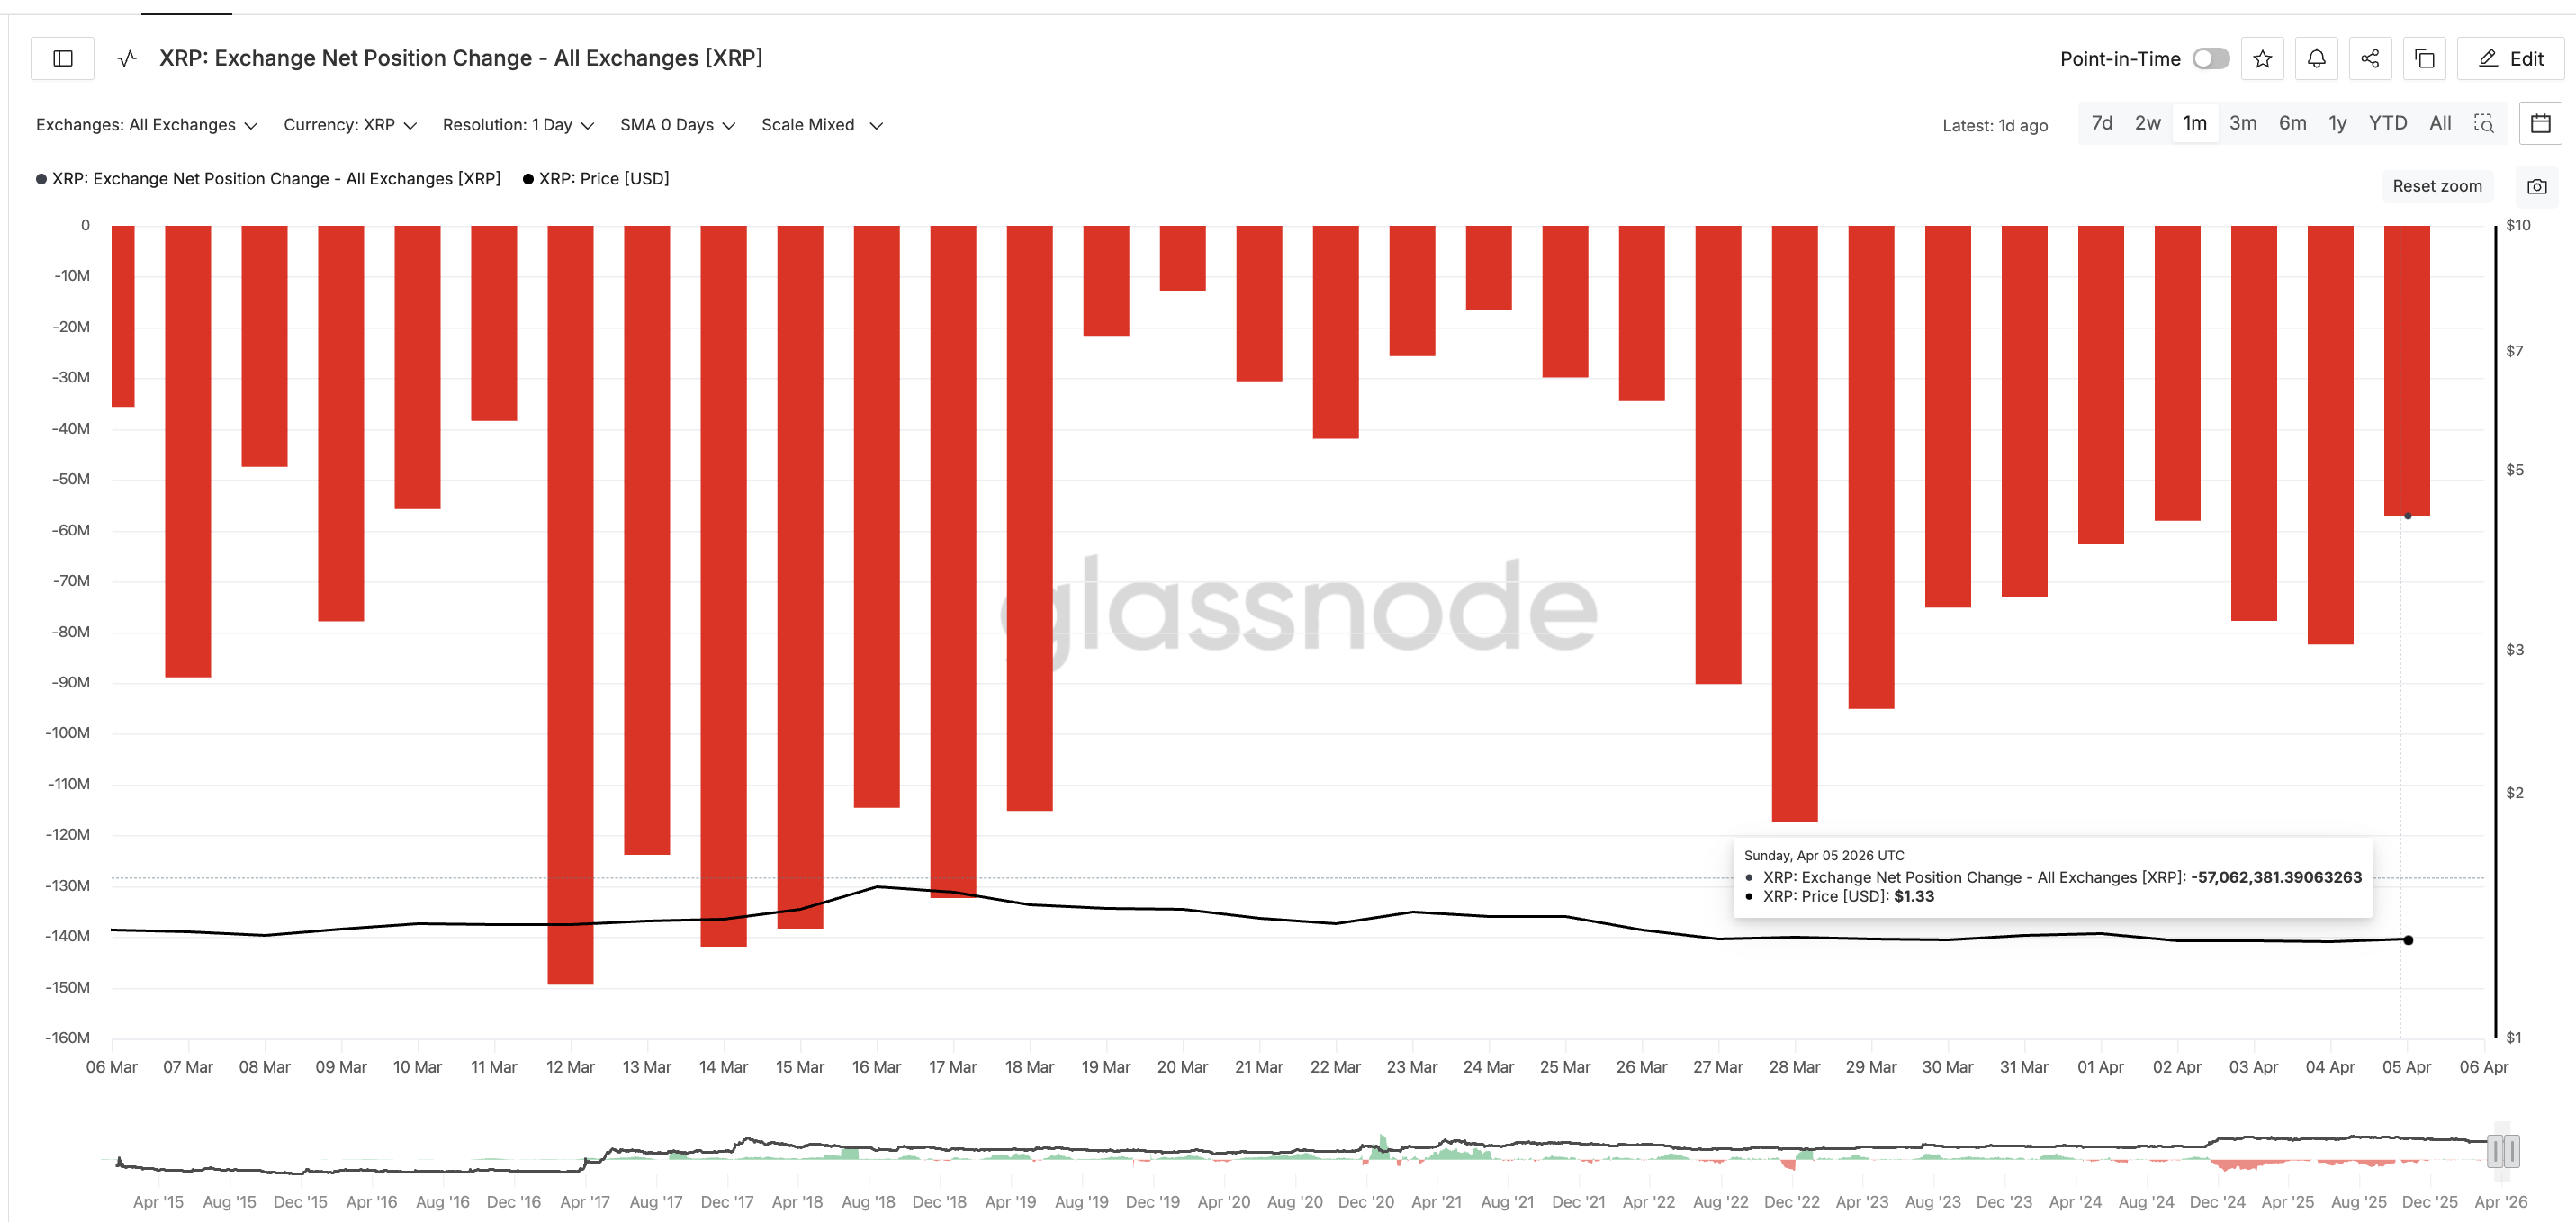
The buying pressure that supported the mid-March rally has halved. With 1.24 billion tokens sitting overhead and only half the exchange conviction remaining, the math for absorbing the supply wall becomes significantly harder. If no fresh buying power arrives, the right shoulder could finalize near this $1.45-$1.47 supply cluster zone.
XRP Price Levels Between a Breakout and a Breakdown
The daily price chart with technical levels from the completed swing frames every critical level.
The first hurdle is $1.35, the 0.236 level that closely aligns with the 20-day EMA. A daily close above this would mirror the March 13 reclaim that preceded a 15% rally. Above that, $1.40 and $1.44 come into focus, with $1.48 at the 0.618 level acting as the key confirmation. A close above $1.48 would mean that the 1.24 billion token cluster between $1.45 and $1.47 did not sell or that their selling pressure was absorbed by new demand.
The XRP price would only show genuine strength above $1.60, the head of the pattern. A reclaim of the head would fully invalidate the head and shoulders and shift the structure from bearish to bullish.
On the downside, a failure to reclaim $1.35 keeps the right shoulder intact and $1.26-$1.27 remains directly at risk. A confirmed break below the neckline at $1.26 would activate the 19% measured move and project a drop toward $1.03.
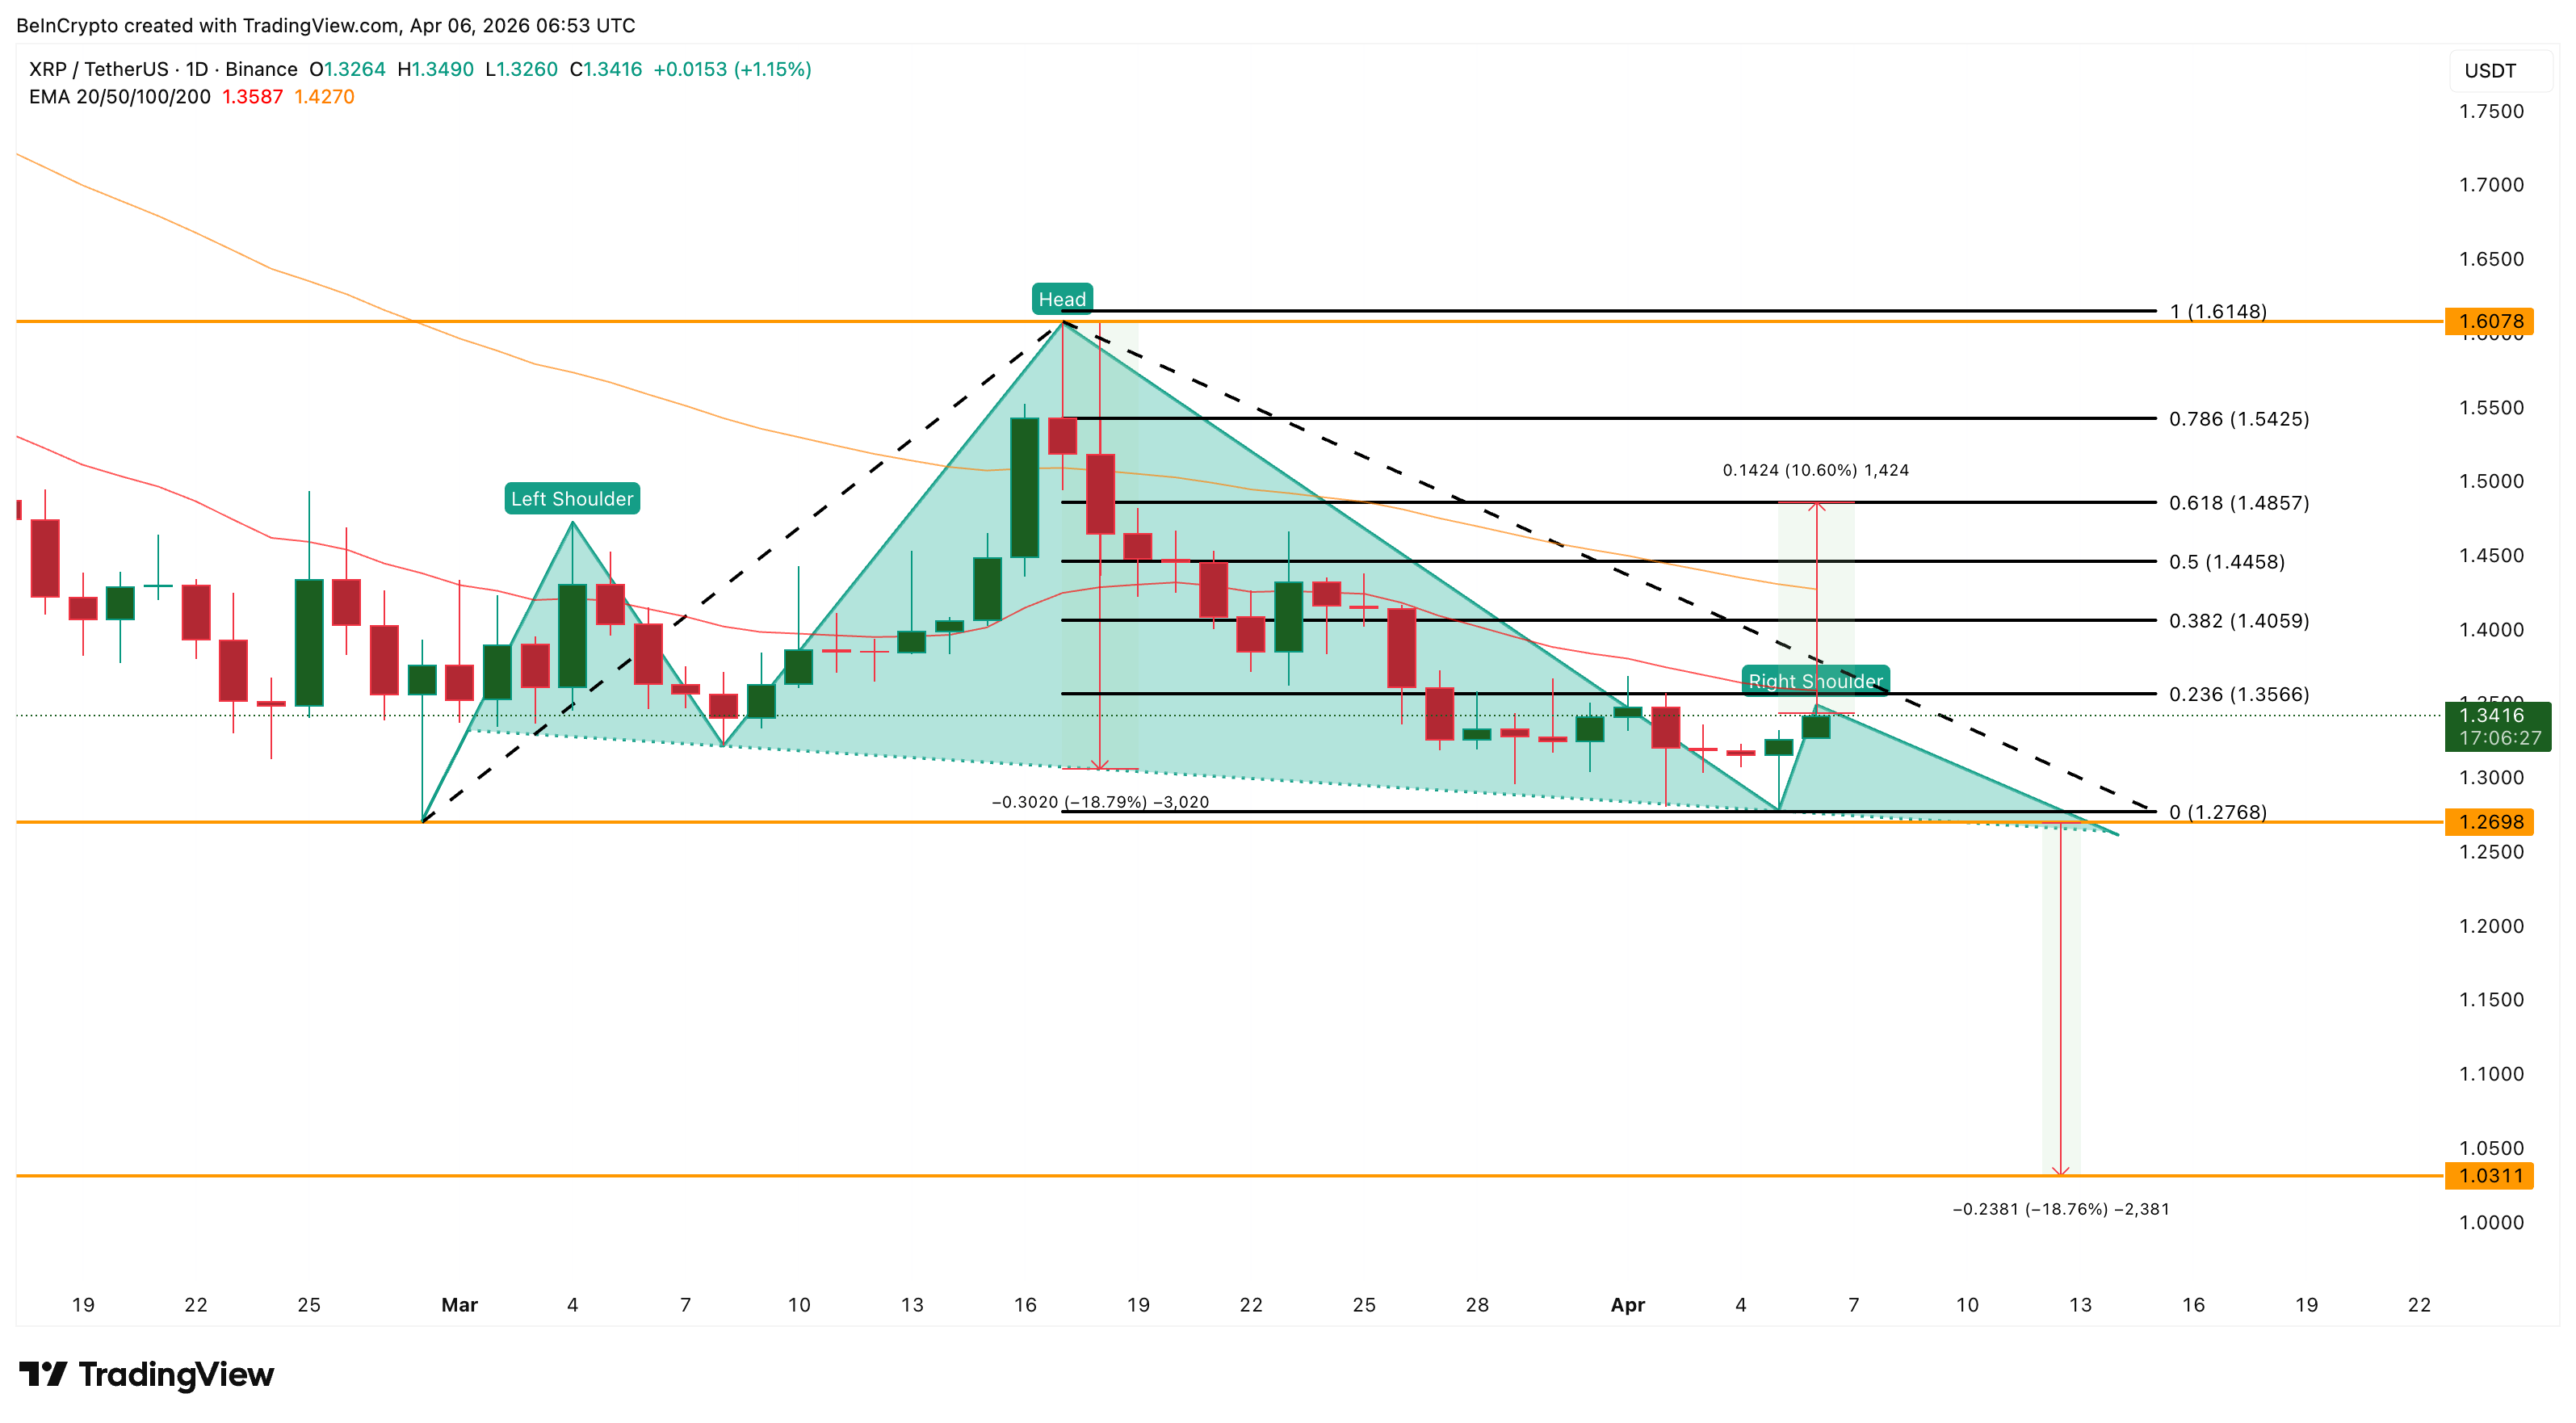
A daily close above $1.48 confirms the rally absorbed the 1.2 billion token wall. That shifts XRP price toward a potential head invalidation. However, a break below $1.26 confirms the pattern and opens a path toward $1.03.
The post XRP Price Rally Needs to Absorb 1.2 Billion Tokens, but Buying Power Is Fading appeared first on BeInCrypto.

Crypto World
Polymarket just revealed a ‘full exchange upgrade’ to take control of its own trading and truth


Polymarket said it expects to roll out a new 1:1 USDC-backed collateral token in the coming weeks as part of a broader overhaul of its trading platform, according to a post on X.
The upgrade, described by the company as a “full exchange upgrade,” includes a rebuilt trading engine, updated smart contracts and a new collateral token called Polymarket USD. The token will replace USDC.e, a bridged version of Circle’s USDC stablecoin that originates on Ethereum (ETH) and is wrapped for use on other chains.
USDC.e acts as a stand-in for native USDC but relies on bridge infrastructure, which can introduce added risk and friction. By moving to its own collateralized token, one-to-one with USDC, Polymarket appears to be aiming for tighter control over settlement and liquidity.
The update follows earlier signals that a broader token strategy is in the works. In October, Polymarket’s chief marketing officer confirmed plans for a POLY token but did not provide a timeline or details on its function.
That token has yet to be formally unveiled. Still, its potential role has drawn attention.
Polymarket has long relied on UMA’s “optimistic oracle” to resolve market outcomes. In that system, users propose results and UMA token holders vote to settle disputes. The design rewards consensus, not accuracy, which critics say can leave outcomes open to influence by large token holders.
Recent controversies, including disputes tied to geopolitically themed markets, have exposed those limits. If POLY is used to internalize resolution, it could mark a shift toward in-house governance of truth.
Read more: Polymarket pulls controversial Iran rescue markets after intense backlash
One hypothetical model would separate trading from governance. Users would continue placing bets in stablecoins like Polymarket USD, while POLY (if launched) would handle dispute resolution and market curation. That split could allow the platform to price honesty independently from trading outcomes.
Polymarket’s push comes as it rebuilds its presence in the U.S. The platform shut down domestic operations in 2022 but registered with the Commodity Futures Trading Commission in July 2025. Since then, it has reported strong growth and a valuation above $20 billion.
The coming token launch and infrastructure changes suggest the company is tightening control over both trading and truth—two pillars that define prediction markets.
Read more: Prediction markets backlash builds possible stormcloud for 2027
Crypto World
BlackRock Is Coming for the Most Profitable ETF Monopoly on Wall Street: Why It Could Win
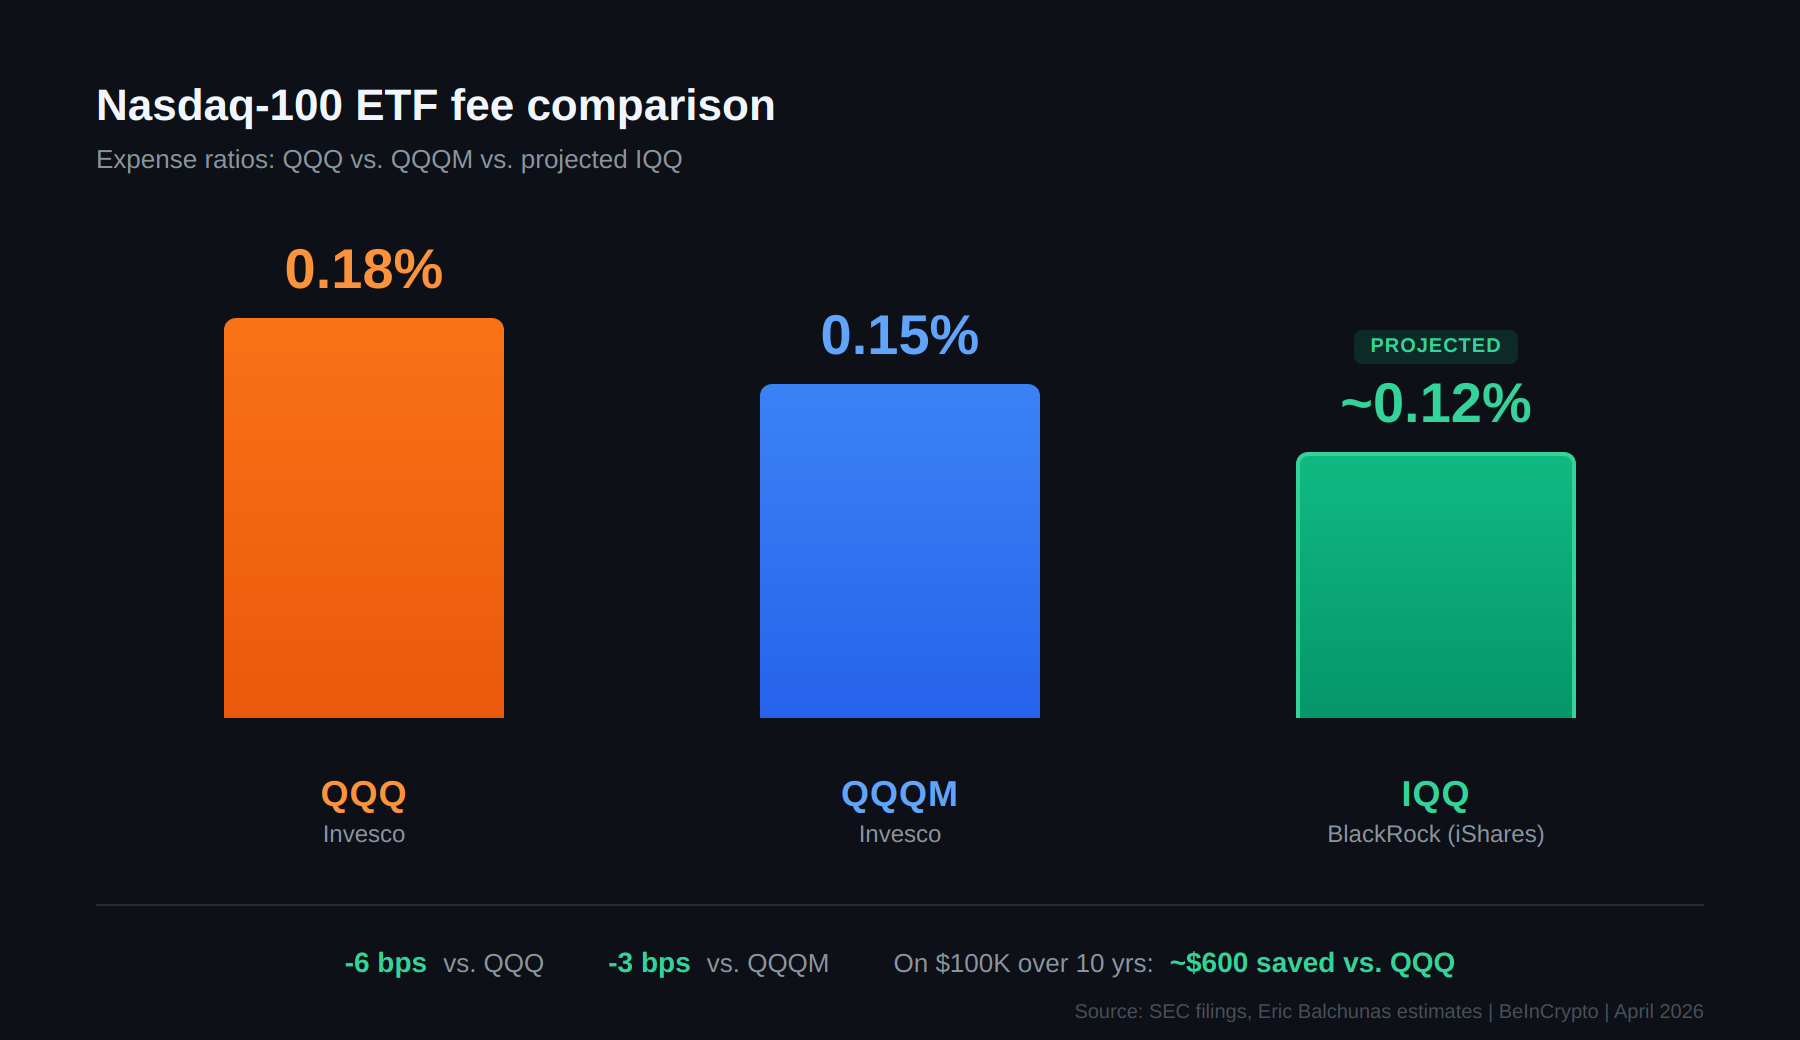
BlackRock filed with the SEC for an iShares Nasdaq-100 ETF under the proposed ticker IQQ, directly challenging Invesco’s decades-long control over the index.
ETF analyst Eric Balchunas estimated the expense ratio could land near 12 basis points. That would undercut both QQQ at 0.18% and QQQM at 0.15%, setting up one of the biggest ETF battles of 2026.
Fee Aggression and Distribution Power
BlackRock has a track record of entering high-profile categories with aggressive pricing. Its iShares Bitcoin Trust (IBIT) followed the same formula.
It pairs competitive fees with institutional-grade distribution to dominate spot Bitcoin ETF inflows within months.
The same playbook applies here. If IQQ prices at 10 to 12 bps, fee-sensitive allocators across 401(k) plans, robo-platforms, and advisor model portfolios would have a clear incentive to shift new capital.
BlackRock manages over $14 trillion in total assets and already runs Nasdaq-100 products in Canada, Europe, and Hong Kong. That gives it operational expertise and global reach that Invesco cannot easily replicate.
Cross-selling adds another layer. Advisors already using iShares for core equity, bond, or factor exposure get a seamless Nasdaq-100 addition inside the same ecosystem. BlackRock’s Aladdin analytics platform further locks in large institutional clients.
Structural Advantages From Day One
IQQ would likely launch as a modern open-ended ETF from inception. QQQ only converted from its original unit-investment-trust structure in December 2025. That legacy format carried minor inefficiencies, such as cash drag on dividend reinvestment.
BlackRock is also a leader in securities lending revenue, which can offset fund costs further. Combined with its tracking expertise from running global Nasdaq-100 versions, IQQ starts with fewer structural compromises than its competitor carried for over two decades.
Market conditions favor the challenge as well. The Nasdaq-100 continues to attract capital as a concentrated growth engine weighted toward mega-cap innovation leaders.
Lower fees through competition could expand the total addressable market, pulling in capital that previously went to broader index products.
Why QQQ Won’t Fall Easily
Despite these advantages, fully displacing QQQ remains unlikely in the near term. QQQ trades tens of millions of shares daily with some of the tightest spreads in the ETF market.
Its options and futures ecosystem is deeply embedded in institutional trading strategies.
Invesco holds roughly $360 to $370 billion in QQQ assets and another $70 billion in QQQM. That combined base of over $430 billion comes with more than 25 years of brand recognition.
Switching friction also protects the incumbent. Taxable account holders face capital gains on any move. Even in retirement accounts, the shift requires active decisions by advisors.
Historical precedent also backs the incumbents. SPDR S&P 500 ETF Trust (SPY) still leads in daily trading volume despite higher fees than iShares’ IVV and Vanguard’s VOO.
Challengers rarely overtake the original on liquidity, even when they win on cost.
A Realistic Outcome
The most probable scenario falls between total disruption and failure. BlackRock could realistically pull $20 to $50 billion within the first two to three years by capturing new inflows and peeling away fee-sensitive long-term holders from QQQM.
Total Nasdaq-100 ETF assets would likely grow faster overall as fee compression draws in fresh capital.
Invesco may respond with further cuts to QQQM or new product variants to defend its position.
The full prospectus, including the confirmed expense ratio, has not yet been published. That single number will set the trajectory for everything that follows.
The post BlackRock Is Coming for the Most Profitable ETF Monopoly on Wall Street: Why It Could Win appeared first on BeInCrypto.


Chaos Labs, one of Aave’s key risk managers, is leaving the DeFi lending giant’s ecosystem, marking the latest in a string of high-profile contributor exits that have reshaped the protocol’s core operating team in recent months.
The departure follows earlier exits from major contributors like ACI (Aave Chan Initiative) and BGD Labs, signaling growing internal friction over the protocol’s direction.
Since 2022, Chaos Labs has overseen risk across Aave’s markets, helping the protocol grow from roughly $5 billion to more than $26 billion in total value locked, while maintaining “zero material bad debt.” But despite that track record, the firm says it can no longer continue under current conditions.
“The engagement no longer reflects how we believe risk should be managed,” said Omer Goldberg, CEO of Chaos Labs, in a post on X, pointing to a “fundamental misalignment” with Aave’s evolving strategy.
A key sticking point is Aave’s V4 upgrade, which introduces a new architecture and significantly expands the scope of risk management. Chaos argues this shift increases both operational complexity and responsibility, without a matching increase in resources or alignment.
“Taking on something new responsibly requires new infrastructure… and the full operational burden of going from zero to one again,” Goldberg wrote.
The firm also flagged economics as unsustainable. Even with a proposed $5 million budget, Chaos said it has been operating at a loss and would continue to do so. “Even with an increase of $1m, we’d still be operating Aave’s risk with negative margins,” Goldberg said.
At the same time, Chaos warned that the loss of experienced contributors is raising operational risk, especially as Aave transitions between versions. “Continuity of brand is not the same thing as continuity of system,” Goldberg wrote.
For Aave, the departure leaves open questions around how risk will be managed through its next phase of growth.
CoinDesk reached out to Aave Labs for comment but did not receive a response by the time of publication.
Read more: Aave governance rift deepens as major governance group exits $26 billion DeFi protocol


Tom Lee says Ethereum has become the No. 2 “wartime” asset, outpacing Bitcoin and stocks as war spending surges and crypto gains appeal as a liquidity and risk trade.
Summary
- Fundstrat’s Tom Lee says Ethereum is now the second best-performing asset since the Middle East conflict began, ahead of Bitcoin and stocks.
- Lee estimates war spending at $30b per month, rising potentially to $100b, while $10 moves in oil add only $4b–$5b in monthly consumer pressure.
- He argues this backdrop makes crypto more attractive as “liquidity and risk assets,” boosting allocation demand for Ethereum and Bitcoin.
Since the latest Middle East conflict escalated, Ethereum has become the second best‑performing major asset globally, trailing only top safe‑haven trades and beating both Bitcoin and equities, according to Fundstrat co‑founder Tom Lee. In a recent post shared by the TomLeeTracker X account, Lee said that while “crypto has been outperforming since the war started,” Ether has led the pack, with Bitcoin ranking third and both digital assets “significantly” outpacing the stock market.
Lee quantified the current war impulse at roughly $30 billion per month in additional government outlays and warned that this figure “could rise to a scale of $100 billion” if the conflict broadens, effectively turning defense budgets into a persistent fiscal shock.
By contrast, he argued that the drag from higher oil is smaller than many investors assume, saying each $10 increase in crude prices adds only about $4 billion to $5 billion per month in pressure on US consumers. That arithmetic, Lee contends, means the net macro effect still leans toward stimulus rather than contraction, even with oil near $100 per barrel.
Fundstrat’s March research, cited by Lee and first reported by DL News and Yahoo Finance, shows Ethereum up roughly 17% on a relative basis versus the S&P 500 since the US‑Israeli conflict with Iran began in late February, beating Bitcoin, gold, real estate, MSCI World Energy and the “Magnificent 7” tech stocks. “As a wartime store of value, crypto looks a lot stronger,” Lee said, adding that “crypto has been outperforming since the war started while gold has actually underperformed,” a view echoed in his call to “ditch gold, buy crypto” during the conflict.
Ethereum’s performance is also underpinned by structural factors, including a market cap near $230 billion, growing institutional positioning and a staking rate approaching 30% of total supply that tightens available float. Lee, a long‑time Ether bull who chairs Bitmine Immersion Technologies, has maintained a long‑term price target of $250,000 for ETH and recently backed that stance with action, as Bitmine disclosed another $133 million purchase that lifted its Ethereum holdings above $9 billion.
Against this backdrop of elevated fiscal spending and volatile energy prices, Lee says the allocation value of crypto as both “liquidity and risk assets” is rising. He argues that defense outlays and still‑accommodative financial conditions create a powerful liquidity environment in which high‑beta assets such as Ethereum and Bitcoin can benefit disproportionately, even as headlines are dominated by war and oil shocks. In earlier research notes covered by outlets like MarketWatch and other financial media, Lee has emphasized that “stock markets bottom in the early stages of military conflict,” suggesting the recent outperformance of Ether and Bitcoin could be an early signal of how capital will be repriced if the conflict and spending surge persist.


Binance faces renewed questions over its $4.3b post-plea cleanup as crime-monitoring staff depart and chief compliance officer Noah Perlman weighs an exit.
Summary
- Total Bitcoin futures open interest rose 8.09% in 24 hours to $50.804b, according to Coinglass.
- Binance leads with $8.887b in open interest, followed by Bybit, Gate, and OKX.
- The build-up in leverage comes as BTC derivatives positioning has repeatedly signaled key turning points in past cycles.
Bitcoin (BTC) futures traders added more than $3.8 billion in new leveraged positions over the past 24 hours, with total BTC contract open interest climbing 8.09% to $50.804 billion, derivatives data provider Coinglass shows. The latest spike pushes notional open interest back toward levels seen ahead of previous breakouts, when Bitcoin derivatives positioning has often front‑run spot price moves, according to prior Coinglass‑based analysis.
Coinglass data indicates that Binance currently accounts for $8.887 billion of total Bitcoin open interest, making it the single largest venue for BTC futures risk. Bybit’s open interest stands at $4.386 billion, just ahead of Gate’s $4.285 billion, while OKX controls $2.982 billion in outstanding contracts, based on the latest exchange breakdown. Earlier crypto.news reporting on Bitcoin derivatives has highlighted how similar 5%–8% one‑day jumps in open interest have preceded both sharp rallies and sudden liquidations, underscoring that the direction of the next move often depends on whether new positions skew long or short.
The fresh build‑up follows a period of “quiet de‑leveraging” in late 2025, when total BTC futures open interest slipped toward the mid‑$50 billion range and fell roughly 2% in a single day, according to Coinglass‑sourced analysis cited by crypto.news. At that time, aggregate open interest of about 647,700 BTC — roughly $59 billion — suggested systematic trimming of risk rather than panic, as positions eased across CME, Binance, and offshore venues.
By contrast, today’s $50.804 billion figure, up 8.09% in 24 hours, points to traders re‑leveraging into the market, similar to moves seen in May 2025 when Bitcoin futures open interest reached an all‑time high of around $75 billion. In that earlier episode, CME led with $17.43 billion in OI, followed by Binance at $12.41 billion, while an 8% daily jump in Binance’s BTCUSDT open interest alone — equivalent to roughly 10,000 BTC — signaled aggressive positioning that later amplified price volatility.
Open interest measures the total value of outstanding futures that have not been closed and is often used as a proxy for how much leverage is in the system. Rising OI alongside rising prices can indicate new money betting on continuation, while rising OI with flat or falling prices can mark the build‑up of crowded shorts or hedges that may be vulnerable to a squeeze. As of now, Coinglass and other derivatives dashboards show BTC futures open interest near the low‑$50 billion area, below the $57 billion–$75 billion peaks seen during late‑2024 and mid‑2025, but well above levels associated with prior cycle lows.

US Senate Banking Committee member Bill Hagerty said Monday that he expects a potential path for a digital asset market structure in the coming weeks after months of delays in Congress.
Speaking at the Digital Assets and Emerging Tech Policy Summit at Vanderbilt University, he said his fellow Republican lawmakers planned to move the bill through the banking panel starting next week.
“We will be in a position, I hope, to bring all of this together very soon,” said Hagerty, referring to work on the bill in the Senate. “On the banking committee side, I think we’re very close, and my expectation is that we get it into committee in this next work period that starts on Monday of next week, so that over the next several weeks we should have this into the banking committee.”
The Tennessee senator added:
“There’re several issues still outstanding, I think none of them are insurmountable and we will get to a point I believe in April that we’ll have it out of the banking committee. There’s still a lot more work to do.”

Originally titled the CLARITY Act when it passed the House of Representatives in July, the bill is considered by many lawmakers and industry leaders to be one of the most significant pieces of crypto legislation, but it has faced delays in Congress amid government shutdowns, industry pushback on stablecoin yield and ethics concerns.
It is expected to provide a comprehensive framework for cryptocurrencies in the US, including largely changing oversight of the market from the Securities and Exchange Commission (SEC) to the Commodity Futures Trading Commission (CFTC).
Because both agencies are involved, the legislation would need approval from the committee responsible for commodities — Senate Agriculture — and that for securities, the banking committee. The agriculture committee advanced its version of the crypto bill in a January markup, but concerns over tokenized equities, ethics, and stablecoin yield have delayed consideration in the banking committee, which needs to hold a markup before a potential floor vote in the Senate.
Related: CFTC chair says agency is ready to oversee entire crypto market
“We’re going into the midterms,” said Hagerty. “I think if we get this done in April, we can clearly get this taken care of before the midterms.”
Limited window for market structure as crypto potentially influences US elections again
Hagerty’s comments echoed those of Coinbase chief legal officer Paul Grewal, who said last week that lawmakers were “close to a deal” on stablecoin yield and other issues in the market structure bill.
According to the Coinbase-backed advocacy group Stand With Crypto, the way lawmakers vote on the legislation could impact their chances for the 2026 midterms, setting the stage for crypto interest groups to potentially influence another major US election.
The crypto-backed political action committee (PAC) Fairshake, which reported spending more than $130 million on media buys in the 2024 elections, said in January that it had a $193-million war chest ahead of the November 2026 midterms.
The group is not alone in its support for crypto on the national stage. The Fellowship PAC, which claimed to have raised “over $100 million” from undisclosed backers aligned with the crypto industry, announced the appointment of Tether executive Jesse Spiro as chair on Wednesday.
Magazine: Clarity Act risks repeat of Europe’s mistakes, crypto lawyer warns

The opportunity isn’t that AI is new. It’s that most businesses still don’t understand it.
Everyone says the same thing: Build an AI agency. The market is wide open. They’re half right. The market is open, but not for the reasons people think.
The real opportunity isn’t that AI is new. It’s the intelligence gap—the distance between what’s possible and what businesses actually understand. And almost nobody is positioning themselves to profit from it.
The Numbers Are Misleading
1.3 billion people use free ChatGPT. Sounds massive until you realize 15-25 million pay for any AI tool, and only 2.5 million actively use AI for coding. These numbers collapse when you compare them to 400+ million businesses worldwide.
Most businesses haven’t touched AI in any meaningful way. They heard the hype. Maybe they tried ChatGPT once to write an email. Then they forgot about it. The technology exists in their world as an abstract concept, not as a solution to their specific problems.
Here’s Where Most People Go Wrong
They chase tech companies. Startup founders. People who already understand AI. Why? Psychologically, it’s comfortable. These prospects get it. Conversations move faster. You don’t have to explain automation basics.
But strategically? It’s the worst market you could choose. You’re competing against thousands of other people with the same idea. Pricing is brutal. Margins evaporate. These companies shop aggressively because they understand your value.
The Smart Move: Chase “Boring” Industries
Dentists. Contractors. Accountants. Real estate brokers. Insurance agents. Dental practices. These industries have three things in common:
- They make real money. An HVAC contractor who closes one extra job monthly from faster lead response doesn’t blink at a $500 retainer. That’s a 10-20x ROI.
- Zero AI competition. Nobody is systematically selling automation to dental offices. The market is massive and completely unsaturated.
- They refer constantly. These industries are tight-knit networks. One successful implementation leads to introductions to three more. Build once, sell six times.
The Framework That Changes Everything
Everyone knows they should chase boring industries. Almost nobody does. The gap between knowing and executing is where the real competitive advantage lives.
Here’s How to Position Correctly
- Identify their specific expensive problem. Not that they need AI. Something concrete. Leads going cold. Proposals taking three hours. Data scattered across systems.
- Quantify the cost. You’re losing 15 leads monthly because nobody answers the phone. That’s $75,000 in lost annual revenue.
- Show them a solution that costs 1% of that impact. A $400/month system that prevents 10% of those losses pays for itself in one week.
Suddenly you’re not expensive. You’re obviously cheap. This is how you close deals.
What This Means for You
Stop chasing prestige prospects. Stop trying to impress people who understand AI. Pick one unsexy industry—dentists, contractors, accountants. Go deep on understanding their specific problems. Learn their language. Build solutions to their expensive bottlenecks.
These business owners are hungry. They see the opportunity but don’t know how to implement it. They have money and they’re willing to spend it. And they’re desperately underserved by specialists who actually understand their business.
That’s the intelligence gap. And if you’re the one filling it, you win.


Polymarket will rebuild its core engine, introduce a hybrid CLOB, and launch Polymarket USD, a USDC‑backed stablecoin on Polygon aimed at cheaper, more institution‑friendly trading.
Summary
- Prediction market Polymarket plans its “largest infrastructure upgrade” in the next 2–3 weeks, overhauling its matching engine and smart contracts.
- The upgrade will introduce a new hybrid CLOB model and a native stablecoin, Polymarket USD, pegged 1:1 to USDC on Polygon.
- The changes aim to cut gas costs, boost efficiency, and make the platform friendlier to institutions via EIP‑1271 and multi‑sig support.
On‑chain prediction market Polymarket will roll out what it calls “the largest infrastructure upgrade since its launch” in the coming 2–3 weeks, rebuilding its core trading engine and debuting a native dollar stablecoin, Polymarket USD, according to plans shared with The Block. The company said the overhaul will “completely reconstruct” its matching engine via a new CTF Exchange V2 smart‑contract system, while introducing a native stablecoin pegged 1:1 to USDC to replace the current bridged USDC.e on Polygon. Existing order books will be cleared during the migration, with Polymarket promising to give users at least one week’s notice before maintenance begins.
At the heart of the upgrade is a redesigned Central Limit Order Book that uses a hybrid model of off‑chain order matching combined with on‑chain, non‑custodial settlement. In technical documentation for its CTF Exchange, Polymarket describes the architecture as a “hybrid‑decentralized model” where an operator handles off‑chain matching while settlement remains on‑chain, a setup it says optimizes “performance and security” for high‑volume event markets. The Block reports that CTF Exchange V2 will introduce new matching logic and order‑data structures intended to improve matching efficiency and reduce gas costs for traders.
Polymarket has grown into one of the largest fully on‑chain prediction venues, recently drawing hundreds of millions of dollars in liquidity and a $600 million strategic investment from Intercontinental Exchange (ICE) as part of a broader bet on decentralized betting markets. ICE said its combined $1.6 billion of direct and secondary investment is not expected to be material to its financial results but positions the exchange operator as a key backer in what it calls a “David and Goliath battle” to bring prediction markets into the financial mainstream.
On the asset side, Polymarket USD formalizes a shift already underway in partnership with Circle to move from bridged USDC.e to native USDC on Polygon for all trading, order placement, and settlement. Circle has said native USDC, redeemable 1:1 for US dollars through its regulated entities, offers a “capital‑efficient” and more secure alternative to bridged tokens by eliminating cross‑chain bridge risk and tying collateral directly to its reserves. In line with that, Polymarket USD will be pegged 1:1 to USDC and used as the core collateral across the platform, with deposits from networks such as Ethereum, Solana, Arbitrum, and Base automatically converted into the new stablecoin on Polygon.
Polymarket will also add support for the EIP‑1271 (ERC‑1271) standard, allowing smart‑contract wallets such as Safe to validate signatures and trade directly, a move aimed at “expanding use cases for institutions and advanced users.” EIP‑1271 lets contracts define an isValidSignature method with arbitrary logic, making it easier for DAOs, funds, and multi‑sig setups to participate in non‑custodial markets without relying on externally owned accounts. The upgrade comes as competition in prediction markets intensifies, with Polymarket using performance, native dollar liquidity, and institutional‑grade wallet support to defend its lead in what it brands “The World’s Largest Prediction Market.”
Bitcoin found familiar resistance as it crossed the $70,000 mark to hit new April highs, with analysis blaming “profit-taking pressure.”
Bitcoin (BTC) coiled below $70,000 at Monday’s Wall Street open as analysis blamed profit taking for price inertia.
Key points:
-
Bitcoin and stocks wobble as the US trading session begins amid nerves over the US-Iran war outcome.
-
Profit taking activity is keeping BTC price action away from a $70,000 reclaim, says research.
-
A Trader says $71,000 will act as fuel for a surge $10,000 higher.
BTC price meets “profit-taking pressure”
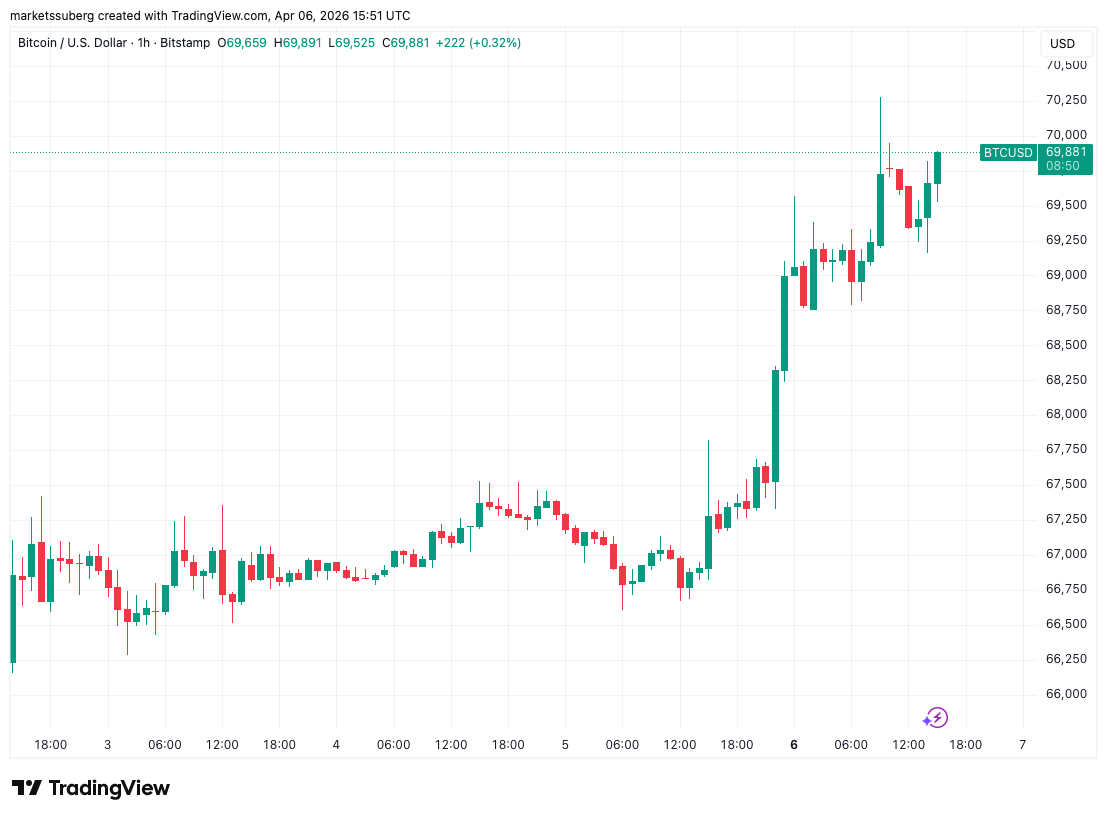
Data from TradingView showed BTC price action consolidating after hitting new April highs of $70,275 on Bitstamp.

Market nerves over the US-Iran war resulted in uncertain trading, with US stocks treading water at the open.
Speaking to the media at a military event, US President Donald Trump reiterated earlier comments that Iran would “have no bridges” and “no power plants” unless a deal was reached.
“I won’t go further because there are other things that are worse than those two,” he told reporters.
Trump previously stated that the deadline for a deal was 8pm Eastern time on Tuesday.
With price pinned below the $70,000 mark, onchain analytics platform Glassnode pointed to internal market forces as the reason for the lack of continuation higher.
“As price probed the $70K region, Realized Profit/hour spiked above $20M, signalling a local exhaustion,” it noted in a post on X.
“A pattern consistent since February 2026: Every approach to the $70k–$80K band meets thin liquidity and profit-taking pressure, capping the bounce.”

Pseudonymous trader LP added that Mondays and Thursdays had seen the upper and lower end of the week’s trading range throughout 2026.
“Price pushed higher into Monday, increasing the probability of this pivot forming a weekly high. If the correlation continues to play out, this would suggest Thursday forms the low of the week,” they told X followers.
“Watch price action closely today and tomorrow, it will confirm whether this intra-week pivot resolved as a high or a low.”

Bitcoin trader eyes $71,000 springboard
Continuing, crypto trader Michaël Van de Poppe said the line in sand for bears lay slightly higher than Monday’s current peak.
Related: First real bull signal since 2025? Five things to know in Bitcoin this week
“Pretty strong momentum on the markets of Bitcoin,” he wrote on X about the initial move to $70,000.
“Volatility picking up, and I think it’s fireworks during this week as we might be getting to the end stage of the entire situation in the Strait of Hormuz. If Bitcoin breaks $71K, then markets are in for a test at $80K.”

Van de Poppe further cautioned on following blanket market consensus over new lows coming next.
“Given that all the markets are so oversold at this point, all on-chain indicators are looking overextended and are at similar levels to the bottom areas in 2018, 2020 and 2022, I wouldn’t be surprised that we’re getting a relief run that’s going to turn the sentiment quickly,” he concluded.
This article is produced in accordance with Cointelegraph’s Editorial Policy and is intended for informational purposes only. It does not constitute investment advice or recommendations. All investments and trades carry risk; readers are encouraged to conduct independent research before making any decisions. Cointelegraph makes no guarantees regarding the accuracy or completeness of the information presented, including forward-looking statements, and will not be liable for any loss or damage arising from reliance on this content.
BTC USD price is moving again, at $69,000, it is up by 4% in just a day, bouncing hard off the long-term trendline that has defined every major cycle low since 2017. Before the movement, Strategy’s latest filing reveals that the firm was loading up just before this leg higher, spending $329.9 million in a single week at prices well below current levels.
Michael Saylor’s Strategy added 4,871 BTC to its treasury between late March and early April at an average cost of $67,718 per coin, bringing total holdings to 766,970 BTC acquired for $58.02 billion. The purchase was funded primarily through $227.3 million in STRC preferred stock sales, supplemented by $72 million in common stock proceeds.
At current prices, the full position sits roughly 8% underwater, about $5 billion in unrealized losses, yet the buying continued without hesitation. This conviction, right at a trendline support test, tends to matter.
The broader context makes this accumulation harder to dismiss. Strategy and spot ETFs are now the two dominant institutional absorption channels in a thinning market, with Strategy alone accumulating roughly 44,000 BTC over 30 days through late March.
Discover: The best crypto to diversify your portfolio with
Can BTC USD Price Break $72,000 This Week?
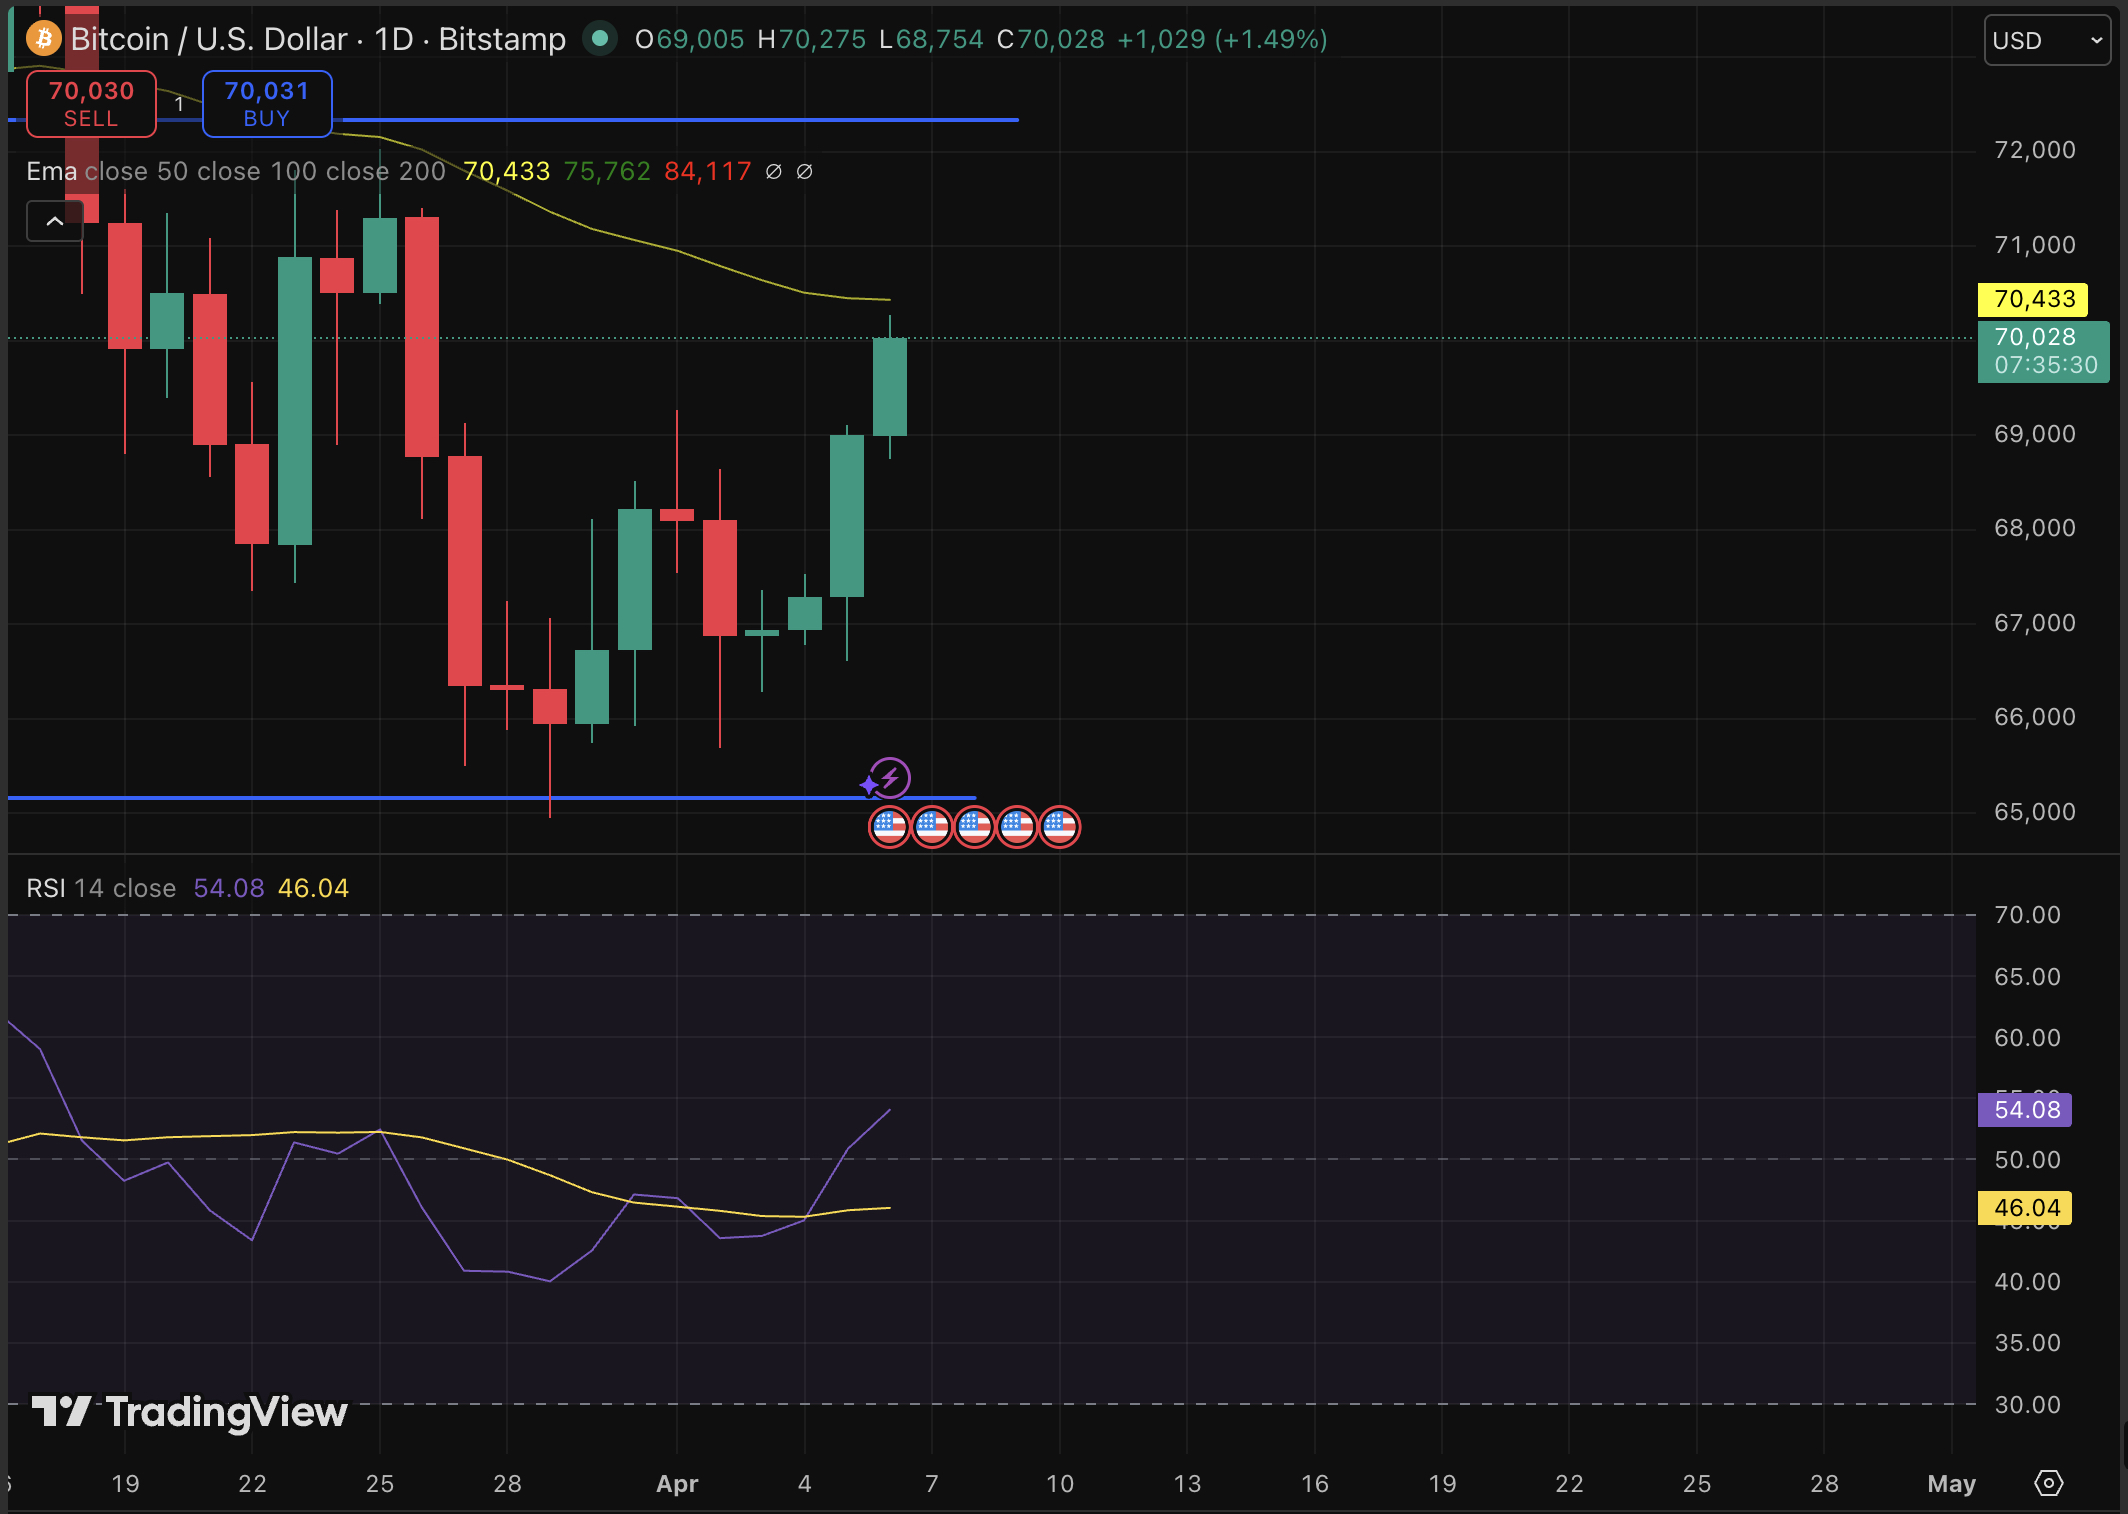
BTC USD is consolidating just below the $72,000 price resistance zone after reclaiming the 100-hour simple moving average. Volume confirmation arrived Monday evening and has held, which is a structurally positive development.
Daily RSI reads 53, MACD(12,26) at 499.5, and ADX(14) at 37.847, all of which point to sustained bullish momentum, though STOCH indicators are flashing overbought.
A daily close above $69,500 opens the path to $72,000 and potentially the $74,000 area that briefly traded in mid-March. Catalyst would be a softer-than-expected US jobs or inflation print, shifting Fed rate expectations.
Or a consolidation between $67,500 and $69,500 for several sessions, as the market digests the bounce, can also happen. Analysts forecast $67,000 by quarter-end, suggesting a range-bound grind before the next directional move.

However, a close below $66,000 and the long-term trendline would invalidate the current setup and expose the $64,000 range.
TradingView analysts noted this week: “A lot of people are turning very bearish on Bitcoin, but I don’t think it’s time to be bearish; the bearish trend is not confirmed.”
Price movement from here will largely depend on macro data and whether ETF inflows accelerate alongside the Strategy’s continued accumulation.
Discover: The best pre-launch token sales
Bitcoin Hyper Targets Early-Mover Upside While BTC Rally
Bitcoin rebounding toward $70,000 is undeniably bullish, but at a $1.4 trillion market cap, the asymmetric upside that characterized 2020 and 2021 is simply getting slimmer. The ship has sailed somewhere under $50,000.
Traders looking for leverage on a Bitcoin bull cycle without the ceiling constraints are increasingly scanning the infrastructure layer, specifically projects that extend Bitcoin’s utility rather than just price-follow it.
Bitcoin Hyper ($HYPER) is one presale generating real traction in that context. Positioned as the first-ever Bitcoin Layer 2 with Solana Virtual Machine (SVM) integration, it targets Bitcoin’s three structural weaknesses directly: slow transactions, high fees, and absent programmability.
The SVM integration is the differentiator; it has a faster performance than Solana itself through extremely low-latency Layer 2 processing, combined with a Decentralized Canonical Bridge for native BTC transfers.
The presale has raised more than $32 million at a current token price of just low $0.013, with staking available at a high 36% APY for early participants.
Research the Bitcoin Hyper presale thoroughly and join the army.
The post BTC USD Price Finally Moving Up: Saylor Strategy Bought More Before The Rally appeared first on Cryptonews.

What we know about the F-15 pilot who survived two days on Iranian mountain | US News

Is Spectrum Down Now? Spectrum Internet Faces Scattered Outages as Users Report Wi-Fi and Broadband Issues

Polymarket just revealed a ‘full exchange upgrade’ to take control of its own trading and truth


-

 NewsBeat4 days ago
Steven Gerrard disagrees with Gary Neville over ‘shock’ Chelsea and Arsenal claim | Football
-

 Business4 days ago
No Jackpot Winner and $194 Million Prize Rolls Over
-

 Fashion3 days ago
Weekend Open Thread: Spanx – Corporette.com
-

 Crypto World5 days ago
Gold Price Prediction: Worst Month in 17 Years fo Save Haven Rock
-

 Business19 hours ago
Three Gulf funds agree to back Paramount’s $81 billion takeover of Warner, WSJ reports
-
Crypto World6 days ago
Dems press CFTC, ethics board on prediction-market insider trades
-

 Sports2 days ago
India men’s 4x400m and mixed 4x100m relay teams register big progress | Other Sports News
-

 Business5 days ago
Login and Checkout Issues Spark Merchant Frustration
-

 Tech6 days ago
EE TV is using AI to help you find something to watch
-

 Sports6 days ago
Tallest college basketball player ever, standing at 7-foot-9, entering transfer portal
-

 Politics7 days ago
Should Trump Be Scared Strait?
-
Tech7 days ago
Daily Deal: StackSkills Premium Annual Pass
-

 Tech7 days ago
Flipsnack and the shift toward motion-first business content with living visuals
-

 Sports7 days ago
Women’s hockey camp eyes fitness boost, tactics ahead of WC 2026 campaign | Other Sports News
-

 Crypto World7 days ago
U.S. rule change may open trillions in 401(k) funds to crypto
-

 Tech6 days ago
How to back up your iPhone & iPad to your Mac before something goes wrong
-

 NewsBeat7 days ago
Newscast – Scott Mills Sacked By BBC
-

 Politics7 days ago
Usha Vance: Disney Hats Over MAGA Caps?
-
Crypto World7 days ago
Valinor raises $25m to put private credit on-chain
-

 Business7 days ago
Functional benefits brewing in coffee innovation
You must be logged in to post a comment Login