
Crypto World
Cardano price forecast: ADA eyes $0.30 as bulls tap Bitcoin momentum

- Cardano traded around $0.24 as bulls looked to bounce higher.
- Bitcoin’s uptick could boost ADA price to above $0.30.
- ADA trends with bearish bias and entrenched bears could plunge prices to new lows.
Cardano (ADA) price is up nearly 3% on Tuesday morning, trading around $0.24 as bulls struggle to mirror broader market gains.
While Bitcoin and Ethereum have climbed above $74,700 and $2,300 respectively, to hit multi-week highs, ADA is hovering at a key supply zone following a recent sharp pullback.
However, could ADA shed the bearish bias and ride a broader upside momentum? Or are bears so entrenched to leave Cardano facing deeper losses?
Cardano price today
ADA has gained about 3% over the past 24 hours, reaching $0.24 amid selective altcoin strength.
In comparison, Bitcoin surged over 5% to $74,552, Ethereum hovered near $2,194 after a minor dip, and Solana traded around $80 with limited upside.
Cardano derivatives data points to a slight bullish shift, with funding rates flipping positive in recent sessions and open interest climbing to roughly $436 million from $405 million on April 6.
This uptick in open interest reflects growing trader interest, though volumes remain cautious below recent peaks.
Bulls are defending the $0.24 zone, but failure here could trigger profit-taking aligned with broader market volatility.
ADA technical outlook
Cardano’s price action shows resilience at current levels, testing the upper trendline of a descending channel on the daily chart.
The token sits near its 50-day exponential moving average around $0.26, a pivotal level for any sustained recovery.
Holding above $0.24 keeps short-term hopes alive, bolstered by improving derivatives sentiment.
Yet, the broader technical picture leans bearish on higher timeframes, with RSI lingering below 50 and signaling potential for deeper pullbacks.

Cardano price forecast: Can ADA jump to $0.30?
Cardano may be struggling, but ADA has continued to attract dip-buying.
An example is wallets with at least 10 million ADA tokens, which have recently jumped to a 4-month high.
Santiment pointed to a 5.2% rise in 9 weeks, significantly up since prices bottomed on February 5, 2026.
Whale activity suggests a push to $0.30 remains plausible.
If ADA taps Bitcoin’s momentum, targeting the 100-day EMA as key overhead resistance.
Bulls have retested the level on four occasions since early February, with price consolidating at current levels over the past week.
Breaking the 50-day EMA at $0.26 first would validate the above outlook, potentially drawing in fresh longs amid rising open interest.
At the moment, positive funding rates further support the scenario, with further strength likely if shorts continue to pay longs.
On the flip side, entrenched bears could dominate if $0.24 gives way, eyeing notable support near $0.22. This will align the altcoin with channel downside projections.


TLDR
- Solana recorded $1.1 trillion in total economic activity during the first quarter of 2026.
- Artemis data confirmed that this marks the first time Solana crossed the $1 trillion level in a single quarter.
- The network posted a 6,558.6% increase in economic activity compared to the previous quarter.
- On-chain usage accelerated sharply in late 2025 and continued rising into early 2026.
- The quarterly total reflects the highest value of transactions and economic interactions ever recorded on Solana.
Solana recorded $1.1 trillion in total economic activity during the first quarter of 2026, according to Artemis data released Tuesday, April 14. The figure marks the first time the blockchain has crossed the $1 trillion threshold within a single quarter. The surge follows a sharp rebound in on-chain usage after months of market volatility.
Solana Posts $1.1 Trillion in Quarterly Economic Activity
Artemis reported that Solana processed $1.1 trillion in total economic activity in Q1 2026. The data shows that this is the highest quarterly figure ever recorded on the network. As a result, Solana achieved a new all-time high in total value of transactions and economic interactions.
The charts from Artemis highlighted a 6,558.6% increase in economic activity compared to the previous quarter. This rapid growth pushed Solana beyond the $1 trillion milestone for the first time. Artemis stated that the spike reflects a sharp rise in on-chain usage across the network.
On-Chain Usage Surges as Network Rebounds
The Artemis charts showed that Solana’s on-chain usage accelerated sharply in late 2025. Activity continued to expand into early 2026 as transaction volumes increased. As a result, the network regained strong momentum after extended volatility through 2024 and mid-2025.
Data indicate that higher transaction throughput supported the growth in total economic activity. Increased participation in decentralized finance protocols also contributed to the surge. In parallel, staking activity on Solana expanded during the same period.
The quarterly total includes all recorded transactions and economic interactions on the blockchain. This covers transfers, decentralized finance operations, and other on-chain activities. Consequently, the combined value reached its highest level in the network’s history.
Artemis confirmed the figures on April 14 through its published dataset. The report identified Q1 2026 as the strongest quarter by economic output for Solana. The milestone comes as broader crypto markets regain upward momentum.
Market data shows that Solana experienced fluctuating activity throughout 2024 and mid-2025. However, usage levels began rising again in late 2025 and continued into 2026. Therefore, the latest quarterly figure reflects a sustained rebound in network engagement.
The reported 6,558.6% increase represents quarter-over-quarter growth in economic activity. This growth rate ranks among the highest recorded by the network to date. As such, the data places Q1 2026 at a new peak for Solana.
The $1.1 trillion total captures the aggregate value of all economic transactions processed during the quarter. Artemis compiled the data using on-chain metrics and transaction tracking tools. The figures became publicly available on Tuesday, April 14, 2026.

Crypto World
CoinStats Launches AI Agent Claiming to Outperform ChatGPT, Gemini and Claude in Crypto Research Benchmark

Crypto tracker app CoinStats has launched a new AI-powered research agent, claiming it outperforms leading models from Google, OpenAI, and Anthropic in crypto-focused deep research tasks.
The announcement comes alongside the public beta release of the CoinStats AI Agent, a tool designed specifically for cryptocurrency traders and investors.
Benchmark Results
According to CoinStats, its AI Agent achieved a score of 79 out of 100 in an internal benchmark evaluating crypto research quality. In comparison, Gemini Deep Research scored 67, ChatGPT 61, and Claude 58.
Speed was another key differentiator. The CoinStats AI Agent reportedly delivered results in an average of four minutes, while competing tools took significantly longer, with some responses exceeding 50 minutes.
The company noted that the benchmark methodology is open source and available on GitHub, allowing independent verification of the results.

Why a Crypto-Native AI?
CoinStats attributes its performance advantage to its access to specialized data sources.
Unlike general-purpose AI models, which primarily rely on web data, the CoinStats AI Agent integrates multiple streams of crypto-native information, including on-chain data, exchange metrics, derivatives data, and real-time social sentiment.
The system uses a multi-agent architecture, where different agents simultaneously analyze various data sources such as news, blockchain activity, and social media trends. These inputs are then combined into a unified research output.
Key Features
The CoinStats AI Agent is positioned as a research copilot rather than a simple chatbot, offering several advanced capabilities:
- Market Research: Explains price movements by combining news, sentiment, and on-chain activity
- Onchain Tracking: Analyzes wallets, token flows, and blockchain activity across 120+ networks, powered in part by the CoinStats Crypto API
- Social Sentiment Analysis: Tracks narratives and influencer activity in real time
- Portfolio Analysis: Provides insights based on a user’s actual holdings
- Backtesting: Simulates trading strategies using historical data
- Code Execution: Performs advanced calculations and custom analysis on demand
The platform also generates visual outputs such as charts and tables, enhancing usability for traders.
Multiple Modes
The AI Agent operates across different modes, including:
- Deep Research: Multi-step analysis across multiple data sources
- Backtesting: Historical simulation of strategies
- Fast Mode: Quick answers for simple queries
- Private Mode: Encrypted processing via decentralized infrastructure, powered by Venice AI
Availability
CoinStats AI Agent is currently available in public beta for Degen and Premium users on web, iOS, and Android.
CoinStats, a crypto portfolio tracking platform founded by Narek Gevorgyan, is positioning this launch as part of its broader move into AI-powered analytics.
A Growing Trend in Vertical AI
While the results highlight strong performance in crypto-specific tasks, they are based on internal testing and may vary depending on use cases.
The launch reflects a broader trend in the AI industry, where specialized, domain-focused tools are emerging to compete with general-purpose models in niche areas such as finance and cryptocurrency research.


- Ethereum briefly rallied to $2,400 on Trump-Iran ceasefire optimism and easing oil fears.
- Sentiment lifted risk assets, with BTC leading the charge with prices rising above $75k.
- ETH price outlook includes an ascending channel and bullish RSI.
Ethereum price extended gains on Tuesday, briefly touching highs above $2,400 as Bitcoin and broader cryptocurrency markets surged on optimism surrounding potential diplomatic progress in US-Iran negotiations.
As President Donald Trump’s comments on advancing talks following a recent two-week ceasefire fueled investor sentiment, risk assets, including equities, climbed while oil prices retreated.
This confluence of geopolitical hope and easing inflation concerns marked a pivotal moment for digital assets, with Bitcoin leading the charge past key psychological thresholds.
Ethereum hits highs of $2,360 as Bitcoin surges above $75,000
ETH extended its impressive rally on Tuesday, pushing decisively above $2,300 after breaking from lows of $2,270 overnight from Monday.
This marked the cryptocurrency’s highest level in over two months.
Santiment notes that open interest in BTC and ETH has jumped 59% and 45%, respectively, in seven weeks.
🥳 Bitcoin ($76,070) & Ethereum ($2,395) have both hit their highest market values since the beginning of February. This rebound is coming with increased optimism, as margin & leveraged positions are being created rapidly.
📈 $BTC: +59% Open Interest in 7 weeks
📈 $ETH: +45%… pic.twitter.com/VgevsGwMz1— Santiment (@santimentfeed) April 14, 2026
Bitcoin rose from around $74,000 to above $76,000 before paring gains to around $75,500 as of writing. Goldman Sachs filing for a Bitcoin ETF boosted sentiment.
The uptick in Bitcoin and Ethereum also closely tracked gains across US stock benchmarks, which rallied sharply after cooler-than-expected US producer price data eased inflation concerns. The report boosted risk appetite, drawing capital into high-beta assets such as cryptocurrencies.
Wall Street’s positive momentum provided an additional tailwind, with institutional investors appearing to rotate into Bitcoin amid perceptions of it as a hedge against fiat uncertainty.
On the geopolitical front, President Donald Trump’s remarks about pursuing further discussions with Iran—potentially building on last week’s fragile two-week ceasefire—served as an immediate catalyst.
Markets have interpreted this as a step toward a longer-term truce, reducing fears of escalation in the Middle East. As a result, oil prices have fallen below $100 per barrel, easing pressure on global energy costs and supporting gains in both equities and cryptocurrencies.
However, caution persists around the Strait of Hormuz, a critical chokepoint for global oil shipments.
Investors are awaiting clearer signals on operational stability in the region, as any disruption could quickly reverse the current risk-on sentiment.
For now, Bitcoin’s momentum highlights its sensitivity to interconnected global developments, with trading volumes rising as bulls test fresh highs.
Ethereum price forecast
Ethereum price has formed an ascending channel since early April, with prices respecting the 50-day exponential moving average (EMA) as dynamic support near $2,176.
This level, coupled with the rising trendline of a potential triangle pattern, forms a robust foundation that bulls are defending vigorously. Buyers are now looking to turn the 100-day EMA ($2,356) into major support.

Among the key bullish indicators is the Relative Strength Index (RSI) on the daily timeframe, which has climbed above 62. The RSI has yet to enter the overbought territory, signaling strong momentum without immediate exhaustion.
Potential resistance looms at $2,800 and $3,370, which have acted as prior support and highs from January 2026.
Conversely, failure here might trigger profit-taking, testing support at $2,000 and likely lower at $1,800.
Crypto World
David Einhorn signals caution as his hedge fund Greenlight prioritizes capital protection

David Einhorn, President at Greenlight Capital, speaking at the 14th CNBC Delivering Alpha Investor Summit in New York City on Nov. 13, 2024.
Adam Jeffery | CNBC
Hedge fund manager David Einhorn said he is focusing on capital protection as markets rally on geopolitical optimism, warning that investors may be underestimating potential downside risks.
“It probably won’t surprise anyone that we are again putting capital preservation at the top of our priorities,” Einhorn said in his latest investor letter dated Monday and obtained by CNBC. “With so little downside priced in, we are willing to risk missing out on a possible recovery to position ourselves to play more offense, should one of the downside scenarios materialize.”
U.S. stocks have rebounded violently with the S&P 500 entirely erasing the losses suffered since the Iran war began. The market is building on the recent gains this week even after U.S.-Iran negotiations over the weekend broke down, as investors remained optimistic that a deal between the two countries was still possible.

S&P 500 year to date
Greenlight’s funds returned 6.5% in the first quarter, outperforming the S&P 500’s 4.4% decline. Still, Einhorn said the firm has kept relatively low gross and net exposure, reflecting caution about valuations and the broader macro backdrop.
“Even the most cautious are investing with a Sammy Hagar inspired mentality: one foot on the brake and one on the gas,” he said in the letter. “Nobody wants to miss the V- or even the checkmark-shaped recovery.”
As the conflict began, Greenlight was already running with relatively low exposure, citing what it viewed as stretched valuations. Einhorn said Greenlight has made few adjustments, trading around index hedges and adding a long position in October oil futures. That bet has risen only modestly, as markets largely expect any supply disruption to be temporary.
Performance in the quarter was driven by gains in gold, Acadia Healthcare, DHT Holdings and Core Natural Resources, according to the letter. Greenlight also initiated a medium-sized position in Versant Media Group and smaller stakes in Crocs and SLM Corp.
Disclosure: Versant Media is the parent company of CNBC.


Bitcoin mining operations in the US are absorbing a 47 percent increase in deployment costs after Section 232 tariffs on steel, aluminum, and copper stacked on top of an existing 21.6 percent duty on ASIC miners from Southeast Asia, pushing competitive advantage toward mining operations in Kazakhstan, Russia, and other tariff-exempt jurisdictions.
Summary
- A flagship Antminer S21 XP now carries roughly $1,600 in Section 232 metals duties on top of the existing 21.6 percent ASIC reciprocal tariff, bringing the combined tariff burden to approximately 47 percent before any other import fees apply.
- Mining containers, the steel structures with copper wiring and aluminum ventilation that house industrial deployments, have jumped $10,000 to $25,000 in cost per unit, compounding the hardware tariff impact for any operation scaling new capacity.
- All-in production costs for publicly listed US miners already averaged approximately $74,600 per bitcoin in late March before the Section 232 tariffs took effect on April 6, meaning the tariff-driven increase could push breakeven costs closer to $82,000 to $85,000.
The Section 232 proclamation signed April 2 raised tariffs to 50 percent on products made entirely from steel, aluminum, and copper, and 25 percent on derivative products containing substantial metal content. Mining rigs qualify as derivative products, adding 25 percent to the full customs value of each unit on top of the pre-existing 21.6 percent Southeast Asia ASIC tariff. The tariffs took effect April 6, meaning every hardware order placed after that date is subject to the combined burden. Large miners who stocked inventory ahead of the tariffs, including Marathon Digital, Riot Platforms, and CleanSpark, are partially insulated for now, but each future hardware upgrade cycle becomes relatively more expensive compared to offshore competitors.
The United States controls roughly 38 percent of global bitcoin hash rate. That position was built over four years after China banned mining in 2021, and it may now begin eroding under tariff pressure rather than a direct ban. A US miner replacing hardware with S21 XPs pays approximately 47 percent more than a competitor in Kazakhstan or Russia buying the same machines with zero tariff exposure. Hashprice, the daily revenue per terahash, is already near historical lows. Miners cannot absorb a 47 percent hardware cost increase without either raising capital, cutting expansion, or waiting for bitcoin to move higher.
What Miners Are Doing in Response
Large publicly listed miners with pre-tariff inventory are continuing operations without immediate impact. Bitmain opened its first US assembly line in January 2026 and MicroBT operates a plant since 2023, but these represent a fraction of total production. US-assembled rigs still carry tariffs on aluminum and copper components. Senators Cassidy and Lummis introduced the Mined in America Act in late March, which would create federal subsidies and tax incentives for domestic miners, but no vote date has been set.
What the Tariff Impact Means for Network Security
If hardware cost differentials persist across two to three upgrade cycles, meaningful hash rate could shift away from the US toward tariff-free jurisdictions. That would reduce the US share of bitcoin’s security model and concentrate hash rate in countries with weaker property rights and less regulatory transparency. The network crossed 1,000 exahashes per second in early 2026 with the US as the anchor, and sustaining that anchor becomes harder with each tariff cycle that makes domestic expansion more expensive than offshore alternatives.
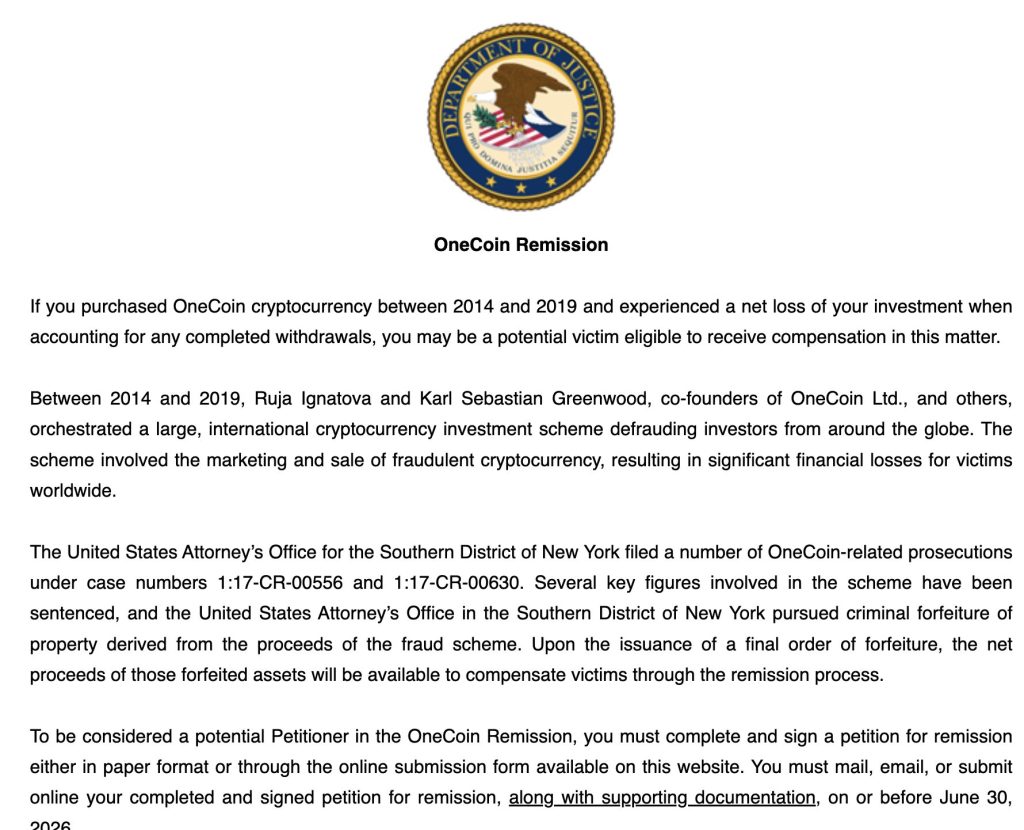
The Department of Justice has opened a formal compensation claims portal for victims of OneCoin, the $4 billion Ponzi scheme that defrauded approximately 3.5 million investors across 175 countries between 2014 and 2019.
More than $40 million in restitution, sourced from asset forfeiture proceedings that swept up proceeds tied to co-conspirators, including Konstantin Ignatov, is now available for verified claimants. The portal is live. The deadline is June 30, 2026.
The question is how many of the scheme’s millions of victims will actually be able to access it, and what fraction of their losses they’ll recover when they do.
- Portal Launch: The DOJ has officially opened a compensation claims process for OneCoin fraud victims, marking the first formal restitution distribution in the case.
- Eligible Victims: Investors defrauded by the OneCoin scheme – including U.S. residents from the Southern District of New York – may file claims to recover verified losses.
- Claims Deadline: Eligible victims must submit claims by June 30, 2026; late submissions are not expected to be considered.
- Asset Source: The $40 million-plus fund derives from criminal asset forfeiture proceedings against proceeds seized from key OneCoin conspirators, including those linked to Konstantin Ignatov.
- Process Overview: Claimants must document their losses and submit through the DOJ portal; restitution amounts will be prorated against total verified claims.
- What to Watch: Ruja Ignatova remains a fugitive on the FBI’s Ten Most Wanted List – billions in unrecovered assets mean the $40 million pool represents roughly 1% of total investor losses.
Discover: The best crypto to diversify your portfolio with
What the DOJ’s OneCoin Claims Portal Actually Does – and What $40 Million Against $4 Billion Means
The DOJ has made available more than $40 million in restitution derived from criminal asset forfeiture, assets seized from conspirators prosecuted in the case, including proceeds linked to Konstantin Ignatov, Ruja Ignatova’s brother, who was arrested at Los Angeles International Airport in 2019 and subsequently pleaded guilty to wire fraud and money laundering charges.
The mechanics work like this: victims file documented claims through the portal, the DOJ verifies losses against available case records, and recovered funds are distributed on a prorated basis relative to total verified claims.

If aggregate verified losses across all claimants exceed $40 million, which is essentially guaranteed given the scheme’s $4 billion total damage, every claimant receives a fraction of their documented loss, not a full recovery.
That’s not a reimbursement. That’s a partial distribution from a forfeiture estate. The DOJ’s asset forfeiture process in crypto fraud cases has grown more sophisticated, but it remains structurally constrained by what investigators can seize versus what was originally stolen, a gap that exploit and fraud cases across the crypto industry consistently expose as the core problem with post-hoc recovery.
Co-founder Karl Sebastian Greenwood was sentenced to 20 years in prison for his role in orchestrating the scheme. The primary architect, Ruja Ignatova, “the Cryptoqueen” – was added to the FBI’s Ten Most Wanted List in June 2022 and remains at large.
The bulk of unrecovered OneCoin proceeds almost certainly moved through jurisdictions outside U.S. enforcement reach. What the DOJ has recovered and forfeited is real. What it represents against total losses is approximately one cent per dollar stolen.
Discover: The best pre-launch token sales
The post DOJ Opens $4 Billion OneCoin Claims Portal for Scammed Investors appeared first on Cryptonews.

Oil prices have dipped back below $100 following a period of disruption in Persian Gulf supply, with buffers drawn down as inventory declines and softer demand absorb the shock. The release from eToro frames the move as a signal of evolving market dynamics, where near-term tightness remains even as headline prices retreat. As the last pre-blockade cargoes clear the system, the cushion could shrink and the path may tilt toward higher prices if supply constraints persist. The commentary also notes that physical oil trades are showing a premium to futures, underscoring immediate demand for available barrels.
Key points
- Oil moved back below $100 as supply disruptions persist in the Persian Gulf, with market cushions fading as pre-blockade cargoes clear.
- Physical crude is trading at a premium to futures, signaling near-term constraints and immediate demand for barrels.
- A significant share of Persian Gulf supply is missing from the market due to drawdowns, reducing buffers that previously absorbed shocks.
- Market fundamentals could reassert themselves, with prices more likely to move higher if supply constraints persist.
Why it matters
It matters for traders and energy watchers because near-term price direction may be driven by supply gaps in a key producing region. The disappearance of buffers as the last pre-blockade cargoes clear can reduce the cushion against demand and geopolitical risk, potentially making prices more sensitive to outages and refinery activity. While diplomacy progress has buffered prices, the press release notes that fundamentals may reassert themselves, implying that sustained supply constraints could support higher oil prices in the coming days.
What to watch
- Whether the last pre-blockade cargoes clear the system and the cushion for supply shocks continues to erode.
- Any changes in refinery activity or inventory levels that could accelerate price movements.
- Durations of diplomatic progress that may influence market expectations and the pace of price re-pricing.
Disclosure: The content below is a press release provided by the company or its PR representative. It is published for informational purposes.
Oil dips below $100 as supply tightens, upside risk builds
Abu Dhabi, United Arab Emirates – April 14, 2026: Oil prices dipping back below the $100 mark may suggest easing geopolitical tensions, but underlying supply dynamics indicate that upward pressure on prices could persist, according to eToro’s latest market commentary.
A significant portion of Persian Gulf oil supply remains disrupted, with inventory drawdowns and softer demand temporarily absorbing the shock. However, as the last pre-blockade cargoes clear the system in the coming days, this buffer is expected to diminish, potentially exposing tighter market conditions.
Signs of tightening are already visible in the physical oil market, where crude is trading at a premium to futures, reflecting near-term supply constraints and immediate demand for available barrels.

Lale Akoner, Global Market Analyst at eToro, commented: “Oil’s move back below $100 may suggest easing tensions, but we think that the underlying supply dynamic still signals that oil could continue to rise.”
She added: “A meaningful share of Persian Gulf supply is already missing from the market, with inventory drawdowns and softer demand absorbing the shock. As the last pre-blockade cargoes clear the system, the market loses its cushion, and the adjustment that follows is likely to be more visible.”
While prices are currently supported by expectations of diplomatic progress, market fundamentals may soon take precedence. A sharper slowdown in refinery activity or a further decline in inventories toward critical levels could accelerate price movements.
Akoner concluded: “For now, prices are anchored by expectations that diplomacy will progress. Our view is that fundamentals will reassert themselves. If supply constraints persist, oil is more likely to move higher from here than lower.”
Notes:
Past performance is not an indication of future results.
Market observations are based on current oil market dynamics and available data.
All data is accurate as of the latest available market close.
Media Contact
PR@etoro.com
About eToro
eToro is the trading and investing platform that empowers you to invest, share and learn. We were founded in 2007 with the vision of a world where everyone can trade and invest in a simple and transparent way. Today we have 40 million registered users from 75 countries. We believe there is power in shared knowledge and that we can become more successful by investing together. So we’ve created a collaborative investment community designed to provide you with the tools you need to grow your knowledge and wealth. On eToro, you can hold a range of traditional and innovative assets and choose how you invest: trade directly, invest in a portfolio, or copy other investors. You can visit our media centre here for our latest news.
Regulation and License Numbers:
Middle East
eToro (ME) Limited, is licensed and regulated by the Abu Dhabi Global Market (“ADGM”)’s Financial Services Regulatory Authority (“FSRA“) as an Authorised Person to conduct the Regulated Activities of (a) Dealing in Investments as Principal (Matched), (b) Arranging Deals in Investments, (c) Providing Custody, (d) Arranging Custody and (e) Managing Assets (under Financial Services Permission Number 220073) under the Financial Services and Market Regulations 2015 (“FSMR”). Registered Office and its principal place of business: Office 26 and 27, 25th floor, Al Sila Tower, ADGM Square, Al Maryah Island, Abu Dhabi, United Arab Emirates.
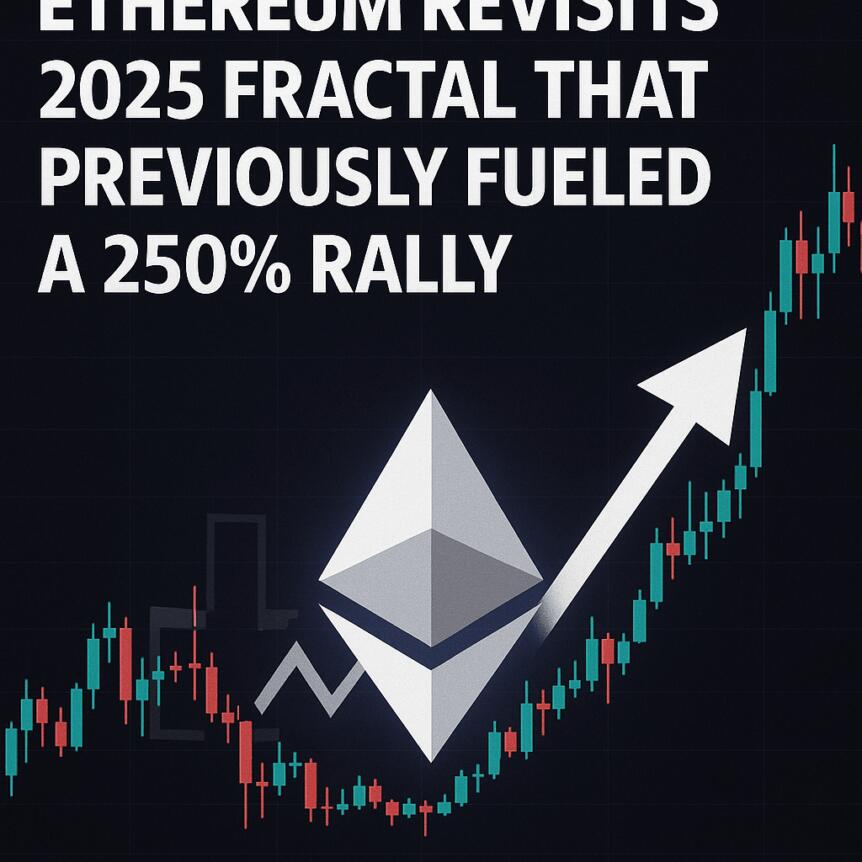
Ether (ETH) is carving out a familiar, technically charged pattern on the weekly chart, a setup that some traders say echoes a 2025 fractal in which ETH surged about 250%. The current move sees Ether testing an ascending trend line that has provided support since 2022, while a bullish MACD crossover has helped confirm a price bottom and unleash renewed momentum.
Analysts are watching whether this pattern can unfold again. On X, analyst Max Crypto framed the current action as a repeatable structure—“Similar structure. Similar dump. Similar consolidation.” He asked aloud whether ETH could repeat the Q2/Q3 2025 rally, suggesting a potential move that would push ETH beyond prior highs if history rhymes with the present setup. Another observer, Cryptorand, stressed that a decisive push above the $2,400 level would be a prerequisite for a sustained reversal, framing the next step as a test of the key resistance before any pronounced breakout.
Key takeaways
- Ether’s weekly chart shows a pattern reminiscent of a 2025 fractal, with a bullish MACD cross and a retest of an ascending trend line that has supported price since 2022.
- If the 2025-like pattern plays out again, ETH could rally more than 250% toward around $6,300, contingent on clearing a crucial hurdle near $2,400.
- On-chain demand signals have turned positive, with Capriole Investments’ Ethereum Apparent Demand metric rising to 24,111 ETH on April 14 after a rise beginning April 8.
- Institutional appetite is echoing in market structure, as the Coinbase ETH/USD premium index climbed to 0.055—the highest since October 2025—suggesting stronger US-based demand.
Pattern dynamics and the path to a potential breakout
From a technical perspective, Ether’s price action is anchoring around a long-standing support line that has framed the market since 2022. The weekly chart’s close above the MACD’s bullish crossover adds a layer of confidence that the immediate liquidations may be behind us and a new leg higher could be underway. The reference to a 2025 fractal is more than a curiosity; it points to a multi-quarter cycle in which ETH established a major rally after a similar sequence of lows, consolidations, and reaccumulation phases.
Max Crypto highlighted the possibility of history rhyming with the present, inviting readers to consider whether ETH could replicate the Q2/Q3 2025 run. The gist: if the trend repeats, Ether could test the upper reaches of its prior rally, potentially surpassing the $6,000 level and approaching $6,300 before meaningful resistance consolidates price action again. Cryptorand, meanwhile, underscored that clearing the $2,400 barrier would be a signal that a bullish reversal is underway, turning consolidation into momentum and lifting the odds of a sustained upside move.
Demand signals: institutions re-engaging with ETH
Beyond pure price action, on-chain demand indicators have started to brighten. Capriole Investments’ Ethereum Apparent Demand metric has moved back into positive territory, rising from early April and peaking at 24,111 ETH on April 14. The metric aggregates observed buying interest across on-chain activity and can serve as a proxy for underlying demand dynamics that precede price moves.
A separate indicator of institutional interest comes from the Coinbase premium for ETH/USD, which, according to CryptoQuant, rose to 0.055—the highest level observed since October 2025. CryptoQuant analyst Arab Chain described the move as indicative of a notable influx of institutional liquidity, particularly within the U.S. market. In practical terms, the premium reflects a price relationship between ETH on Coinbase versus other exchanges, with a larger premium often signaling stronger demand from larger, possibly institution-aligned buyers.
ETF and ETP inflows reinforce the demand story
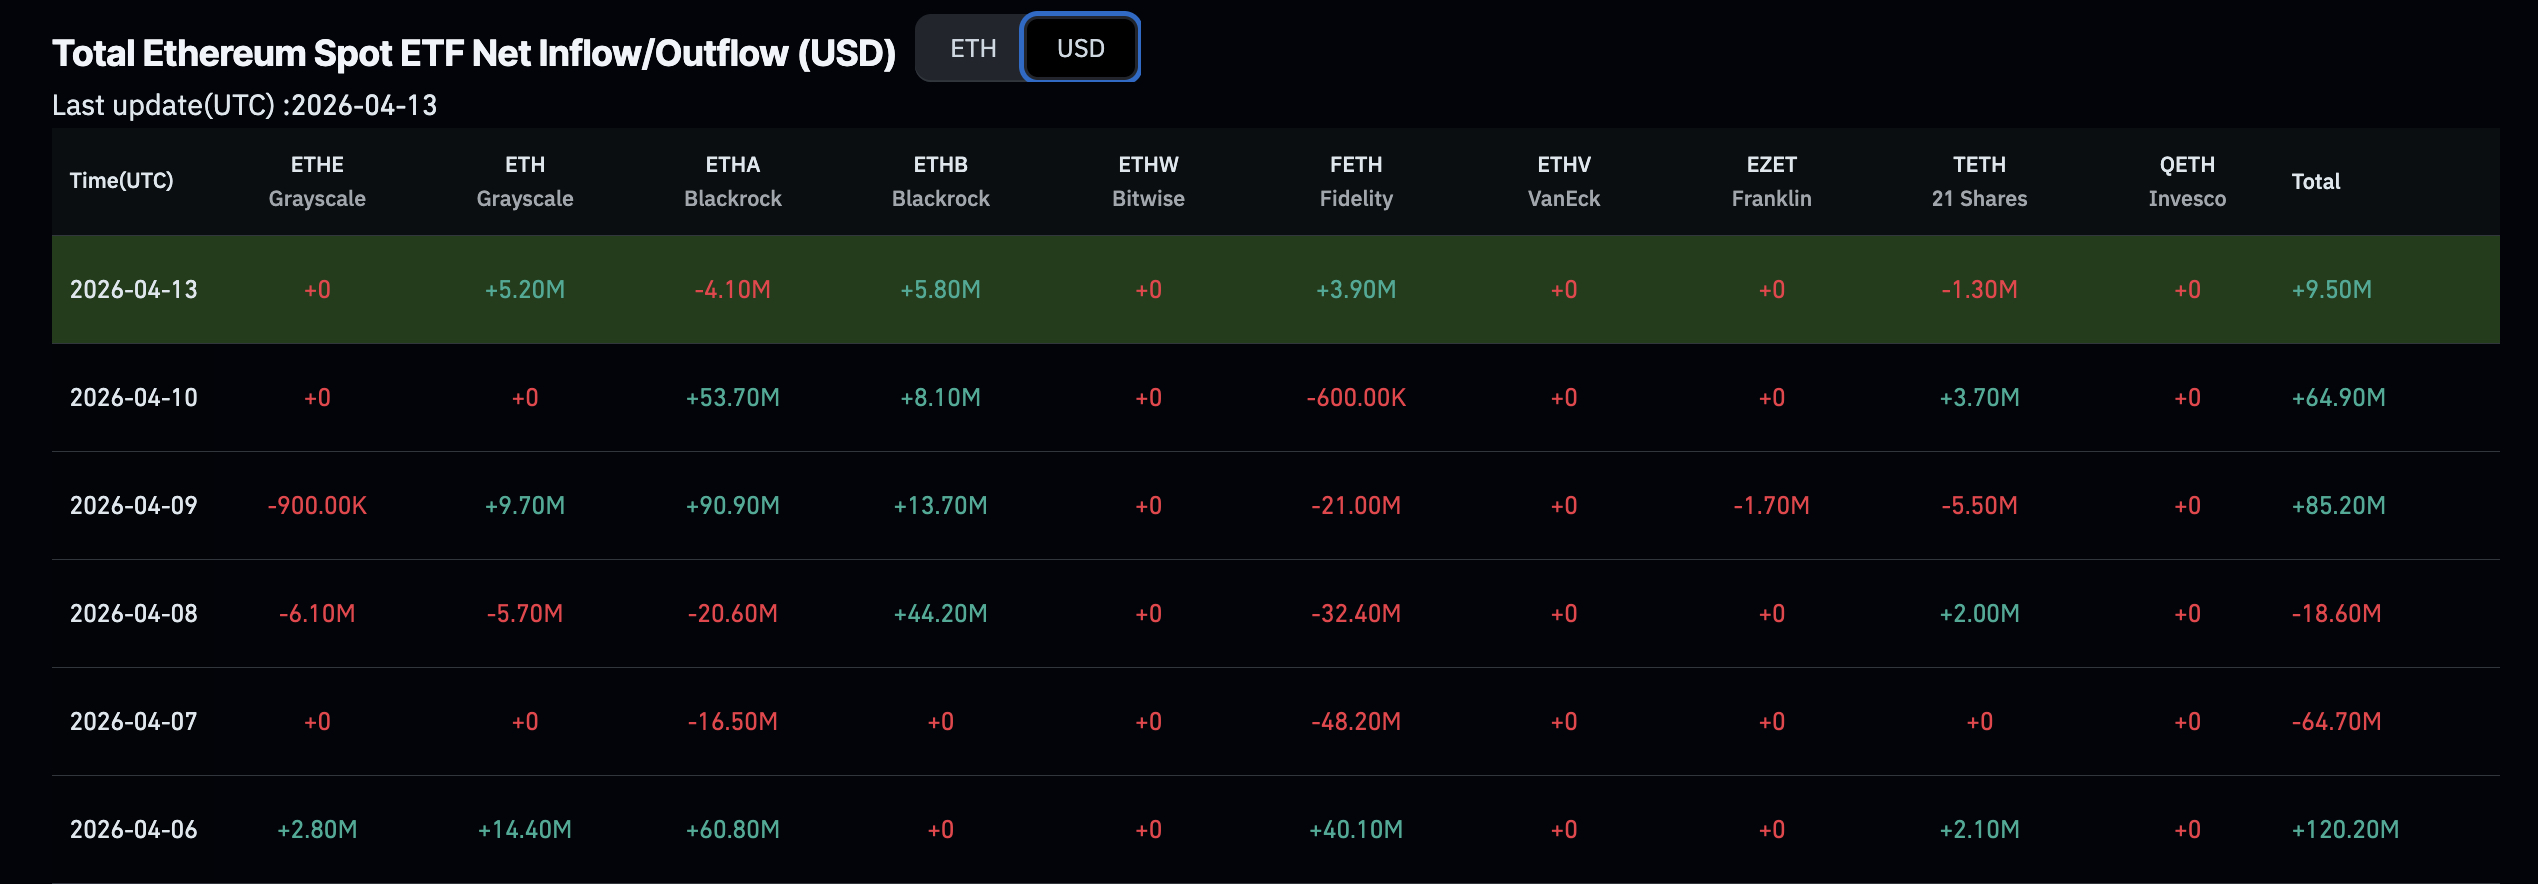
Market observers have also pointed to inflows into Ethereum-related exchange-traded products (ETPs) as corroborating evidence of rising demand. Spot Ethereum ETFs recorded net inflows across three consecutive days, totaling about $160 million, underscoring robust appetite from investors looking to gain regulated exposure to ETH via traditional financial vehicles. The broader ecosystem of Ether-tracking ETPs—global Ether ETPs—also drew notable inflows, reported at roughly $196.5 million for the preceding week, highlighting sustained participation from institutional and professional investors beyond spot-market dynamics.
Taken together, these demand signals—on-chain purchases, the uptick in the Coinbase premium, and ETF/ETP inflows—paint a coherent picture of renewed institutional engagement with Ether. They align with the price pattern and macro catalysts discussed by market observers, suggesting that ETH’s next move could be driven as much by capital allocation choices as by pure technical setups.
What could shape the next moves for Ether
Several factors will likely determine whether ETH sustains a bullish reversal or resumes a consolidation phase. The most immediate technical hurdle remains the $2,400 region. A clean consolidation over that threshold would bolster the bullish case, potentially paving the way for a multi-hundred-percent move if the fractal dynamics from 2025 repeat. Conversely, failure to clear and hold above $2,400 could sideline the rally, inviting renewed volatility and a possible retest of lower supports.
Macro factors also loom large. The market has been sensitive to geopolitical and policy-driven catalysts, including sentiment around international diplomacy—illustrated in part by hopes for a US-Iran deal—that can sway institutional risk appetite. Traders will be watching for any shifts in liquidity conditions, US-based demand signals, and the continued flow of ETF and ETP inflows, which together can both reflect and amplify the current pattern.
From a timing perspective, the coming weeks could be pivotal. If the fractal pattern mirrors 2025, investors might see a sustained push higher, but the trajectory will hinge on how quickly and convincingly ETH crosses the critical $2,400 barrier and whether the market can sustain that breakout amid broader risk-on conditions. As always, the path forward remains contingent on a confluence of technical confirmation and real-world demand signals.
Readers should monitor several near-term datapoints: the price action around $2,400, the persistence of on-chain buying interest via Apparent Demand metrics, and the momentum implied by the MACD, as well as continued ETF/ETP inflows. Each of these elements can tilt the balance toward a lasting rally or a renewed period of range-bound trading.
Looking ahead, the combination of a constructive weekly pattern and fresh demand signals could tilt Ether toward renewed leadership in the broader crypto market. Yet the path to a durable breakout will require sustained momentum above key levels, ongoing institutional interest, and a continued appetite for ETH exposure across both spot and product-based channels.


The bitcoin price surged more than 5 percent Tuesday morning to touch $74,901 before settling around $74,400, its highest level since March 17, after Trump signaled Iran may be interested in resuming peace talks and CENTCOM clarified the naval blockade would not impede non-Iranian shipping through the Strait.
Summary
- Bloomberg reported bitcoin climbed to $74,901 at 8:30 AM Singapore time before paring to around $74,400, while Ether rose 5 percent to $2,370 and XRP gained alongside the broader crypto market rally.
- The rally was triggered by Trump’s comments suggesting Iran had expressed interest in returning to negotiations, combined with CENTCOM’s clarification that the blockade targets only Iranian-port traffic rather than all Strait of Hormuz shipping.
- The move liquidated short positions across the crypto derivatives market, echoing the pattern from April 7 when the original ceasefire announcement cleared $427 million in leveraged short bets and sent bitcoin from $68,500 to $72,700 in hours.
The same diplomatic signal dynamic that drove the April 7 ceasefire rally is at work again: every credible hint of de-escalation produces a fast and sharp crypto repricing because the market has been systematically short through the conflict. A full peace deal or ceasefire extension before April 22 would likely produce a larger move. Market analyst Sam Daodu outlined a $75,000 to $80,000 range as the target if new talks produce even a temporary agreement, and a path toward $100,000 by year-end if a full deal materializes and oil returns toward pre-war levels near $65 to $70 per barrel.
Monday opened with bitcoin at $70,741 as the naval blockade went live and oil touched $104. Tuesday opened at $74,400 as the same geopolitical situation produced a different signal. The difference was a single item: Trump’s suggestion that Iran wants to talk. That is the level of hair-trigger sensitivity the bitcoin market has developed to Iran war headlines. The directional trade is simple: war progress down, peace progress up, with each swing amplified by the short-heavy positioning that has built up over 46 consecutive days of extreme fear.
Why Ethereum’s 5% Gain Matters
Ether rising 5 percent to $2,370 alongside bitcoin is a signal that this rally has broader risk-on characteristics rather than being a bitcoin-specific move. When only bitcoin rallies during geopolitical relief, it reflects safe-haven rotation within crypto. When Ether, XRP, and altcoins rally together, it reflects genuine risk appetite returning across the asset class. The CLARITY Act markup window opening this week adds a crypto-specific regulatory tailwind on top of the geopolitical relief signal.
What the Market Is Watching to Hold $74,400
The critical question is whether the rally holds or fades if Iran makes no formal statement about resuming talks. The $75,000 to $76,100 level is the next meaningful resistance, corresponding to the February swing high before the war broke out. A daily close above that level would signal a full technical reversal of the war-driven selloff. Without a confirmed diplomatic development, the market is vulnerable to a return to the $70,000 to $71,000 range on any negative Iran headline.
Ethereum price has jumped by 9% in the past 24 hours, approaching the $2,400 resistance barrier with a prediction for it to even break . Capital is visibly shifting: bitcoin ETFs bled $325.8 million in net outflows on April 13 alone, while ether ETF weekly inflows hit $187 million, the strongest showing of 2026.

On-chain, daily Ethereum transactions spiked 41% week-over-week to approximately 3.6 million, up from 2.5 million just days earlier. Macro relief from easing geopolitical tensions appears to be amplifying the move, with decentralized assets attracting fresh allocations. Broader market context points to a coordinated risk-on shift, but ETH is clearly leading it.
Discover: The best crypto to diversify your portfolio with
Ethereum Price Hit $3,000 This Week Despite Bear Prediction?
ETH is compressing against a stubborn ceiling. Price is testing the $2,400 resistance, a zone that has capped multiple recovery attempts in recent weeks. Analysts have flagged $2,750 as a realistic target, a 22% rally from current levels, only if ETH clears $2,400 with conviction, citing an 11.5x risk-reward setup using $2,030 as the stop.
The technical structure is encouraging. On-chain signals have flipped bullish, with whales turning profitable, $135 million in ETH exchange outflows via staking, and a pattern of higher lows forming in a classic pre-breakout compression. Cumulative ETH ETF inflows have now reached a record $11.68 billion, providing an institutional backdrop to the move.
ETH needs to break above $2,400 to open the path to $2,600–$2,800, with $2,750 as the primary analyst target. Failure to hold $2,100 support and it may collapse the higher-lows structure, and target $2,000 support.
The divergence between transaction volume and fee revenue is worth watching closely. More transactions at lower value could signal bot activity rather than organic demand. ETH’s broader technical setup points toward a decisive move in either direction soon.
Discover: The best pre-launch token sales
Maxi Doge Might Be the Memecoin We Need
ETH at under $2,400 is exciting, but traders who missed the entry near $1,800 are now chasing a resistance test with a compressed risk-reward. For those who want asymmetric exposure while Ethereum sets up its next leg, early-stage presales offer a different calculus entirely.
Maxi Doge ($MAXI) is a meme token and trading community built on Ethereum, currently in presale at $0.0002813 with $4.7 million raised to date. The project channels what it calls “1000x leverage trading mentality” through a 240-lb canine mascot.
Features include holder-only trading competitions with leaderboard rewards, a Maxi Fund treasury for liquidity and partnerships, and dynamic staking APY for early participants. The tagline “Never skip leg day, never skip a pump” s meme marketing doing exactly what meme marketing is supposed to do.
Research Maxi Doge before the presale window closes.
The post Ethereum Price Prediction: ETH 9% Jump Since Morning Outperforming Most Assets appeared first on Cryptonews.

Amazon purchases Globalstar for $11.6B to expand its low Earth orbit satellite network

Arrests made as police find 663 cannabis plants in Radcliffe

Ja Morant Season Officially Over After Elbow PRP Injection as Grizzlies Eye 2026-27 Rebuild


-

 Politics4 days ago
US brings back mandatory military draft registration
-
 Sports4 days ago
Man United discover Nico Schlotterbeck transfer fee as defender reaches Dortmund agreement
-

 Fashion4 days ago
Weekend Open Thread: Veronica Beard
-

 Tech7 days ago
How Long Can You Drive With Expired Registration? What Florida Law Says
-

 Politics5 days ago
Malcolm In The Middle OG Turned Down ‘Buckets Of Money’ To Appear In Reboot
-

 Politics2 days ago
World Cup exit makes Italy enter crisis mode
-

 Crypto World5 days ago
Canary Capital Files SEC Registration for PEPE ETF
-

 Business4 days ago
Tesla Model Y Tops China Auto Sales in March 2026 With 39,827 Registrations, Beating Cheaper EVs and Gas Cars
-

 Crypto World1 day ago
The SEC Conditionalises DeFi Platforms to Be Avoided for Broker Registration
-

 Crypto World21 hours ago
SEC Signals Exemption for Crypto Interfaces From Broker Registration
-

 Crypto World6 days ago
Bitcoin recovers as US and Iran Agree a Ceasefire Deal
-
 NewsBeat2 days ago
Pep Guardiola and Gary Neville agree over Arsenal title problem that benefits Man City
-

 Business4 days ago
OpenAI Halts Stargate UK Data Centre Project Over Energy Costs and Copyright Row
-

 Business3 days ago
Ireland Fuel Protests Enter Day 5 as Blockades Spark Shortages and Government Prepares Support Package
-

 Politics5 days ago
LBC Presenter Mocks Trump Over Iran War Failures
-

 Crypto World4 days ago
Federal judge blocks Arizona from bringing criminal charges against Kalshi
-
 NewsBeat2 days ago
JD Vance announces ‘no agreement’ with Iran over nuclear weapons fear
-

 Tech5 days ago
A version of Windows 10 released a decade ago is now eligible for additional security patches
-

 Business4 days ago
IMF retains floor for precautionary balances at SDR 20 billion
-

 Crypto World13 hours ago
SEC Proposes Certain Crypto Interfaces Don’t Need to Register as Brokers
You must be logged in to post a comment Login