
Crypto World
Fellowship PAC Sends $3M in Ads to Hines-Linked Firm

TLDR
- Fellowship PAC raised $11 million and quickly spent $3 million on advertising services.
- The PAC booked its advertising through Nxum Group, a firm co-founded by Tether US CEO Bo Hines.
- Federal Election Commission filings show that Cantor Fitzgerald contributed $10 million to the PAC.
- Anchorage Digital contributed $1 million and described it as part of its bipartisan policy approach.
- The PAC supported Republican candidates in Georgia, Kentucky, and Nebraska with targeted ad spending.
A newly formed crypto political committee has raised $11 million and quickly directed $3 million to advertising services. Fellowship PAC booked those ads through Nxum Group, a firm co-founded by Tether US CEO Bo Hines. Federal Election Commission filings released Wednesday detailed the funding sources and spending activity.
Fellowship PAC funding and early spending
Fellowship PAC collected $10 million from Cantor Fitzgerald and $1 million from Anchorage Digital, according to filings. The committee then committed $3 million for advertising through Nxum Group, which Hines co-founded with his father and a partner.
The PAC supports Republican candidates in congressional and gubernatorial races. It spent $300,000 to support Clay Fuller after he won a Georgia special election. It also directed $850,000 to Nate Morris in Kentucky’s Senate race and $350,000 to Senator Pete Ricketts in Nebraska.
Filings show Nxum Group received the full $3 million in disbursements for advertising services. Before this work, Nxum reported limited campaign activity. The firm previously donated $1 million in billboard advertising to MAGA Inc. in 2024.
Hines served as former President Donald Trump’s crypto adviser before joining Tether last year. He co-founded Nxum before taking his White House role. Nxum’s recent filings now connect it to the PAC’s initial advertising push.
Tether links and corporate contributions
Fellowship PAC has reported ties to Tether since its launch last year. A senior Tether executive serves as the PAC’s chairman. However, most of the current funding came from Cantor Fitzgerald.
Cantor manages reserves for Tether’s stablecoin operations. Howard Lutnick, Cantor’s former chief executive, now serves as Commerce Secretary under Trump. His children now oversee Cantor’s operations.
Fellowship PAC previously announced plans to raise $100 million to support pro-crypto candidates. That pledged total has not appeared in current filings. The PAC has not responded to requests for comment.
Anchorage Digital described its $1 million contribution as part of a broader strategy. The company stated, “Anchorage Digital has made a corporate contribution to the Fellowship PAC as part of our broader, bipartisan approach to advancing regulatory clarity for digital assets in the United States.” Anchorage also posted the statement on its website.
Neither Tether US nor Cantor Fitzgerald responded to media inquiries about their involvement. Filings identify a Cantor executive as the PAC’s treasurer. Current records do not show direct contributions from Tether entities.
U.S. law bars non-U.S. entities from directly participating in federal campaign financing. Tether operates globally, and public records do not clarify whether its U.S. arm contributed funds. The latest Federal Election Commission filings reflect $11 million raised and $3 million disbursed for advertising.


Wall Street closed with S&P 500 and Nasdaq at fresh records as Tesla and Apple led a powerful tech rally while the Dow slipped.
Summary
- S&P 500 and Nasdaq close at all-time highs as megacap tech leads.
- Tesla jumps more than 7%, while Apple gains nearly 3% on heavy volume.
- Dow Jones slips as investors rotate into growth and AI-linked names.
U.S. stocks closed higher on Wednesday, with the S&P 500 and Nasdaq finishing at record levels as a renewed surge in technology shares overshadowed weakness in the Dow Jones Industrial Average.
Wall Street scales new peak on tech strength
According to market data compiled by Gate, the Dow slipped 0.15%, while the S&P 500 rose 0.8% and the Nasdaq added 1.59%, pushing both benchmarks to fresh all-time closing highs in New York.
Tesla shares rallied 7.6% to around $390 after recent losses, extending a rebound that has left the electric-vehicle maker up sharply from its intraday low near $362 earlier in the session.
Apple also advanced, climbing nearly 3% as investors rotated back into the largest U.S. technology and AI-linked names, helping to propel the tech-heavy Nasdaq to its latest record.
SanDisk, by contrast, fell 5.5%, highlighting ongoing dispersion within the broader technology complex even as headline indices notch new peaks.
The latest leg higher leaves the S&P 500 trading just below 7,000 points, extending a powerful run that has seen the index gain more than 16% over the past year alongside expectations for roughly 15% annual earnings growth, according to recent U.S. market research.finance.yahoo+1
Chinese companies listed in New York also participated in the move, with the Nasdaq Golden Dragon China Index up 0.7% and NetEase adding about 2%, underscoring renewed risk appetite for growth and internet names.
The advance comes against a backdrop of investors betting that resilient U.S. economic data, strong big-tech balance sheets and ongoing enthusiasm around artificial intelligence will continue to support equities, even as geopolitical tensions and higher-for-longer rates remain in focus.
In this environment, Wall Street strategists have pointed to April’s historical tendency to deliver strong equity performance, with the S&P 500 averaging gains of roughly 1.4% in the month over recent decades, reinforcing seasonal tailwinds behind the latest breakout.

Ethereum has managed to keep the price above the $2,300 level, pulling away from the mid-March dip near $1,940. The latest price action arrives amid a broader sense of resilience, underpinned by spot demand and a resurgence in futures activity that traders are watching closely for signs of a lasting momentum shift after a long run of attempts to reclaim the $2,400 mark.
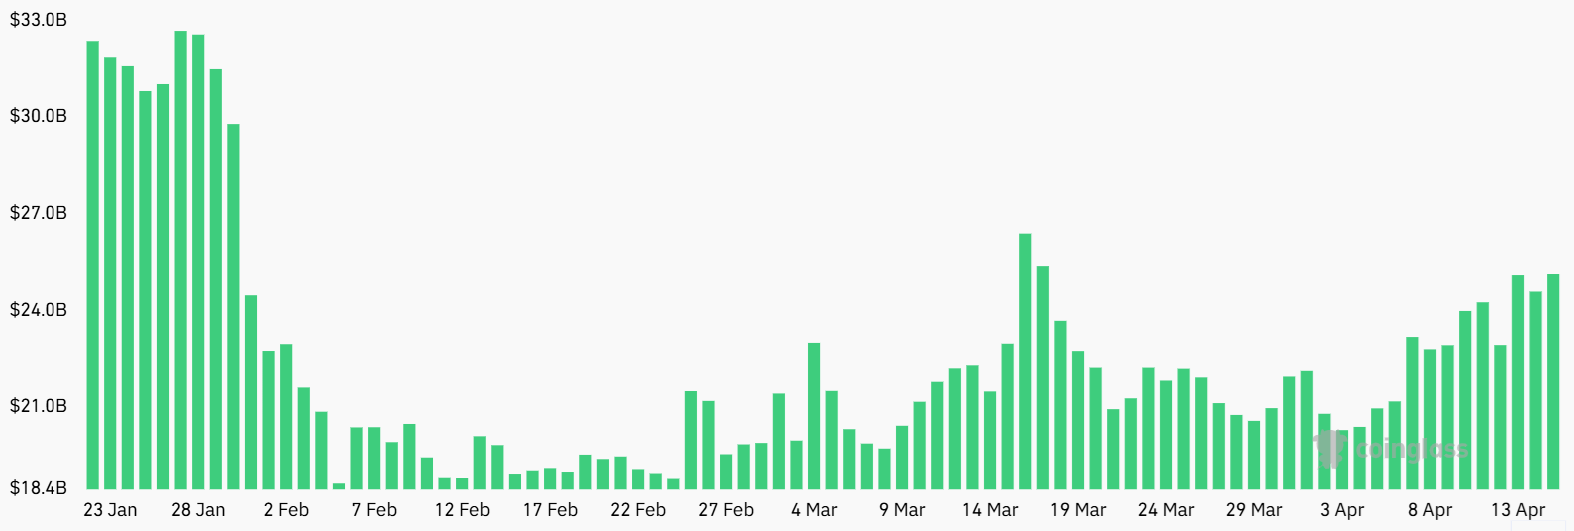
According to CoinGlass, ETH futures open interest has climbed to about $25.4 billion, suggesting growing appetite for leveraged exposure even as spot demand plays a key role in supporting prices. The move comes as the market consolidates a more constructive tone after weeks of struggle to reestablish the $2,400 threshold, with price action stabilizing near the current range as macro headlines ebb and flow.
Key takeaways
- Spot demand and institutional inflows anchor the rally: US-listed Ether spot ETFs saw about $248 million in net inflows over the past 10 days, reinforcing a narrative of solid cash-based buying. Bitmine Immersion’s ETH holdings have grown to 4.87 million ETH, equating to roughly $11.46 billion at current prices.
- Abstract risk remains despite price momentum: The perpetual ETH funding rate has struggled to stay above 5% since Friday and has dipped into negative territory at times, signaling cautious sentiment among bulls even as futures exposure expands.
- DApp activity wanes even as demand indicators hold: Ethereum weekly DApps revenue has slipped to about $11 million, down from roughly $24 million in early February, raising questions about near-term on-chain demand and ETH’s ability to sustain a broader network activity rebound.
- Market backdrop and ETF flows temper the upside: Ether ETFs report about $13.7 billion in assets under management, down from $20.5 billion three months earlier, while the S&P 500 hit new all-time highs—creating a mixed macro environment for crypto risk assets.
Spot demand versus on-chain activity
From a price perspective, ETH’s current zone of support around $2,300 has coincided with a pickup in spot-market interest. The net inflows into U.S.-listed Ether spot ETFs over the last 10 days provide a tangible signal that some market participants prefer owning ETH outright rather than relying solely on derivatives to express exposure. Those inflows come at a time when spot demand appears to be the primary driver behind recent price stability, even as derivatives metrics present a more nuanced story.
Bitmine Immersion—a digital asset treasury company—announced a fresh tranche of ETH purchases totaling about $312 million, boosting its holdings to 4.87 million ETH. That stockpile is valued today at roughly $11.46 billion. However, data from CoinGecko shows those holdings are trading approximately 13% below their acquisition cost, underscoring that the profitability of such stockpiling is sensitive to price swings and timing. The broader ETF ecosystem reflects a similar narrative: Ether’s US-listed ETF assets under management sit around $13.7 billion, down from $20.5 billion three months prior, highlighting a shifting appetite for passive exposure alongside ongoing volatility in crypto markets.
Complicating the picture is a macro backdrop where traditional equities have shown strength, with the S&P 500 reaching new highs on the same trading day as ETH’s rally. In this environment, investors appear to be weighing the potential for a systemic crypto rebound against competing macro drivers and sector-specific headwinds.
Derivatives sentiment and price action
Despite rising futures exposure, the market’s sentiment signals remain cautious. The ETH perpetual futures funding rate has not convincingly held above the 5% annualized threshold since last Friday, with several readings dipping below zero. In theory, a healthy long-speculation premium would be expected when bulls are confident, but the data suggests that the market continues to price in considerable risk and a need to justify the rally with more concrete on-chain activity or macro catalysts. Still, some analysts argue that the current price action is more reflective of spot demand supporting prices than of a wholesale shift in derivatives positioning.
Data from Laevitas tracking perpetual funding rates paints a nuanced picture: periods of neutrality—roughly in the 5% to 10% range under typical conditions—have given way to readings that imply a tilt toward neutral-to-cautious positioning. In other words, while more capital appears to be entering ETH futures, the cost of carry signals a measured approach rather than an unreserved bullish bet.
All told, the divergence between rising open interest and middling funding signals suggests a market in which investors are content to accumulate exposure through a mix of spot and regulated derivatives, yet remain wary about extending momentum without clearer catalysts. In this context, the rally to the mid-$2,300s—around the $2,350 mark at times—could prove to be a test of whether spot demand alone can sustain a more durable upside, or if a fresh burst of on-chain activity and ecosystem development is needed to push ETH back into the $2,400 realm and beyond.
DApps activity and competitive dynamics
One of the more telling questions for ETH’s medium-term trajectory is whether on-chain activity can rebound alongside price. Data tracked by DefiLlama shows Ethereum’s weekly DApps revenue sliding to about $11 million, down from roughly $24 million in February. While the burn mechanism built into Ethereum’s consensus layer continues to be cited by supporters as a structural incentive for long-term holders, near-term on-chain throughput and usage have not yet picked up in a way that would meaningfully lift network activity across the board.
Investors are also contending with an increasingly competitive landscape. While Ethereum remains the dominant smart contract platform, other blockchains focused on specialized use cases—such as high-throughput cross-chain solutions and niche dApp ecosystems—are drawing developers and users with tailored incentives and efficiency gains. This competition complicates the narrative that ETH is simply a one-way bet on rising on-chain demand. The divergence between rising price and stagnating or contracting on-chain activity underscores a nuanced risk-reward balance for traders and long-term holders alike.
What to watch next
As ETH hovers in a $2,300–$2,350 corridor, investors will be watching for a few key signals. A sustained increase in spot ETF inflows would reinforce the case for a renewed, spot-driven uptrend, especially if institutional buyers continue to accumulate ETH rather than diversify into alternatives. Conversely, a meaningful rebound in DApps activity or a shift in the funding-rate dynamic that points to stronger bullish conviction could catalyze a more decisive move toward the $2,400 level and beyond.
Macro drivers remain pivotal: any acceleration in risk appetite among traditional markets, or a rollback of tethered risk within the broader crypto ecosystem, could alter ETH’s trajectory. For now, the market presents a mixed picture—spot demand and institutional buying provide a floor, while on-chain activity and competitive pressures keep the upside under scrutiny.
This article reflects data from CoinGlass, SoSoValue, CoinGecko, Laevitas, and DefiLlama, among others, and is intended to illuminate how recent developments might shape ETH’s near-term path. As always, readers should monitor evolving liquidity, funding signals, and real-world usage to gauge whether the current rally can translate into a sustained recovery or remains a tactical pause before the next leg.


The Take It Down Act has secured its first federal conviction, with an Ohio man pleading guilty to using more than 100 AI models to create and distribute nonconsensual deepfakes of women and children, putting the first real enforcement stamp on a landmark AI-specific law.
Summary
- James Strahler II, 37, of Columbus, Ohio, pleaded guilty on April 7 to cyberstalking, producing child sexual abuse material, and publishing digital forgeries under the Take It Down Act.
- The law, signed by President Trump in May 2025, makes it a federal crime to publish nonconsensual AI-generated intimate imagery and requires platforms to remove it within 48 hours of a valid report.
- Online platforms have until May 19, 2026 to establish formal takedown procedures or face Federal Trade Commission enforcement action.
The Take It Down Act has its first conviction. James Strahler II, a 37-year-old Columbus, Ohio man, pleaded guilty on April 7 to three federal counts: cyberstalking, producing obscene visual representations of child sexual abuse material, and publishing digital forgeries, the law’s term for nonconsensual deepfakes. The Department of Justice confirmed he is the first person convicted under the law.
Between December 2024 and June 2025, Strahler used over 100 AI models to create sexually explicit images and videos of six adult victims and distribute them to their coworkers and families. He also generated deepfake content involving children and uploaded hundreds of images to a child sexual abuse website before his arrest in June 2025.
The Take It Down Act, introduced by Senators Ted Cruz and Amy Klobuchar and signed into law on May 19, 2025, criminalizes the knowing publication of nonconsensual intimate imagery, including AI-generated content depicting real people. It passed the Senate unanimously and the House by 409 to 2.
Penalties under the law include up to two years in prison per offense involving adult victims and up to three years when minors are involved. Strahler has not yet been sentenced.
U.S. Attorney Dominick Gerace said the prosecution sends a direct message: “We will not tolerate the abhorrent practice of posting and publicizing AI-generated intimate images of real individuals without consent.”
What the Law Requires of Platforms
Beyond criminal prosecution, the Take It Down Act creates mandatory obligations for online platforms. Covered platforms, including public websites and mobile applications that host user-generated content, must remove reported nonconsensual imagery within 48 hours of a valid victim request and make reasonable efforts to find and delete identical copies.
The compliance deadline is May 19, 2026, just over a month away. Platforms that fail to establish a formal removal process face enforcement by the Federal Trade Commission. The law does not preempt state-level protections, and at least 45 states have their own AI deepfake laws in place.
Why It Matters for AI Regulation
The Take It Down Act is widely described as the first major federal law in the United States that directly restricts harmful uses of AI. Its passage reflects growing bipartisan urgency around AI-generated abuse at a moment when deepfake tools have become widely accessible. The National Center for Missing and Exploited Children received more than 1.5 million AI-related exploitation tips in 2025 alone.
The same technology that enables nonconsensual intimate imagery is also fueling deepfake scams across the crypto sector, where AI-generated impersonations of prominent figures have been used to defraud investors. The deepfake crisis across financial platforms saw AI-powered vishing attacks surge 28% year over year in Q3 2025, underscoring why federal-level intervention carries broad implications beyond intimate imagery alone.
First Lady Melania Trump, who championed the legislation as part of her Be Best initiative, said she was proud of the first conviction.
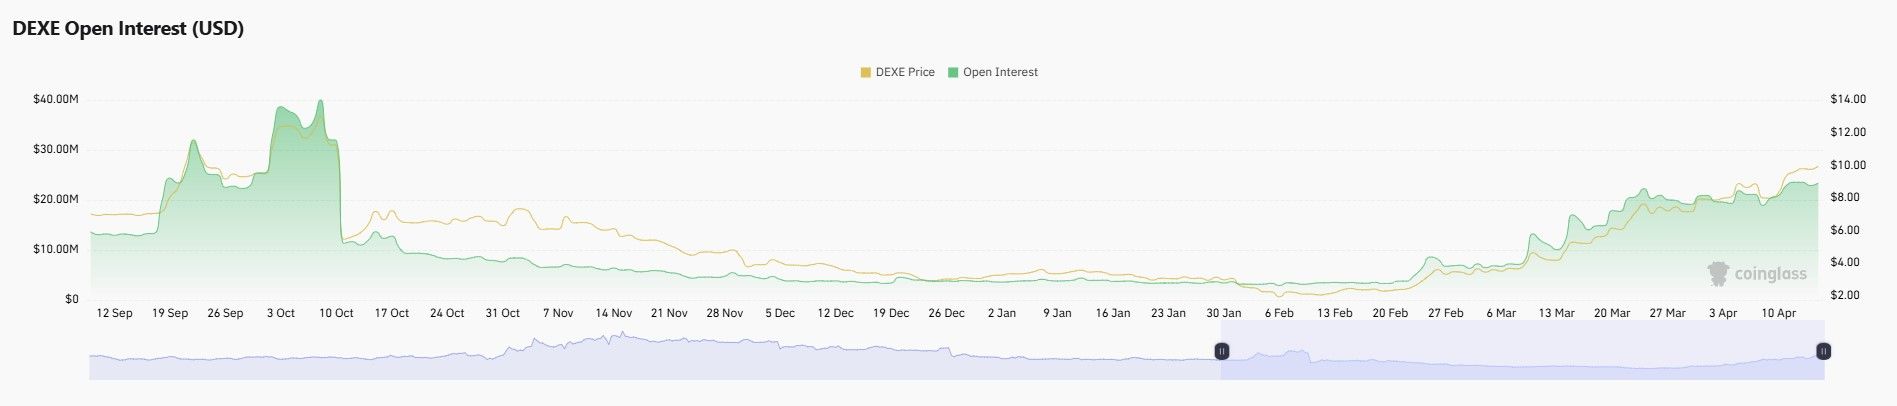
DeXe (DEXE) surged 22% on April 15, 2026, pushing to $12.19 and entering a resistance zone that capped the token’s October 2024 rally. Open interest across all exchanges has recovered to approximately $20 million, up from near-zero levels recorded in January 2026.
The move places DEXE directly at the 0.5 Fibonacci retracement level on the weekly chart. That threshold now determines whether the recovery from January lows continues toward $15 or stalls under concentrated selling pressure.
Open Interest Climbs Back Toward Pre-Correction Levels
DEXE open interest peaked at roughly $39 million in early October 2024 before collapsing alongside price. The liquidation wave erased most leveraged exposure. By late January 2026, open interest had fallen to approximately $5 million, per Coinglass data.
Since February 2026, open interest has rebuilt steadily alongside price, reaching approximately $20 million as of April 15. When OI and price rise together, it may signal fresh capital entering the market rather than a short squeeze closing out losing positions.

For this signal to remain constructive, OI would need to hold above $15 million on any near-term retracement. A drop back below that level would suggest today’s move attracted primarily spot buyers without durable derivatives-backed conviction.
Weekly Fibonacci and Bollinger Bands Create a Decisive Threshold
The weekly chart shows DEXE trading at $12.21, pinned to the 0.5 Fibonacci retracement at $12.17. This level marks the midpoint of the token’s full range between the $0.14 all-time low and the $24.20 all-time high.
A Bollinger Band expansion on the weekly timeframe suggests price is pushing toward the upper band after months of contraction inside a tightening range. However, a declining volume trendline drawn across the weekly chart from October 2024 remains intact.
Price has outpaced volume participation. It suggests the current move may require broader buying to confirm a genuine breakout rather than a temporary spike.
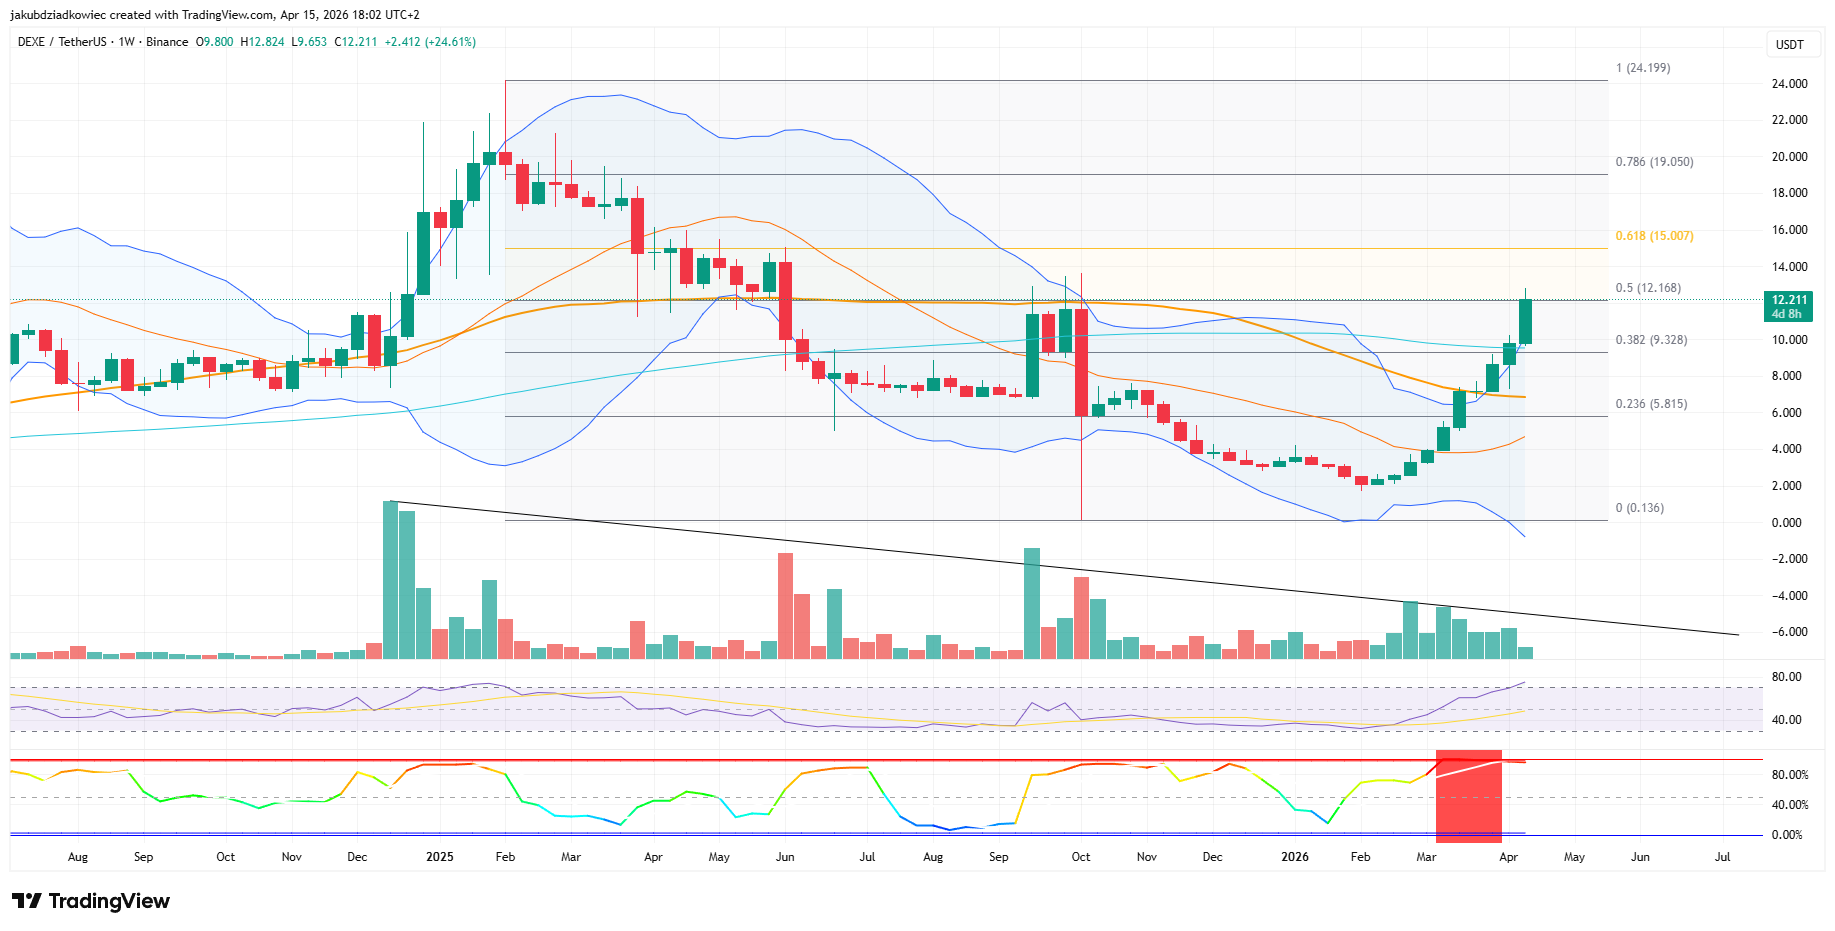
The RSI panel, which had been flagged as oversold in early 2026, has recovered to a neutral-to-bullish position. A confirmed weekly close above $12.17 would set the 0.618 retracement at $15.01 as the next target, the level highlighted in yellow on the chart.
DEXE Price Prediction — $15 Target Hinges on Clearing $13.50
The daily chart shows DEXE entering a red resistance zone spanning approximately $12.50 to $13.50. This zone previously capped the October 2024 rally and is now being tested following a multi-month recovery from the January 2026 lows near $2.50.
Today’s candle opened at $9.97 and reached an intraday high of $12.82. It marks one of the strongest single-session advances of the entire 2026 recovery. A daily close above $13.50 would flip this resistance into support and open the path toward $15.01, aligning with the weekly 0.618 Fibonacci target.
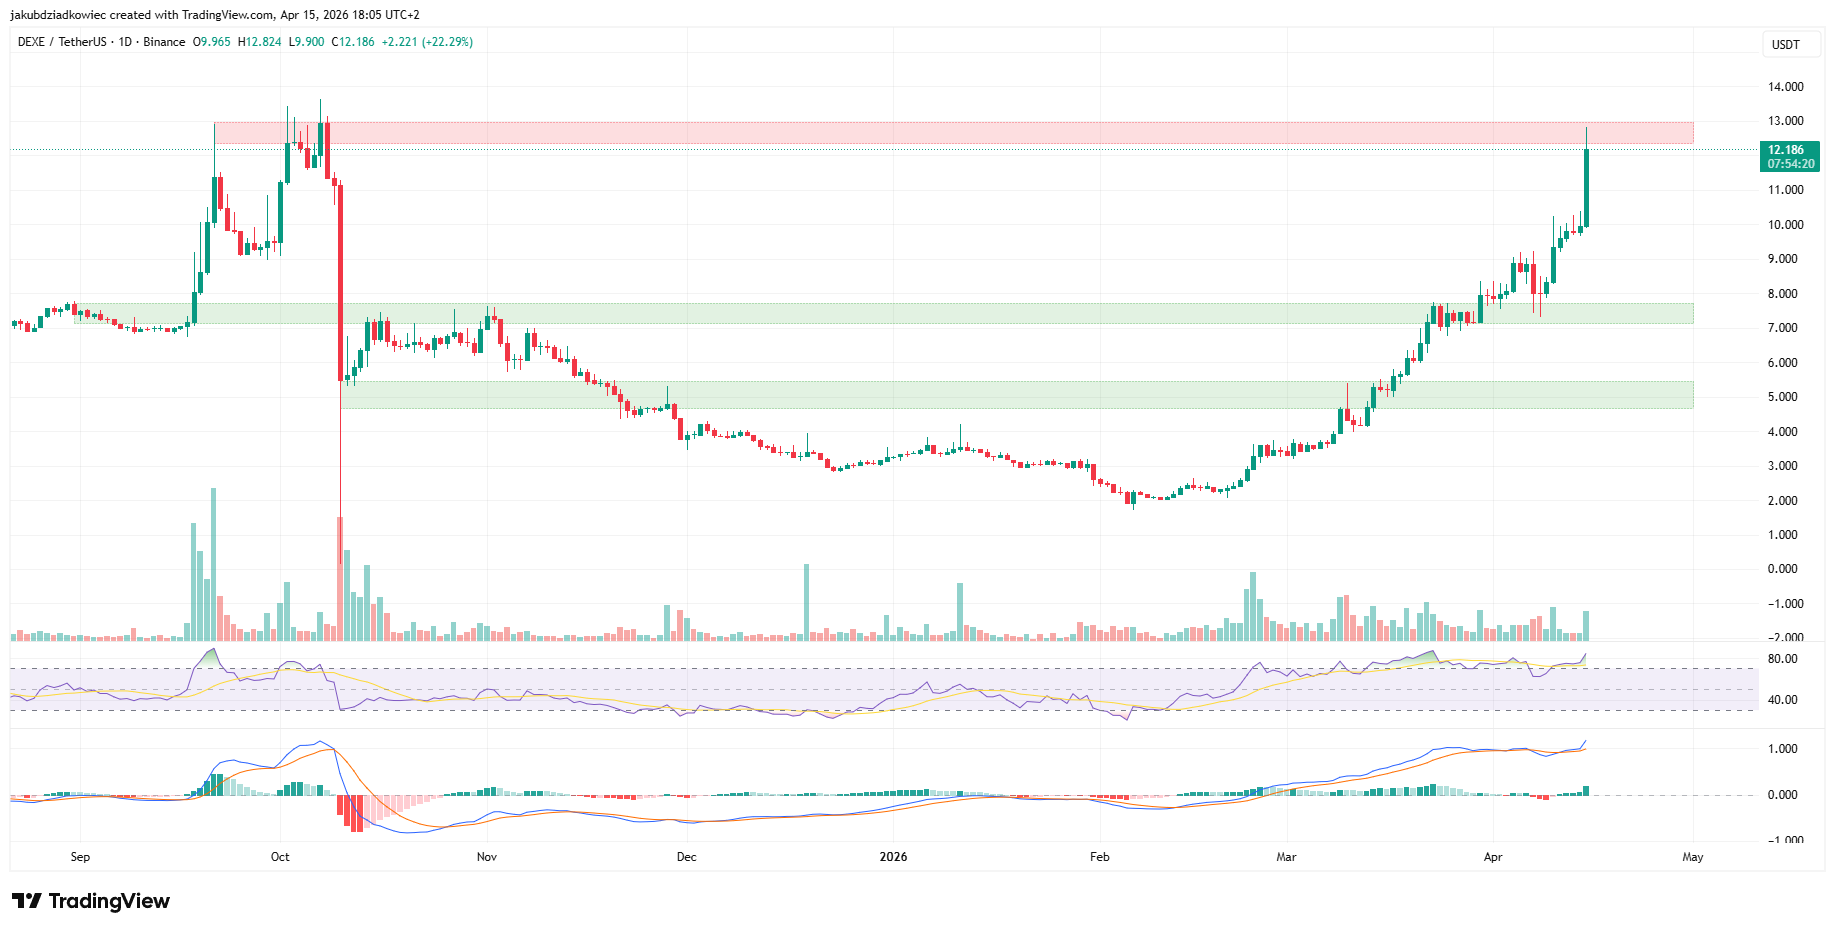
On the downside, a rejection from the red zone would likely send DEXE back toward the upper green support band between $7.00 and $7.80. That zone held price on multiple daily closes throughout the February and March 2026 consolidation.
A deeper pullback would find support in the lower green band between $4.80 and $5.30.
Given the pace of today’s advance, the RSI is likely extended on the daily timeframe. This raises the probability of short-term consolidation before any sustained move above $13.50.
Whether DEXE holds above the red zone or gets rejected will determine whether the recovery from January lows extends toward the mid-$15 range or resets for another base-building phase.
The post DeXe Joins the Altcoin Rally, Price Hits Nearly 1-Year High appeared first on BeInCrypto.
Key takeaways:
-
Institutional ETH accumulation remains robust as Ether ETFs and Bitmine Immersion lead a healthy, spot-driven recovery.
-
Lackluster DApp revenue and negative ETH funding rates suggest that traders are skeptical of the rally.
Ether (ETH) price managed to sustain above $2,300 on Wednesday, distancing itself from the $1,940 lows seen on March 29. The recent rally has caused ETH futures open interest to reach $25.4 billion, indicating increased demand for leveraged positions. The movement suggests a potential turn in momentum for ETH bulls after 10 weeks of failed attempts to reclaim the $2,400 level.

To determine whether the shift in positioning is driven by bulls, one must assess the ETH futures funding rate. The ETH perpetual futures funding rate has failed to hold above 5% since Friday, indicating a lack of confidence among bulls.

The metric has dipped below 0% multiple times, indicating excess demand for bearish leveraged positions. Under neutral conditions, the indicator should range between 5% and 10% to compensate for the cost of capital.
Still, one could argue that such data reinforces that Ether’s recent rally to $2,350 has been sustained by spot demand.

US-listed Ether spot exchange-traded funds (ETFs) accumulated $248 million in net inflows over the past 10 days, validating the thesis of healthy spot-driven Ether bullish momentum. In parallel, the digital asset treasury company Bitmine Immersion (BMNR US) announced the acquisition of $312 million worth of ETH. Bitmine now holds 4.87 million ETH, equivalent to $11.46 billion.
While institutional accumulation is generally a positive sign, Bitmine’s ETH holdings are trading 13% below their acquisition cost, according to CoinGecko data. Similarly, US-listed Ether ETF assets under management stood at $13.7 billion on Wednesday, down from $20.5 billion three months prior. Ether’s failure to reclaim $2,400 also happened as the S&P 500 index jumped to a new all-time high on Wednesday.
Weak Ethereum network activity, increased competition
Part of investors’ reduced appetite for cryptocurrencies can be pinned to the declining activity in decentralized applications (DApps). Almost every corner of the cryptocurrency industry has been negatively impacted by the 2026 bear market, including memecoin token launch platforms, synthetic derivatives trading, collateralized lending, digital collectibles, decentralized exchanges and cross chain bridges.
The few positive highlights, including prediction markets and real-world assets, had no impact on Ethereum network activity. Investors are starting to question whether ETH is well-positioned to capture an eventual surge in demand for DApps, given the emergence of competing blockchains focused on solving specific issues, such as Hyperliquid and Plasma.

Related: ETH/BTC ratio hits 10-week high as Ether outpaces Bitcoin–Are new price highs next?
Ethereum’s weekly DApps revenue has plummeted to $11 million per week, down from $24 million in early February. The primary reason for investors to accumulate ETH is the expectation of higher onchain processing demand and the subsequent burn mechanism, which creates incentives for long-term holding.
Despite the increased demand for ETH futures, derivatives metrics failed to flip bullish. Among the potential causes are the losses in Ethereum strategic reserve companies and increased competition in the DApps industry.
This article is produced in accordance with Cointelegraph’s Editorial Policy and is intended for informational purposes only. It does not constitute investment advice or recommendations. All investments and trades carry risk; readers are encouraged to conduct independent research before making any decisions. Cointelegraph makes no guarantees regarding the accuracy or completeness of the information presented, including forward-looking statements, and will not be liable for any loss or damage arising from reliance on this content.
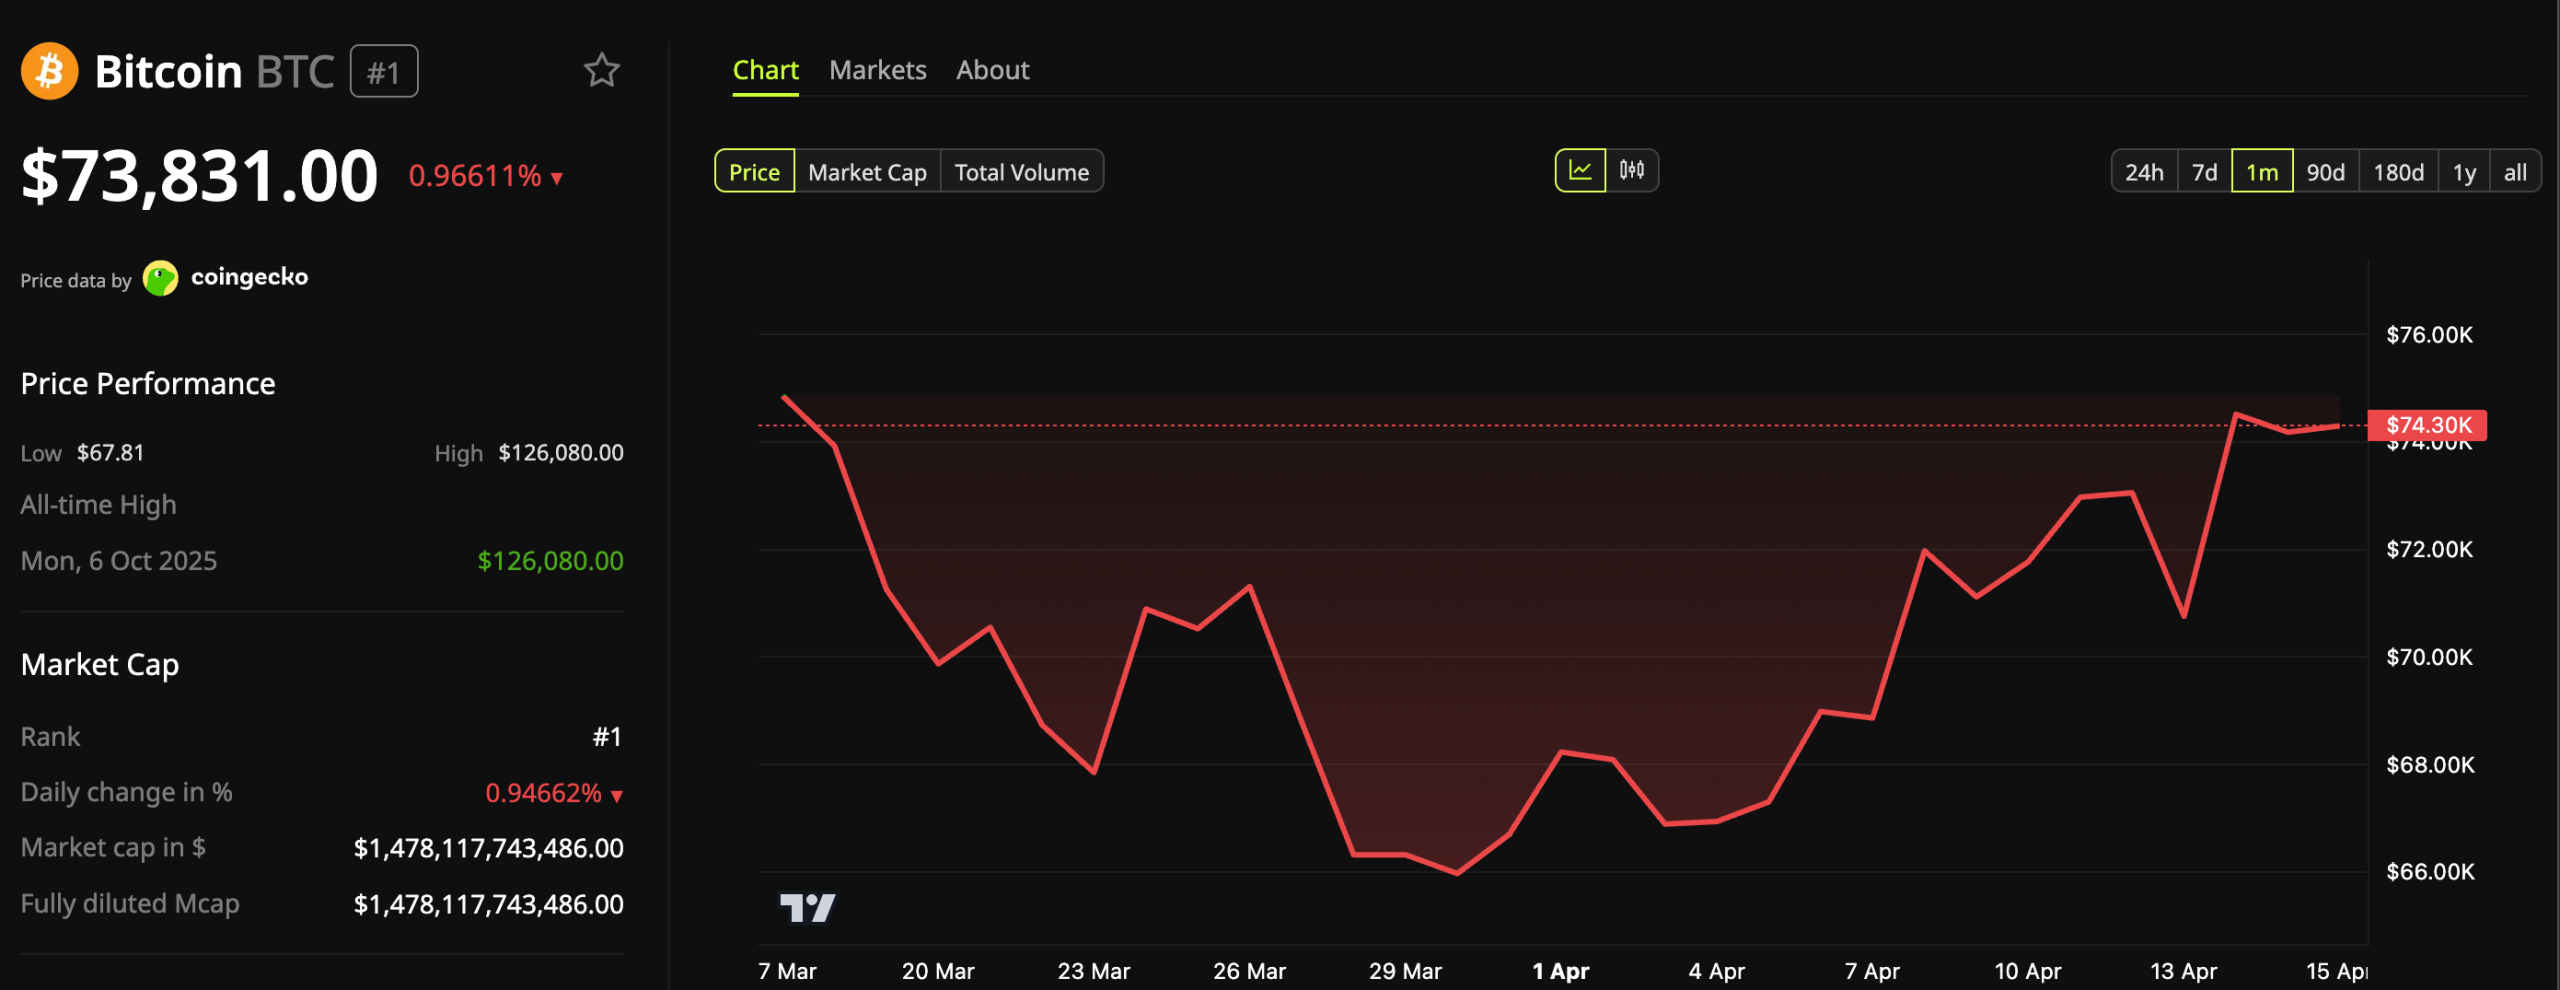
Bitcoin (BTC) has demonstrated notable resilience amid the US-Iran war, climbing over 12% since February 28. As uncertainty grips global markets, one question continues to dominate investor sentiment: has Bitcoin already found its bottom, or is more downside still ahead?
In an interview with BeInCrypto, Benjamin Cowen, CEO of Into The Cryptoverse and former NASA researcher, weighed in on where the market may be headed next.
When Will Bitcoin Bottom?
Cowen explained that Bitcoin’s cycle timing has remained remarkably consistent. He noted that, measured against the two previous cycles, Bitcoin topped within one week of when those earlier cycles peaked.
Based on this pattern, Cowen expects the bottom to arrive roughly a year after the top.
“The base case has to just simply be that it’ll bottom when the other two cycles bottom, which is about a year after the top most likely scenario is October of 2026,” Cowen told BeInCrypto.
He acknowledged a scenario where Bitcoin could bottom as early as May. But for that to happen, there would need to be a massive capitulation event well below what historical midterm years typically produce.
As long as Bitcoin’s year-to-date returns remain within the standard deviation band of prior midterm years, Cowen sees no reason to pivot from the October thesis.
“And if you look at the year-to-date ROI of Bitcoin in 2026 and you compare it to the average of prior midterm years, you throw in a standard deviation on that average. As long as we’re within this band, it’s hard to assume that we’re going to exit the band, especially this early in the midterm year,” he explained.
Subscribe to our YouTube channel to watch leaders and journalists provide expert insights
The outlook aligns with other market analysts’ views. Joao Wedson, CEO of Alphractal, observed that Bitcoin’s cycle top occurred 534 days after the April 2024 halving, the shortest cycle peak compared to the previous one.
Based on this decaying pattern across cycles, his analysis suggests the market bottom could emerge roughly 912 to 922 days after the halving, pointing to a timeframe in late September or early October 2026.
Estimates from CryptoQuant broadly support this view, with models indicating a potential bottom between June and December 2026, and September through November as the most probable window.
Why This Cycle Topped on Apathy, Not Euphoria
One of Cowen’s key observations is that while Bitcoin’s peak in the current cycle aligns with previous timelines, it emerged under very different conditions.
He noted that in 2017 and 2021, Bitcoin peaked amid widespread retail euphoria. This, in turn, triggered a rotation into altcoins after it topped.
This time, social interest in crypto has been trending down since 2021. Bitcoin topped on apathy, and as a result, the usual altcoin rotation did not materialize.
“This is a cycle where Bitcoin topped on apathy rather than euphoria, and the only other time it topped on apathy was actually back in 2019. When you top on apathy, you don’t get that same rotation,” he mentioned.
Follow us on X to get the latest news as it happens
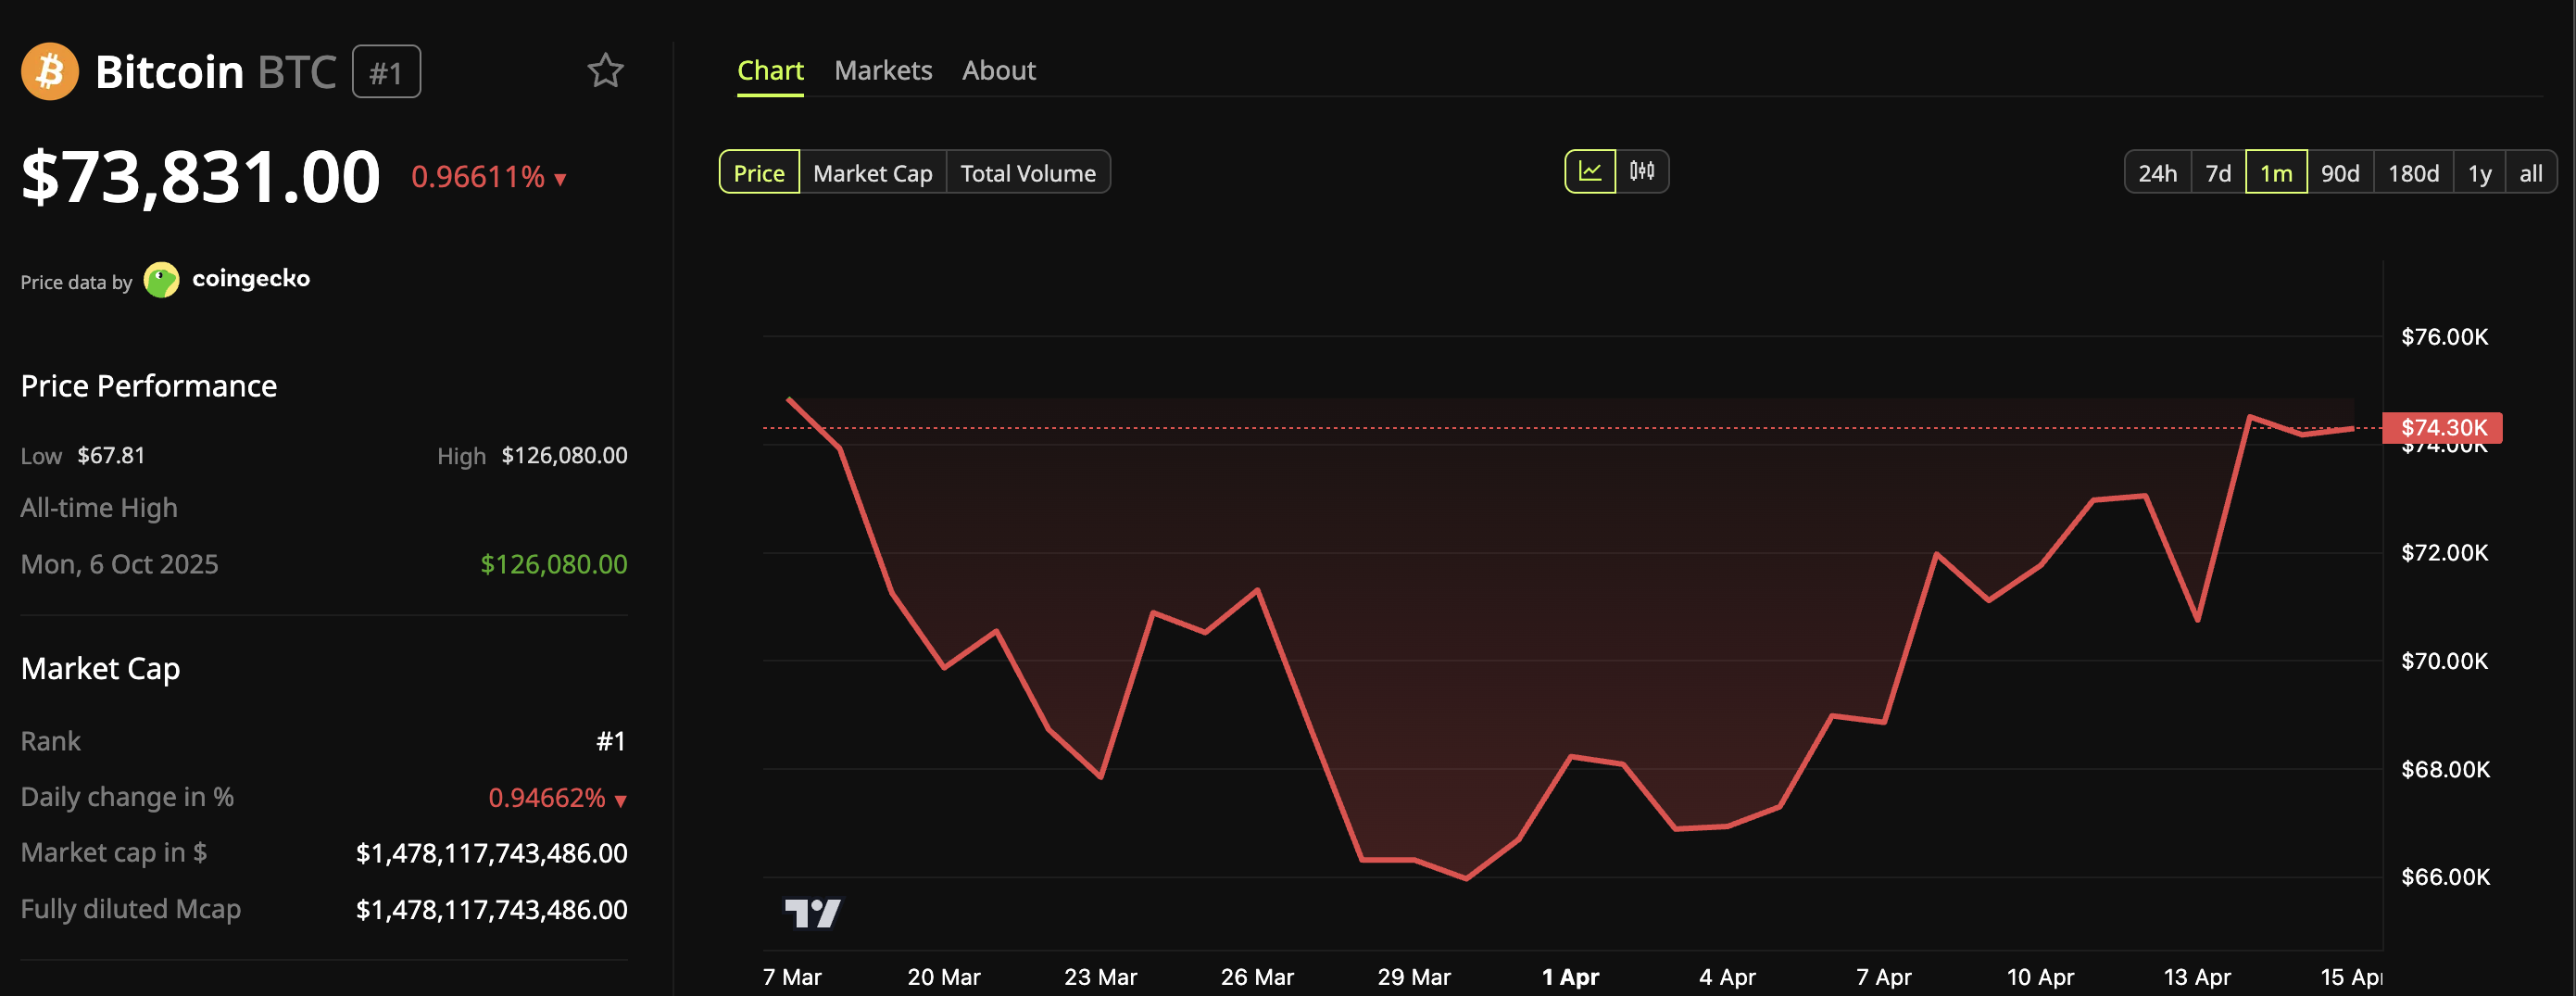
Overall, Cowen maintained his view that the four-year cycle remains intact. Bitcoin is currently trading at $73,831, still more than 40% below its October 2025 all-time high near $126,000. If Cowen’s analysis holds, further downside may still be ahead before the cycle finds its floor.
The post When Will Bitcoin Price Bottom Out? Benjamin Cowen Predicts appeared first on BeInCrypto.

Chainlink price is at $9.32 on April 15, up 1.64% on the 4H session, after clearing all four SMAs simultaneously for the first time since the February decline, with the ribbon compressed into a $0.14 band before the breakout and the 4H MACD holding a positive crossover above the zero line.
Summary
- Chainlink price is at $9.32 on April 15, +1.64% on the 4H chart, after breaking above a compressed four-SMA ribbon where SMA 20 at $9.01, SMA 50 at $8.99, SMA 100 at $8.87, and SMA 200 at $8.98 all converged within a $0.14 range.
- The 4H MACD (12,26,9) has printed a bullish crossover with the histogram at +0.02, the MACD line at 0.07, and the signal at 0.05, with both lines above zero, confirming momentum acceleration rather than simple exhaustion reduction.
- A 4H close above the annotated $9.99 resistance confirms a breakout and opens the $10 to $11 zone; a return close below the SMA 20 at $9.01 signals the breakout has failed and extends the consolidation.
Chainlink (LINK) price is at $9.32 on April 15, up 1.64% on the 4H Binance chart, as price has broken above a fully compressed SMA ribbon consisting of SMA 20 at $9.01, SMA 50 at $8.99, SMA 100 at $8.87, and SMA 200 at $8.98. The four moving averages converged into a $0.14 range before the breakout, a degree of compression that is unusual across timeframes and typically precedes a significant directional expansion. The 4H volume of 481.04K LINK confirms active participation in the move rather than a lowvolume drift above the ribbon.
The breakout comes as an ascending trendline from the February 2026 lows continues to hold below, connecting successive higher lows across the recovery from the nearterm bottom. Price has been above this trendline throughout the current advance and the trendline has absorbed each pullback during April without a confirmed 4H close below it.
SMA ribbons compress when the rate of price change equalizes across multiple timeframes, producing a coillike structure where all moving averages converge toward a single price cluster. The compression in the Chainlink 4H ribbon, where four SMAs converged within $0.14 of each other, represents one of the tightest SMA clusters recorded for LINK in the current cycle. When price breaks above a fully compressed ribbon on volume, as Chainlink has done on April 15, the compression typically resolves into a directional expansion in the direction of the breakout.
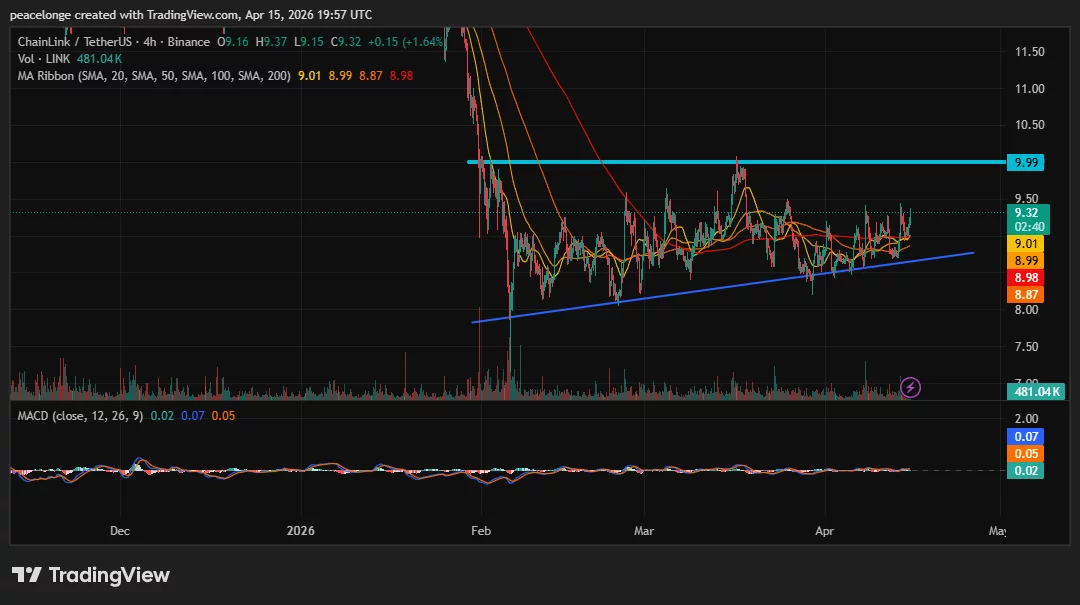
The 4H MACD (12,26,9) has confirmed a bullish crossover with the MACD line at 0.07 and signal at 0.05, both above zero. The histogram at +0.02 is positive and expanding. A MACD crossover that occurs with both lines above the zero line is a stronger signal than a subzero crossover, because it reflects genuine upward acceleration rather than a slowdown in selling pressure. Solana and XRP printed subzero MACD crossovers on April 14; the Chainlink 4H crossover occurring above zero distinguishes the quality of the current momentum signal.
Analysts at FXStreet noted on April 10 that Chainlink’s Open Interest-Weighted Funding Rate turned positive at 0.0042%, with traders building long positions as the token tested the SMA cluster. The positive funding rate maintained through a period of broader market uncertainty confirms the long bias in LINK derivatives has persisted through the consolidation and into the current breakout attempt.
Key Levels: Support, Resistance, and Price Targets
The compressed SMA cluster between $8.87 and $9.01 is now the support zone. A 4H close back below $9.01 returns price inside the ribbon and indicates the breakout has failed. A 4H close below $8.87, the SMA 100 and floor of the ribbon, is the full invalidation level and would shift the structure back to ranging.
The annotated horizontal resistance at $9.99 is the immediate target and the level that has capped multiple 4H rallies since February. A confirmed 4H close above $9.99 clears this ceiling and opens the $10 to $11 zone as the primary bull case target. An extended move through $11 brings the $12 area into focus, where the 200-day EMA on the daily chart sits.
Invalidation: a 4H close below $8.87.
On-Chain and Market Data Context
Coinglass data shows Chainlink open interest at $361.55 million, with 24-hour futures volume of $361.51 million. The near-equal ratio of open interest to daily futures volume indicates active position turnover rather than static exposure, suggesting traders are actively repositioning around the breakout level. Approximately $42,599 in Chainlink futures positions were liquidated in the past 24 hours, a small figure confirming the move is not driven by a short squeeze. A breakout built on genuine buying rather than forced short covering historically produces more durable price continuation.
Chainlink controls approximately 64% of the oracle market, with over $41 billion in total value secured and a $644 million buyback program supporting longterm token demand.
If LINK maintains 4H closes above the SMA ribbon cluster at $8.87 to $9.01 and the ascending trendline holds, a test of the $9.99 annotated resistance is the primary nearterm target. A confirmed close above it opens $10 to $11 as the extended bull case.

CoreWeave, a publicly traded AI cloud infrastructure provider, announced a $6 billion deal with quantitative trading firm Jane Street to power its trading and research operations with CoreWeave’s AI-focused cloud compute. In a separate move, Jane Street bought $1 billion worth of CoreWeave Class A common stock at $109 per share. The news lifted CoreWeave’s stock modestly, with shares trading around $119.04 after the announcement and up about 1.5% for the session, according to Yahoo Finance.
The agreement arrives just days after CoreWeave revealed a partnership with Anthropic to run Claude AI models on its infrastructure, underscoring the company’s rapid pivot from crypto mining to high-performance AI compute.
CoreWeave’s strategic shift, which has positioned the company as a leading player in what Bernstein researchers describe as the “neocloud” — GPU-powered cloud services tailored for AI workloads — highlights how miners and crypto-focused operators are repurposing assets to tap growing demand for AI computing power in a climate of tightening crypto margins.
Key takeaways
- Jane Street’s $6 billion AI cloud agreement with CoreWeave signals robust demand for GPU-accelerated compute in quantitative trading and research.
- The $1 billion equity investment at $109 per share cements a long-term alliance and injects strategic capital into CoreWeave’s expansion.
- Market reaction was modest but positive, with CoreWeave’s shares rising about 1.5% to the low-$120s range after the news.
- The Anthropic deal, announced a week earlier, reinforces CoreWeave’s role as a preferred compute backbone for leading AI developers powering large language models like Claude.
- Analysts at Bernstein describe CoreWeave as a standout in the neocloud space, supported by a diversified revenue base and prominent AI model providers already using its platform.
Jane Street’s AI compute pact: scale, scope, and implications
At the core of the announcement is a multi-year, multi-facility arrangement in which Jane Street will leverage CoreWeave’s data-center footprint to run its trading and research workloads. The announcement notes that compute will be sourced from several CoreWeave facilities, illustrating a broad deployment rather than a single-site reliance. While terms other than the $6 billion compute commitment remain undisclosed, the scale signals Jane Street’s intent to anchor its research and execution capabilities in a GPU-optimized cloud environment tailored to AI and data-intensive tasks.
The arrangement aligns with a broader industry trend where quantitative trading desks increasingly seek cloud-native, GPU-accelerated infrastructure to run complex simulations, backtests, and AI-driven research. CoreWeave has positioned itself as a fit-for-purpose provider in this space, differentiating itself from traditional cloud players by focusing on high-performance GPU workloads that underpin modern AI and ML models.
According to CoreWeave’s own disclosure, the collaboration will leverage the company’s emerging neocloud framework, which Bernstein describes as GPU-driven cloud services built specifically to power AI workloads. This is a key element in understanding why major AI and finance players are gravitating toward CoreWeave: the underlying compute is designed for the heavy lifting demanded by model training, inference, and data-intensive research tasks.
Equity investment deepens the alliance
In conjunction with the compute deal, Jane Street also expanded its stake in CoreWeave by purchasing $1 billion of Class A common stock at $109 per share. The combination of a sizable equity investment and a long-term compute agreement not only strengthens Jane Street’s access to CoreWeave’s hardware and software stack but also signals confidence in CoreWeave’s ability to scale its AI cloud offerings across diverse customer segments.
Market observers will watch how this equity infusion influences CoreWeave’s capital structure and growth trajectory as it accelerates its data-center expansion and product development efforts. The immediate stock move—while modest—reflects investor recognition of a potentially meaningful shift in CoreWeave’s revenue mix toward AI compute contracts alongside on-demand services.
AI compute and the neocloud thesis
CoreWeave’s pivot from crypto mining to AI cloud computing began years before many peers embraced AI-centric infrastructure. Analysts from Bernstein have highlighted CoreWeave’s ahead-of-the-curve positioning in the “neocloud” segment, a term they use to describe GPUs-based cloud providers optimized for AI workloads. The firm’s assessment suggests that CoreWeave has developed a high-quality commercial base relative to competitors such as IREN and Nebius, with a diversified mix of contract-based and on-demand revenue streams.
Among the evidence cited by Bernstein is CoreWeave’s widespread adoption among leading AI model providers. The company has stated that nine of the top 10 AI model developers now leverage its platform, reflecting deep engagement across the AI ecosystem. This broad footprint helps explain the market’s receptivity to the Jane Street deal and the Anthropic partnership, collectively reinforcing CoreWeave’s central role in the AI compute market.
The Anthropic collaboration, announced just days before the Jane Street deal, positioned Claude AI, Anthropic’s flagship model, to run on CoreWeave’s infrastructure. That partnership mirrors a broader industry pattern: AI developers are seeking dependable, scalable compute backbones capable of handling the demanding workloads of large-language models as they scale commercially.
For observers, these developments highlight a meaningful shift in the capital allocation and strategic priorities of AI infrastructure players. CoreWeave’s ability to translate early-mover advantages in the neocloud niche into multi-faceted revenue streams — including long-term compute commitments and equity stakes from major customers — could help it navigate a competitive landscape that features both traditional cloud giants and specialized GPU-focused operators.
From crypto mining to AI compute: what changes, what remains uncertain
CoreWeave’s transformation reflects a broader trend in which crypto-mining infrastructure operators repurpose assets to support high-performance computing and AI workloads. The company’s narrative has shifted from crypto mining to AI compute leadership, a move that appears to be gaining traction given the scale of the deals and the caliber of customers joining its ecosystem. Earlier reporting in the industry has highlighted this transition as a strategic hedge against crypto market volatility and shrinking margins.
Industry observers have pointed to CoreWeave’s long-standing emphasis on GPU-accelerated workloads as a differentiator, positioning it to capture a growing share of enterprise AI compute demand. Bernstein’s analysis suggests that CoreWeave’s commercial machine stands out among neocloud peers, a dynamic that could sustain growth as AI adoption accelerates across finance, tech, and enterprise segments. Still, several uncertainties linger: how deeply CoreWeave’s reliance on marquee clients extends, how competition evolves among GPU-centric cloud providers, and how macro shifts in AI model licensing and deployment affect long-term demand for dedicated AI compute capacity.
For investors and builders, the key takeaway is that CoreWeave’s dual-track strategy — large-scale compute agreements with premier trading firms and strategic equity partnerships with those same customers — could yield a more resilient revenue base. The company’s continued expansion of data-center capacity, its ability to attract top AI developers, and its execution in the neocloud niche will be critical to watch as AI workloads continue to escalate in scale and sophistication.
What to watch next
Market participants will be watching how CoreWeave scales its data-center footprint to accommodate increasing demand from both financial services and AI developers. The pace of expansion, the retention of high-profile customers, and the company’s ability to maintain favorable terms across long-duration compute contracts will be important indicators of its trajectory. Additionally, any further partnerships in the AI space and potential updates on the rollout of Claude and other models on CoreWeave’s infrastructure will help clarify how the neocloud thesis plays out in practice. Investors should monitor regulatory developments around AI compute, potential shifts in cloud pricing, and how CoreWeave’s balance sheet evolves as it funds growth through both debt and equity financings.


Two suspects were arrested in San Francisco after allegedly firing at OpenAI CEO Sam Altman’s home early Sunday morning, the second attack on the property in three days, as federal and local prosecutors escalate charges against a separate suspect from an earlier Molotov cocktail incident.
Summary
- Amanda Tom, 25, and Muhamad Tarik Hussein, 23, were arrested April 13 after a Honda sedan stopped outside Altman’s North Beach property and a round was allegedly fired from the passenger window.
- Days earlier, 20-year-old Daniel Moreno-Gama was charged with attempted murder after throwing a lit incendiary device at Altman’s home before moving on to threaten to burn down OpenAI’s headquarters.
- Moreno-Gama was carrying a three-part manifesto detailing anti-AI beliefs and listing names and addresses of AI executives, board members, and investors.
OpenAI CEO Sam Altman’s San Francisco home was targeted for a second time in three days on April 13, when a Honda sedan carrying two people stopped outside the property on Lombard Street and a shot was allegedly fired from the passenger window. The San Francisco Police Department arrested Amanda Tom, 25, and Muhamad Tarik Hussein, 23, who were booked on charges of negligent discharge of a firearm. Three firearms were seized from their home following a warrant.
No injuries were reported in either incident.
The first attack occurred in the early hours of April 10, when 20-year-old Daniel Moreno-Gama, a Texas resident, allegedly threw a lit Molotov cocktail at the driveway gate of Altman’s home, setting it on fire. He then walked to OpenAI’s Mission Bay headquarters and struck the glass doors with a chair while threatening to “burn it down and kill anyone inside.” He was arrested at the scene.
The FBI described the first attack as “planned, targeted and extremely serious.” Federal and local prosecutors charged Moreno-Gama with attempted murder of both Altman and his security guard, attempted arson, possession of an unregistered firearm, and attempted destruction of property by means of explosives. The US Attorney for the Northern District of California said domestic terrorism charges may also follow.
Who Was Behind the First Attack
Moreno-Gama was found carrying a document that detailed his opposition to artificial intelligence and explicitly named Altman as a target. The manifesto stated his belief that AI posed a risk of human extinction and listed the names and addresses of multiple AI executives, board members, and investors. He had reportedly published similar views on a personal Substack prior to the attack.
His public defender said he appeared to have experienced an “acute mental health crisis.” Altman posted a photo of his family on his blog shortly after the first attack, writing that he “underestimated the power of words and narratives” and calling for de-escalation of AI-related rhetoric.
The Broader Pattern of Anti-AI Violence
The two incidents at Altman’s home are part of a wider pattern of hostility toward AI infrastructure. A city councilman in Indianapolis was shot at 13 times after voicing support for a data center project. A town near St. Louis voted out its entire incumbent council after approving a data center. Experts have drawn parallels to the Luddite backlash of the Second Industrial Revolution.
The attacks come as OpenAI sits at the center of a high-stakes race in enterprise AI, where it has been losing ground to Anthropic across key corporate accounts, while simultaneously finalizing an AI cybersecurity product for limited partner release. The company is valued at over $850 billion and is targeting an IPO this year.
“There is no place in our democracy for violence against anyone, regardless of the AI lab they work at or side of the debate they belong to,” OpenAI said in a statement following the first attack.
TLDR
- Bitdeer increased its self-mining hashrate to 70 EH/s in March 2026 and led peers by computing power.
- Bitdeer produced 661 self-mined bitcoins in March, marking a 480% increase from the previous year.
- The company expanded its total hashrate under management to 78.1 EH/s by the end of March.
- Bitdeer controls about 225,000 self-owned mining rigs out of 262,000 machines under management.
- The firm is scaling toward 3.0 gigawatts of global energy capacity across active and planned sites.
Bitdeer expanded its self-mining capacity to 70 EH/s in March 2026 and led global peers by compute power. The company produced 661 self-mined bitcoins during the month, marking a 480% increase year over year. It also increased total hashrate under management to 78.1 EH/s, while advancing its AI infrastructure business.
Bitdeer Expands Fleet and Energy Capacity
Bitdeer reported 661 self-mined bitcoins in March 2026, up 480% from last year. The company raised its self-mining hashrate to 70 EH/s during the month. It stated that this level made it the largest miner by computer power.
Earlier, Bitdeer reported 71 EH/s in total hashrate under management at year-end. At that time, its self-mining capacity stood at 55.2 EH/s. Now, the total managed hashrate has increased to 78.1 EH/s, including hosted machines.
The firm controls about 225,000 self-owned rigs out of 262,000 machines under management. It also continues expanding toward 3.0 gigawatts of global energy capacity. This figure includes both active operations and projects in the pipeline.
The global Bitcoin hashrate stands at about 855 EH/s, according to The Block data. Although the network recorded a quarterly decline, capacity remains elevated compared to past levels. Bitdeer increased deployed power even as network conditions shifted.
The company also advanced its AI Cloud operations during March. It reported AI Cloud utilization of 94%, up from 64% in February. Annual run rate for AI Cloud reached about $43 million, rising 105% month over month.
Matt Kong, Chief Business Officer, addressed the update. He said, “This momentum underscores both the scale of the market opportunity and our ability to execute effectively.” The company confirmed continued deployment of high-performance AI infrastructure.
Bitdeer continues introducing new mining hardware into its fleet. It finalized assembly plans for the SEALMINER A4 series, which reports efficiencies near 9.45 J/T. In February, it launched the SEALMINER DL1 Air series for Scrypt-based networks.
CleanSpark and Canaan Report March Output
CleanSpark produced 658 bitcoins in March and raised its year-to-date total to 1,799 BTC. The company reported an operating hashrate of 50 EH/s at month-end. It also recorded an average operating hashrate of 47.3 EH/s.
The firm deployed 224,473 mining machines across its portfolio. Its fleet achieved a peak efficiency of 16.07 J/Th. Management stated that the average monthly hashrate increased by 11% during the quarter.
CleanSpark controls more than 1.8 gigawatts of power, land, and data centers in the United States. Of that total, it currently utilizes 808 megawatts. CEO Matt Schultz confirmed expansion efforts into AI and high-performance computing.
He said the company is making “headway toward securing our first hyperscale customer.” The firm continues discussions with potential AI infrastructure clients. It maintains focus on both mining output and data center utilization.
Canaan reported production of 89 BTC in March. Its crypto holdings reached 1,808 BTC and 3,952 ETH at month-end. The company deployed 10.97 EH/s, excluding 4.4 EH/s from a joint venture.
Canaan purchased Cipher Mining’s 49% equity interest in three West Texas facilities in February. Its global installed power capacity reached 266.3 megawatts. Joint ventures contributed another 120 megawatts to total capacity.
CEO Nangeng Zhang commented on the update. He said, “We continued to grow our deployed hashrate and installed power capacity.” The company added over 10 megawatts during March.

J.J. Abrams’ Sleek Sci-Fi Blockbuster Is No Match for ‘Project Hail Mary’ at the Box Office

How America Is Losing the World | Lunch Money with Paul Krugman and Heather Cox Richardson

Alzheimer’s drugs ‘make no meaningful difference to patients’, say researchers

Why Israel is blocking foreign journalists from entering

Bitcoin: We’re Entering The Most Dangerous Phase

Alan Cumming Brands Baftas Ceremony A ‘Triggering S**tshow’
How America Is Losing the World | Lunch Money with Paul Krugman and Heather Cox Richardson

Michael Saylor Predicts $400T Bitcoin After Buying $1B in a Single Day!

Picture Books to teach kids Financial Literacy – Personal Finance Picture Books
-

 Politics5 days ago
US brings back mandatory military draft registration
-
 Sports5 days ago
Man United discover Nico Schlotterbeck transfer fee as defender reaches Dortmund agreement
-

 Fashion5 days ago
Weekend Open Thread: Veronica Beard
-

 Politics6 days ago
Malcolm In The Middle OG Turned Down ‘Buckets Of Money’ To Appear In Reboot
-

 Politics3 days ago
World Cup exit makes Italy enter crisis mode
-

 Crypto World7 days ago
Canary Capital Files SEC Registration for PEPE ETF
-

 Business5 days ago
Tesla Model Y Tops China Auto Sales in March 2026 With 39,827 Registrations, Beating Cheaper EVs and Gas Cars
-

 Crypto World2 days ago
The SEC Conditionalises DeFi Platforms to Be Avoided for Broker Registration
-

 Crypto World2 days ago
SEC Signals Exemption for Crypto Interfaces From Broker Registration
-

 News Videos17 hours ago
Secure crypto trading starts with an FIU-registered
-
 NewsBeat3 days ago
Pep Guardiola and Gary Neville agree over Arsenal title problem that benefits Man City
-

 Business6 days ago
OpenAI Halts Stargate UK Data Centre Project Over Energy Costs and Copyright Row
-

 Business4 days ago
Ireland Fuel Protests Enter Day 5 as Blockades Spark Shortages and Government Prepares Support Package
-

 Politics6 days ago
LBC Presenter Mocks Trump Over Iran War Failures
-

 Crypto World5 days ago
Federal judge blocks Arizona from bringing criminal charges against Kalshi
-
 NewsBeat4 days ago
JD Vance announces ‘no agreement’ with Iran over nuclear weapons fear
-

 Crypto World2 days ago
SEC Proposes Certain Crypto Interfaces Don’t Need to Register as Brokers
-

 NewsBeat2 days ago
Trump and Pope Leo: Behind their disagreement over Iran war
-

 Tech6 days ago
A version of Windows 10 released a decade ago is now eligible for additional security patches
-

 Business5 days ago
IMF retains floor for precautionary balances at SDR 20 billion
You must be logged in to post a comment Login