
Crypto World
Bitcoin Price Faces $75,000 Barrier, Eyes $85,000 Target
TLDR
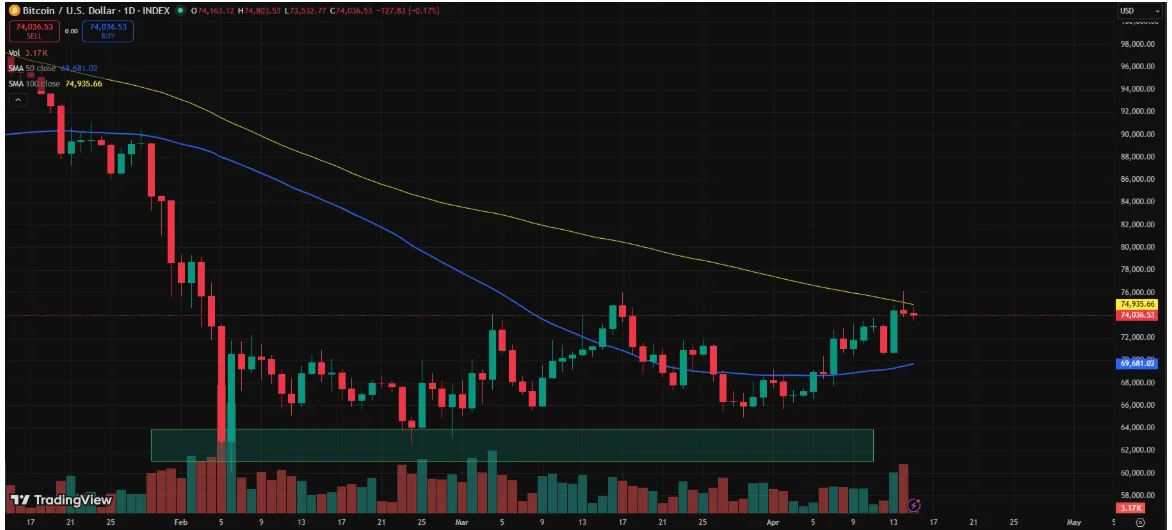
- Bitcoin climbed to $76,100 but failed to close above the $75,000 resistance level.
- The asset ended the session at $74,164 after sellers defended the key supply zone.
- Bitcoin rebounded 15.8% from $65,692 earlier this month before pulling back.
- The $72,000 level continues to act as short-term support for the current range.
- The 50-day moving average at $69,680 could provide support if the price declines.
Bitcoin price faced renewed selling pressure near $75,000 after another failed breakout attempt. The asset reached $76,100 on Tuesday but closed below resistance. Despite the pullback, technical indicators still show room for further upside.
Bitcoin Price Tests $75,000 Resistance Again
Bitcoin (BTC) climbed to $76,100 on Tuesday, marking its highest level since early February. However, sellers pushed the price down before the daily close. The asset ended the session at $74,164 after failing to hold above $75,000.
Earlier this month, Bitcoin rebounded from $65,692 and gained 15.8% to reach the recent peak. It has since retained about 8.45% of that advance. On March 17, Bitcoin also touched $76,000 but fell back to $73,920 after facing strong supply.
The repeated rejection at $75,000 confirms the level as firm resistance. Sellers continue to defend the zone, which limits upward movement. Bitcoin trades at $74,036 at the time of writing.
The price also encountered the 100-day simple moving average near the resistance zone. This moving average stands at $94,935 and adds technical pressure. As a result, bulls failed to secure a daily close above the barrier.
Failure to break resistance increases the risk of a decline toward $68,000 and $65,000. The 50-day moving average at $69,680 could provide support if the price drops. Market structure remains dependent on holding key levels.
Bitcoin Price Holds $72,000 Support as Indicators Stay Positive
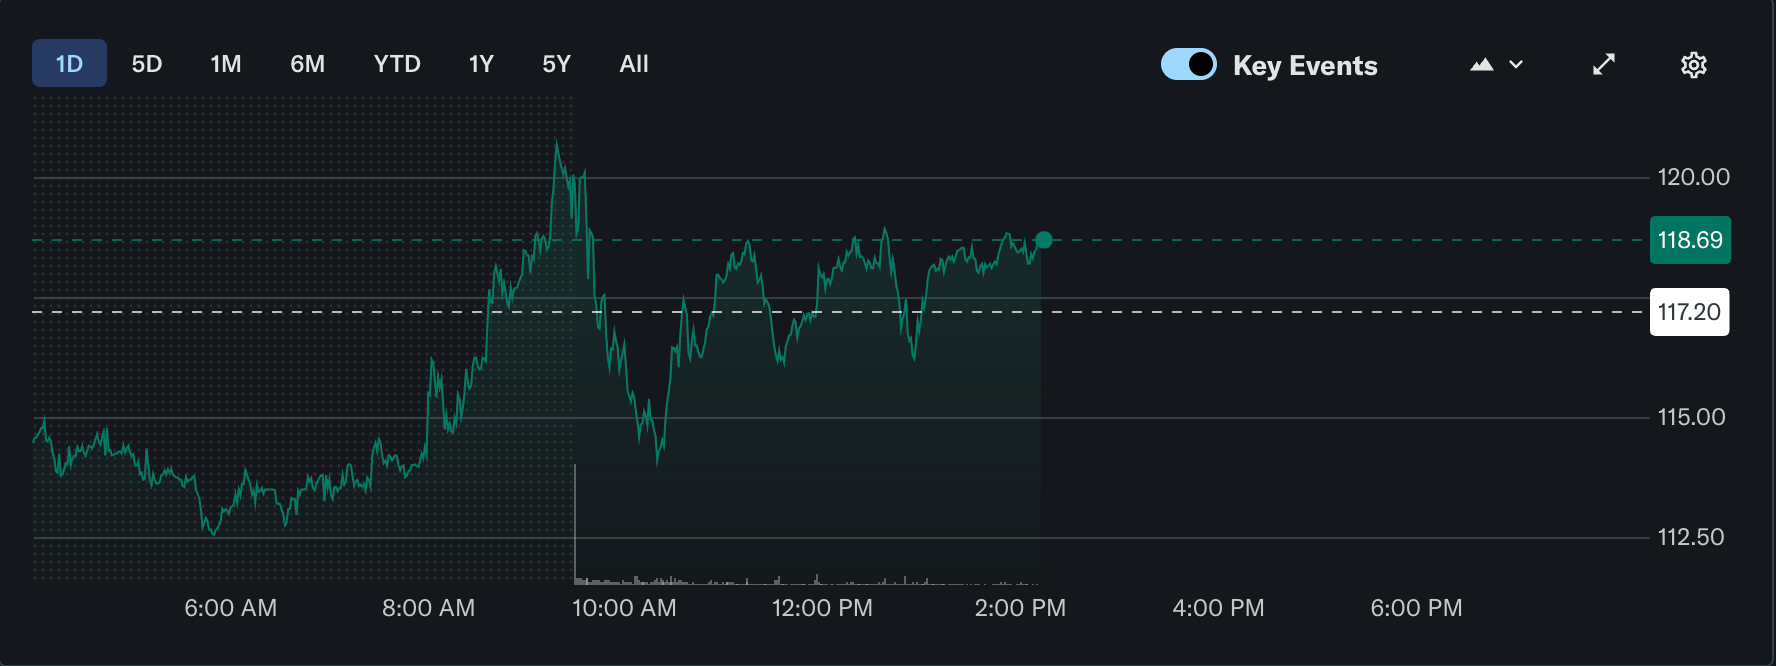
Bitcoin price continues to hold the $72,000 micro support level identified by analyst Michael van de Poppe. He stated, “Holding $72,000 opens the path toward a new breakout.” The level now acts as a short-term foundation.
Van de Poppe projected a move toward $80,000 to $85,000 if Bitcoin closes above $75,000 with strong volume. He said the move could occur before the end of April. Such a rally would return Bitcoin to levels last seen in late January.
The daily Relative Strength Index stands at 60.74, which signals room before overbought conditions above 75. The reading reflects steady momentum without extreme conditions. Buyers still maintain control under current levels.
The Moving Average Convergence Divergence also supports bullish momentum. The MACD line reads 1,201.91 and remains above the signal line at 590.84. Green histogram bars continue to expand on the daily chart.
Bitcoin must secure a decisive close above $75,000 to confirm renewed upward momentum. Until then, the price remains within a defined range. Current data shows Bitcoin trading at $74,036.


Key points:
-
Bitcoin’s shallow pullback from the $76,000 resistance suggests that buyers are holding onto their positions, expecting the recovery to continue.
-
Select major altcoins are showing strength and are expected to break above their overhead resistance levels.
Bitcoin (BTC) pulled back after crossing the $76,000 level on Tuesday, but a positive sign is that bulls have not let the price dip below $73,500. That suggests the bulls are holding their positions as they expect the overhead resistance to be broken.
Another encouraging indication for the bulls is that BTC’s move toward $76,000 has been supported by $411.5 million in inflows into US spot BTC exchange-traded funds on Tuesday, according to SoSoValue data. That pushes the total net flows for 2026 into the positive territory at roughly $245 million.

While some analysts believe the bottom has been reached at $60,000, others remain skeptical. They anticipate BTC to collapse below $60,000 to as low as $50,000 before finally bottoming out.
Trend reversals could be tricky, but traders should be nimble when they spot one. Maintaining a negative view when the charts are screaming bullish is a recipe for disaster.
Could BTC and select major altcoins break above their overhead resistance levels? Let’s analyze the charts of the top 10 cryptocurrencies to find out.
Bitcoin price prediction
BTC turned up from the 20-day exponential moving average ($71,116) on Monday and reached the $76,000 resistance on Tuesday.

Sellers are expected to protect the $76,000 level with all their might, as a close above it will complete a bullish ascending triangle pattern. That clears the path for a rally to the $84,000 level.
Conversely, any pullback is expected to find support at the 20-day EMA. If the BTC price rebounds off the 20-day EMA with force, it suggests a positive sentiment. That enhances the prospects of a break above the $76,000 resistance. Sellers will be back in control on a close below the support line of the triangle.
Ether price prediction
Ether (ETH) is facing resistance at $2,415, but a positive sign is that the bulls have not ceded much ground to the bears.

The prospects of a break above the $2,415 level increase if the ETH price turns up from the current level or the 20-day EMA ($2,198). The ETH/USDT pair may then surge to $2,800 and then to $3,050.
Sellers have an uphill task ahead of them. They will have to quickly pull the price below the moving averages to weaken the bullish momentum. The pair may then decline to the $1,916 support.
XRP price prediction
Buyers are struggling to drive XRP (XRP) above the 50-day simple moving average ($1.37), indicating that the bears are active at higher levels.

If the price turns down and dips below the 20-day EMA ($1.35), it may signal that the XRP/USDT pair consolidates between the 50-day SMA and $1.27 support for a few days. A break and close below the $1.27 level tilts the advantage in favor of the bears.
Contrarily, a close above the 50-day SMA signals the start of a sustained recovery toward the downtrend line of the descending channel pattern. Buyers will be back in the driver’s seat on a close above the downtrend line.
BNB price prediction
BNB (BNB) reached the 50-day SMA ($626) on Tuesday, where the bears are posing a strong challenge.

If bulls do not give up much ground from the current level, the possibility of a break above the 50-day SMA increases. The BNB/USDT pair may then rally to the $687 overhead resistance. Buyers will have to overcome the $687 barrier to clear the path for a rally to $730, then to $790.
On the downside, a close below the $570 support signals that the bears have seized control. The pair may then start the next leg of the downtrend toward $500.
Solana price prediction
Solana’s (SOL) failure to rise above the 50-day SMA ($85) suggests that the bears are fiercely guarding the level.

The flattish moving averages and the relative strength index (RSI) near the midpoint do not provide a clear advantage to either the bulls or the bears. That suggests the SOL/USDT pair may continue consolidating within the $76 to $98 range for a while.
The next trending move is expected to begin on a close above $98 or below $76. If the SOL price turns down and breaks below $76, it indicates an advantage to bears. The pair may then drop to $67. On the upside, a close above $98 opens the doors for a rally to $117.
Dogecoin price prediction
Dogecoin (DOGE) broke above the moving averages on Tuesday, but the long wick on the candlestick shows selling on rallies.

If the price dips below the moving averages, the bears will attempt to sink the DOGE/USDT pair below the $0.09 support. If they succeed, the DOGE price may resume its downtrend toward $0.08 and then $0.06.
Instead, if the price moves above the 20-day EMA ($0.09) and breaks above $0.10, it suggests the bears are losing their grip. The pair may then rally to $0.11 and eventually to $0.12.
Hyperliquid price prediction
Hyperliquid (HYPE) is witnessing a tough battle between the bulls and the bears at the breakout level of $43.76.

If the HYPE price rallies from the current level and breaks above $45.30, it suggests that the bulls have turned the $43.76 level into support. That increases the likelihood of a move to the $50 level.
Contrary to this assumption, if the price turns down and breaks below the 20-day EMA ($40), it suggests that the break above the $43.76 level may have been a bull trap. The HYPE/USDT pair may then plunge to the 50-day SMA ($36.77).
Related: Tom Lee says ‘mini crypto winter’ is over, sees Ether above $60K
Cardano price prediction
Cardano (ADA) has been swinging between the 50-day SMA ($0.26) and the $0.23 support for the past few days.

The 20-day EMA ($0.25) has started to turn down gradually, and the RSI is in the negative zone, signaling a slight edge to the bears. If the price turns down and breaks below $0.23, the ADA/USDT pair may plummet toward the support line of the descending channel pattern. There is support at $0.22, but it is likely to be broken.
Buyers will have to propel the ADA price above the downtrend line to signal a potential trend change. The pair may then climb toward $0.36.
Bitcoin Cash price prediction
Buyers attempted to push Bitcoin Cash (BCH) above the 20-day EMA ($444), but the bears held their ground.

Sellers will strive to strengthen their position by driving the BCH price below $419. If they manage to do that, the BCH/USDT pair may start a downward move toward the $375 level.
This bearish view will be negated in the short term if buyers drive the price above the moving averages. The pair may then rise to the $486 level, where the bears are again likely to pose a strong challenge.
Chainlink price prediction
Chainlink (LINK) has been trading near the moving averages for the past few days, signaling a balance between supply and demand.

The flattish moving averages and the RSI just above the midpoint suggest that the LINK/USDT pair may remain inside the $8 to $10 range for some more time.
The first sign of strength will be a break and close above the $10 resistance. That opens the doors for a rally to $10.94 and later to $11.61. Sellers are expected to defend the $11.61 level, as a close above it indicates that the bulls are back in the game. The bears will have to yank the LINK price below the $8 level to gain the upper hand.
This article does not contain investment advice or recommendations. Every investment and trading move involves risk, and readers should conduct their own research when making a decision. While we strive to provide accurate and timely information, Cointelegraph does not guarantee the accuracy, completeness, or reliability of any information in this article. This article may contain forward-looking statements that are subject to risks and uncertainties. Cointelegraph will not be liable for any loss or damage arising from your reliance on this information.

Ripple and Kyobo Life have teamed up to modernize Korean government bond settlement. The partners will test tokenized transactions through Ripple Custody in a regulated institutional setting. Kyobo is the first Tier 1 Korean insurer to take this step with Ripple. Ripple said the model could reduce settlement from two days to near real time.
Ripple and Kyobo Life Begin On-Chain Bond Settlement Work
Ripple announced the partnership in Seoul on April 15, 2026. It is Ripple’s first collaboration with a leading Korean insurance institution. The project centers on tokenized government bond settlement inside a regulated environment. Both companies released the announcement on Wednesday.
Kyobo Life is one of Korea’s largest and oldest life insurers. The company will use Ripple Custody to hold, transfer, and settle tokenized assets. That setup replaces fragmented and manual bond workflows with transparent on-chain execution. The work will start with custody-led settlement flows.
Ripple said custody is the starting point for broader digital asset services. Those services may later include payments, liquidity, and treasury management. The company said the project offers a model for other regulated institutions. Ripple described that path as gradual and regulated.
Ripple Custody Targets Faster Trade Settlement
Government bond trades often settle two business days after execution. Ripple said on-chain settlement can move that timeline closer to real time. Faster settlement can lower counterparty risk and free up capital sooner. That could improve balance sheet use for institutions.
Ripple Custody is built for banks and other regulated financial firms. The platform supports secure movement, record keeping, and settlement activity. It also gives institutions one system for custody and transaction processing. The platform combines custody with settlement support.
Fiona Murray, Ripple’s managing director for Asia Pacific, described Korea as a key market. She said, “It is available, proven, and ready to deploy in Korea today.” She added that Ripple sees a long-term role in Korea. Ripple said the company views this work as part of a broader market effort.
Kyobo Reviews Wider Payment and Market Use
The partners will also review stablecoin-based payment rails for institutional use. Those rails could support round-the-clock transactions within a compliant framework. The firms will also assess technical and regulatory feasibility in Korea. That review covers technology needs and compliance checks.
Jin Ho Park, a senior executive vice president at Kyobo Life, explained the aim. He said, “This is about validating how traditional financial instruments can operate securely on blockchain.” Kyobo linked the work to its wider digital transformation plans. Kyobo said the effort goes beyond digital asset storage.
Ripple said the deal adds to its growth in Korea. The company noted that Korea began licensing remittance payment providers in 2017. The partnership shows how insurers can test digital asset infrastructure inside regulated markets. Ripple also said its Korean business activity has been growing.
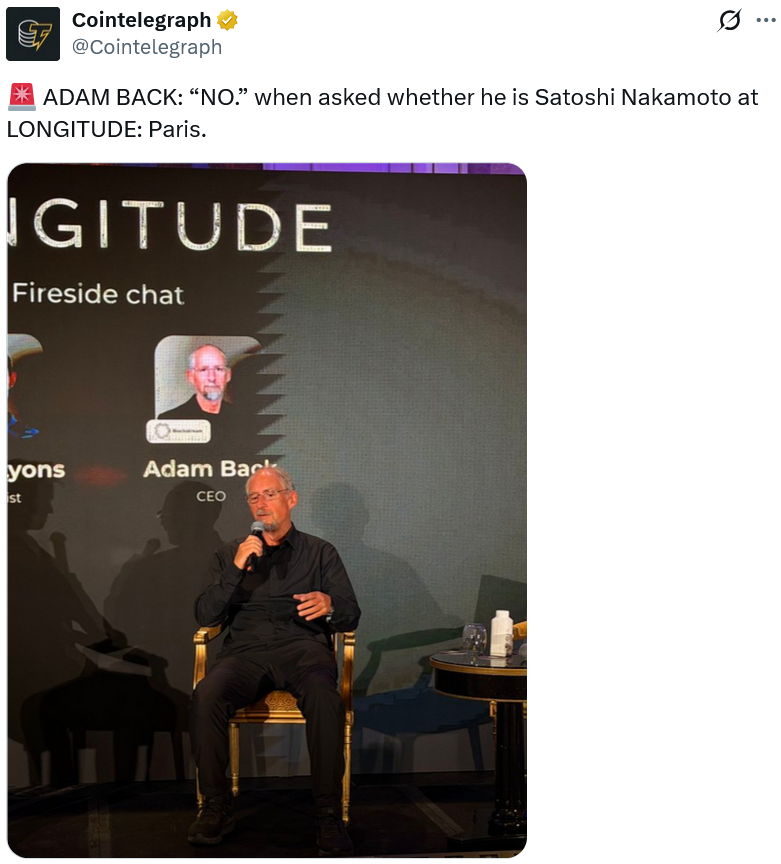
Blockstream CEO Adam Back, an early pioneer of the crypto movement, said Bitcoiners should be looking at building quantum-resistant solutions now, even if the threat is still decades away.
“Quantum computing still has a lot to prove. Current systems are essentially lab experiments. I’ve followed the field for over 25 years, and progress has been incremental,” Back said at Paris Blockchain Week on Tuesday.
“That said, Bitcoin should prepare,” Back said, adding that the “safest approach” is to build optional upgrades that allow migration to quantum-resistant cryptography if needed.
Concerns that quantum computers could eventually break blockchain cryptography have fueled industry-wide fear that bad actors could use it to break into crypto wallets, plunging the market into chaos.

Back said in November that the quantum threat is still 20 to 40 years away, while explaining to Bloomberg earlier this month that today’s quantum computers are slower than calculators.
Despite this, his Bitcoin development company, Blockstream, has a dedicated quantum team researching potential threat vectors to the Bitcoin network.
Part of that work has involved implementing hash-based signatures on Blockstream’s Bitcoin layer-2 Liquid Network, Back said at Paris Blockchain Week.
“Preparation is key. Making changes in a controlled way is far safer than reacting in a crisis.”
He added that the Taproot protocol could also support alternative signature schemes on the Bitcoin network without affecting current users.
Quantum computing threat may be closer than it appears
Last month, Google and California Institute of Technology researchers said functional quantum computers could come sooner than expected and that far less computing power is needed to break cryptography than previously thought.
Google went as far as to say that quantum computers could potentially break Bitcoin’s cryptography as quickly as nine minutes, allowing hackers to perform an “on-spend” attack.
Asked what would happen if the quantum threat arrives sooner than anticipated, Back said Bitcoin developers would “act quickly.”
“We’ve seen that before — bugs have been identified and fixed within hours. When something becomes urgent, it focuses attention and drives consensus.”
Quantum proposal to freeze old Bitcoin met with backlash
On Tuesday, Bitcoin developer Jameson Lopp and five other crypto security researchers introduced a proposal to freeze quantum-vulnerable Bitcoin — including Satoshi Nakamoto’s $81.9 billion stash — to prevent them from being stolen once quantum computers become functional.
Related: Bitcoiners propose freezing quantum-vulnerable coins in BIP-361
The proposal drew sharp criticism from several members of the Bitcoin community, including developer and researcher Mark Erhardt, who described it as “authoritarian and confiscatory.”
Phil Geiger, head of business development at Metaplanet, said: “We have to steal people’s money to prevent their money from being stolen.”
Magazine: Bitcoin will not hit $1M by 2030, says veteran trader Peter Brandt
CoreWeave, a publicly traded AI cloud infrastructure company, announced on Wednesday a $6 billion deal with quantitative trading firm Jane Street, in which the firm will use CoreWeave’s AI cloud computing infrastructure to power its trading and research operations.
Under the agreement, CoreWeave will provide Jane Street with compute from multiple data center facilities, the company’s announcement said.
Jane Street also purchased $1 billion in CoreWeave Class A Common stock at $109 per share, according to CoreWeave.
Shares of CoreWeave (CRWV) rose by 1.5% on Wednesday, climbing to about $119.04 at the time of publication, according to data from Yahoo Finance.

The deal comes about one week after CoreWeave announced an agreement with Anthropic, in which the AI developer would use CoreWeave’s compute infrastructure to power its Claude AI large language models.
CoreWeave’s pivot to AI predates the crypto mining industry’s shift by years, and highlights how miners can repurpose their infrastructure to power high-performance computing and shore up declining revenues amid a challenging economic environment.
Related: CoreWeave’s $8.5B loan shows how AI is replacing crypto mining finance
CoreWeave dominates “neocloud” computing sector
CoreWeave was founded as a crypto mining company called Atlantic Crypto, in 2017, before beginning a pivot to AI cloud computing infrastructure in 2019.
The company’s shift to AI infrastructure years ahead of the crypto mining industry’s rush into the sector helped establish CoreWeave as a leading “neocloud” company, according to analysts from asset management and investment research company Bernstein.

“Neocloud” service providers are cloud computing companies built around graphics processing units (GPUs), which power artificial intelligence workloads.
Traditional cloud service providers power their operations with basic computer processing units (CPUs) suitable for running websites, Web2 platforms, video games, media streaming and applications.
The analysts compared CoreWeave with IREN and Nebius, and concluded that “relative to its neocloud peers, CRWV has by far the strongest commercial machine.”
CoreWeave benefits from a mix of contractual agreements and on-demand revenue-generating activities, while also commanding a diverse customer base, Bernstein said.
“Nine of the leading 10 AI model providers now leverage CoreWeave’s platform,” spokespeople for CoreWeave said following the Anthropic deal in April.
Magazine: Would Bitcoin really be at $200K if not for Jane Street? Trade Secrets


CEO Tarek Mansour said in an interview that Kalshi would prevent kids from using a parent’s ID to skirt its age restrictions by launching a parent portal and AI verification.
Kalshi co-founder and CEO Tarek Mansour reportedly announced a new strategy for the prediction markets platform to crack down on minors illegally using its services.
According to a Wednesday Semafor report, Mansour said that Kalshi was launching a “portal for parents” to submit their identification to check whether their children were using the platforms under their names. There have been incidents in which minors have been able to bypass Kalshi’s age requirements — a US-based user must be 18 years old — by using one of their parent’s IDs for verification.
“We are also adding selfies to accounts, where you can basically look at the face of a person, and it can tell you obviously if this person is not the actual parent that’s 50 years old,” said Mansour, according to Semafor.
The CEO’s comments came as prediction market platforms come under scrutiny in the US, both by state-level gaming authorities for the companies’ event contracts related to sports and at the federal level for controversial bets on military actions.
Crypto exchanges have also been challenging Kalshi’s dominance in the market, with Binance integrating prediction market features in its wallet app last week, followed by Crypto.com partnering with High Roller Technologies in a similar move.
Related: Polymarket bets removed from Google News after brief appearance: Report
Central to Kalshi’s arguments in court is the claim that the company is under the exclusive jurisdiction of the federal commodities regulator, the US Commodity Futures Trading Commission (CFTC). Michael Selig, who chairs the CFTC, has backed this position in an amicus brief in support of Crypto.com in its dispute with the Nevada Gaming Control Board.
Court battles continue over sports and election event contracts
As of Wednesday, many of the cases against Kalshi were ongoing at the state level.
A federal judge in Arizona blocked state officials from enforcing the state’s gambling laws as applied to Kalshi’s event contracts last week. The decision followed a similar outcome in New Jersey, where a federal appellate court sided with the company’s argument claiming that the Commodity Exchange Act — under the CFTC — preempted the state’s law on sports gambling.
Magazine: Should users be allowed to bet on war and death in prediction markets?


Day one at Paris Blockchain Week turns into an institutional scouting mission for privacy, composability and gold‑backed tokenization plays in the heart of Paris.
Summary
- Early conversations at Paris Blockchain Week 2026 are converging on institutional needs for privacy and composability, according to builders on the ground.
- Canton Network and iExec are drawing attention as examples of how to square confidential data with interoperable on‑chain workflows for banks and asset managers.
- A gold tokenization project reportedly backed by JPMorgan is adding real‑world asset “weight” to a program already framed as “where institutions and digital assets finally meet.”
Day one of Paris Blockchain Week 2026 is underscoring a simple message from the buy‑side: if blockchains want serious institutional flows, they must solve privacy and composability at the same time. In a recap post after the first day, investor and commentator Tokenoya wrote that “institutions are converging on one thing: privacy + composability is the real bottleneck,” name‑checking custody platform dfnsHQ and permissioned ledger project Canton Network as emblematic of that shift.
Institutional Paris turns to privacy and composability
Held at the Carrousel du Louvre on April 15‑16 under the banner “Where Institutions and Digital Assets Finally Meet,” Paris Blockchain Week’s 7th edition has drawn more than 10,000 decision‑makers from banks, asset managers, regulators and Web3 infrastructure teams. Organizers and partners describe the focus as squarely post‑speculation, with sessions on tokenized treasuries, regulated stablecoins and cross‑border settlement rails framed as extensions of existing market structure rather than parallel casinos.
Social media threads highlight how that institutional tone is filtering into side events. At a dfnsHQ gathering, they reported that large institutions now view privacy‑preserving composability as “the real bottleneck,” a view echoed by Canton Network’s own framing of public‑chain design as a trade‑off between radical transparency and usable confidentiality. Canton describes itself as a “network of networks” that lets financial institutions run applications with “institutional‑grade privacy” while still enabling atomic swaps between, for example, a tokenized private equity fund and a digital currency, without exposing either party’s full books.
The recap also nods to a coffee meeting with iExec’s Fotshudi in Paris, with Tokenoya telling followers that “if you’re into privacy, give him a follow,” underscoring how off‑program conversations are gravitating toward confidential computing and data markets. iExec has long pitched itself as a way for enterprises to tap trusted execution environments and privacy‑preserving compute, a theme that fits neatly with European regulators’ insistence on data protection even as banks experiment with on‑chain settlement and DeFi‑style liquidity pools.
Perhaps the most eye‑catching detail in the post is a “meeting with a gold tokenization project backed by JP Morgan,” a reminder that real‑world asset pilots are no longer confined to crypto‑native players. Paris Blockchain Week’s own marketing leans heavily on tokenization “at scale,” pointing to experiments in digitizing U.S. Treasuries, sovereign bonds and private credit, and several speakers have suggested that tokenized commodities and collateral will be the next wave once legal and custody issues are ironed out.
Coverage from French outlets such as Journal du Coin has framed the 2026 edition as the moment “la finance traditionnelle bascule,” with tokenization and digital euros forcing incumbents to rethink plumbing, capital efficiency and risk controls rather than just issuing press releases. Global Digital Finance, a policy group whose members include major banks and crypto firms, similarly describes this year’s conference as one where “the focus is no longer speculative,” but on how blockchain “is beginning to play inside large financial institutions” under MiCA and other regulatory regimes.


President Trump disclosed Wednesday that he and Chinese President Xi Jinping exchanged letters over China’s alleged weapons transfers to Iran, with Xi denying the claim in writing and Trump calling it a positive step ahead of their May summit.
Summary
- Trump revealed on Fox Business that he wrote Xi asking him not to supply Iran with weapons, and Xi responded saying China was not doing that.
- Trump posted on Truth Social that China had “agreed not to send weapons to Iran” and predicted Xi would give him a “big, fat, hug” at their planned meeting in Beijing next month.
- Any genuine easing of US-China tensions alongside Iran diplomacy could reduce the oil-driven pressure that has weighed on Bitcoin since February.
President Trump told Fox Business Wednesday morning that Chinese President Xi Jinping sent him a letter denying that China is supplying weapons to Iran. Trump said he initiated the exchange after US intelligence reports surfaced suggesting Beijing may have sent a shipment of missiles to Tehran. “I wrote him a letter asking him not to do that, and he wrote me a letter saying, essentially, he’s not doing that,” Trump said.
In a follow-up Truth Social post, Trump wrote that China had “agreed not to send weapons to Iran” and said he and Xi were “working together smartly, and very well.” The post also stated that China was “very happy” the US was moving to reopen the Strait of Hormuz, through which China sources a significant portion of its energy imports.
The exchange carries diplomatic weight even without formal verification. Trump last week threatened a 50% tariff on any country supplying Iran with weapons, a warning aimed squarely at China. Xi’s written denial, whether or not it reflects Beijing’s actual behavior, gives Trump a face-saving path to de-escalate one front of the conflict without confrontation.
US intelligence has not confirmed definitive evidence that Chinese missiles have been used against American or Israeli forces. Chinese companies have, however, provided dual-use components tied to Iran’s missile and drone programs, a distinction analysts say matters significantly for what Xi’s letter does and does not commit to.
Trump and Xi are scheduled to meet in Beijing on May 14 and 15, and Trump said the Iran situation would not affect that meeting.
How China Fits Into the Iran Standoff
China is the primary buyer of Iranian crude oil and has the most to lose economically from a prolonged Strait of Hormuz closure. As the largest non-Western power with influence over Tehran, Beijing’s posture toward the conflict has been closely watched by both markets and diplomatic circles. Xi’s first public comments on the war came Tuesday, when he told Spain’s prime minister that “the international order is crumbling into disarray.”
The letter exchange suggests a backchannel is open between Washington and Beijing at a moment when the two countries are also navigating trade tensions, with tariff negotiations expected to feature prominently at next month’s summit.
What It Means for Bitcoin and Crypto Markets
Bitcoin has been acutely sensitive to every diplomatic signal in the Iran conflict. BTC rallied 5% to $74,400 on Trump comments suggesting Iran wanted to return to talks, and dropped to a session low of $70,617 when the naval blockade was announced and oil spiked to $105. Each diplomatic signal has produced an immediate repricing, amplified by the heavy short positioning that has built up over 46 consecutive days of extreme fear.
A credible path toward US-China cooperation on Iran, even without a formal ceasefire, would ease the oil-driven inflation pressure that has kept the Federal Reserve hawkish and risk assets on the back foot since February. Market analyst Sam Daodu has outlined a $75,000 to $80,000 range for BTC if new talks produce even a temporary agreement, and a path toward $100,000 by year-end if a full deal materialises.

China equities are navigating a global oil shock, according to eToro’s latest market commentary. The note ties March trade data to how higher oil prices can reverberate through the economy, noting slower export growth alongside a sharp rise in imports driven by energy and commodity purchases. While such shocks can push up input costs and pressure margins in the near term, the material emphasizes that the market impact is often reflected in valuations as investors adjust expectations. The write-up also points to likely beneficiaries, sector rotations, and the ongoing role of policy support in shaping the near-term outlook.
Key points
- Export growth slowed to 2.5% in March while imports jumped nearly 28%, driven by energy and commodities.
- Frontloading of energy imports amid supply uncertainty suggests near-term input-cost pressure and potential margin effects.
- Energy-sensitive sectors such as oil, shipping, and logistics may see stronger pricing power; AI and energy-security themes remain supported by policy tailwinds and high-tech exports.
Why it matters
For readers and investors, the report outlines how a commodity-price shock can influence market dynamics in China—from trade patterns to sector rotation—and why policy context matters for near-term sentiment and positioning.
What to watch
- Oil-price trajectories and energy-import trends that could signal further frontloading or shifts in demand.
- Near-term sector rotation, particularly toward energy, shipping, and logistics, and away from more exposed areas.
- Policy signals and ongoing momentum in high-tech exports that could sustain AI-related and energy-security themes.
Disclosure: The content below is a press release provided by the company or its PR representative. It is published for informational purposes.
China equities navigate oil shock as trade data signals shifting dynamics
Abu Dhabi, United Arab Emirates – April 15, 2026: China’s equity markets are adjusting to the impact of rising oil prices, as the latest March trade data offers an early indication of how the shock is feeding through the economy, according to eToro’s latest market commentary.
China’s export growth slowed to 2.5% in March, while imports surged nearly 28% – the fastest pace since 2021 – driven by a sharp increase in purchases of oil and other commodities. This pattern suggests a degree of frontloading in energy and commodity imports amid ongoing supply uncertainty, a trend observed during previous periods of market disruption.
Historically, such shocks tend to raise input costs and weigh on corporate margins in the near term. However, the impact is often reflected more significantly in market valuations rather than immediate earnings deterioration, as companies and investors adjust expectations.

Lale Akoner, Global Market Analyst at eToro, commented: “China equities are navigating the oil shock in real time, with trade data highlighting how quickly the effects are being priced in. The surge in imports, particularly in energy and commodities, points to frontloading behaviour as businesses respond to supply uncertainty.”
She added: “From an investment perspective, energy-sensitive sectors such as oil, shipping, and logistics are likely to benefit from stronger pricing power in this environment. At the same time, structural themes like AI and energy security remain supported by policy tailwinds and global demand, as reflected in continued strength in high-tech exports.”
Despite near-term volatility, broader market fundamentals remain underpinned by policy support, with the Chinese state continuing to play a stabilising role. The current environment is also driving sector rotation, particularly towards industries that can better absorb or pass on rising input costs.
Akoner concluded: “With oil acting as a catalyst for sector rotation, the focus for investors remains clear: stay selective, lean into defensive positioning, and treat volatility as an opportunity rather than a signal of deterioration.”
Media Contact
PR@etoro.com
About eToro:
eToro is the trading and investing platform that empowers you to invest, share and learn. We were founded in 2007 with the vision of a world where everyone can trade and invest in a simple and transparent way. Today we have 40 million registered users from 75 countries. We believe there is power in shared knowledge and that we can become more successful by investing together. So we’ve created a collaborative investment community designed to provide you with the tools you need to grow your knowledge and wealth. On eToro, you can hold a range of traditional and innovative assets and choose how you invest: trade directly, invest in a portfolio, or copy other investors. You can visit our media centre here for our latest news.
Disclaimers:
Not investment advice. eToro is a multi-asset investment platform. The value of your investments may go up or down. Your capital is at risk.
Regulation and License Numbers:
Middle East
eToro (ME) Limited, is licensed and regulated by the Abu Dhabi Global Market (“ADGM”)’s Financial Services Regulatory Authority (“FSRA“) as an Authorised Person to conduct the Regulated Activities of (a) Dealing in Investments as Principal (Matched), (b) Arranging Deals in Investments, (c) Providing Custody, (d) Arranging Custody and (e) Managing Assets (under Financial Services Permission Number 220073) under the Financial Services and Market Regulations 2015 (“FSMR”). Registered Office and its principal place of business: Office 26 and 27, 25th floor, Al Sila Tower, ADGM Square, Al Maryah Island, Abu Dhabi, United Arab Emirates.
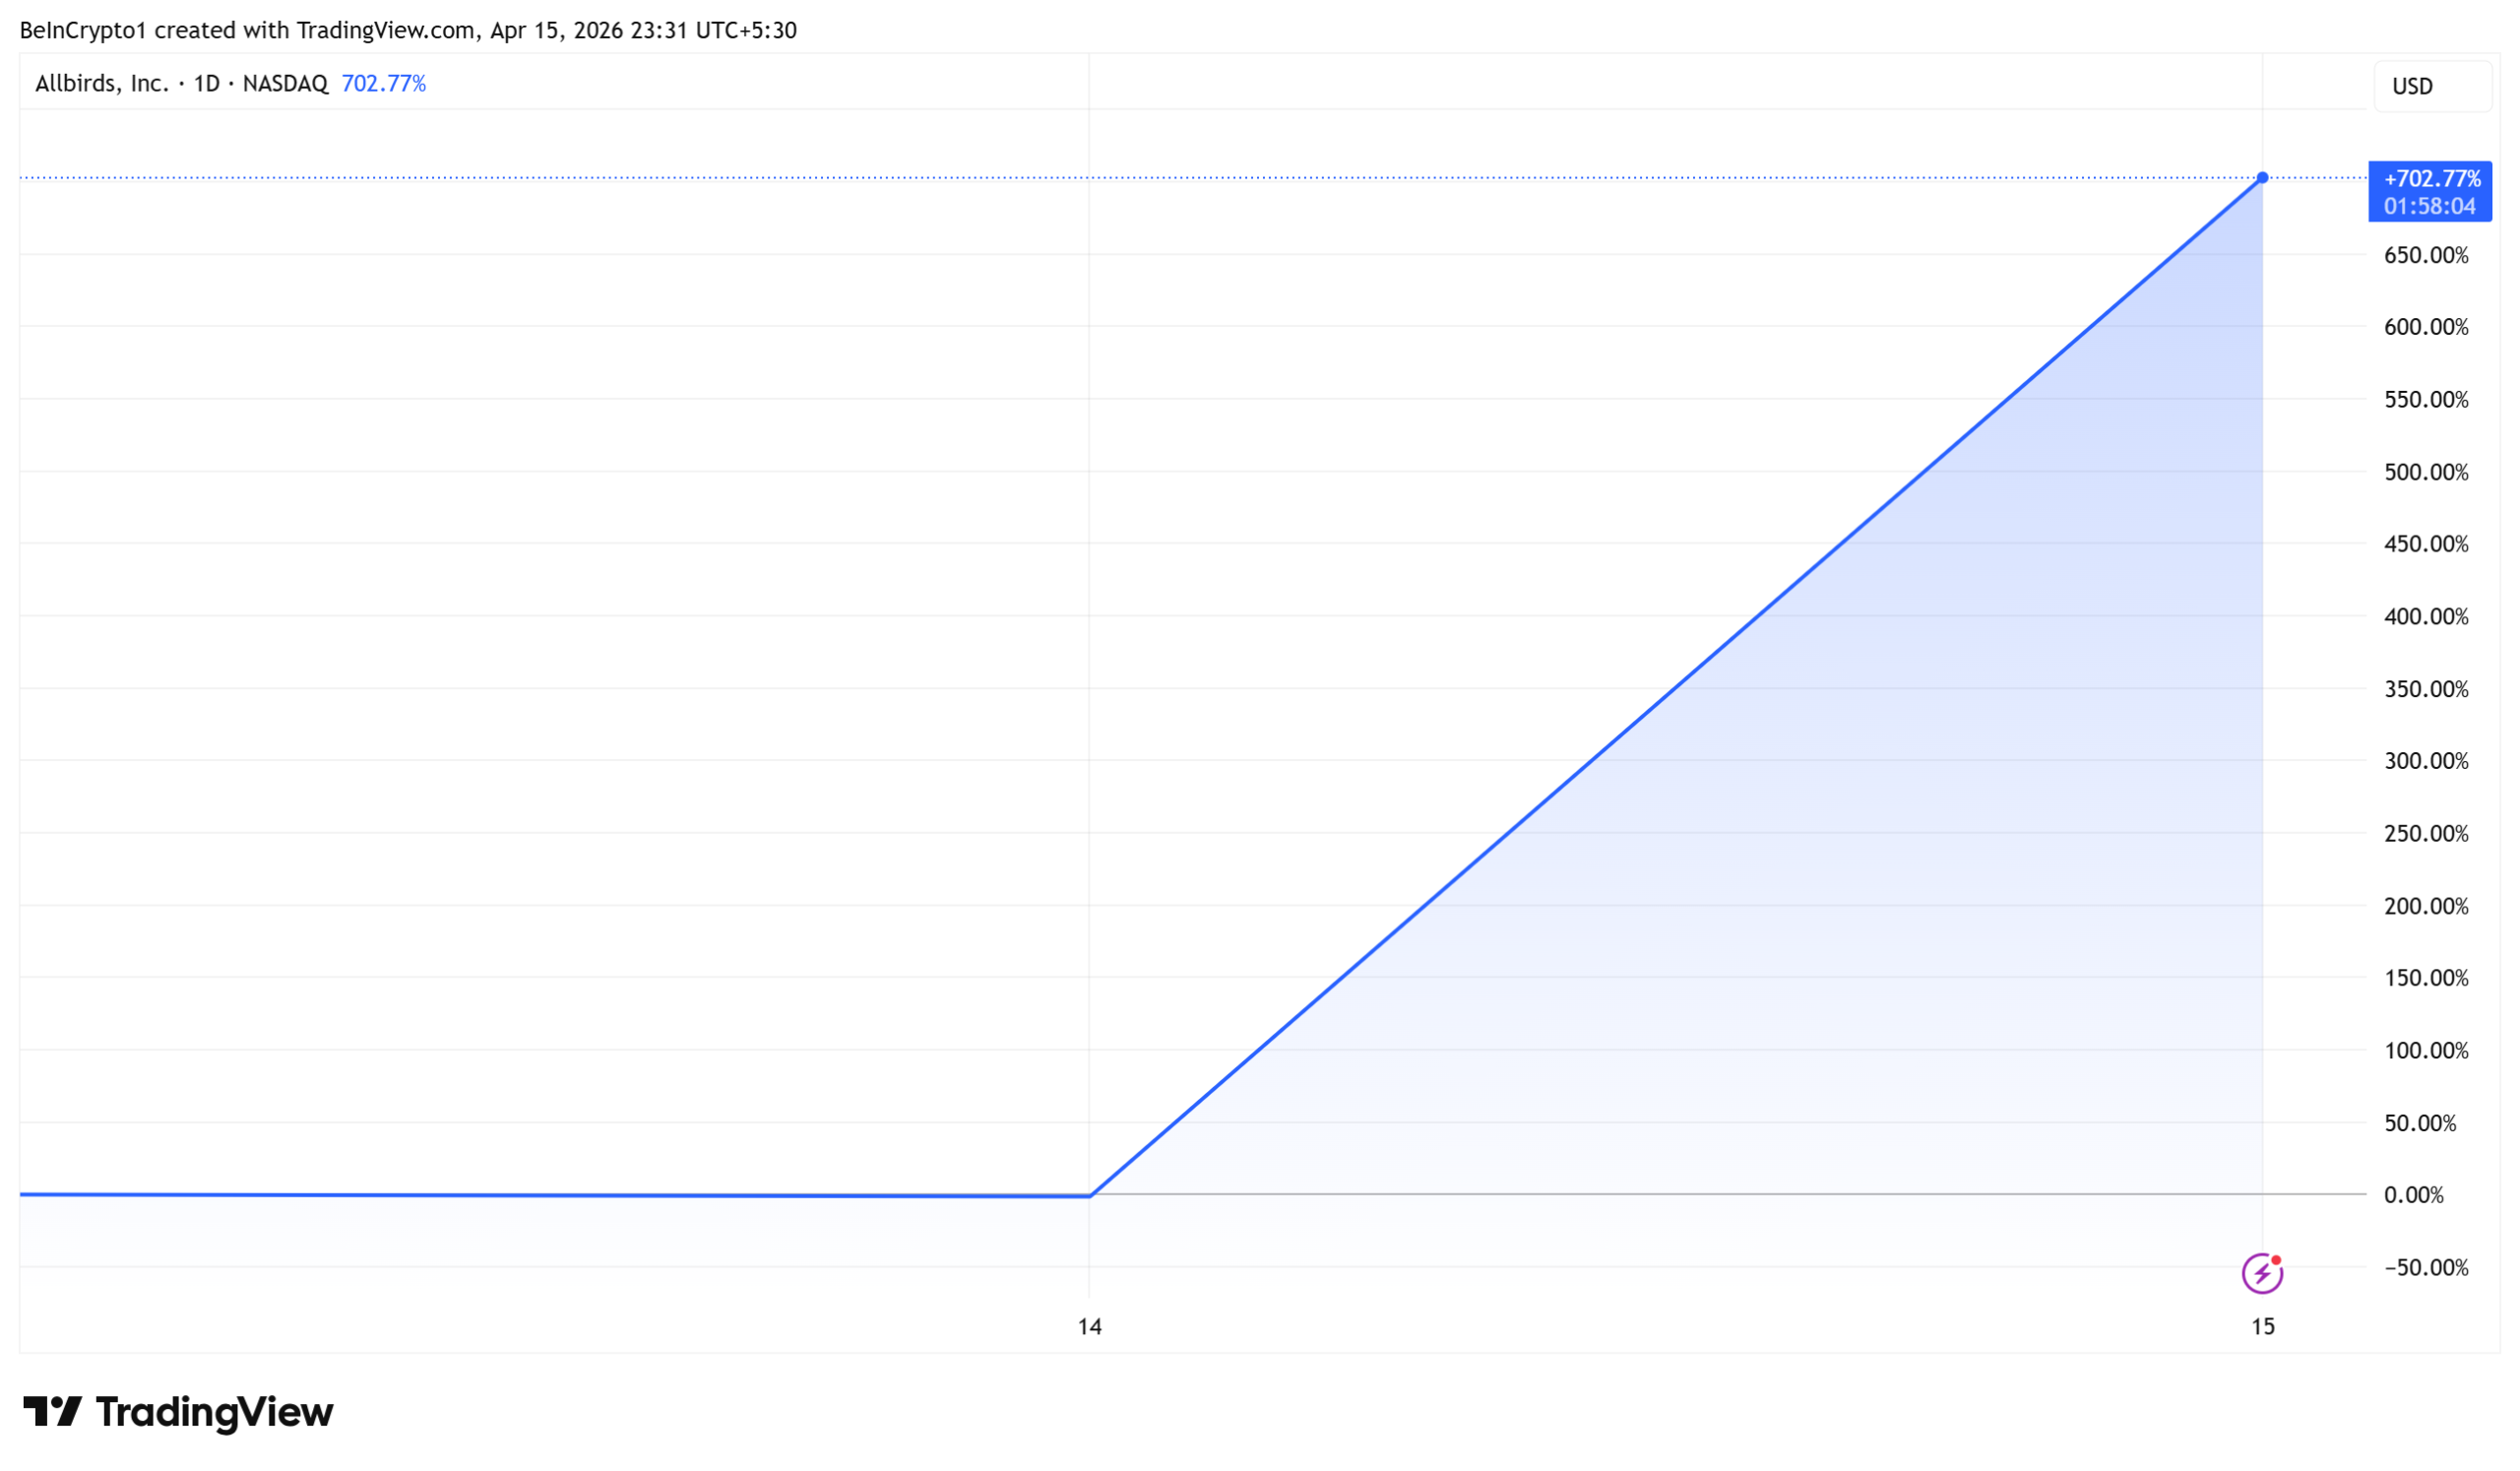
Allbirds (BIRD) stock gained over 700% on April 15 after the company announced it would ditch footwear entirely and pivot to AI compute infrastructure. The playbook may look familiar.
Less than a year ago, a wave of struggling pharma companies pulled the same move with crypto. Most of those stocks have since collapsed.
From Dead Shoe Brand to 700% Market Frenzy in a Single Day
Allbirds, once valued at $4 billion after its 2021 IPO, sold its shoe brand to American Exchange Group for just $39 million in March.
The remaining shell secured a $50 million convertible financing facility and plans to rebrand as NewBird AI, leasing GPUs to developers facing compute shortages.
“NewBird AI expects to use initial capital from the Facility to acquire high-performance GPU assets, which will be deployed to serve customers requiring dedicated access to AI compute capacity,” read an excerpt in the press release.
Following the news, Allbirds’ stock, BIRD, rallied by over 700%, with prospects for more gains as rising demand continues to clear each local top.
It is imperative to note, however, that the company has no track record in hardware, data centers, or cloud services. Both deals still require stockholder approval at a May 18 special meeting.
Against this backdrop, analysts noted the disconnect between the stock move and the underlying business.
“Feels like the market is rewarding what you could be not what you are … Nothing changed operationally overnight. Just the story. Shoes → dead. AI → alive,” analyst Kyle Doops remarked.
Crypto Tried This First
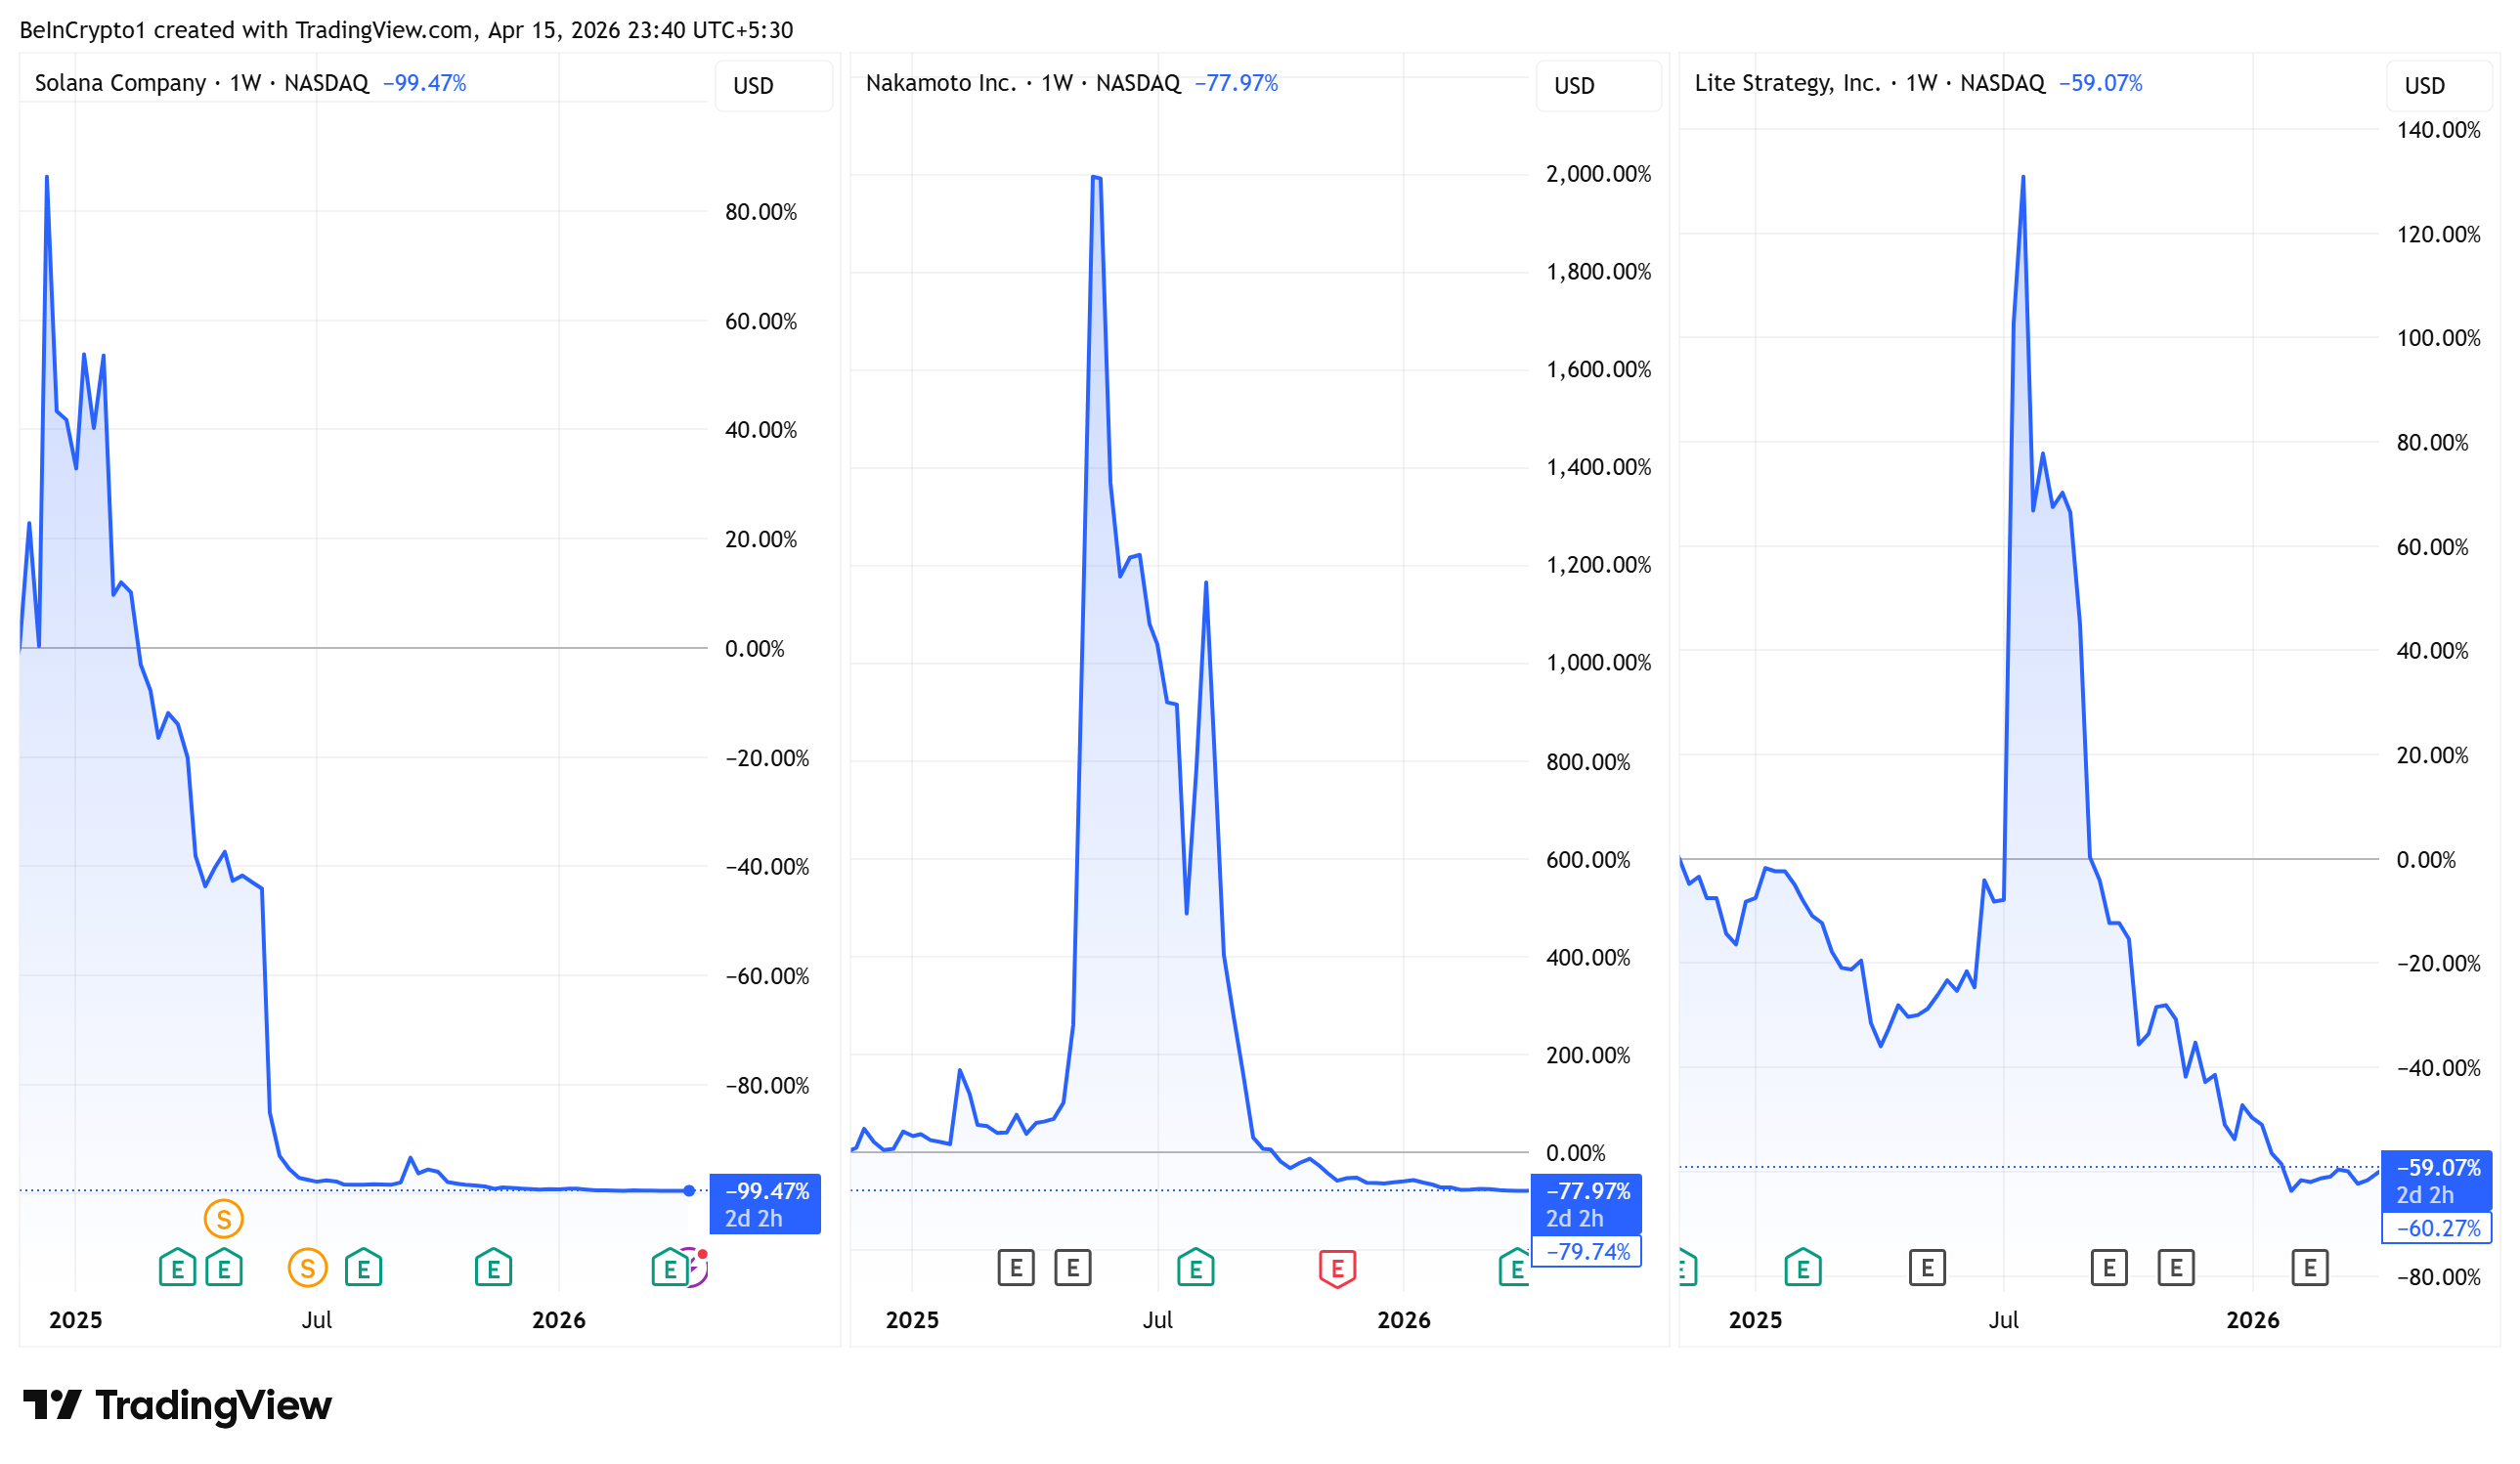
In 2025, at least four medical firms abandoned their core businesses to become crypto treasury companies.
- Helius Medical rebranded as Solana Company and raised $500 million for a SOL treasury.
- Kindly MD merged with Nakamoto Holdings to hold Bitcoin (BTC).
- MEI Pharma became Lite Strategy, adopting Litecoin (LTC) as its reserve asset.
Each stock spiked on the announcement. The aftermath tells a different story. Helius Medical traded near $25 at its peak and now sits around $2.31.
Nakamoto has fallen to $0.22 and is pursuing a reverse stock split to avoid Nasdaq delisting. Lite Strategy trades at $1.10 with a market cap of roughly $40 million.
Same Hype, Different Label
Master Ventures founder Kyle Chassé called it the “AI effect,” suggesting this may only be the beginning.
“This is the AI effect. Allbirds announced their switch from shoes to AI and then shot up 700% in a single day. It wouldn’t be surprising if other companies started pulling the same moves,” Chassé suggested.
The pattern is consistent. A company with a failing core business sells its operations, attaches itself to the hottest narrative, and watches its stock pop.
With crypto treasuries, the pop faded once markets demanded actual execution.
AI compute demand is real, but so was demand for Bitcoin, Ethereum, and Solana (SOL).
Whether NewBird AI breaks the pattern or follows it may depend on whether $50 million is enough to compete in a market dominated by hyperscalers spending billions.
“I wish the Allbirds people luck in their attempt to pivot to GPUs. Maybe they can do it. But i regard this as the first definitive sign that things have gone too far. What a bunch of jokers and mountebanks they are,” wrote Jim Cramer.
The post Allbirds Stock Rallies 700% On AI Pivot, But Mirrors Failed Crypto Treasury Plans appeared first on BeInCrypto.
The committee, led by Tether’s head of government affairs, reported spending $3 million on advertising through a company co-founded by Tether US CEO Bo Hines.
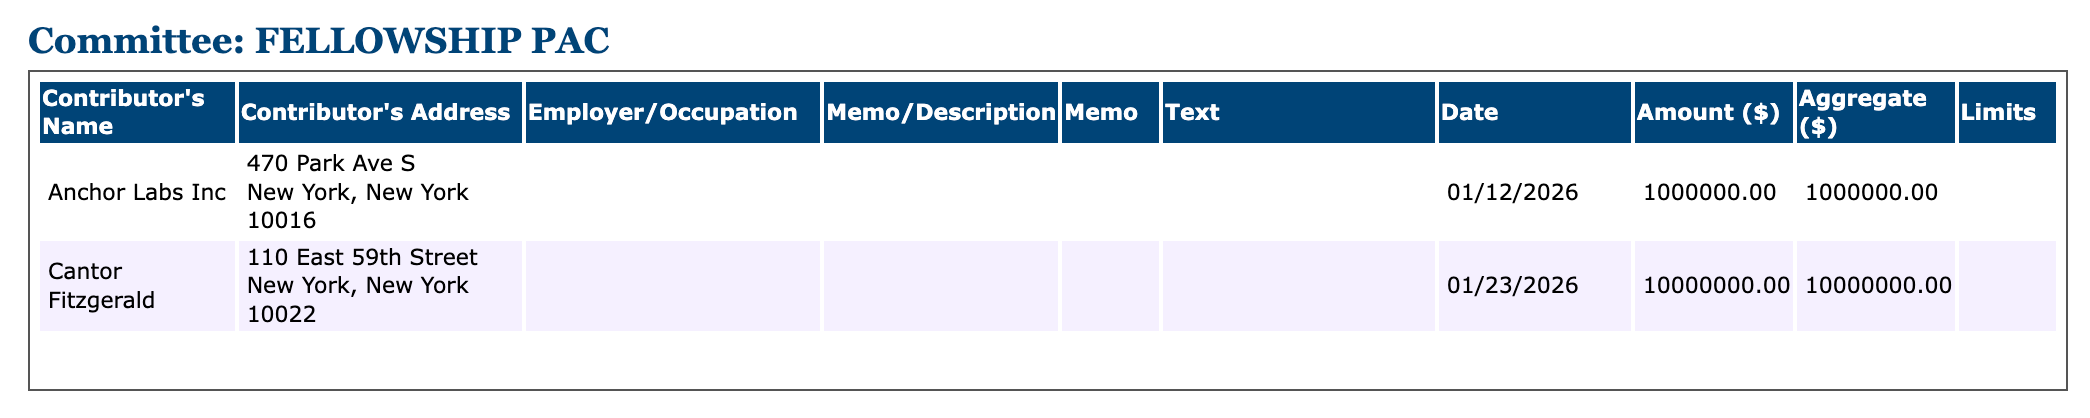
The latest filing by the crypto-aligned political action committee (PAC) headed by stablecoin issuer Tether’s head of government affairs shows $11 million in contributions from financial institutions.
In a Wednesday filing with the US Federal Election Commission (FEC), the Fellowship PAC revealed it had received $10 million from financial services firm Cantor Fitzgerald and $1 million from Anchor Labs, the company behind the crypto bank Anchorage Digital. The January 2026 contributions came amid $3 million in spending by the PAC for “issue advocacy advertising” with the Nxum Group, a marketing company co-founded by former White House crypto adviser and Tether US CEO Bo Hines.

Despite the significant contributions from Cantor Fitzgerald and Anchorage, Fellowship initially claimed to have “over $100 million” from undisclosed backers aligned with the crypto industry at its launch in September. FEC filings showed no receipts over $200 between Aug. 7, 2025 and Dec. 31, 2025, but did not necessarily include any contributions after March 31.
The 2024 US election season saw crypto-backed PACs spend hundreds of millions of dollars on media to support candidates they considered “pro-crypto” and to oppose those marked as “anti-crypto” by many in the industry. With party control of the US Congress hanging in the balance this year, PAC spending like Fellowship’s signals that the crypto industry could try to repeat their successes of 2024.
Related: US midterm election mirrors 2024 as crypto PACs move into Ohio races
In addition to its $3 million in advertising costs, the PAC reported in April that it had spent $1.5 million in media buys supporting Republican candidates in Georgia’s 14th Congressional District and candidates in US Senate races in Nebraska and Kentucky. Those three US states are scheduled to hold party primaries in May.
PAC’s ties to the crypto industry
Mitchell Nobel, listed as the PAC’s treasurer, has also been Cantor Fitzgerald’s director of digital asset strategy and policy since August 2025, roughly the same time Fellowship filed its statement of organization with the FEC.
Anchorage announced in March that it would be joining Chainlink to support the launch of the Blockchain Leadership Fund, a hybrid PAC that allows contributions directly to candidates as well as independent expenditures. An Anchorage spokesperson told Cointelegraph at the time that the company would make a “meaningful contribution” to be disclosed with the FEC, but no filing was public as of Wednesday.
Magazine: Bitcoin will not hit $1M by 2030, says veteran trader Peter Brandt
British-born man at centre of alleged killing spree described as ‘pure acts of evil’ is charged

Premier declares five priority projects to fast-track

Bitcoin Trend Reversal May Confirm If BTC Closes Above $76K


-

 Politics5 days ago
US brings back mandatory military draft registration
-
 Sports5 days ago
Man United discover Nico Schlotterbeck transfer fee as defender reaches Dortmund agreement
-

 Fashion5 days ago
Weekend Open Thread: Veronica Beard
-

 Politics6 days ago
Malcolm In The Middle OG Turned Down ‘Buckets Of Money’ To Appear In Reboot
-

 Politics3 days ago
World Cup exit makes Italy enter crisis mode
-

 Crypto World7 days ago
Canary Capital Files SEC Registration for PEPE ETF
-

 Business5 days ago
Tesla Model Y Tops China Auto Sales in March 2026 With 39,827 Registrations, Beating Cheaper EVs and Gas Cars
-

 Crypto World2 days ago
The SEC Conditionalises DeFi Platforms to Be Avoided for Broker Registration
-

 Crypto World2 days ago
SEC Signals Exemption for Crypto Interfaces From Broker Registration
-

 News Videos18 hours ago
Secure crypto trading starts with an FIU-registered
-
 NewsBeat3 days ago
Pep Guardiola and Gary Neville agree over Arsenal title problem that benefits Man City
-

 Business6 days ago
OpenAI Halts Stargate UK Data Centre Project Over Energy Costs and Copyright Row
-

 Business4 days ago
Ireland Fuel Protests Enter Day 5 as Blockades Spark Shortages and Government Prepares Support Package
-

 Politics6 days ago
LBC Presenter Mocks Trump Over Iran War Failures
-

 Crypto World5 days ago
Federal judge blocks Arizona from bringing criminal charges against Kalshi
-
 NewsBeat4 days ago
JD Vance announces ‘no agreement’ with Iran over nuclear weapons fear
-

 Crypto World2 days ago
SEC Proposes Certain Crypto Interfaces Don’t Need to Register as Brokers
-

 NewsBeat2 days ago
Trump and Pope Leo: Behind their disagreement over Iran war
-

 Tech6 days ago
A version of Windows 10 released a decade ago is now eligible for additional security patches
-

 Business5 days ago
IMF retains floor for precautionary balances at SDR 20 billion
You must be logged in to post a comment Login