
Crypto World
Multichain Is Breaking DeFi – Smart Liquidity Research

Introduction
For years, the dominant narrative in decentralised finance has been clear: more chains mean more scalability, more innovation, and more opportunity. Multichain has been framed as the inevitable evolution of Web3—a future where users seamlessly move assets across ecosystems, tapping into the best each network has to offer.
That vision sounds compelling. It just doesn’t match reality.
Instead of scaling DeFi, the multichain paradigm is quietly undermining it. Beneath the surface of expansion lies a growing set of inefficiencies—fragmented liquidity, duplicated capital, fragile infrastructure, and a user experience that feels anything but revolutionary.
The Illusion of Growth
At first glance, Multichain looks like explosive growth. New chains launch, total value locked (TVL) spreads across ecosystems, and protocols proudly announce deployments on multiple networks.
But this “growth” is often misleading.
What appears to be expansion is frequently just redistribution. The same capital is stretched thinner across more environments, creating the illusion of a larger system while actually weakening its core. Instead of deep, efficient liquidity pools, we get shallow replicas scattered across chains.
In traditional finance, liquidity consolidation is a strength. In DeFi, we’ve normalised fragmentation—and we’re paying the price for it.
Liquidity Fragmentation: A Silent Killer
Liquidity is the lifeblood of DeFi. Without it, markets become inefficient, slippage increases, and trading becomes more expensive.
Multichain fractures liquidity across dozens of ecosystems. A token that once had deep liquidity on a single chain is now split across multiple networks, each with its own isolated pool. The result?
- Worse pricing for traders
- Higher slippage
- Reduced capital efficiency
Instead of one robust market, we get many weaker ones. Protocols attempt to compensate with incentives, but this only creates mercenary capital—liquidity that disappears as soon as rewards dry up.
In trying to be everywhere, DeFi has become strong nowhere.
Capital Duplication: Inefficiency at Scale
Multichain doesn’t just fragment liquidity—it duplicates capital.
To operate across chains, users often need to replicate positions: holding assets, providing liquidity, or maintaining collateral on multiple networks simultaneously. This leads to idle capital that could otherwise be deployed more productively.
Bridging adds another layer of inefficiency. Assets are locked on one chain and minted on another, creating synthetic representations that rely on external systems to maintain parity. This isn’t true interoperability—it’s a workaround with trade-offs.
Capital that should be fluid becomes constrained, fragmented, and less effective.
Bridging Risks: The Weakest Link
Bridges are the backbone of the multichain ecosystem—and its most vulnerable point.
They introduce additional trust assumptions, complex smart contract logic, and significant attack surfaces. History has shown that bridges are frequent targets for exploits, often resulting in massive losses.
Even when they work as intended, bridges add friction:
- Multiple steps to move assets
- Delays in confirmation
- Confusing interfaces for users
For newcomers, this complexity is a barrier. For experienced users, it’s a constant risk calculation.
A system that requires users to repeatedly expose themselves to fragile infrastructure isn’t scalable—it’s brittle.
The UX Problem No One Wants to Admit
DeFi promised to remove friction. Multichain has reintroduced it in new forms.
Users must navigate:
- Different wallets and RPC configurations
- Network switching
- Bridging interfaces
- Inconsistent token standards and naming
What should be a simple transaction often becomes a multi-step process across multiple platforms. Each step increases the chance of error—sending assets to the wrong chain, interacting with the wrong contract, or losing funds entirely.
This isn’t the future of finance. It’s a maze.
Incentives Are Masking the Problem
Why hasn’t the multichain model been widely challenged?
Because incentives are hiding the cracks.
Protocols use token rewards to attract liquidity across chains, temporarily solving fragmentation by subsidising it. Users chase yields, moving capital wherever returns are highest, reinforcing the multichain narrative.
But incentives are not a sustainable foundation. When rewards decline, liquidity disappears, exposing the underlying inefficiencies.
What looks like a thriving ecosystem is often just a heavily incentivised one.
Rethinking the Path Forward
None of this means cross-chain innovation is inherently flawed. The idea of interoperability is still powerful—but the current implementation is far from optimal.
The industry needs to shift focus:
- From chain proliferation to liquidity consolidation
- From bridging workarounds to native interoperability
- From incentive-driven growth to structural efficiency
Solutions like shared liquidity layers, intent-based systems, and unified execution environments are emerging—but they must prioritise simplicity and capital efficiency over expansion for its own sake.
Conclusion
Multichain was supposed to scale DeFi. Instead, it has diluted liquidity, duplicated capital, and introduced systemic risks that are impossible to ignore.
The uncomfortable truth is this: more chains didn’t make DeFi better—they made it more complicated, less efficient, and harder to use.
Until the industry confronts these issues head-on, multichain will remain less of a breakthrough and more of a bottleneck.
And the longer we pretend otherwise, the more expensive that illusion becomes.
REQUEST AN ARTICLE


Hong Kong-based Flow Capital Partners plans to bring its $150 million private credit fund onchain. The firm will use DigiFT to offer tokenized shares. The move is expected by the end of April. It marks a step toward wider blockchain-based fund access in Asia.
Flow Capital Prepares Onchain Fund Launch with DigiFT
Flow Capital will make its private credit fund available through DigiFT Tech Pte. The platform focuses on real-world asset tokenization. The fund was first launched in June 2025. Now, the firm is expanding its distribution using blockchain.
The company plans to raise an additional $30 million through tokenized shares. This fundraising effort will run through the end of 2026. The firm also aims to grow the fund to $250 million in total size. This would expand its reach among global investors.
Jacky Tian, the firm’s chief investment officer, shared the growth target in a Bloomberg report. The company sees tokenization as a way to attract new capital. It also expects easier access for a broader investor base.
At the same time, DigiFT provides regulated infrastructure in Singapore. This allows compliant issuance of tokenized financial products. As a result, Flow Capital can offer shares in a digital format while meeting regulatory needs.
Rising Interest in Tokenized Real World Assets
The move comes as more firms adopt tokenization for traditional assets. Large financial institutions have already launched similar products. BlackRock introduced its tokenized Treasury fund, known as BUIDL. It operates on public blockchain networks.
JPMorgan also entered the space with its tokenized fund called MONY. The bank seeded the product with $100 million. Later, it opened access to outside investors. These efforts show growing activity in blockchain-based finance.
Data shows rapid growth in the real-world asset market. Total market value reached $58 billion as of April 14. This is up from $21.5 billion one year earlier. The increase reflects rising demand for tokenized exposure.
Ethereum remains a key network for such assets. Its RWA market cap reached $19.3 billion. This represents more than 200 percent growth year over year. The trend supports further adoption by asset managers.
Analysts Point to Risks in Liquidity Structure
Despite growth, some analysts have raised concerns. They note that tokenization does not change core fund risks. Liquidity remains a key issue in private credit markets. These funds often hold long-term assets.
Nic Puckrin, commented on the trend. He said, “bringing private credit funds onchain solves the distribution problem.” He added that it opens access to more investors. However, risks still remain.
He also warned about liquidity mismatch concerns. He stated, “the availability of instant settlement can create the illusion of liquidity.” This may lead investors to expect faster redemptions. Yet, underlying assets may not support that speed.
As tokenized funds grow, such risks may draw more attention. Investors may need to assess both access and liquidity limits. The shift to blockchain improves distribution, but structural challenges remain.


The price of bitcoin has again pushed above $76,000 alongside about a 10% plunge in the price of crude oil on an apparent reopening of the Strait of Hormuz.
“The passage for all commercial vessels through Strait of Hormuz is declared completely open for the remaining period of ceasefire,” said Iranian Foreign Minister Seyed Abbas Araghchi in an X posting.
President Trump quickly responded on Truth Social, thanking Iran for the full reopening.
The news sent the price of WTI crude oil down nearly 10% to $85.90 per barrel, about its lowest price since shortly after the outbreak of the war in early March.
Alongside bitcoin has risen to $76,400, up 3 over the past 24 hours. U.S. stock index futures are higher by about 1% across the board.
Why the $76,000 area is important
Bitcoin was trading around the $76,000-$78,000 level in the days before the Feb. 5 crash that sent its price tumbling all the way back to $60,000. In recent days, BTC has risen above $76,000 on numerous occasions, only to be met with a wave of quick selling.
Technicians believe that a sustained break to around $77,000 could set the stage for a return to significantly higher levels.
More green shoots over Iran
Separately, Axios reported that the U.S. and Iran are negotiating over a three-page plan to end hostilities. Among the discussion points: the U.S. releasing $20 billion in frozen Iranian funds in return for that country giving up its stockpile of enriched uranium.

Two tokens. Vertical charts. And a lot of unanswered questions. Siren crypto surged 32.97% in 24 hours to $0.927893 before consolidating near $0.62, while RaveDAO (RAVE) executed a 40x move from $0.30 to $18 in just five days.
Both rallies now drawing serious manipulation scrutiny from on-chain analysts. The question the market keeps circling: organic demand, or something more coordinated?
The RAVE case looks damning on paper. On-chain analyst Yu Jin flagged that the team transferred 30.58M RAVE (approximately $42M) to Bitget ahead of the spot pump, with the move appearing designed to bait short sellers before squeezing them out, triggering $37M in liquidations, $31M of which were shorts.
ChainCatcher’s report described the pattern as suspected price manipulation via derivatives. RAVE eventually hit an ATH of $18.62, a 3,765% weekly gain. SIREN, meanwhile, saw whale wallets accumulate 93% of supply ahead of a 185% single-session spike to $2.18.
Whether these moves were engineered or simply benefited from thin liquidity and aggressive momentum trading, the price action left marks across the broader altcoin market, and exposed just how quickly leverage can amplify both gains and pain.
Can SIREN Price Hit $1.88, and Can RAVE Crypto Hold Its Gains?
SIREN just had a sharp run and now it is sitting at that classic decision point, because $0.60 is the level holding the entire move together, and as long as it stays intact with volume holding strong, that is where continuation becomes real and a grind toward higher targets like $1.88 starts to look possible.
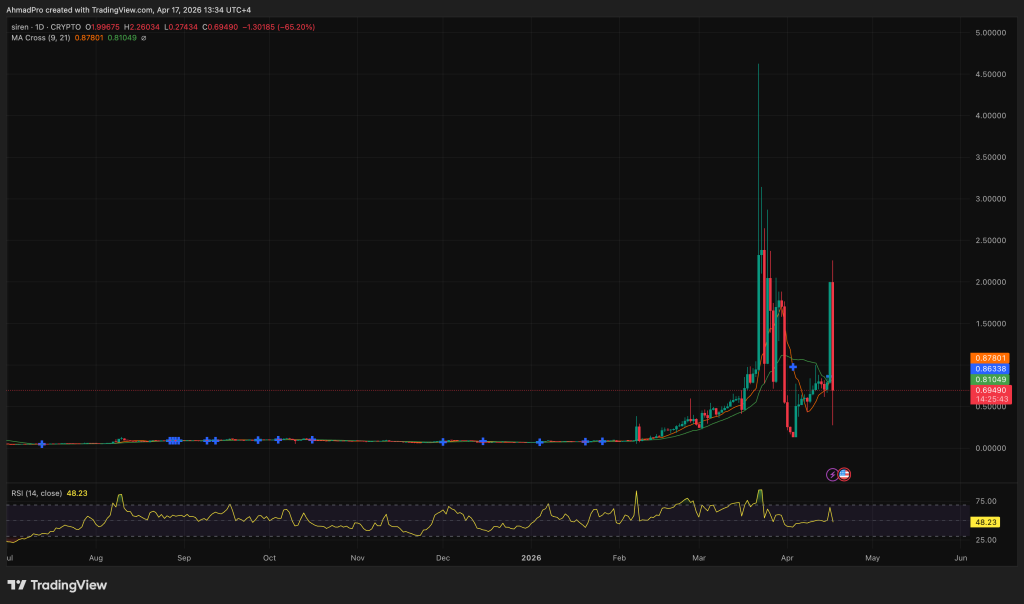
Right now though it is already showing signs of cooling, with resistance around $0.72 and price pulling back slightly, so the more realistic path is a range between roughly $0.70 and $0.65 while the market digests the move.
The risk is pretty clear, because if $0.60 breaks, that usually signals the move was more hype than structure, and once that happens, price can unwind fast back toward the $0.40 to $0.50 area where the rally originally started.
And with moves this aggressive, especially across related tokens, sharp reversals are common once the squeeze runs out, so watching volume and positioning shifts is way more important here than just the price itself.
RAVE crypto right now is a classic squeeze machine, not a normal trend, and that is exactly why it keeps going up while everyone is trying to short it.
The logic makes sense on paper, people saw what happened with SIREN and expect the same outcome, so they pile into shorts early, but that actually fuels the move instead of stopping it, because every time price pushes higher, those shorts get forced out and turn into buy pressure.
Maxi Doge Targets Early-Mover Upside as RAVE and SIREN Test Key Levels
With SIREN already up 307% on the week and RAVE printing a 3,765% move, late entries face an uncomfortable reality: the asymmetric upside window has likely closed. That math drives attention toward earlier-stage setups — where price discovery hasn’t happened yet.
The pattern of explosive altcoin rallies consistently pulls trader attention toward presale markets as participants hunt the next entry before the crowd arrives.
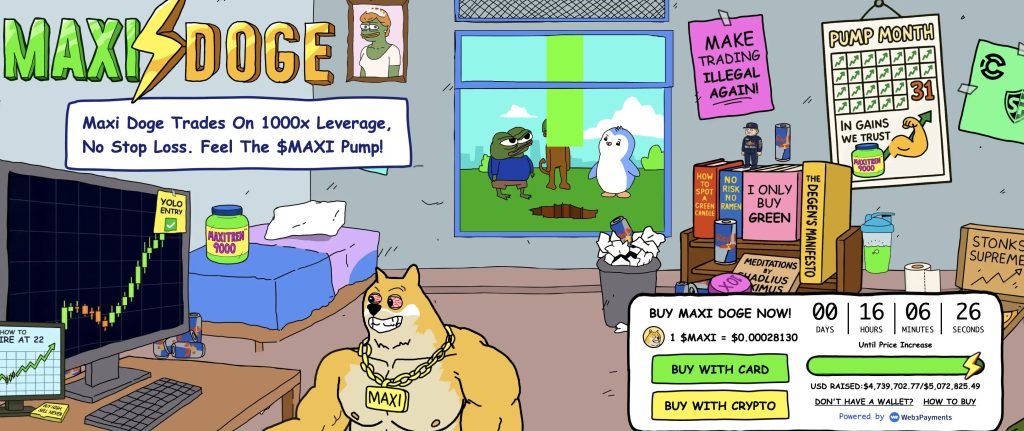
Maxi Doge (MAXI) is an ERC-20 meme token built around what its team calls “1000x leverage mentality” — a 240-lb canine mascot embodying the grind-and-hold ethos of aggressive bull market trading.
The presale has raised $4,738,881.42 at a current price of $0.0002813, with dynamic APY staking already live. Features include holder-only trading competitions with leaderboard rewards, a Maxi Fund treasury managing liquidity and partnerships, and meme-first marketing rooted in gym-bro culture (“Never skip leg-day, never skip a pump”).
The project is approaching $5M raised — a milestone that historically accelerates presale momentum. Meme tokens carry high volatility risk; presale assets are illiquid until listing.
How Buyers Can Access the MAXI Presale
Investors can buy MAXI through the official presale website by connecting a wallet and paying with ETH, BNB, USDT, or USDC. A bank card option is also available.
The purchase process is also available through Best Wallet, which can be downloaded from the Apple App Store and Google Play.
After purchase, holders can stake tokens in the rewards pool, where the current staking APY is around 66%.
For project updates, users can follow Maxi Doge on X and join the project’s Telegram group.
The post Is Market Maker Manipulation Behind RAVE and SIREN Crypto Skyrockets? appeared first on Cryptonews.
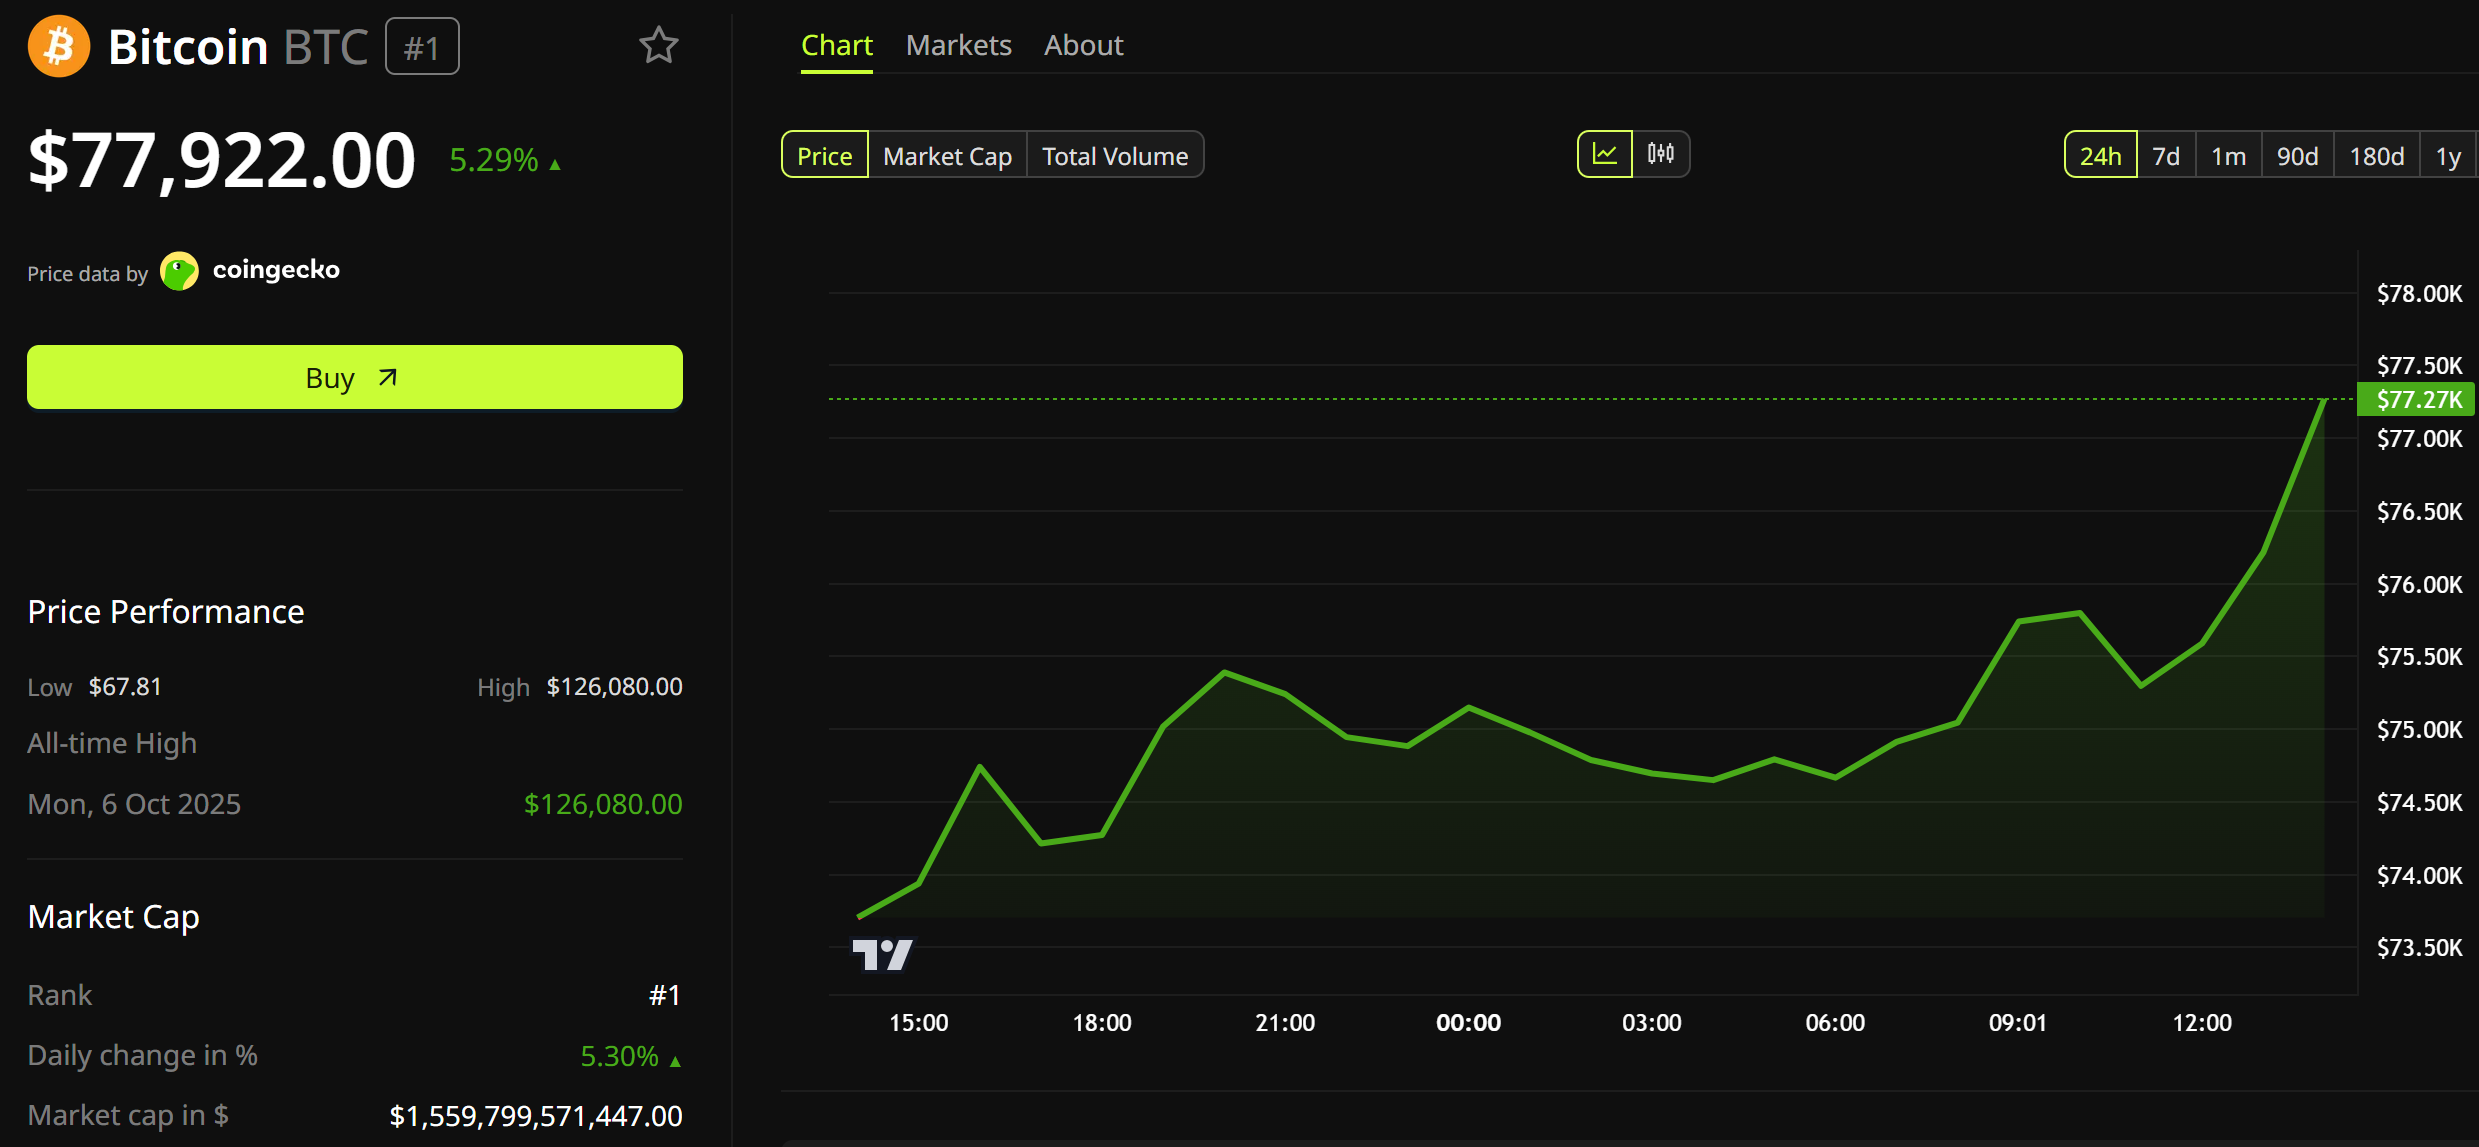
Bitcoin (BTC) climbed above $78,000 on Friday, reaching its highest level in over two months as a confirmed double-bottom breakout fueled momentum toward the $80,000 zone.
The rally followed Iran’s reopening of the Strait of Hormuz under ceasefire terms, which triggered a broad risk-on move across equities and crypto. Yet analysts remain sharply divided on whether BTC can sustain the push through heavy overhead resistance.
Weekly Close Holds the Key to $80,000
As of this writing, Bitcoin was trading for $77,922, just shy of the $80,000 psychological level last tested on January 31, 2026.

The surge comes after reports that Iran opened the Strait of Hormuz completely, amid ongoing ceasefire terms.
Against this backdrop, eyes remain peeled on whether the Bitcoin price can reclaim the $80,000 psychological level this weekend, potentially drawing tailwinds from resounding risk-on sentiment.
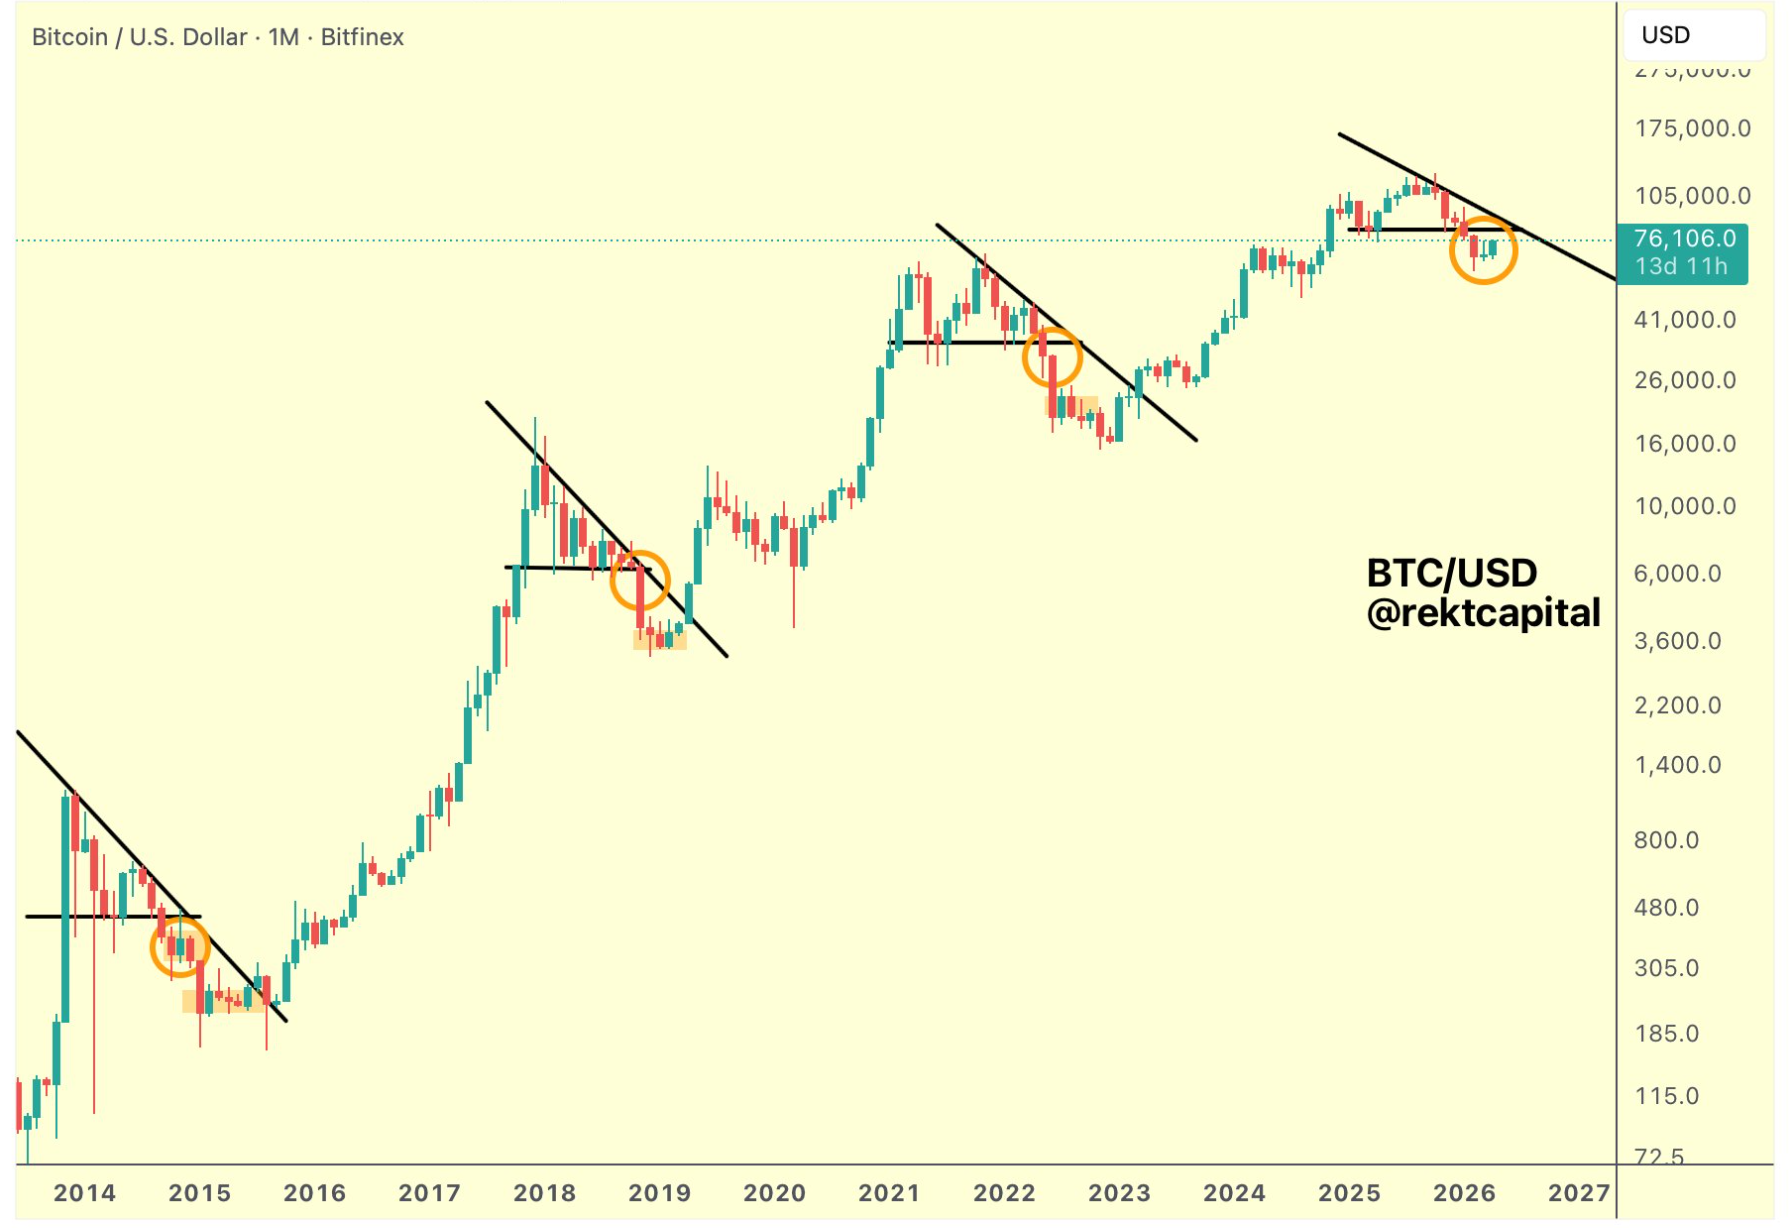
Crypto analyst Rekt Capital highlighted that BTC has maintained itself above the double-bottom formation top near $73,000, positioning price for a positive weekly close.
However, he cautioned that a similar setup in March ended with an upside wick and a subsequent rejection.
“Bitcoin’s progression on the Daily timeframe has been promising, enabling price to maintain itself above the Double Bottom formation top of ~$73,000… it is the upcoming Weekly Close that will be most important to watch for,” wrote Rekt Capital.
On the daily chart, BTC has flipped former resistance levels near $73,000 into support, with consecutive daily closes above prior breakdown zones.
If this behavior continues, it could confirm the breakout from a multi-week consolidation range.
Meanwhile, prediction market Kalshi now prices a roughly 40% chance that BTC hits $80,000 this month, but several key levels remain in focus for Q2.
Trader Ted Pillows identified $76,000 as the key reclaim level that could propel price into the $78,000 to $80,000 band.
“The key zone for Bitcoin here is $76,000 and a reclaim could push BTC towards the $78,000-$80,000 zone. This is where I’ll go short on Bitcoin,” wrote Ted.
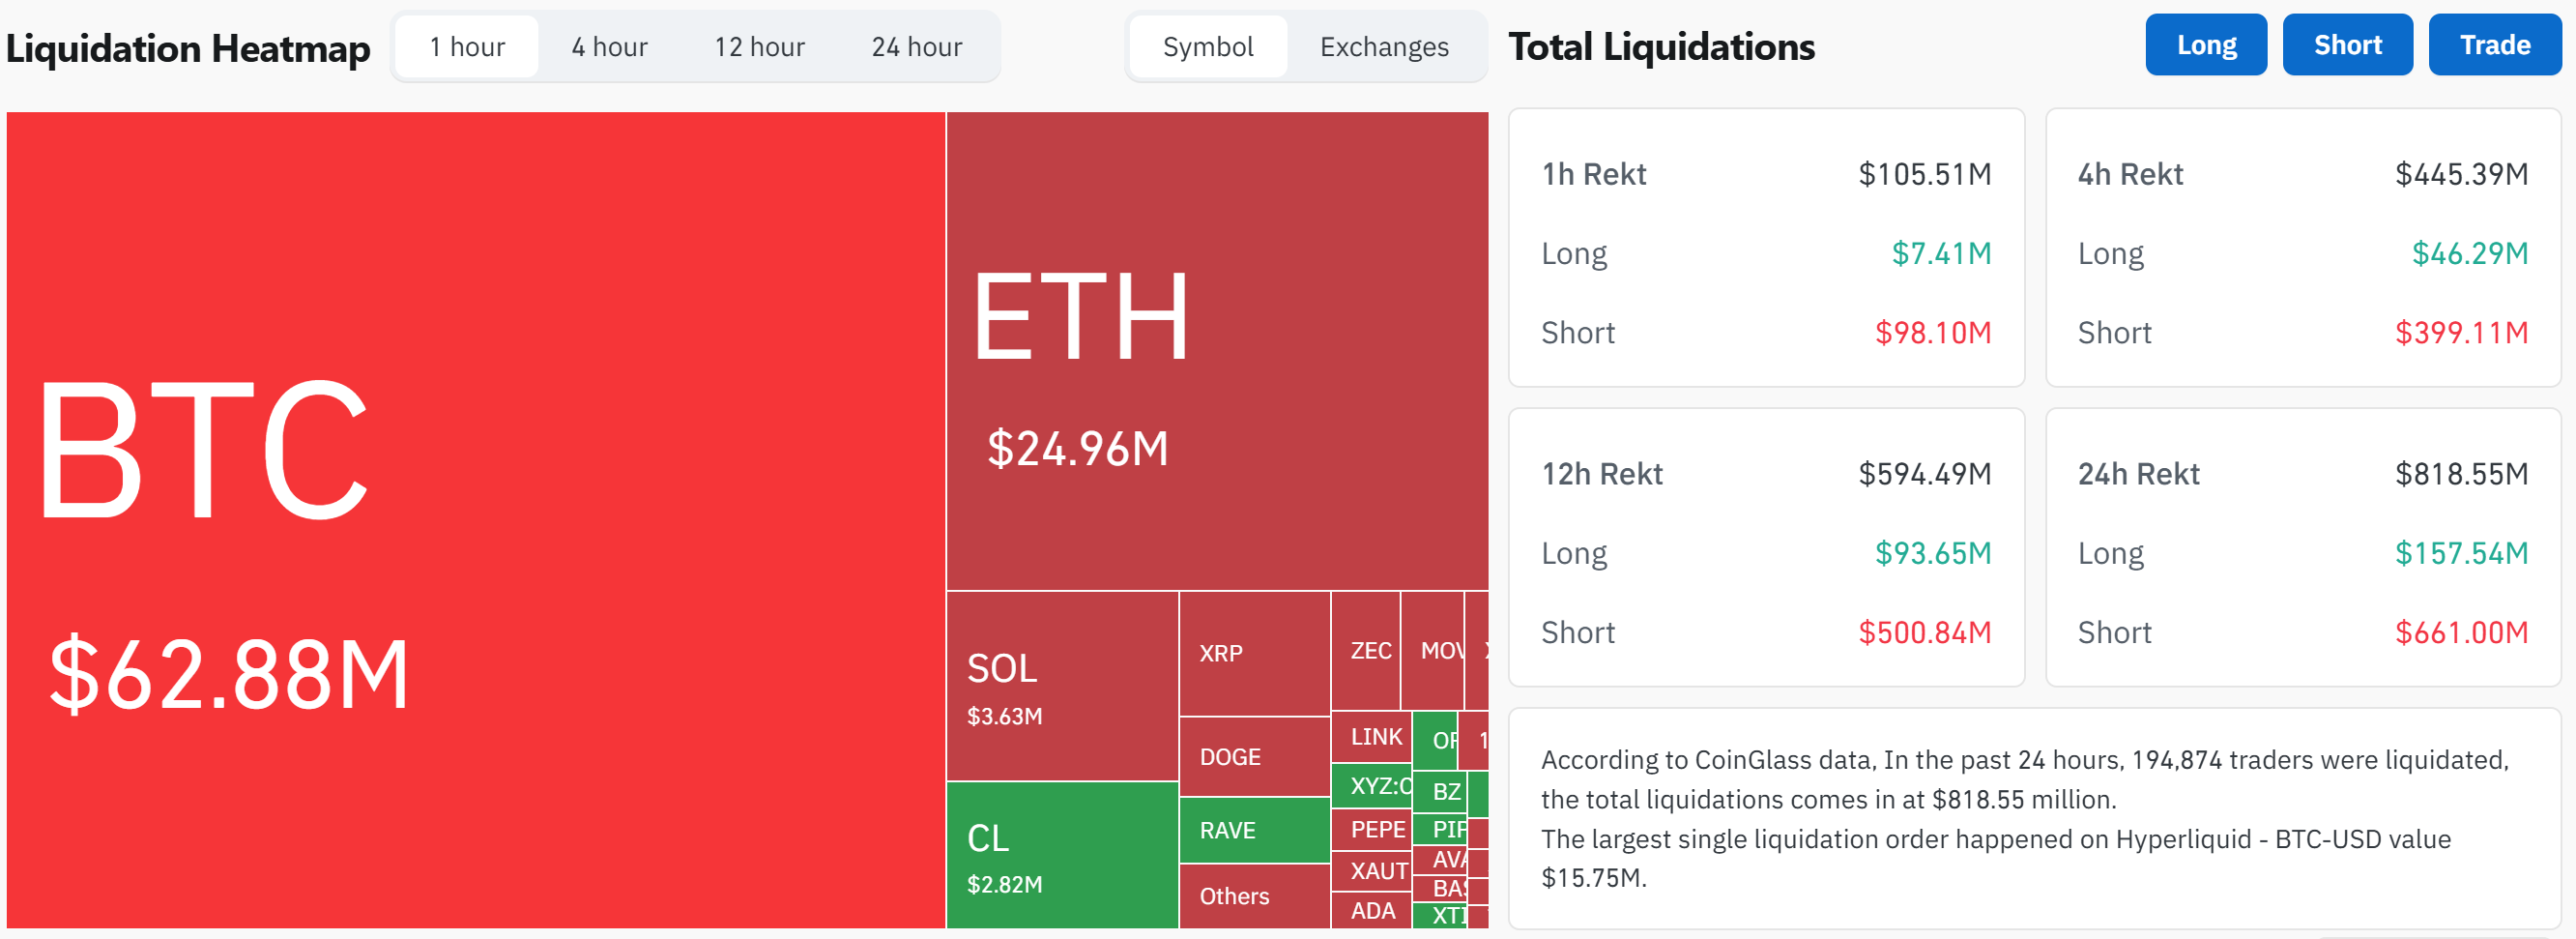
Indeed, Bitcoin’s foray past $76,000 provided an entry for long positions, with a brief test of the $78,000 threshold on Friday catching many naysayers off guard. According to Coinglass data, nearly $100 million in short positions were liquidated in the last hour.
Bear Market Warnings Temper Optimism
Despite the short-term bullish structure, Rekt Capital also flagged significant macro headwinds. He argued that for BTC to build sustained bullish momentum, it would need to reclaim $82,500 and break its multi-month series of lower highs.
History suggests neither milestone will happen, with roughly six months of bear market potentially remaining.
The 21-week exponential moving average (EMA), which tends to act as resistance during bear markets, sits directly in the current price path. The broader oil shock from the Hormuz crisis adds another layer of macro uncertainty.
BTC is also clustering beneath a macro triangle it broke down from months ago, a pattern that in 2014 resolved through distribution to the downside.
QCP Group echoed the caution, noting that derivatives desks still favor downside protection. The rally appears spot-driven and fragile rather than a structural trend change.
Ted Pillows separately disclosed plans to short BTC near the $79,000 to $80,000 zone, citing a pattern from the last two local tops where price took out the capitulation candle’s highs before reversing.
On-Chain Data Signals Accumulation but Needs Confirmation
Meanwhile, multiple on-chain indicators have flashed mixed signals throughout April. CryptoQuant analyst Woo Mink Yu pointed to the Bitcoin Combined Market Index, or BCMI, which has dropped into the 0.2 to 0.3 range.
This zone has historically marked deep undervaluation.
“We are entering a ‘Value-Accumulation Zone.’ The data suggests the downside is becoming limited compared to the long-term upside. However, wait for price stabilisation to confirm the index’s bottom signal,” wrote Cryptoquant analyst Woominkyu.
Supporting the case for a healthier rally, separate CryptoQuant data showed that Binance open interest has plunged even as the price climbs.
A rally built on spot demand rather than leverage significantly reduces the risk of sudden liquidation cascades.
Meanwhile, exchange inflows on Binance have fallen to 2020 levels, suggesting holders prefer to sit tight rather than sell into strength.
Still, a separate data point flagged roughly 11,000 BTC per hour moving to exchanges this week, the highest rate since December 2025.
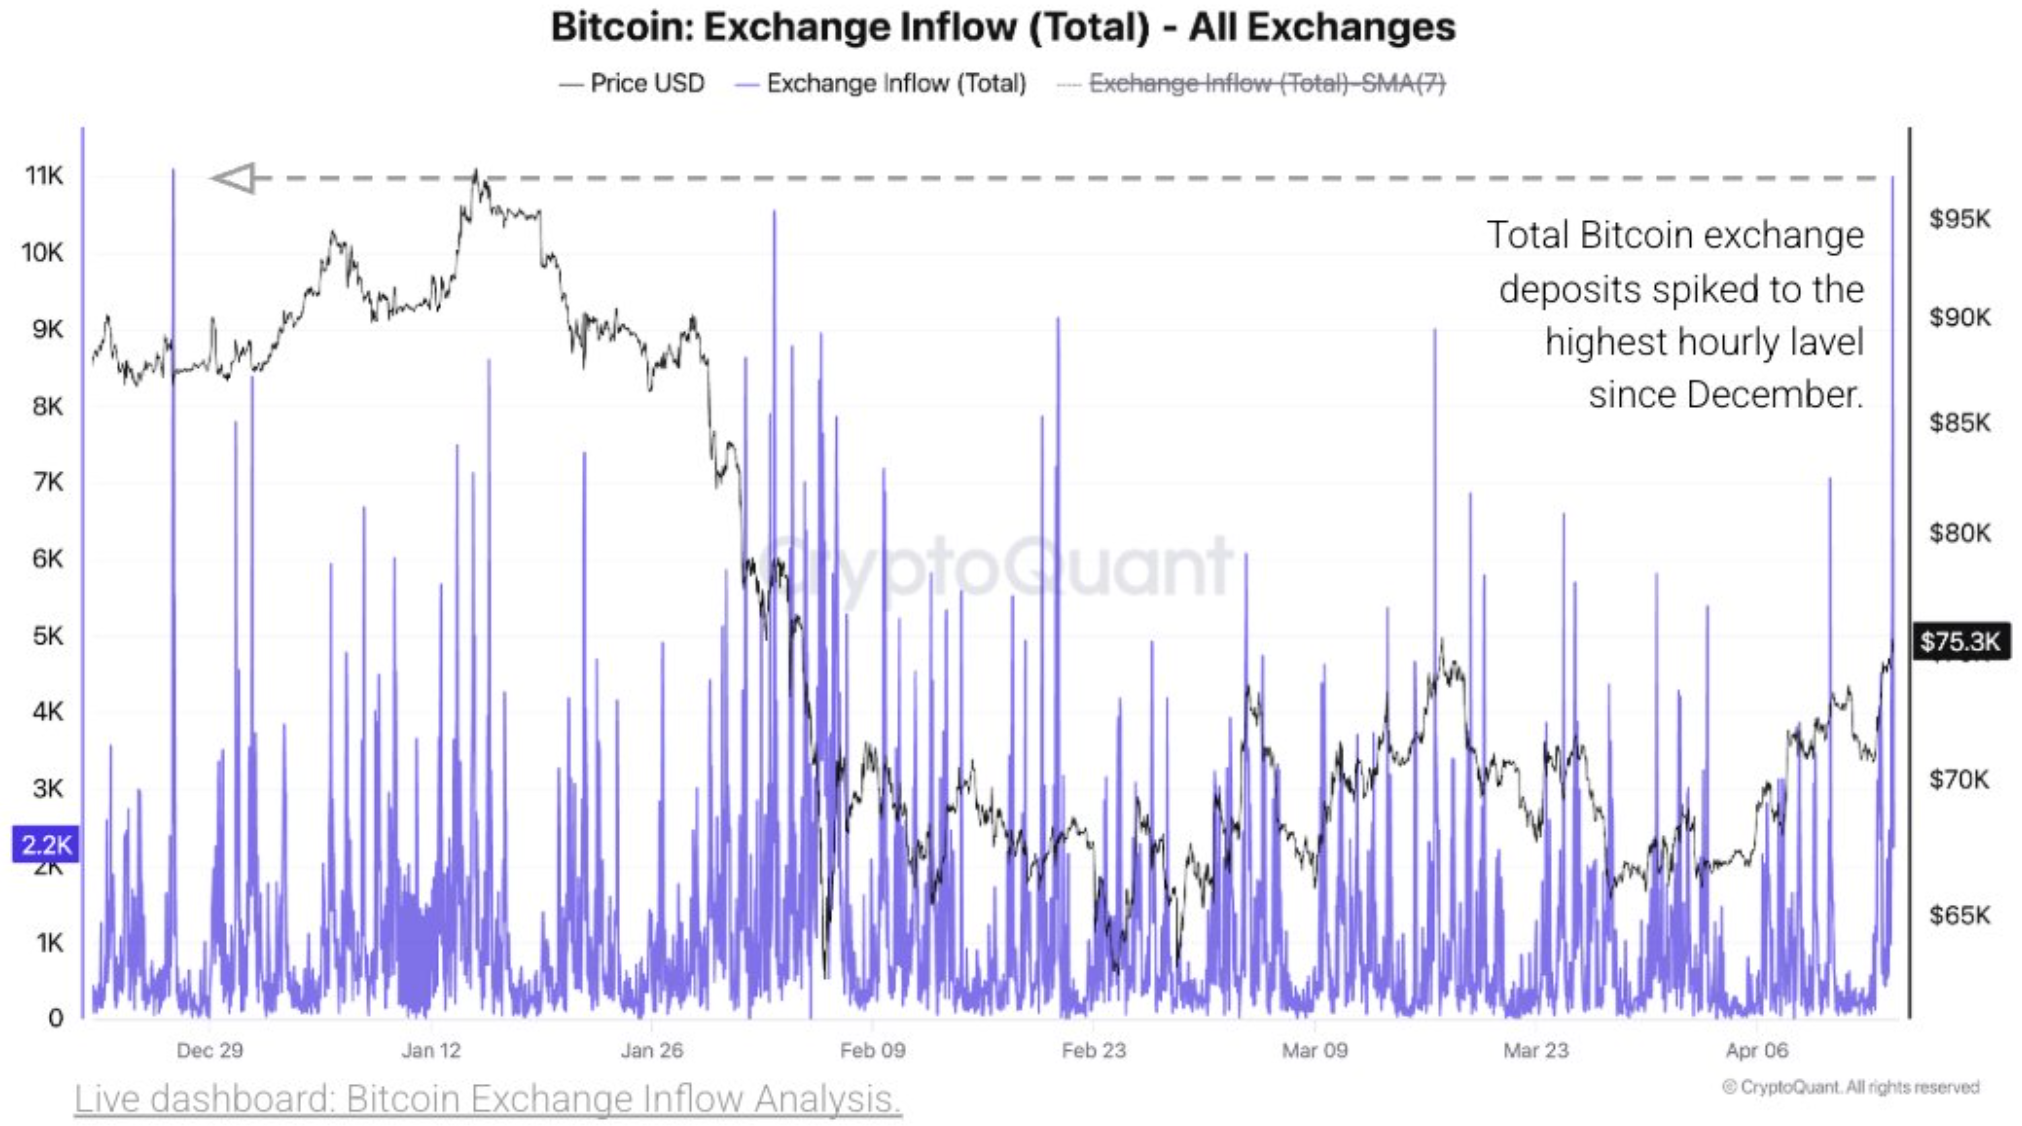
Large holders may be positioning to distribute if the rally extends further.
Earlier forecasts for April projected BTC reaching the mid-$70,000s by month’s end. Friday’s daily close will likely determine whether BTC’s breakout above $77,000 translates into a genuine push toward $80,000 or becomes another failed attempt in a broader bear market structure.
The post Can Bitcoin Reach $80,000 This Weekend as the Strait of Hormuz Opens? appeared first on BeInCrypto.


BTC has broken $77K with 3.45% daily gains, but Coinglass shows $2.221B of longs below $73,610 and $913M of shorts above $81,264, turning the range into a leverage trap.
Summary
- Bitcoin has broken through $77,000 on Gate, with BTC/USDT last changing hands around $77,019 and up 3.45% over the past 24 hours.
- The move comes as Coinglass data show roughly $2.221 billion in BTC longs sitting below $73,610 and $913 million of shorts above $81,264, turning the $70,000–$80,000 band into a heavily levered zone.
- Traders now face a market where even a 5–7% swing can trigger multi‑billion‑dollar liquidation cascades, echoing earlier patterns around $65,000 and $68,000 flagged by Bitcoin liquidation maps.
Bitcoin (BTC) pushed through another psychological round number on Friday, with Gate’s BTC/USDT pair trading around $77,019 and posting a 24‑hour gain of 3.45% as bids continued to grind higher. The latest leg up extends a broader run that has taken BTC from the mid‑$60,000s into the high‑$70,000s over recent weeks, aided by steady spot demand and persistent futures leverage.
BTC clears $77K with liquidations looming
Derivatives data from Coinglass suggest that climb is now happening inside a tight, leveraged corridor. The platform’s liquidation‑levels dashboard shows that “if BTC falls below $73,610, the cumulative long liquidation intensity on major CEXs will reach $2.221 billion,” while a break above $81,264 would put about $913 million of short positions at risk. In other words, a few thousand dollars in either direction from current levels sit atop roughly $3.1 billion of potential forced flows.
Coinglass describes its Bitcoin liquidation heatmap as a way to “estimate price ranges where large‑scale liquidation events may occur,” aggregating leverage across venues such as Binance, OKX and Bybit. Its public materials warn that when price crosses dense liquidation bands, exchanges closing positions “may cause sharp price movements and significantly impact traders’ positions,” especially when open interest is elevated.
A recent crypto.news story on Bitcoin’s liquidation map highlighted an earlier setup around $65,000 and $68,000, where about $1.143 billion of longs and $754 million of shorts were clustered in a narrow range. At that time, Coinglass called those levels “sensitivity zones” that could turn a modest move into an outsized liquidation cascade, a pattern now re‑appearing at higher prices.
Similar leverage dynamics have been visible on Ethereum, where Coinglass data recently flagged near‑$2,000 “trapdoor” levels for longs and a $2,451 liquidation wall threatening $1.47 billion of shorts. Another crypto.news analysis of ETH liquidation walls between $2,057 and $1,863 described how densely packed futures positions can amplify even routine pullbacks.
With BTC now above $77,000, the focus for traders is whether spot demand can keep climbing without triggering the $73,610 downside “trapdoor” or a violent short squeeze beyond $81,264. Those running aggressive leverage into either band are effectively betting that they can front‑run the next liquidation wave rather than be on the wrong side of it.

Bitcoin moved to ten-week highs near $77,000 on Bitstamp as the market readied for the weekly close and weighed the potential for a broader rally back toward the upper end of the $80,000s. The price action came amid a broader risk-on environment, with equities and macro indicators pointing to a calmer backdrop after weeks of volatility driven by geopolitical and supply concerns.
Data from TradingView confirmed BTC briefly topping $77,027, its highest level in roughly two and a half months. The move coincided with a surge in stock benchmarks, as the S&P 500 reached a level of about 7,050 points on Thursday—the first time the index has traded at that mark and sealing its highest-ever close, marking a second all-time high for the week. In crypto markets, the mood shifted toward relief as geopolitical tensions appeared to ease, supporting appetite for risk assets overall.
Meanwhile, traders watched how on-chain liquidity and market structure might shape the next leg. Prominent voices in the space highlighted the role of growing interest from institutional players and the potential for spot BTC ETFs to attract new inflows as macro volatility declines.
“As long as the VIX continues to fall, and we’re in a new equilibrium where oil volatility and gold volatility drop, we should see renewed interest from allocators toward Bitcoin,” wrote Michaël van de Poppe, a well-known trader, on X. He added that a shift in sentiment toward BTC ETFs could bring broader inflows into the space. In the same thread, he projected a path toward the mid-to-high $80,000s if momentum persists.
“What will you start to see? More inflows in the BTC ETF as allocators can allocate more towards Bitcoin.”
Late-week data from Farside Investors underscored that sentiment in the U.S. spot BTC market, noting that weekly inflows into US spot Bitcoin ETFs reached a net $330 million for the week-to-date. The prospect of sustained ETF demand, together with improving risk appetite, fed expectations that Bitcoin could accelerate its ascent in the coming weeks, potentially lifting other digital assets in tandem with BTC.
Van de Poppe reiterated a bullish short- to medium-term thesis, suggesting that if ETF demand and macro conditions hold, Bitcoin could advance toward the $85,000–$88,000 area within the next two to four weeks. He linked the potential rally to a reduction in macro-volatility alongside a cooling in broader market fear gauges, and to new ETF inflows that could unlock fresh capital allocation into the space.
On the chart, the analyst offered a technical view that aligns with a broader bullish scenario: the price could extend its gains so long as the market maintains constructive support above key levels. A separate trader, Rekt Capital, pointed to $72,800 as a pivotal daily close level for BTC/USD to sustain a weekly breakout above resistance around $72,810. He warned that failing to hold that level on dips could trap price in a deeper pullback toward the established weekly range.
“If Bitcoin wants to Weekly Close above the Weekly resistance ($72,810), then price would need to hold the blue level as support on any upcoming dip,” he explained. “The last time Bitcoin rejected from the black resistance in mid-March, price also lost the blue level as support. Which is why a Daily Close below the blue level after any upcoming dip could see price drop back into the blue-blue Weekly Range.”
In parallel, another perspective cautioned that volume dynamics could foreshadow a correction rather than a continuation of the rally. Trader Roman argued that declining trading volume into the highs signals fading momentum, while a high-volume move could push prices lower in a macro-downtrend environment. “We’re in a macro downtrend which when we see high volume continues downward. Low volume implies consolidation/correction to continue the overall trend,” Roman wrote, adding that the next high-volume move is likely to take BTC lower.
The near-term path for Bitcoin sits at a crossroads. On one hand, stronger ETF demand and easing macro volatility could deliver a fresh impulse for BTC and, by extension, for the broader crypto market. On the other hand, thin liquidity during rallies and the risk of a volume-led pullback remind traders to stay mindful of the potential for a test of key supports should momentum fade.
To put the current price action in context, observers have pointed to a broader spectrum of possible macro outcomes. Some analysts argue the market could see a deeper drawdown toward sub-$50,000 levels if macro risk resurges or if volume dries up and fails to sustain a breakout. That framing underscores the importance of watching not just price but also liquidity and institutional flow as Bitcoin navigates this phase of renewed attention from traders and investors alike.
In sum, Bitcoin’s attempt to extend gains beyond $77,000 comes at a moment when ETF inflows, macro calm, and selective risk appetite are aligning to push the narrative higher. While the path to $85,000–$88,000 remains contingent on ongoing demand and favorable technicals, the evolving dynamics around ETF participation and volume will likely shape the next few weeks as investors weigh what comes next for BTC and the wider crypto market.
This article is based on market data and commentary available as of the time of writing. Readers should note that crypto markets remain volatile, and outcomes depend on a range of evolving factors including policy, liquidity, and global risk sentiment.
Crypto World
Ethereum Whales Are Sitting on a Breakeven Ceiling at $2,400 Price: Are They About to Kill the Rally?

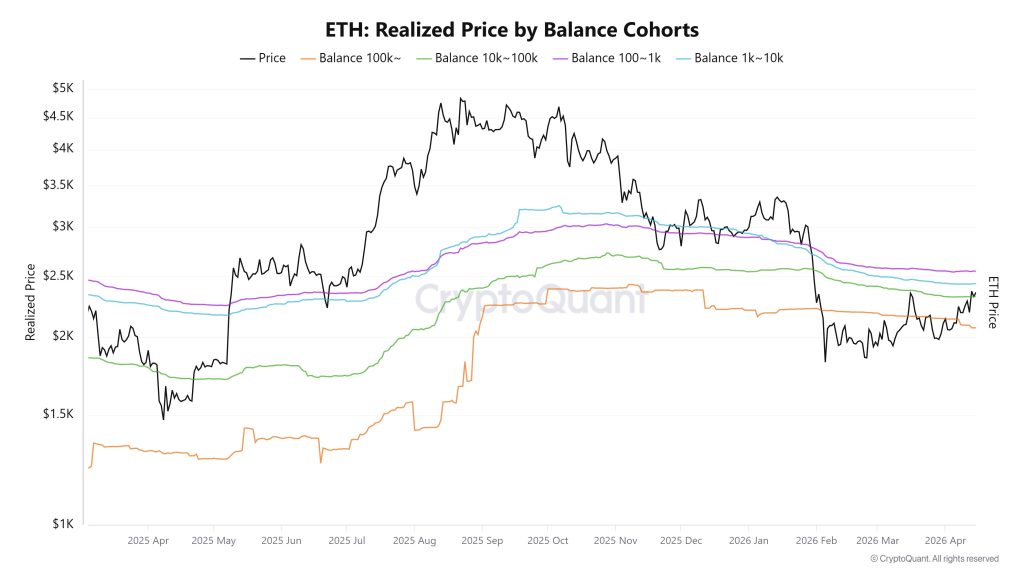
Ethereum price is trading at $2,350–$2,351 after posting back-to-back daily gains of 4.76% and 6.32% in recent sessions, but the chart is telling a more complicated story.
Distribution pressure from whale cohorts sitting near their average cost basis is creating a ceiling that bulls haven’t cracked yet. One resistance level, in particular, is doing most of the heavy lifting right now.
According to Cryptoquant, key whale and retail cohorts carry average cost basis levels between $2,324 and $2,436, a band that neatly brackets current price action and creates natural sell pressure as holders look to exit near breakeven.
US spot ETH ETF inflows returned at $67.8 million on Wednesday after five straight days of net inflows per SoSoValue data, signaling slow but real institutional re-engagement.
Meanwhile, $111.6 million in liquidations hit over the last 48 hours, $70.8 million of that in longs, per Coinglass, a bruising reminder that leverage remains a liability at these levels.
Broader crypto sentiment has stabilized alongside equity markets, but ETH’s internal metrics suggest the recovery lacks the volume conviction needed to flip the next major resistance zone. The next 72 hours may determine whether this is a base-building phase or a fakeout.
Discover: The best crypto to diversify your portfolio with
Can Ethereum Price Break $2,400 and Confirm a Bullish Trend Reversal?
Ethereum price is basically stuck right under a ceiling, and $2,400 is the level doing all the damage, because it lines up with both resistance and the 100-day EMA, and every push into it keeps getting rejected.
The structure underneath still looks solid, though, with price holding above the 20 and 50-day averages, which keeps the bias slightly bullish as long as that holds.
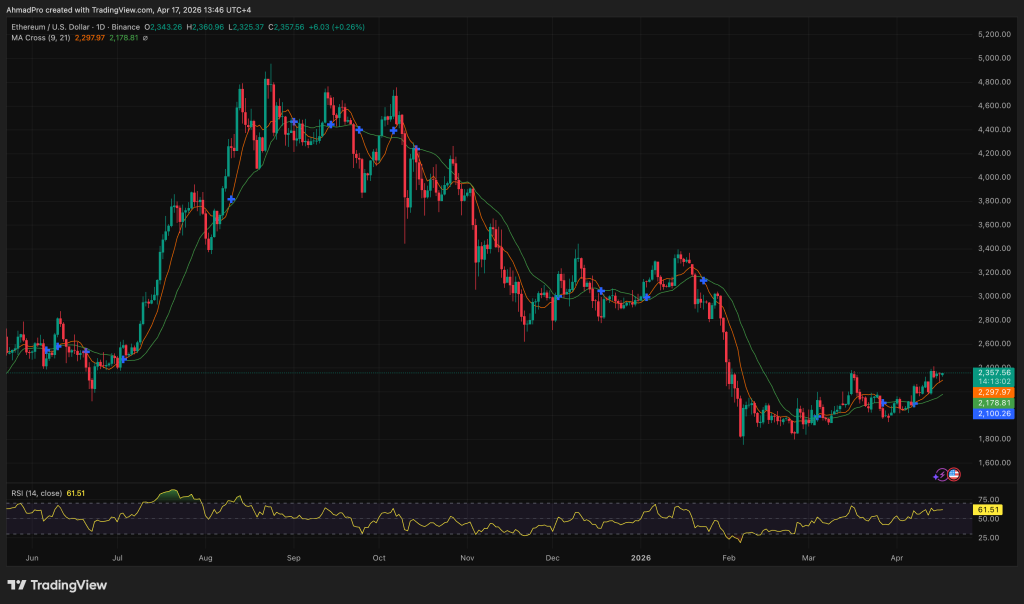
Momentum is kind of neutral right now, RSI is sitting in the middle, and MACD is still weak but flattening, which usually means a bigger move is building but has not picked a direction yet.
If ETH can break above $2,400 with real volume, that is where things open up quickly toward $2,500 and higher, because the structure is already in place for continuation.
But if it keeps failing at this level, a pullback becomes more likely, with $2,200 as the first area that needs to hold, and if that goes, it can slide further down fast.
So this is one of those tight setups where everything comes down to one level, break it, and it runs, fail it again, and it pulls back.
Discover: The best pre-launch token sales
LiquidChain Targets Early-Mover Upside as Ethereum Tests Key Resistance
ETH’s recovery is real, but the math of upside from $2,350 to, say, $3,000 represents roughly 27% — respectable, but not the kind of asymmetric return that early crypto cycles are built on.
For traders watching Ethereum’s open interest dynamics and waiting for confirmation before sizing up, there’s a parallel conversation happening in early-stage infrastructure.
LiquidChain (LIQUID) is an L3 infrastructure project with a specific, structural pitch: it fuses Bitcoin, Ethereum, and Solana liquidity into a single execution environment, which the project calls a Unified Liquidity Layer. Developers deploy once and access all three ecosystems.
The mechanics include Single-Step Execution, Verifiable Settlement, and a Deploy-Once Architecture designed to eliminate the fragmentation that still quietly kills cross-chain DeFi strategies. The presale is currently priced at $0.0145, with $675,934.65 raised to date.
That’s early-stage traction, not a completed raise — and the distinction matters. Presales carry execution risk, no liquidity guarantees, and token unlocks that can pressure price post-launch. Do the work before committing capital.
The post Ethereum Whales Are Sitting on a Breakeven Ceiling at $2,400 Price: Are They About to Kill the Rally? appeared first on Cryptonews.
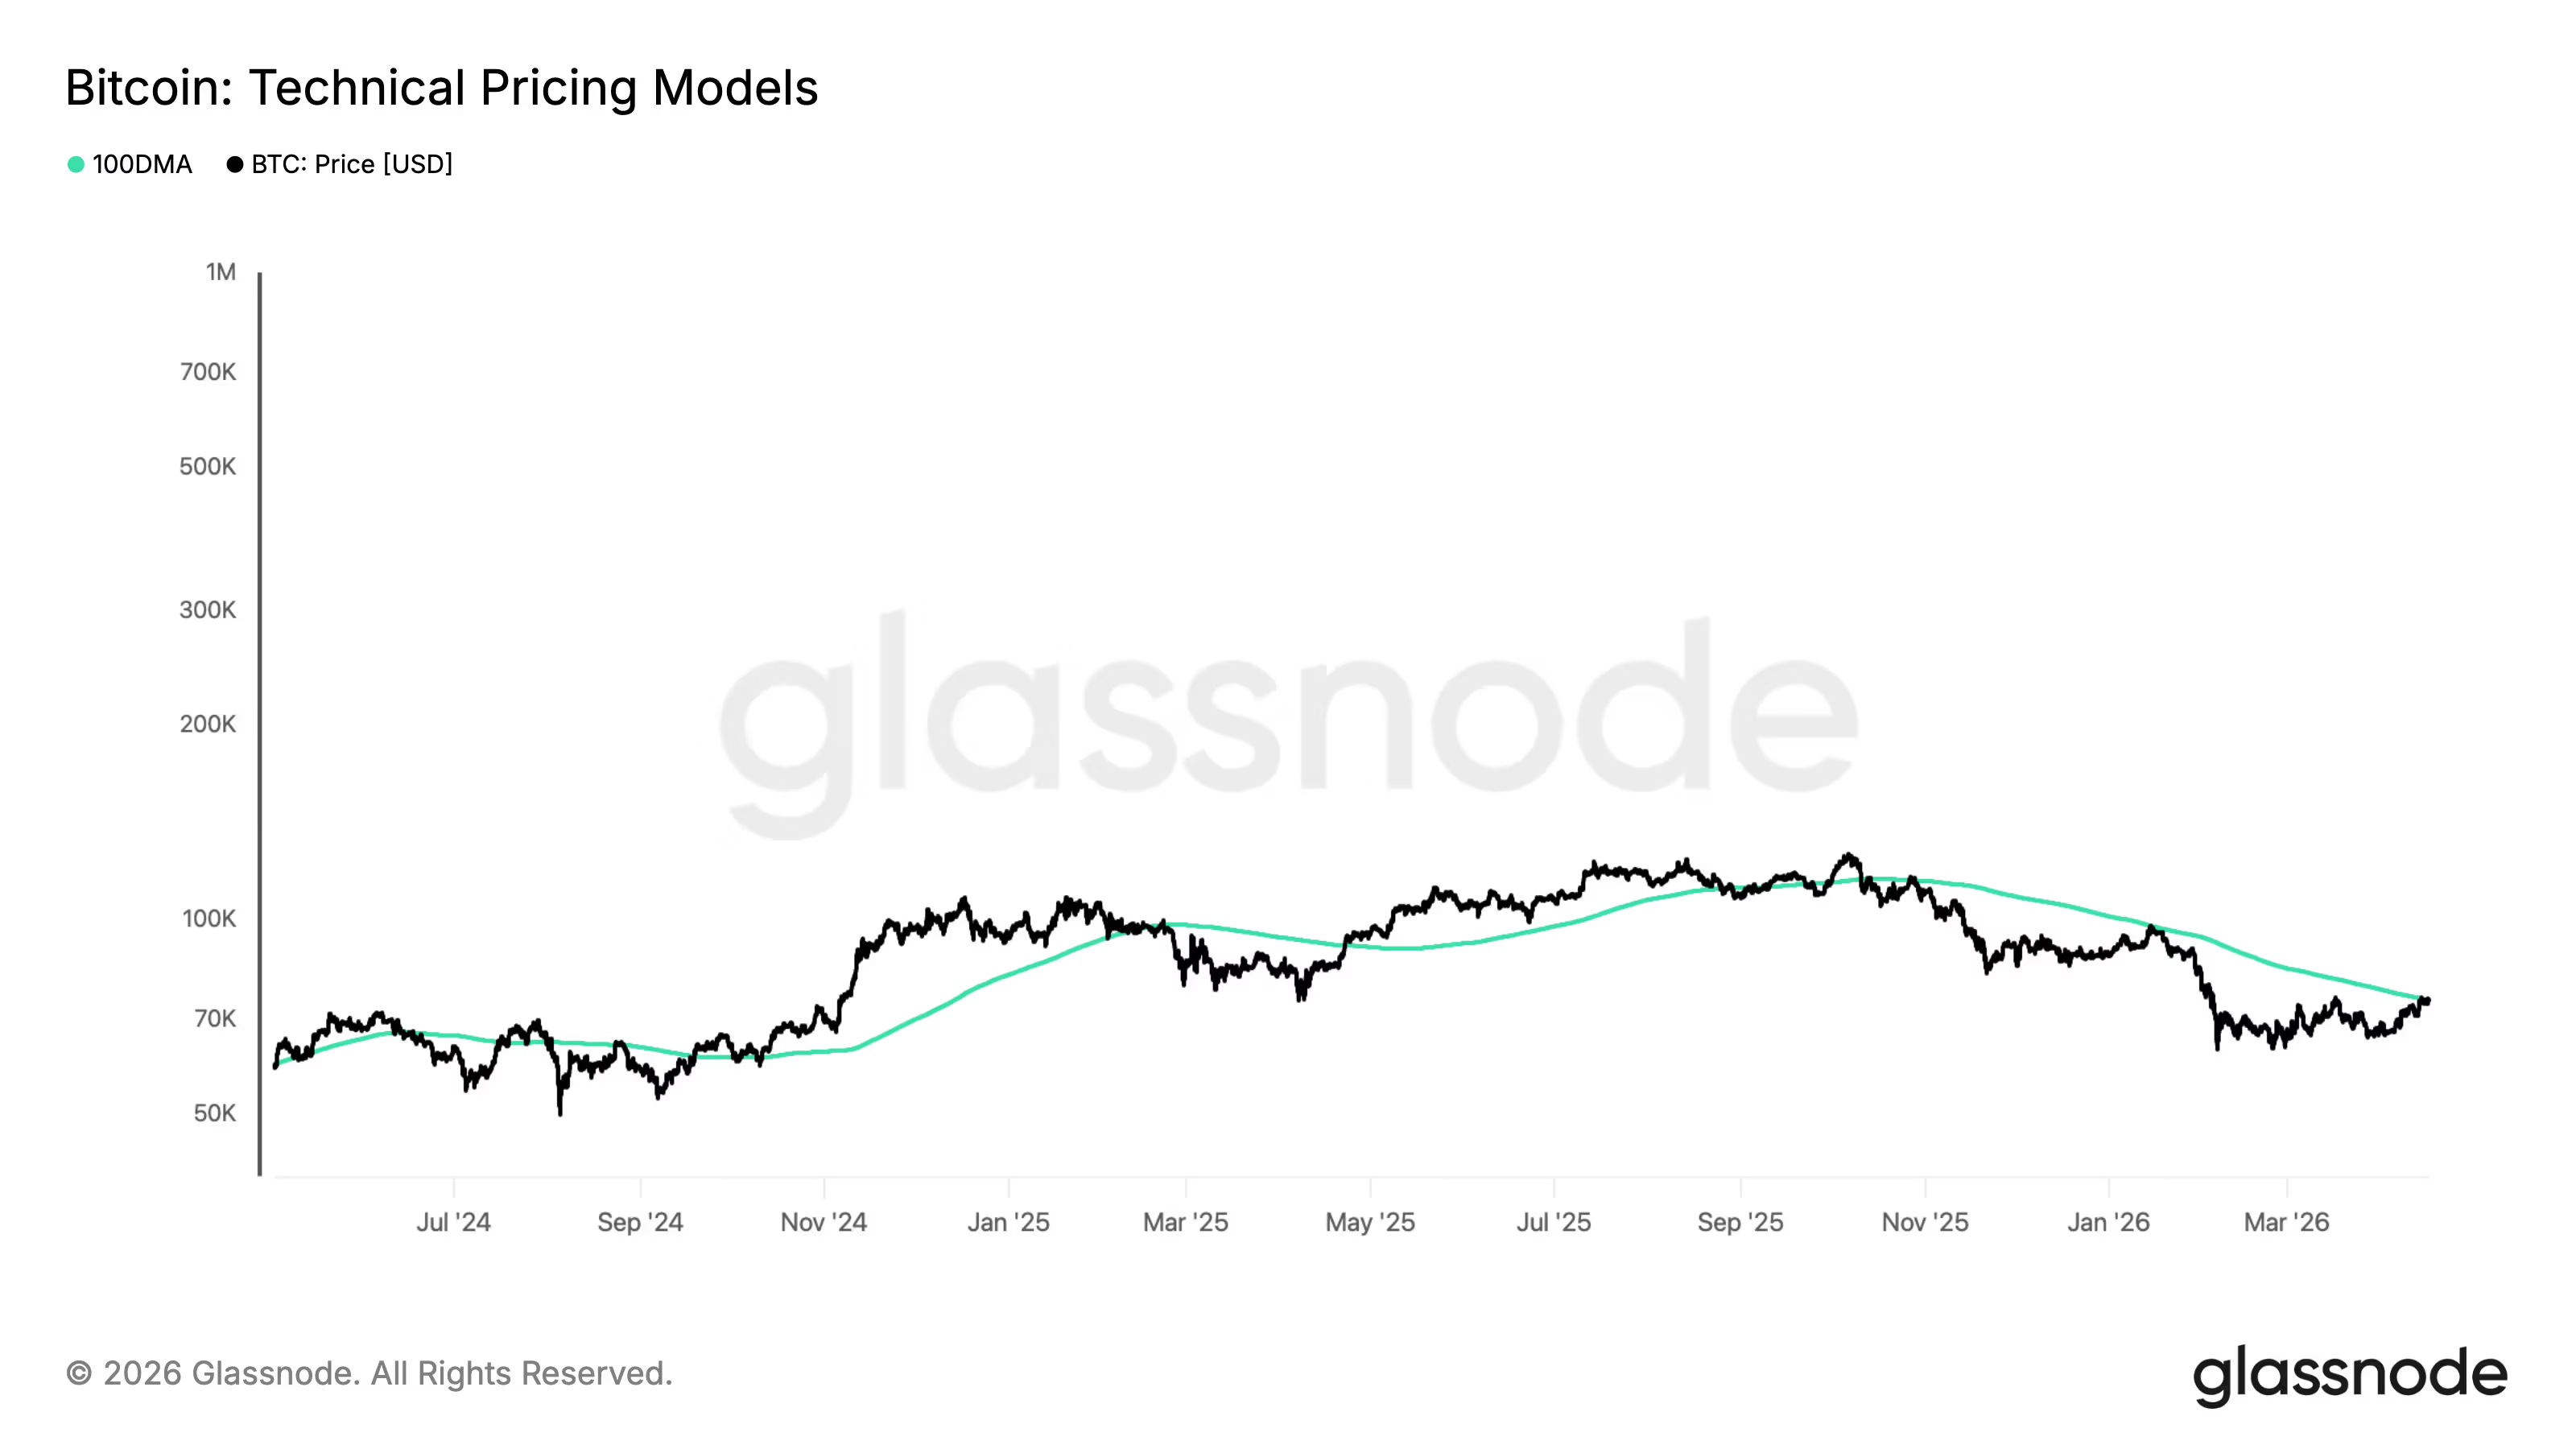
Bitcoin has decisively broken above $77,000 for the first time since its sharp selloff on Feb. 5, when it dropped to a low near $60,000.
The breakout also carries positive implications for Strategy (MSTR), the largest publicly traded holder of bitcoin. The company is now back in profit on its bitcoin holdings, with an average purchase price of $75,577.
Ahead 8% today, MSTR is also trading above its 200-week moving average, a long-term trend indicator that smooths price data over roughly 4 years.
BTC has rallied more than 25% and now trades above its 100-day moving average (100DMA) of $74,774 since bottoming in early February. The previous two tests of this level resulted in rejections and further downside, adding weight to the current move higher.
Bitcoin briefly traded as high as $76,700 on Feb. 4 before continuing lower. A later recovery attempt on March 17 also stalled at $76,013, making the current breakout above $76,300 more notable.


Dollar index DXY erases its Iran war gains as Hormuz blockade scales down, safe‑haven flows unwind, and traders pivot from conflict hedges to ceasefire politics.
Summary
- The U.S. dollar index has erased its entire wartime gain after Iran reopened the Strait of Hormuz.
- DXY fell 0.5% intraday to its weakest level since February 27 as safe‑haven flows reversed.
- Investors are shifting focus from conflict risk to ceasefire terms and a broader political settlement.
The U.S. dollar gave back all of its war‑related gains on Friday after Iran declared the Strait of Hormuz “completely open” to commercial shipping, sending the dollar index (DXY) down 0.5% intraday to its lowest level since February 27. According to data from Gate, the move marks a full reversal of the safe‑haven bid that drove the greenback higher when the U.S.–Iran conflict first erupted.
As tankers resumed passage through one of the world’s most critical oil chokepoints, positioning in currency markets flipped from defence to détente, with traders now pricing a durable ceasefire and negotiations toward a broader agreement. Jayati Bharadwaj, head of foreign exchange strategy at TD Securities, summed up the shift bluntly: “Safe-haven buying has begun to fade. That is the reason for the dollar’s decline.”
The dollar index had previously climbed as investors sought protection from the risk of supply disruption in the Strait of Hormuz, which handles roughly a fifth of global seaborne crude flows, pushing oil well above $100 per barrel at the height of the crisis. With the channel now reopened and headlines dominated by ceasefire mechanics rather than escalation, that conflict premium is rapidly being unwound across foreign‑exchange markets.
Bharadwaj and her team at TD Securities have argued in recent research that while the dollar can still behave like a haven in acute shocks, its longer‑term appeal is weakening as U.S. growth “exceptionalism” fades and capital rotates into Europe and Asia.
That narrative appears to be reasserting itself as the Iran risk recedes, with DXY slipping back toward levels last seen before the first missiles flew and implied volatility in major currency pairs edging lower.
Traders are now more focused on the durability of the ceasefire and the contours of any eventual U.S.–Iran settlement than on shipping disruptions in the Gulf, shifting attention from immediate hedging to medium‑term rate expectations and growth differentials. If talks hold and energy prices stabilize, strategists at several major banks have warned that the dollar could continue to grind lower as investors rebuild positions in risk assets that were cut during the height of the crisis.
For crypto markets that trade against the dollar leg, a softer greenback has historically coincided with stronger risk appetite, reinforcing the role of dollar liquidity and macro politics in driving digital‑asset cycles. As the Strait of Hormuz shifts from flashpoint back to shipping corridor, the dollar’s retreat underlines how quickly safe‑haven trades can reverse once the worst‑case scenario is taken off the table.


Have you had “deploy a stablecoin” and “build an AI agent” on your business to-do list since the beginning of the year?
You know these technologies will create business efficiencies, but finding the time to really get a grasp, a hands-on grasp, of these solutions has proved hard to find. You might even feel like you’re falling behind.
Not for long, you hard-working department head.
CoinDesk is launching the School of Stablecoins and Agentic Commerce at its upcoming Consensus 2026 conference, happening May 5-7 in Miami. These programs include interactive sessions with expert hosts leading you through the biggest cost-saving stablecoin use cases and the easiest implementations of AI agents that can lighten your workload and maybe even secure some big-time bets.
These sessions are for finance and product leaders, operators and entrepreneurs, and executive teams navigating what’s next.
Each workshop has plenty of complements on CoinDesk’s program of keynotes, fireside chats and panel discussions, allowing you to take the big picture insights and turn them into concrete tools you can take back to your team.
Take payments for example. During the “Stablecoins Go Global” panel discussion, you get inspired to adopt USDC in your business. But where do you practically start? “Setting Up a Stablecoin Wallet and Dashboard” hosted by Circle on the University workshop stage.
Or consider AI agents. After hearing the conversation at the “Agents Meet the Enterprise” panel, you want someone to give you a step-by-step tutorial on setting up OpenClaw and writing killer prompts that 10x your efficiency. We’ve got you covered.
Over the course of the three-day show, you’ll get workflow walkthroughs, product demos, and actionable insights for becoming your company’s crypto and AI guy or gal. And that’ll come in handy given these aren’t just niche tools for tech fanatics, or even just the intersection of DeFi and TradFi; these are products and services that every user and business can benefit from.
In this current era of unprecedented innovation and change, CoinDesk University is the place to learn from the visionaries and developers actually building these tools. You’re getting your education directly from the source with these powerful sessions.
Take a look at our current schedule of University workshops here. You’ll be favoriting all these to your schedule.

Resistance forces Israel into 10-day ceasefire but much remains unclear in Lebanon

UFC light heavyweight champion Carlos Ulberg undergoes surgery to repair torn ACL

Grinex exchange blames “Western intelligence” for $13.7M crypto hack


-

 Politics7 days ago
US brings back mandatory military draft registration
-

 Fashion7 days ago
Weekend Open Thread: Veronica Beard
-

 Politics5 days ago
World Cup exit makes Italy enter crisis mode
-

 Business7 days ago
Tesla Model Y Tops China Auto Sales in March 2026 With 39,827 Registrations, Beating Cheaper EVs and Gas Cars
-

 Crypto World4 days ago
The SEC Conditionalises DeFi Platforms to Be Avoided for Broker Registration
-

 Crypto World4 days ago
SEC Signals Exemption for Crypto Interfaces From Broker Registration
-

 News Videos2 days ago
Secure crypto trading starts with an FIU-registered
-
 NewsBeat5 days ago
Pep Guardiola and Gary Neville agree over Arsenal title problem that benefits Man City
-

 Sports8 hours ago
NWFL Suspends Two Players Over Post-Match Clash in Ado-Ekiti
-

 Crypto World3 days ago
SEC Proposes Certain Crypto Interfaces Don’t Need to Register as Brokers
-

 Business6 days ago
Ireland Fuel Protests Enter Day 5 as Blockades Spark Shortages and Government Prepares Support Package
-

 NewsBeat3 days ago
Trump and Pope Leo: Behind their disagreement over Iran war
-

 Crypto World7 days ago
Federal judge blocks Arizona from bringing criminal charges against Kalshi
-
 NewsBeat5 days ago
JD Vance announces ‘no agreement’ with Iran over nuclear weapons fear
-

 Business7 days ago
IMF retains floor for precautionary balances at SDR 20 billion
-
Sports5 days ago
Dexter Lawrence, Stefon Diggs, Trading for De’Von Achane
-

 Business7 days ago
Former Liverpool CEO eviscerates FIFA for World Cup ticket pricing
-
 Crypto World5 days ago
Sei Network Enters Quiet Reset Phase as On-Chain Metrics Signal a Slowdown in 2026
-

 Crypto World4 days ago
Trump whales load up ahead of Mar-a-Lago luncheon.
-
Business7 days ago
Coreweave CSO Venturo sells $5.5m in class a common stock
You must be logged in to post a comment Login