
Crypto World
Dollar slides as Hormuz war premium evaporates


Dollar index DXY erases its Iran war gains as Hormuz blockade scales down, safe‑haven flows unwind, and traders pivot from conflict hedges to ceasefire politics.
Summary
- The U.S. dollar index has erased its entire wartime gain after Iran reopened the Strait of Hormuz.
- DXY fell 0.5% intraday to its weakest level since February 27 as safe‑haven flows reversed.
- Investors are shifting focus from conflict risk to ceasefire terms and a broader political settlement.
The U.S. dollar gave back all of its war‑related gains on Friday after Iran declared the Strait of Hormuz “completely open” to commercial shipping, sending the dollar index (DXY) down 0.5% intraday to its lowest level since February 27. According to data from Gate, the move marks a full reversal of the safe‑haven bid that drove the greenback higher when the U.S.–Iran conflict first erupted.
As tankers resumed passage through one of the world’s most critical oil chokepoints, positioning in currency markets flipped from defence to détente, with traders now pricing a durable ceasefire and negotiations toward a broader agreement. Jayati Bharadwaj, head of foreign exchange strategy at TD Securities, summed up the shift bluntly: “Safe-haven buying has begun to fade. That is the reason for the dollar’s decline.”
The dollar index had previously climbed as investors sought protection from the risk of supply disruption in the Strait of Hormuz, which handles roughly a fifth of global seaborne crude flows, pushing oil well above $100 per barrel at the height of the crisis. With the channel now reopened and headlines dominated by ceasefire mechanics rather than escalation, that conflict premium is rapidly being unwound across foreign‑exchange markets.
Bharadwaj and her team at TD Securities have argued in recent research that while the dollar can still behave like a haven in acute shocks, its longer‑term appeal is weakening as U.S. growth “exceptionalism” fades and capital rotates into Europe and Asia.
That narrative appears to be reasserting itself as the Iran risk recedes, with DXY slipping back toward levels last seen before the first missiles flew and implied volatility in major currency pairs edging lower.
Traders are now more focused on the durability of the ceasefire and the contours of any eventual U.S.–Iran settlement than on shipping disruptions in the Gulf, shifting attention from immediate hedging to medium‑term rate expectations and growth differentials. If talks hold and energy prices stabilize, strategists at several major banks have warned that the dollar could continue to grind lower as investors rebuild positions in risk assets that were cut during the height of the crisis.
For crypto markets that trade against the dollar leg, a softer greenback has historically coincided with stronger risk appetite, reinforcing the role of dollar liquidity and macro politics in driving digital‑asset cycles. As the Strait of Hormuz shifts from flashpoint back to shipping corridor, the dollar’s retreat underlines how quickly safe‑haven trades can reverse once the worst‑case scenario is taken off the table.


Summary
- Coinglass data show about $1.044 billion of Ethereum longs would be exposed to forced liquidations on major centralized exchanges if ETH drops below $2,323.
- On the upside, a clean move above $2,563 would flip pressure onto bears, with roughly $531 million of short positions at risk of liquidation across the same venues.
- The new band extends an April pattern in which more than $1.8 billion of leverage has repeatedly clustered in tight ranges, turning 5–7% moves into outsized liquidations for over‑levered traders.
Fresh Coinglass heatmap data suggest Ethereum is again sitting between two sizeable liquidation walls, with leverage stacked just below and above spot. According to the latest read‑out, if ETH slides below $2,323, cumulative long liquidation intensity on mainstream centralized exchanges would reach around $1.044 billion, while a break above $2,563 would trigger up to $531 million in short liquidations.
Coinglass maps new ETH liquidation corridor
Coinglass describes its liquidation heatmaps as tools to “estimate price ranges where large‑scale liquidation events may occur,” aggregating futures and perpetual swap data from venues such as Binance, OKX and Bybit. The platform notes that liquidations can “cause sharp price movements and significantly impact traders’ positions,” as forced selling or buying cascades once price crosses dense clusters of leverage.
This latest corridor sits on top of an already crowded derivatives tape. Earlier this month, Coinglass data relayed in a crypto.news story showed $1.414 billion of ETH longs at risk below $2,040 and $889 million of shorts exposed above $2,253, with nearly $1.8 billion of combined leverage packed between roughly $1,952 and $2,154. In that earlier setup, even a 5–7% move was enough to threaten a “trapdoor” cascade as price collided with stacked liquidations in both directions.
The updated $2,323–$2,563 band suggests the same basic dynamic is creeping higher as ETH grinds up the chart. Coinglass’ Ethereum dashboard shows current open interest around $32.8 billion and notes that roughly $111.6 million of ETH futures positions have been liquidated over the past 24 hours, a reminder that even smaller intraday moves continue to flush over‑levered traders.
A separate Coinglass analysis highlighted another danger zone at $2,451, estimating that a decisive break above that level would put about $1.473 billion of short positions at risk, while a drop below $2,220 could trigger $1.10 billion in long liquidations. In that note, the firm warned that dense bands of leverage “create mechanical selling or buying” once price crosses key thresholds, amplifying what might otherwise be modest spot moves.
For ETH traders, the message is clear: the next few hundred dollars in either direction sit atop hundreds of millions of dollars in forced‑flow risk. Those running high leverage into the $2,323 downside level or the $2,563 upside pocket are effectively betting they can front‑run a billion‑dollar liquidation wave rather than be crushed by it.
Additionally, recent Ethereum liquidation setups include pieces on the near‑$2,000 “trapdoor” heatmap, the $2,057–$1,863 liquidation walls flagged in February, and this week’s deep‑dive on the looming $2,451 liquidation band.


Bitcoin price prediction turns cautious as BTC failed to sustain its third breakout attempt above $76,000, repeatedly touching the level only to reverse, while 46 consecutive days of negative funding rates on Binance have created the most compressed short positioning since the FTX crash bottom of late 2022.
Summary
- BTC briefly cleared $76,000 before reversing in the most prominent bearish pin bar on the daily chart since the March rejection at $74,500, keeping the asset in the $60K-$75K consolidation range it has occupied for over ten weeks.
- Binance perpetual funding rates have remained negative for 46 straight days even as open interest rises, a combination K33 Research’s Vetle Lunde called historically consistent with “attractive entry points” for contrarian longs.
- Three catalysts will resolve the range over the next two weeks: the Iran ceasefire expiry April 22, the FOMC meeting April 28-29, and any CLARITY Act markup announcement from Senator Tim Scott.
Bitcoin (BTC) price prediction now hinges on whether the third rejection at $76,000 is the final compression before a short squeeze or evidence that a sustained break higher requires a macro catalyst that has not yet arrived. BTC slid back below $74,000 after briefly clearing the resistance level, extending a ten-week consolidation in the $60K-$75K corridor.
The rejection printed a textbook bearish pin bar on the daily chart, with price spiking above $76,000 before closing well inside the range — the same pattern that produced the prior three failed breakouts in 2026.
The most technically significant signal in the current setup is the 46-day streak of negative perpetual funding rates on Binance, even as open interest in BTC futures has been rising throughout the same period. Negative funding means that short sellers are paying long holders to maintain their positions, a reliable indicator that the market’s speculative lean is heavily skewed toward expecting a price decline.
K33 Research head of research Vetle Lunde flagged the dynamic in a recent report, noting the 30-day average funding rate has now run negative longer than at almost any point in BTC’s history outside of the FTX crash bottom in November 2022. That regime also featured rising open interest alongside negative funding, and it resolved with a sharp upside move once sellers exhausted themselves.
The pattern does not guarantee a rally. But the math is simple: the longer shorts remain crowded below $76,000 with no follow-through to the downside, the more compressed the eventual move becomes in either direction.
Three Catalysts That Could Break the Range
BTC is 42% below its October 2025 all-time high of $126,198. The $60K-$75K consolidation has now held for the third consecutive month. Breaking out in either direction requires one of three near-term events.
The Iran ceasefire expires April 22. A credible extension or diplomatic breakthrough toward a permanent deal would likely replicate the 5% BTC surge that followed the original ceasefire announcement, as the asset has been trading as a high-beta geopolitical barometer throughout the conflict. A full resumption of fighting would likely push BTC back toward the $68,000 structural support floor.
The FOMC meets April 28-29. Bitcoin performs best in easing liquidity environments, and a dovish signal from Chair Powell’s final meeting would lower the opportunity cost of holding risk assets.
A confirmed CLARITY Act markup date from Senate Banking Committee Chair Tim Scott would add a third potential catalyst, with JPMorgan estimating such a development as a standalone positive trigger for digital assets.
Below $68,000, ETF inflows would likely need to accelerate substantially to prevent a test of $65,000, the lower bound analysts have identified as the next structural support. A confirmed close above $76,000 targets $80,000 as the next resistance.
Crypto World
Bitcoin Price Prediction: Pepeto Passes $9.13 Million as Morgan Stanley ETF Hits $100M and BNB Holds Support
The bitcoin price prediction picked up momentum after Morgan Stanley’s MSBT spot Bitcoin ETF pulled in more than $100 million in its first six trading days according to CoinGecko. But many people searching for the bitcoin price prediction are looking for more than a 12% recovery on a $1.48 trillion asset.
Pepeto is the presale drawing capital right now. The exchange has raised more than $9.13 million in presale, SolidProof audited every contract before the first round opened, and the Binance listing is getting closer with projections at 100x from the current price.
Morgan Stanley ETF Hits $100M in Week One as Bitcoin Price Prediction Models Move Higher
Morgan Stanley’s MSBT spot Bitcoin ETF drew over $100 million during its first week, the fastest ETF launch in the firm’s history, with the lowest fee structure among all competing products according to CoinGecko. Total spot Bitcoin ETF assets sit at $95 billion, covering 6.4% of Bitcoin’s $1.48 trillion market cap.
The growth arrived as Bitcoin climbed above $74,400 following a ceasefire between the US and Iran, and funding rates on Binance perpetuals stayed negative for 46 straight days, a setup that K33 Research says has historically come before sharp upside moves.
The outlook gains strength from record institutional flows, but presale entries with verified exchange tools are where the returns that change portfolios are being built.
Where the Bitcoin Price Prediction Lands and Where the Real Opportunity Lives
Pepeto: The Exchange Where $9.13 Million in Committed Capital Proves Informed Money Already Moved
The real signal is not that Morgan Stanley broke records with a Bitcoin ETF. It is that more than $9.13 million flowed into Pepeto while fear gripped the market while the market sat frozen. That pattern shows who is building positions and what they expect once trading opens.
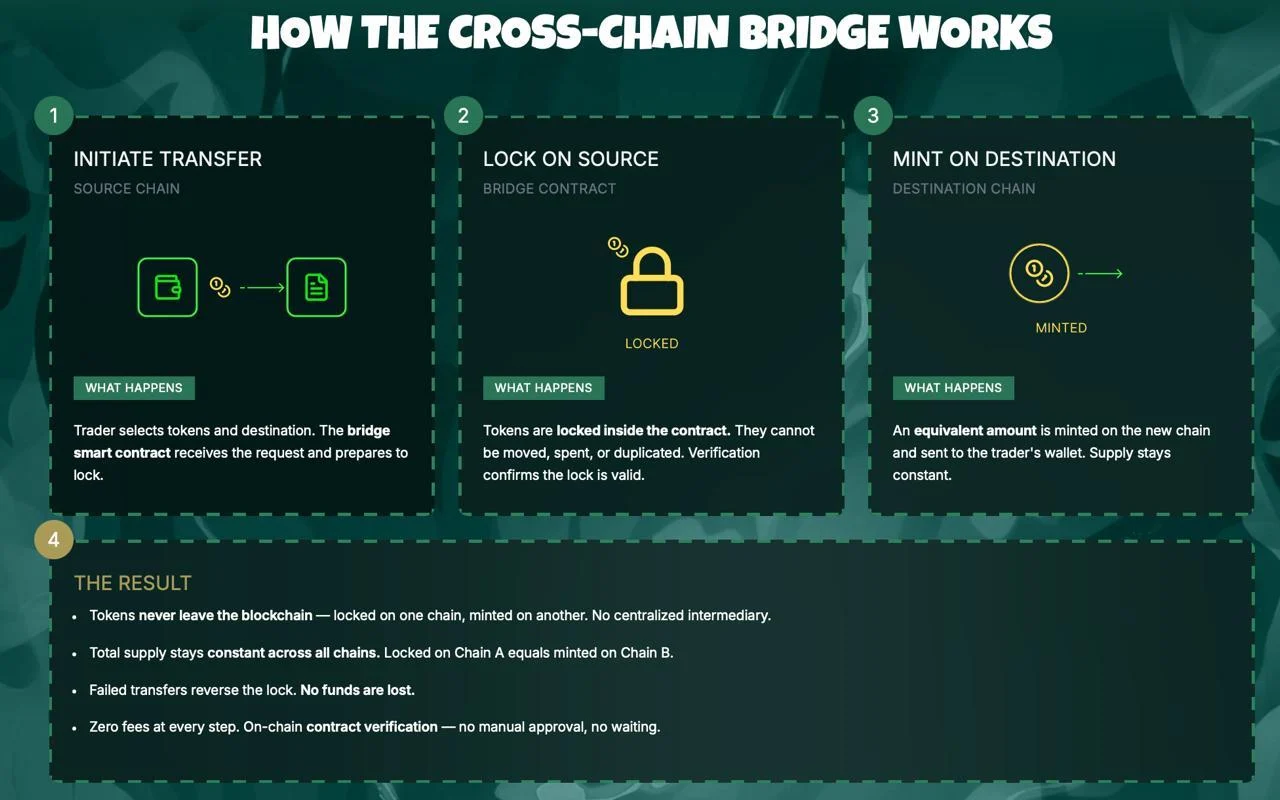
Pepeto is the exchange built to protect your full balance before you risk it anywhere. PepetoSwap processes every swap without charging a fee. When you move tokens between networks, the bridge sends the full amount with nothing deducted. And the screener scans every contract and tells you clearly if it is clean or risky, all verified by SolidProof.
The creator who took the original Pepe to an $11 billion valuation designed the full product lineup and added a former Binance listing lead for the debut.
At $0.0000001865, BTC targets $80,000 for a 7% move over months while analysts project 100x from the Pepeto listing alone. Staking at 183% APY compounds your position every day, and the wallets moving in now already ran the numbers.
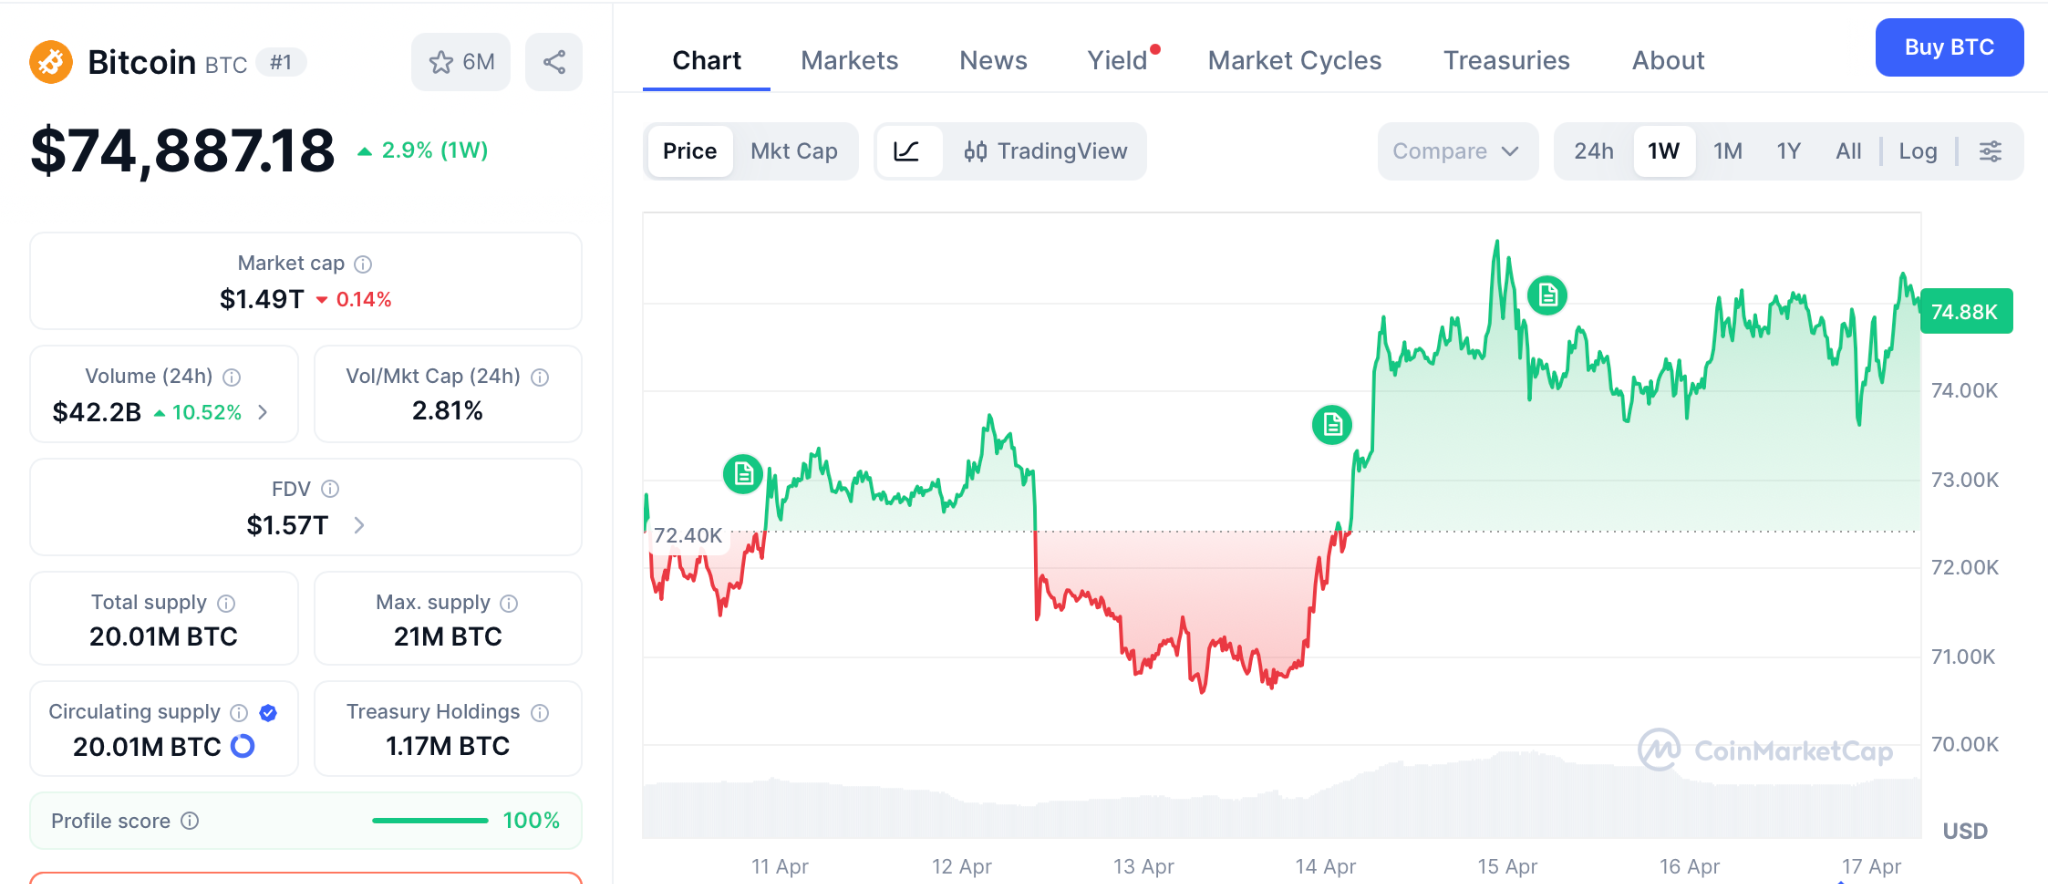
Bitcoin (BTC) Price at $74,887 as Morgan Stanley ETF Breaks Records and Funding Rates Signal a Bottom
Bitcoin (BTC) trades at $74,887 according to CoinMarketCap, up 0.89% on the day as Morgan Stanley’s MSBT drew over $100 million in its first week and total spot ETF assets held at $95 billion.
Funding rates on Binance perpetuals have stayed negative for 46 days according to CoinDesk, a setup K33 Research says has come before every major rally since 2023.
Analysts target $80,000 near term for a 7% return over months. Record institutional demand is bullish for the bitcoin price prediction. But Pepeto at presale holds the kind of multiplier that a $1.48 trillion asset cannot generate.
Binance Coin (BNB) Price at $619 as BNB Chain Zero Fee Program Holds Through April
Binance Coin (BNB) trades at $619 according to CoinMarketCap, down 0.76% as BNB Chain continued its fee-free stablecoin initiative through April 30. BNB dropped 21% from its January high near $780 but outperformed Bitcoin’s drawdown from its October all-time high.
Support holds at $583 with resistance at $650. A breakout to $700 gives 13% over months, while Pepeto at presale pricing carries the same setup BNB had when it traded at $0.15.
Conclusion
While the bitcoin price prediction points to steady recovery and BNB grinds against resistance over months, Pepeto continued attracting capital because $9.13 million raised while fear peaked is not accidental. It is informed money that already ran the numbers.
The same cofounder who built Pepe to $11 billion with nothing behind it created a full exchange this time, the SolidProof audit cleared every contract, and the Binance listing unlocks the return. Days after launch, presale buyers will face just one choice: sell on the 50x or hold for more. Everyone who missed it will carry the same feeling as those who passed on DOGE and Shiba Inu early.
Click To Visit Pepeto Website To Enter The Presale

FAQs
What is the bitcoin price prediction after Morgan Stanley’s ETF broke records in week one?
Bitcoin targets $80,000 near term after Morgan Stanley’s MSBT pulled in $100 million in six days and total spot ETF assets held at $95 billion. Pepeto at presale carries the 100x projected from the Binance listing.
How does Binance Coin compare to Pepeto for returns at BNB’s current price?
Binance Coin (BNB) trades at $619 with a $700 target for 13% over months from an $83 billion cap. Pepeto through the Pepeto official website offers presale entry and 100x listing returns that BNB at this size cannot match.
Disclaimer: This is a Press Release provided by a third party who is responsible for the content. Please conduct your own research before taking any action based on the content.


Bitcoin technical analysis turned decisively bullish Thursday as BTC cleared $77,000 and climbed above its 100-day moving average for the first time since the early February selloff, triggering a 12%+ surge in Strategy shares as the company’s 780,897-BTC treasury gained roughly $1.6 billion in value in a single session.
Summary
- BTC absorbed $450 million in sell orders stacked between $75,900 and $76,300, breaking through resistance that has rejected price three times over the prior two months.
- Strategy jumped over 12% on the BTC move, extending a run since the company’s April 13 disclosure that it purchased 13,927 BTC for $1 billion at $71,902 per coin using proceeds from its STRC preferred stock ATM program.
- Derivatives data show a 140% jump in liquidations alongside rising open interest, signaling forced short covering rather than primarily new long buying, consistent with the squeeze thesis K33 Research had flagged.
Bitcoin (BTC) technical analysis produced a breakout signal Thursday as BTC cleared $77,000 and reclaimed its 100-day moving average, a threshold that has acted as resistance since the early February decline from above $90,000. The move marks BTC’s first decisive close above $77,000 since that selloff and represents the resolution, at least temporarily, of the ten-week $60K-$75K consolidation range that had defined the chart.
Strategy, the largest publicly traded corporate Bitcoin holder, surged over 12% in Thursday trading. The company holds 780,897 BTC acquired for approximately $59.02 billion at an average cost of $75,577 per coin.
The $76,000 level had capped four separate BTC rally attempts in 2026 before today. CoinGlass data showed $450 million in sell orders stacked between $75,900 and $76,300 as of Thursday morning, placed by traders either shorting the range high or defending against a short squeeze with liquidation risk overhead. Price chipped through the wall across the morning session, triggering a cascade as liquidation levels were breached.
Derivatives data confirmed the mechanical nature of the move: liquidations jumped 140% compared to recent sessions, and open interest continued to rise throughout the advance. Rising open interest alongside rising liquidations indicates forced short covering rather than new speculative buying, the exact setup K33 Research’s Vetle Lunde described last week when he flagged 46 consecutive days of negative funding as an “attractive entry” for contrarians.
Why Strategy Moved So Sharply
Strategy’s 12%+ gain amplified BTC’s move through its leveraged capital structure. The company holds 780,897 BTC worth roughly $1.6 billion more at $77,000 than at $74,000, with every dollar of BTC appreciation flowing directly through to the balance sheet under FASB’s fair-value accounting rules now governing digital assets.
On April 13, Strategy disclosed its latest purchase: 13,927 BTC for approximately $1 billion, funded entirely through sales of its STRC preferred shares. The company’s STRC volume has surged to roughly 20% of total MSTR trading volume from essentially zero earlier in 2026, reflecting a shift in how institutional capital is accessing the company’s Bitcoin exposure.
The company’s average cost basis of $75,577 per BTC means Thursday’s move above $77,000 pushed its entire treasury back into a small unrealized gain for the first time since early April, a shift that reduces near-term balance sheet pressure and may support continued STRC issuance.
Bitcoin reclaiming the 100-day moving average is a structural signal that technical traders track carefully. A sustained daily close above it would target $80,000 as the next resistance, with the 200-day SMA at $87,519 as the larger trend line that needs to be reclaimed for a full trend reversal. The BTC ETF inflow picture from the past week, which showed $597.5 million in two-day institutional buying, suggests demand is present to absorb further supply if the macro backdrop cooperates.
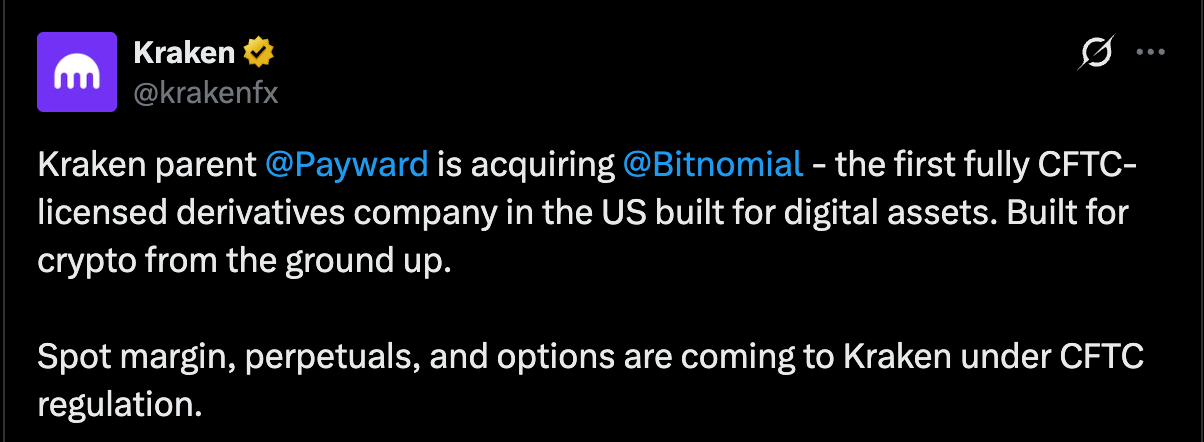
Payward, the parent company of the Kraken cryptocurrency exchange, announced on Friday that it has entered into a “definitive agreement” to acquire Bitnomial, a US-licensed cryptocurrency and derivatives exchange; the deal values Bitnomial’s equity at $20 billion.
Bitnomial is the “first” crypto-native exchange in the United States to hold all three regulatory licenses from the Commodity Futures Trading Commission (CFTC), including exchange, clearinghouse, and brokerage permits, according to Payward’s announcement.
“Settlement mechanics, margin models, and contract structures define what products can exist and who can access them. The US has had no clearing infrastructure built for digital assets,” Arjun Sethi, Co-CEO of Payward and Kraken, said. He added:
“Bitnomial spent a decade building it: crypto settlement, crypto collateral, continuous 24/7 markets. These are capabilities that cannot be retrofitted onto legacy systems. They have to be built natively.”
Payward will use Bitnomial’s infrastructure to offer spot margin trading, perpetual futures contracts and options trading for US clients, the company said.

Payward’s business clients can also integrate crypto services for their users, including spot crypto trading, tokenized stocks, crypto derivatives and fiat onramps through Payward Services, an application programming interface (API).
The announcement follows Kraken’s expansion into tokenized stocks, tokenized perpetual futures trading and the company securing a limited-purpose account with the United States Federal Reserve, a first for the crypto industry.
Related: Deutsche Börse invests $200 million in Kraken parent Payward
Kraken secures Federal Reserve limited-purpose master account
In March 2026, Kraken became the first crypto company to gain approval for a limited-purpose master account, which was issued by the Federal Reserve Bank of Kansas City, one of the US central bank’s 12 regional districts.
The account gives Kraken access to the Federal Reserve’s central payment system used by banks, credit unions and other traditional financial institutions, so it can settle transactions directly through the Fed’s Fedwire platform.
However, the limited-purpose master account has a term of one year and features some restrictions.

Kraken’s limited-purpose account is similar to the ‘skinny’ Federal Reserve master accounts proposed by Federal Reserve Governor Christopher Waller and promoted by Wyoming Senator Cynthia Lummis in 2025.
Magazine: Robinhood’s tokenized stocks have stirred up a legal hornet’s nest

TLDR:
- Bitcoin trades below key moving averages, indicating weak momentum and reduced support for altcoin growth.
- Rising Bitcoin dominance shows capital concentration, limiting liquidity flow into altcoins during this phase.
- Historical patterns suggest altcoins perform best when Bitcoin trends steadily above major moving averages.
- Current market structure reflects a defensive phase, with traders favoring Bitcoin over higher-risk altcoins.
Bitcoin’s recent price action has drawn attention as traders reassess altcoin exposure during a shifting market cycle.
A widely shared market chart now signals caution, suggesting current conditions may not favor altcoin accumulation amid weakening momentum and declining trend strength.
Market Structure Signals Shift in Momentum
A recent post by Our Crypto Talk outlines a structured approach to identifying favorable altcoin conditions. The framework relies on two moving average signals that define market phases.
These include price positioning above the 20-day moving average and the 20-day remaining above the 50-day moving average.
According to the shared chart, these conditions are not currently met. Bitcoin is trading below both moving averages, while the short-term average is trending downward toward the long-term line.
This configuration reflects weakening short-term momentum within the broader market structure.
The chart also maps historical cycles, showing how similar setups aligned with previous market phases. During 2021, price action remained above key averages, coinciding with strong altcoin rallies.
However, the current setup resembles earlier correction periods where capital shifted away from altcoins. At the same time, Bitcoin dominance stands near 57%, indicating capital concentration in the leading asset.
This level often coincides with reduced appetite for higher-risk altcoin exposure. As a result, traders appear to favor defensive positioning during this phase.
Historical Cycles Guide Altcoin Timing
The chart divides market behavior into green and red zones, each representing distinct trading environments. Green zones indicate favorable altcoin conditions, typically forming during controlled Bitcoin uptrends. Red zones, however, align with corrections or late-cycle phases where altcoins tend to underperform.
Historical data within the chart shows that green zones appeared during the 2020–2021 expansion and the 2023–2025 recovery period.
These phases saw Bitcoin rise steadily while liquidity expanded into altcoins. In contrast, red zones marked the 2022 bear market and the current correction phase.
Price levels further support this interpretation. Bitcoin recently pulled back from highs above $120,000 to a range near $70,000–$80,000.
This movement places the asset near a key support zone between $74,000 and $77,000. Meanwhile, resistance remains near $96,000 and extends toward previous cycle highs.
The post also stresses that timing altcoin entries requires patience rather than precision. Waiting for confirmed trend alignment may reduce exposure to prolonged drawdowns. Attempting to identify exact bottoms, on the other hand, often carries a higher risk during unstable phases.
Looking ahead, market participants are watching whether Bitcoin stabilizes within its current range. A sustained recovery above key moving averages could signal the return of favorable conditions.
Until then, the chart suggests a continued defensive phase where capital preservation remains a priority.


Two Tether-related entities, German former crypto miner Northern Data and US-based video streaming service Rumble, are set to begin the merger process, with Rumble offering equity for shares of Northern Data.
The merger, which was announced in November of last year, will end with Rumble taking over data center sites and receiving thousands of GPU servers. Tether owns a majority of Northern Data and 30% of Rumble.
Shareholders in Northern Data will receive 2.0281 shares of Rumble stock for each share they hold. Northern Data is currently trading at $13 a share and Rumble is trading at $6.41 a share.
A strange merger that’s good for Tether
From an outside perspective, a defunct mining company and a video streaming service merging doesn’t make a lot of sense. However, in November Christ Pavlovski, the CEO of Rumble, said, “Northern Data. Tether. Rumble. This is how we build the AI ecosystem for the future, from the ground up.”
It’s unclear what Tether or Rumble have to do with AI.
What’s more clear is that the merger will ultimately benefit Tether, which has already committed to purchasing $150 million in compute from Rumble over the next two years and will have a $610 million unsecured debt financing facility provided to Northern Data now reassessed and altered.
Financial Shenanigans
The merger of the two Tether-related companies required little agreement from minority shareholders due to Tether’s strong influence, Rumble’s executive equity structure, and Northern Data’s financial struggles over the past several years.
Both Northern Data and Rumble have seen the price of their stocks slide post-Tether investment, with Rumble trading near all-time lows as of recent.
Since the merger has begun the stock has rallied 20%.
The financial shenanigans involved in the Tether-related deal is nothing new for the company, which has been dogged by a long list of controversies around audits, hacks, and scams.
Read more: Tether-owned Northern Data considers ditching bitcoin mining
Since the collapse of FTX and the election of Donald Trump, Tether has attempted to present itself as transparent and safe, and has made a massive push into the US market. This includes lobbying efforts that saw CEO Paulo Ardoino visit the White House multiple times.
US Secretary of Commerce, Howard Lutnick, used to run Cantor Fitzgerald, which purchased US treasury notes for the company and previously said he was “a big fan of the company.”
Got a tip? Send us an email securely via Protos Leaks. For more informed news and investigations, follow us on X, Bluesky, and Google News, or subscribe to our YouTube channel.
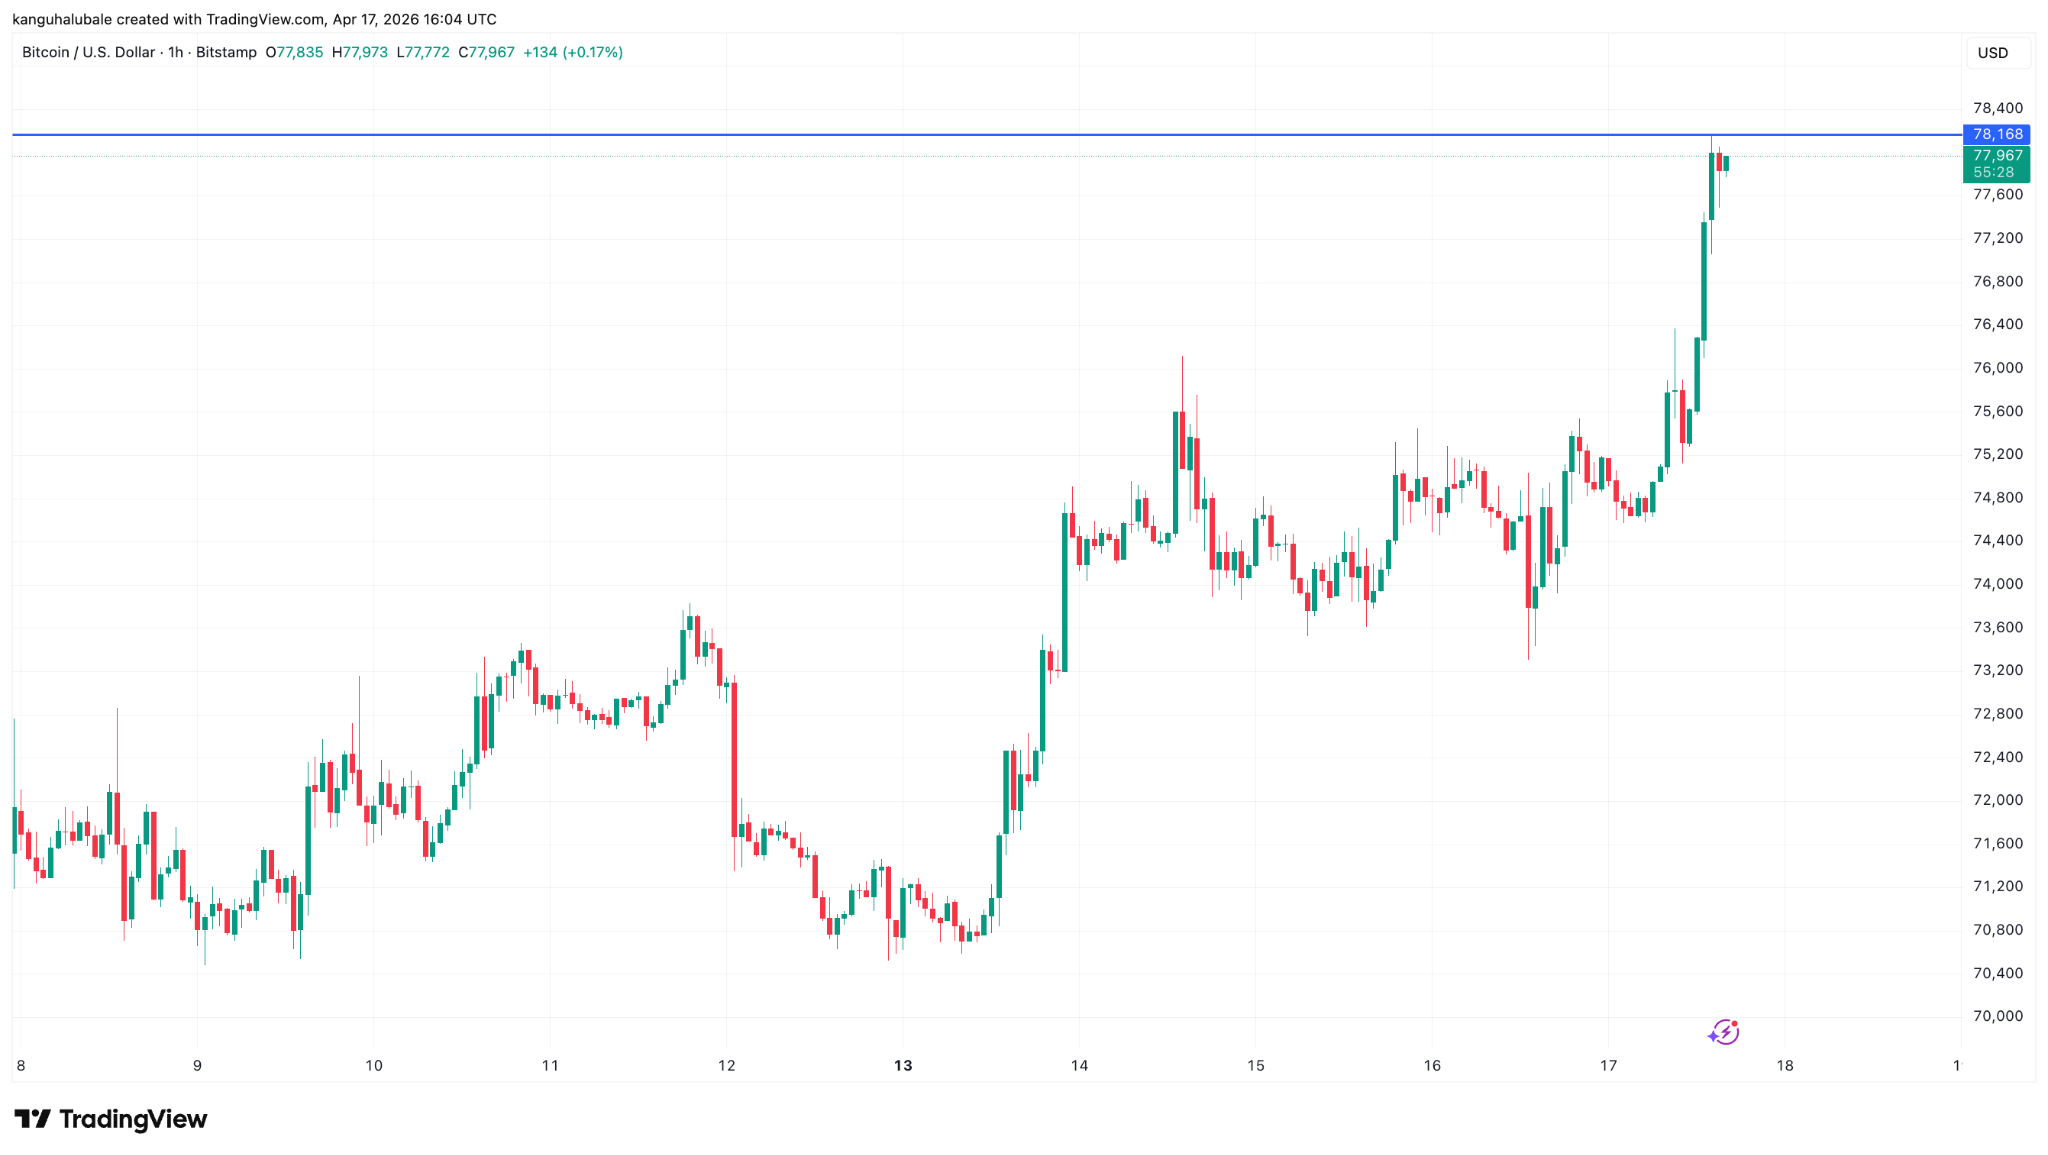
Bitcoin (BTC) rallied above $78,000 to hit another 10-week high on Friday as crypto and equity markets reacted to cooling tensions in the US and Israel war in Iran. The rally above range highs also resulted in a large liquidation of leveraged Bitcoin positions.

More than $660 million in short positions were liquidated, with Bitcoin accounting for $353 million of that total. Ether (ETH) followed with $160 million in short liquidations.
Related: Three things Bitcoin must do to hold highs above $76K: Analysts
Across the board, $826 million was wiped from the futures market over the last 24 hours.

The single biggest liquidation occurred on Hyperliquid, where a $15.75 million BTC-USDT short position was closed.
Large clusters of short liquidations typically amplify the reach of asset rallies and data from CoinGlass showed a 13% rise in Bitcoin’s aggregate futures open interest (OI) over the last 24 hours.

Even though futures longs (buyers) and shorts (sellers) are always matched, rising OI suggests greater leverage and market participation, which, in this case, appears to be on the side of bulls.
Hyblock data showed ask liquidity sitting between $77,500 and $78,000 being absorbed as BTC rallied to its intra-day highs on Friday.

Bitcoin MACD forecasts a “big move“
Bitcoin’s moving average convergence divergence (MACD) indicator has signaled a buy on its weekly chart, a pattern that has historically preceded sharp price rallies.
The MACD is a popular momentum indicator used in technical analysis that helps traders identify the strength, direction and duration of a trend of an asset’s price.
The indicator reached its lowest level in history and has formed a bullish cross on the weekly chart, as shown in the figure below.
“Not only do we have a 1W MACD bullish cross and break of trend, we have it from the lowest point the MACD has ever dropped to,” analyst Sykodelic said in a recent post on X, adding:
“We are at a very important level here, and the weekly close will be very important.“
Previous instances show that Bitcoin tends to rise sharply when the MACD line (blue) crosses above the signal line (orange). The last time this happened was at the bottom of the 2022 bear market, which preceded a 376% increase in BTC price.

“A big move usually follows whenever this weekly MACD bullish cross happens,” analyst Mikybull Crypto said in a recent post on X.
Fellow analyst The Chart Report told their followers that previous crossovers have “historically produced a 93% win rate with a median 12-month return of +195%.”

Other Bitcoin analysts suggest that the altcoin could continue its recovery to retest higher resistance levels, with BTC price targets set at $90,000 and above.
This article is produced in accordance with Cointelegraph’s Editorial Policy and is intended for informational purposes only. It does not constitute investment advice or recommendations. All investments and trades carry risk; readers are encouraged to conduct independent research before making any decisions. Cointelegraph makes no guarantees regarding the accuracy or completeness of the information presented, including forward-looking statements, and will not be liable for any loss or damage arising from reliance on this content.

Pi Mainnet is moving toward Protocol 22, with April 27 set as the deadline tied to node readiness. The update puts fresh attention on Pi Node, which supports network security and transaction flow on desktop devices.
The move also renews focus on Pi’s long-running node plan. Pi’s own notice says parts of its early node document may not be up to date, yet the role of nodes remains clear.
Pi Node Remains Central to the Network Design
Pi Node is the fourth role in the Pi ecosystem.
It runs on laptops and desktops, while mobile users keep using the Pi app.
The system does not use proof of work like Bitcoin. Instead, Pi says it uses a model based on the Stellar Consensus Protocol.
Under that design, nodes form trusted groups called quorum slices. They agree on transactions only when trusted nodes reach agreement.
Pi says this trust model connects with security circles from mobile miners. Those circles help form a wider trust graph for validation.
Protocol 22 Deadline Brings Node Readiness Into Focus
With the April 27 deadline now in focus, node reliability becomes a key part of the discussion. Pi has said nodes help validate transactions and submit them to the blockchain.
SuperNodes carry a larger role in the network. They reach consensus, write transactions to the ledger, and keep other nodes updated.
Pi also says selected node operators must meet technical and account checks. These include uptime, internet stability, hardware capacity, and KYC after invitation.
The project has also said one account should run only one node. That rule links node participation to the same account used on the mobile app.
Pi Keeps a Phased Path for Node Development
Pi’s node plan has followed a staged testnet path. It began with a selection stage, then moved into revision work, and then live testnet activity.
In the selection stage, Pi assessed devices, connection quality, and software setup. The aim was to learn what was needed for a stable and secure network.
During the revision stage, Pi used a centralized layer for faster testing. The company said this helped it simulate many network conditions and stress the consensus model.
Pi has also said that this layer would be removed for mainnet after testing. That point matters as the network now moves around the Protocol 22 deadline.
Pi’s notice also says mainnet nodes are under a firewall during the Enclosed Network period. It adds that broader community access is planned for the Open Network period.

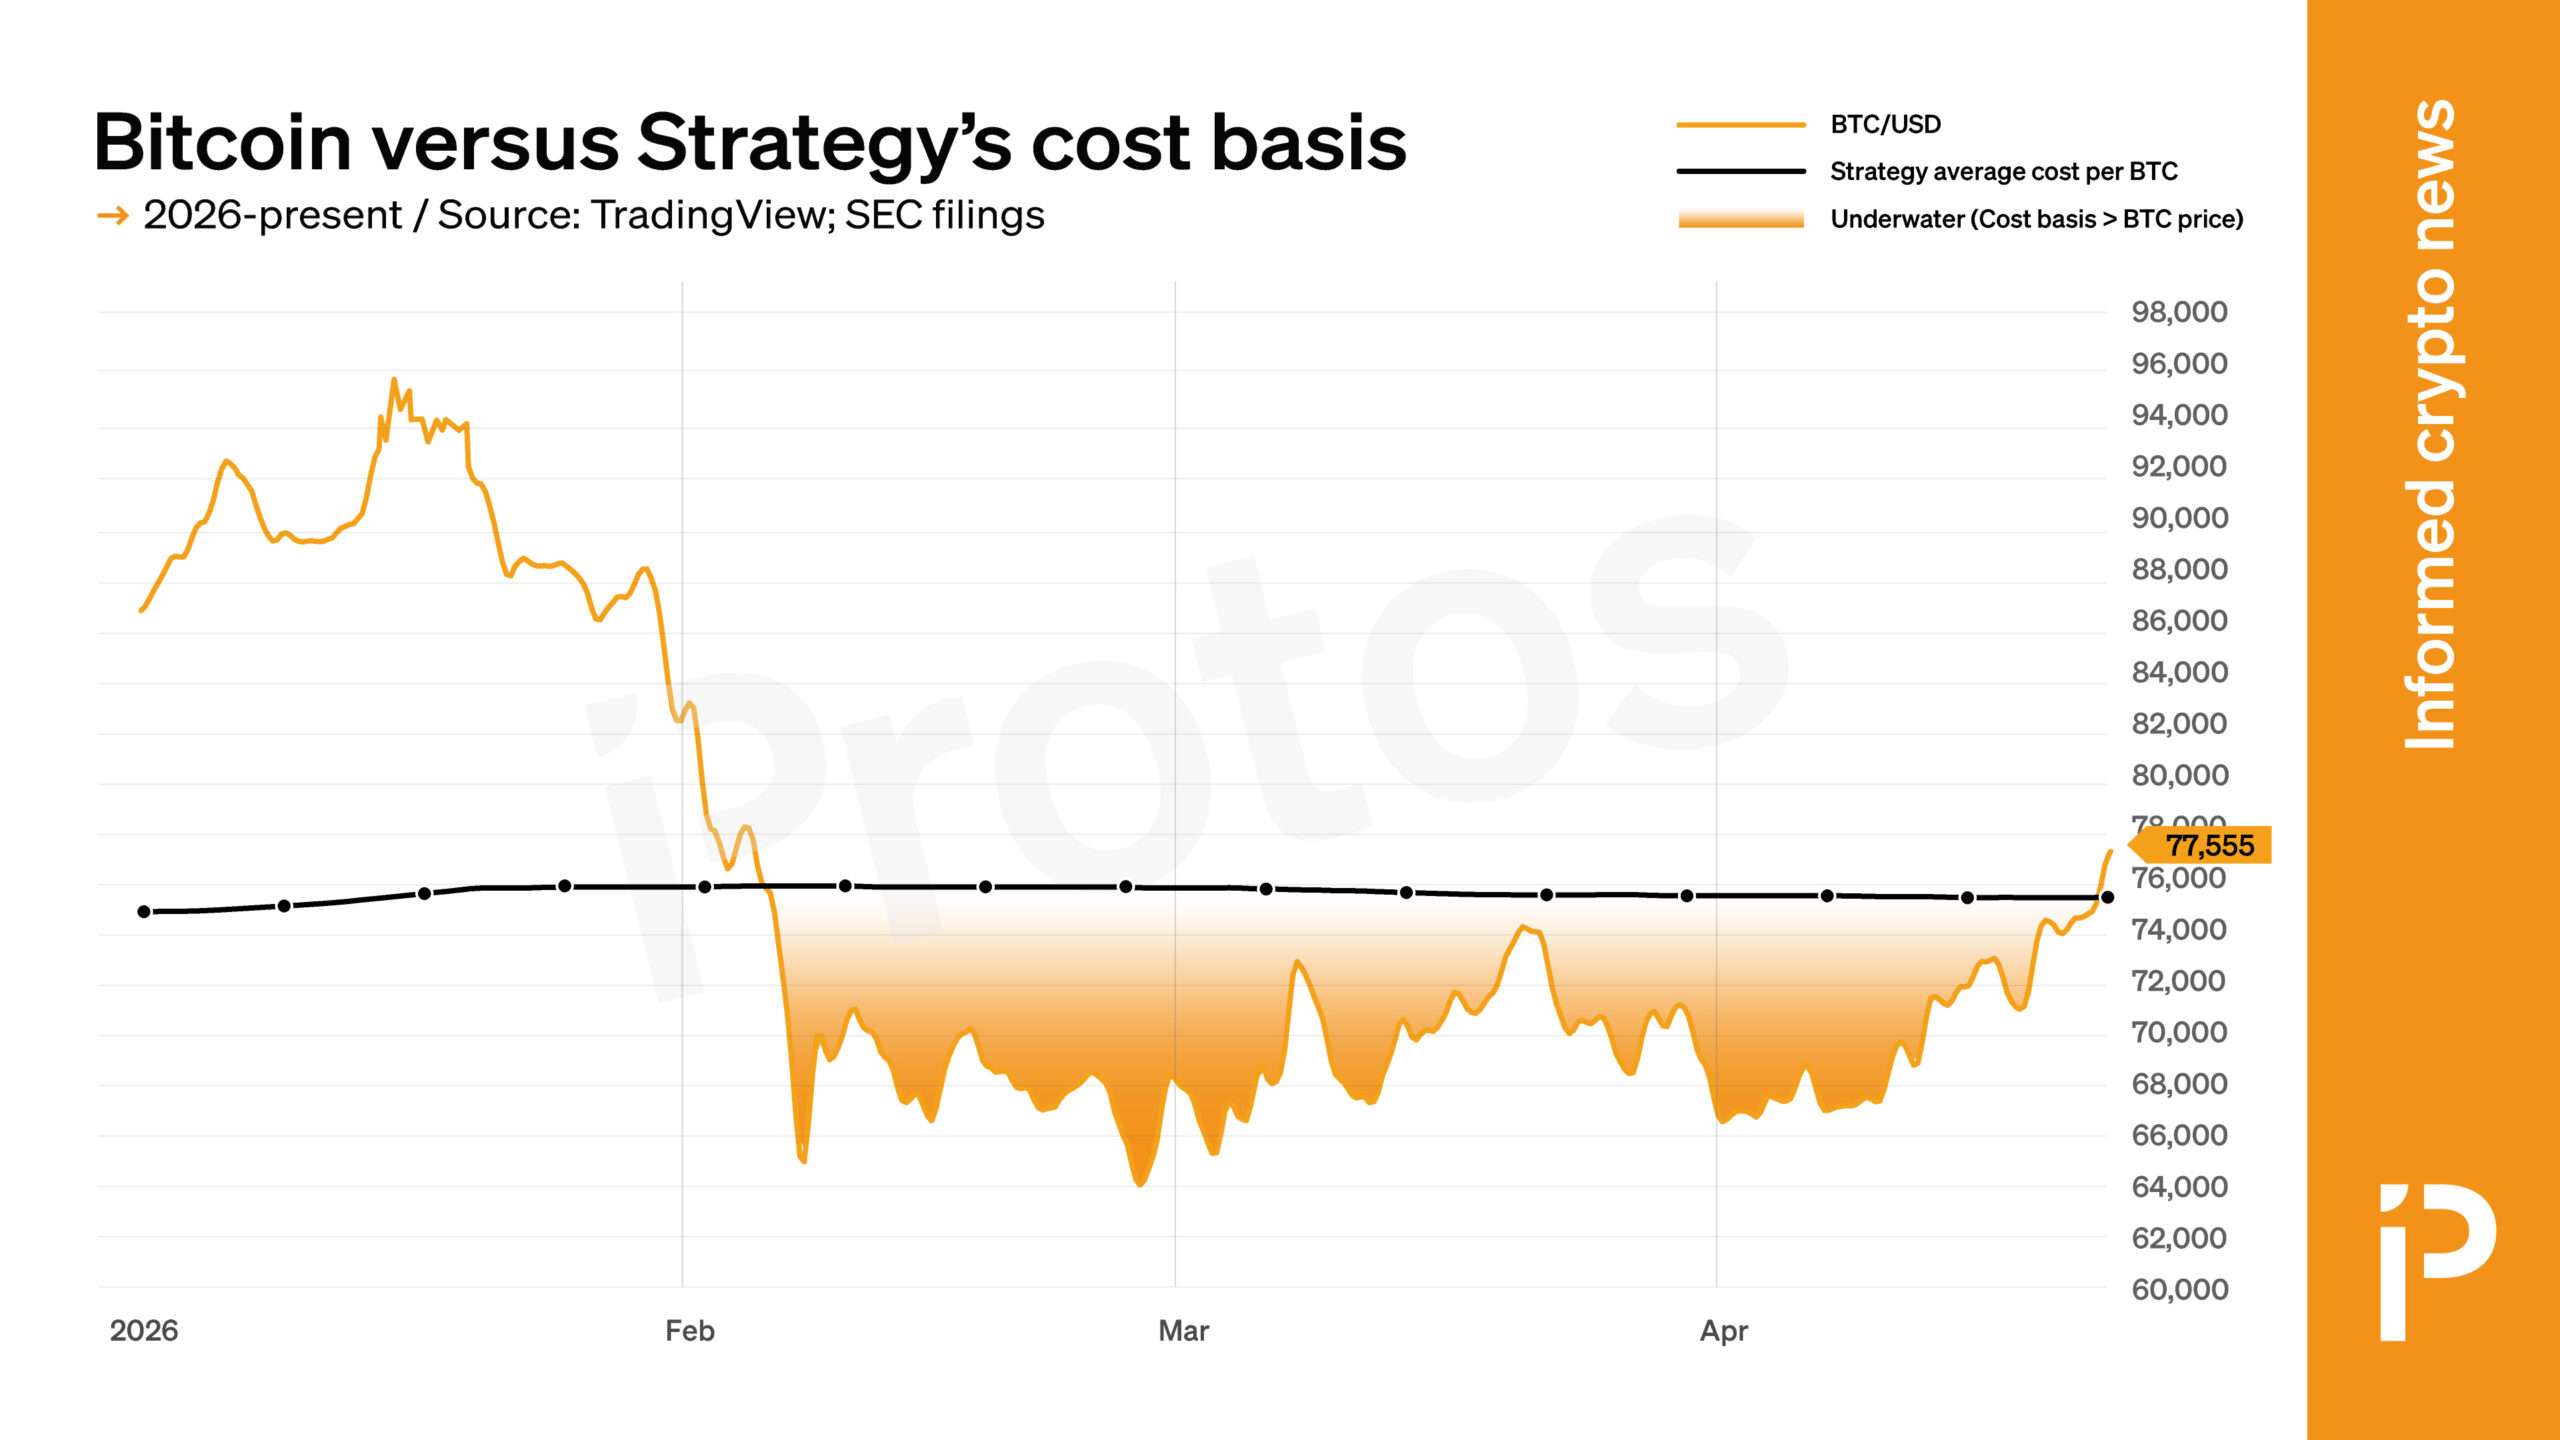
Michael Saylor’s bitcoin (BTC) treasury at Strategy is back in the green this morning — but only barely, and only because BTC gave him a lucky break after the US and Iran announced the reopening of the Strait of Hormuz.
Strategy (formerly MicroStrategy) now holds 780,897 BTC at a blended average cost basis of $75,577 per coin, according to its own disclosure page.
The company’s total expenditures to amass that hoard cost cost $59 billion. BTC traded above $77,870 this morning, making the stack worth roughly $60.8 billion. The unrealized gain works out to $1.8 billion, or a 3% gain.
After nearly six years of leveraged buying, debt issuances, perpetual preferred sales, and common stock dilution, the company has staged a multi-billion dollar comeback this morning.
Strategy’s $11B unrealized loss to green again
Protos previously reported that Strategy owned 640,031 BTC on October 6, 2025 at an average cost of $73,983. BTC traded near $125,000 per coin that day.
The company’s paper profit at that time was an impressive $32 billion.
Saylor, who pledges never to liquidate BTC, proceeded to hold every coin through a gut-wrenching downturn.
Four months later, on February 6, BTC dropped to an intraday low of $59,930. Strategy by then held 713,502 BTC acquired for $54.26 billion at an average of $76,052 per coin. Worse, Saylor had kept buying through the decline, at prices far above the low.
At the February 6 low, the position was worth just $42.7 billion.
The unrealized loss had reached negative $11.50 billion, or a negative 21.2% unrealized loss.
Besides seeing more red on his screen, nothing much else about the corporation changed over that time period.
The company’s board of directors kept declaring preferred share dividends on-time. Common stockholders kept suffering dilution, as usual.
Saylor kept posting orange dots, a visual representation of the company’s BTC purchases.
The primary thing that changed was the whipsawing price of the one asset that he had repeatedly promised never to sell.
Read more: Buying the dip? Strategy prefers the top of the range
Saved by a Strait of Hormuz rally
Fortunately, BTC has since rallied roughly 30% off that February low. Strategy’s holdings, now up to 780,897 BTC, sit in positive territory as of a few hours ago.
The chart tells the story of Strategy’s intraday success. The asset, not the company’s management, rescued their leveraged position.
Saylor’s buying through the drawdown arguably made the recovery thinner. Q1 2026 buys carried a volume-weighted cost near $80,929 per coin, and his weekly purchases overwhelmingly landed in the upper half of each week’s available trading range.
Those overpriced buys are what pushed the company’s blended cost basis up. The same company that once sat on a $32.6 billion gain in October now has a $1.8 billion gain, and was more than $11 billion underwater in the interim.
Got a tip? Send us an email securely via Protos Leaks. For more informed news, follow us on X, Bluesky, and Google News, or subscribe to our YouTube channel.

Hormuz Opens: Oil Crashes, Stocks Rip Higher

ETH liquidation map flags $1.04B long wipeout zone at $2,323

Strictly Come Dancing: Every Star Rumoured To Host BBC show


-

 Business7 days ago
Tesla Model Y Tops China Auto Sales in March 2026 With 39,827 Registrations, Beating Cheaper EVs and Gas Cars
-

 Politics5 days ago
World Cup exit makes Italy enter crisis mode
-
 NewsBeat5 days ago
Pep Guardiola and Gary Neville agree over Arsenal title problem that benefits Man City
-

 Crypto World4 days ago
The SEC Conditionalises DeFi Platforms to Be Avoided for Broker Registration
-

 Crypto World4 days ago
SEC Signals Exemption for Crypto Interfaces From Broker Registration
-

 News Videos2 days ago
Secure crypto trading starts with an FIU-registered
-

 Sports11 hours ago
NWFL Suspends Two Players Over Post-Match Clash in Ado-Ekiti
-

 Crypto World4 days ago
SEC Proposes Certain Crypto Interfaces Don’t Need to Register as Brokers
-

 Business6 days ago
Ireland Fuel Protests Enter Day 5 as Blockades Spark Shortages and Government Prepares Support Package
-

 NewsBeat3 days ago
Trump and Pope Leo: Behind their disagreement over Iran war
-

 Crypto World7 days ago
Federal judge blocks Arizona from bringing criminal charges against Kalshi
-
 NewsBeat6 days ago
JD Vance announces ‘no agreement’ with Iran over nuclear weapons fear
-

 Business7 days ago
IMF retains floor for precautionary balances at SDR 20 billion
-
Sports6 days ago
Dexter Lawrence, Stefon Diggs, Trading for De’Von Achane
-

 Business7 days ago
Former Liverpool CEO eviscerates FIFA for World Cup ticket pricing
-
Crypto World5 days ago
Sei Network Enters Quiet Reset Phase as On-Chain Metrics Signal a Slowdown in 2026
-

 Crypto World5 days ago
Trump whales load up ahead of Mar-a-Lago luncheon.
-
Business7 days ago
Coreweave CSO Venturo sells $5.5m in class a common stock
-
Sports7 days ago
1st-Round WR Enters Vikings Mock Draft Orbit
-
Business5 days ago
Kering slides after Morgan Stanley downgrade, Gucci woes loom
You must be logged in to post a comment Login