
Crypto World
Microsoft (MSFT) Stock Gains After Xbox Game Pass Ultimate Sees Major Price Reduction

Key Takeaways
- Xbox Game Pass Ultimate pricing reduced by 23%, now $22.99/month from $29.99
- PC Game Pass sees a 15% decrease to $13.99/month from $16.49
- Day-one access to new Call of Duty releases eliminated from Game Pass subscriptions
- Xbox gaming revenue declined approximately 10% year-over-year with hardware plummeting 32%
- Recent Xbox leadership change under Asha Sharma drives pricing restructure
The Xbox division at Microsoft has faced mounting challenges. Gaming accounted for a mere 7% of overall company revenue in the most recent quarter, marking it as the sole major business segment experiencing decline.
The financial picture painted a stark reality: console hardware sales plunged 32% following Microsoft’s decision to shelve two game projects, “Everwild” and “Perfect Dark.” CFO Amy Hood acknowledged during an analyst briefing that Xbox content and services revenue fell short of internal projections.
Game Pass Ultimate’s $29.99 monthly subscription had been in place since October, when Microsoft implemented a $10 increase. That pricing decision, as it happens, proved unpopular with consumers.
According to reports, Asha Sharma—Xbox’s newly appointed leader—communicated to staff via internal memo that the subscription had grown prohibitively expensive. Sharma, who joined from Meta, assumed control of Xbox in February following a leadership restructuring that saw Phil Spencer transition out and Sarah Bond depart.
Her solution: reduce pricing while maintaining the game catalog. Game Pass Ultimate falls to $22.99 monthly—representing a 23% discount. PC Game Pass decreases 15% to $13.99. Both adjustments took effect immediately.
The Call of Duty Compromise
There’s a significant caveat. Newly released Call of Duty titles will no longer debut on Game Pass at launch. Microsoft had leveraged the blockbuster franchise as a primary incentive for subscription growth, particularly following its massive $75.4 billion Activision Blizzard purchase in 2023.
Moving ahead, subscribers wanting immediate access to fresh Call of Duty releases must purchase them separately at $69.99. These games will join Game Pass approximately twelve months post-launch.
This represents a meaningful compromise—reduced subscription fees, but diminished launch-day content availability.
Microsoft indicated the adjustments stem from subscriber feedback. “Our players cover a wide breadth of geographies, preferences, and tastes,” the company stated in an official blog post.
Game Pass subscriber count stood at 34 million throughout 2024. Microsoft has not released updated membership figures.
Competitive Landscape Pressures
Xbox remains behind Sony and Nintendo in both hardware sales and subscription service adoption. This competitive disadvantage has forced Microsoft to reconsider Game Pass’s value proposition and pricing strategy.
The termination of hardware initiatives and two game development projects signals a wider strategic reevaluation of the gaming division’s direction. Some industry observers have speculated about potential divestiture or scaling back of the Xbox business, though Microsoft has issued no official statements regarding such possibilities.
Amy Hood referenced an undisclosed impairment charge within the gaming segment during the recent earnings presentation. No specific amount was disclosed.
MSFT stock advanced approximately 0.79% in after-hours trading following the pricing announcement.
Analyst sentiment toward Microsoft remains predominantly bullish, with 34 Buy recommendations and 3 Hold ratings issued over the past three months. The consensus price target stands at $581.61.


Key takeaways
- Pepe extends gains on Wednesday, stretching its rally from the 50-day EMA.
- Derivatives data show heightened retail activity as risk-on sentiment returns to the market.
Pepe (PEPE) is experiencing a steady rally on Wednesday, trading in the green for the third consecutive day. The frog-themed meme coin is gaining traction as broader market sentiment improves, lifting retail demand for meme coins.
Market sentiment boosts meme coin demand
The broader market’s upside, despite ongoing geopolitical tensions surrounding the US-Iran blockade of the Strait of Hormuz and faltering peace talks, is boosting retail interest in meme coins.
According to CoinMarketCap, the Fear and Greed Index is at 62 on Wednesday, showing a consistent rise in risk appetite since the US-Iran ceasefire announcement.
On the derivatives side, the PEPE futures Open Interest (OI) stands at $213.25 million, with a 7% increase in the last 24 hours.
This surge in futures positions indicates growing participation from traders, aligning with the recovery in the spot price—further supporting a bullish outlook for PEPE.
Pepe tests breakout of key resistance level
The PEPE/USD 4-hour chart is bullish and efficient as Pepe’s short-term recovery remains intact, with a three-day rebound from the 50-day Exponential Moving Average (EMA) at $0.00000368.
However, PEPE is still trading below the 100-day and 200-day EMAs, which could cap the ongoing rally.
The Relative Strength Index (RSI) at 60 is edging higher from the midline, indicating mild positive momentum. Meanwhile, the Moving Average Convergence Divergence (MACD) remains above its signal line, keeping the histogram bars positive.
At press time, PEPE is trading at $0.00000393. If the rally should continue, PEPE must break above its descending trendline near $0.00000400, close to the 100-day EMA at $0.00000404.

A breakout above this level could pave the way for a rally toward the 200-day EMA around the $0.00000500 psychological resistance.
On the downside, the 50-day EMA at $0.00000368 provides immediate dynamic support, with further downside protection at the February 6 low of $0.00000311.
Bitcoin (BTC) could see further upside volatility as several technical indicators suggested the BTC price was due for a “powerful“ upward move.
Key takeaways:
-
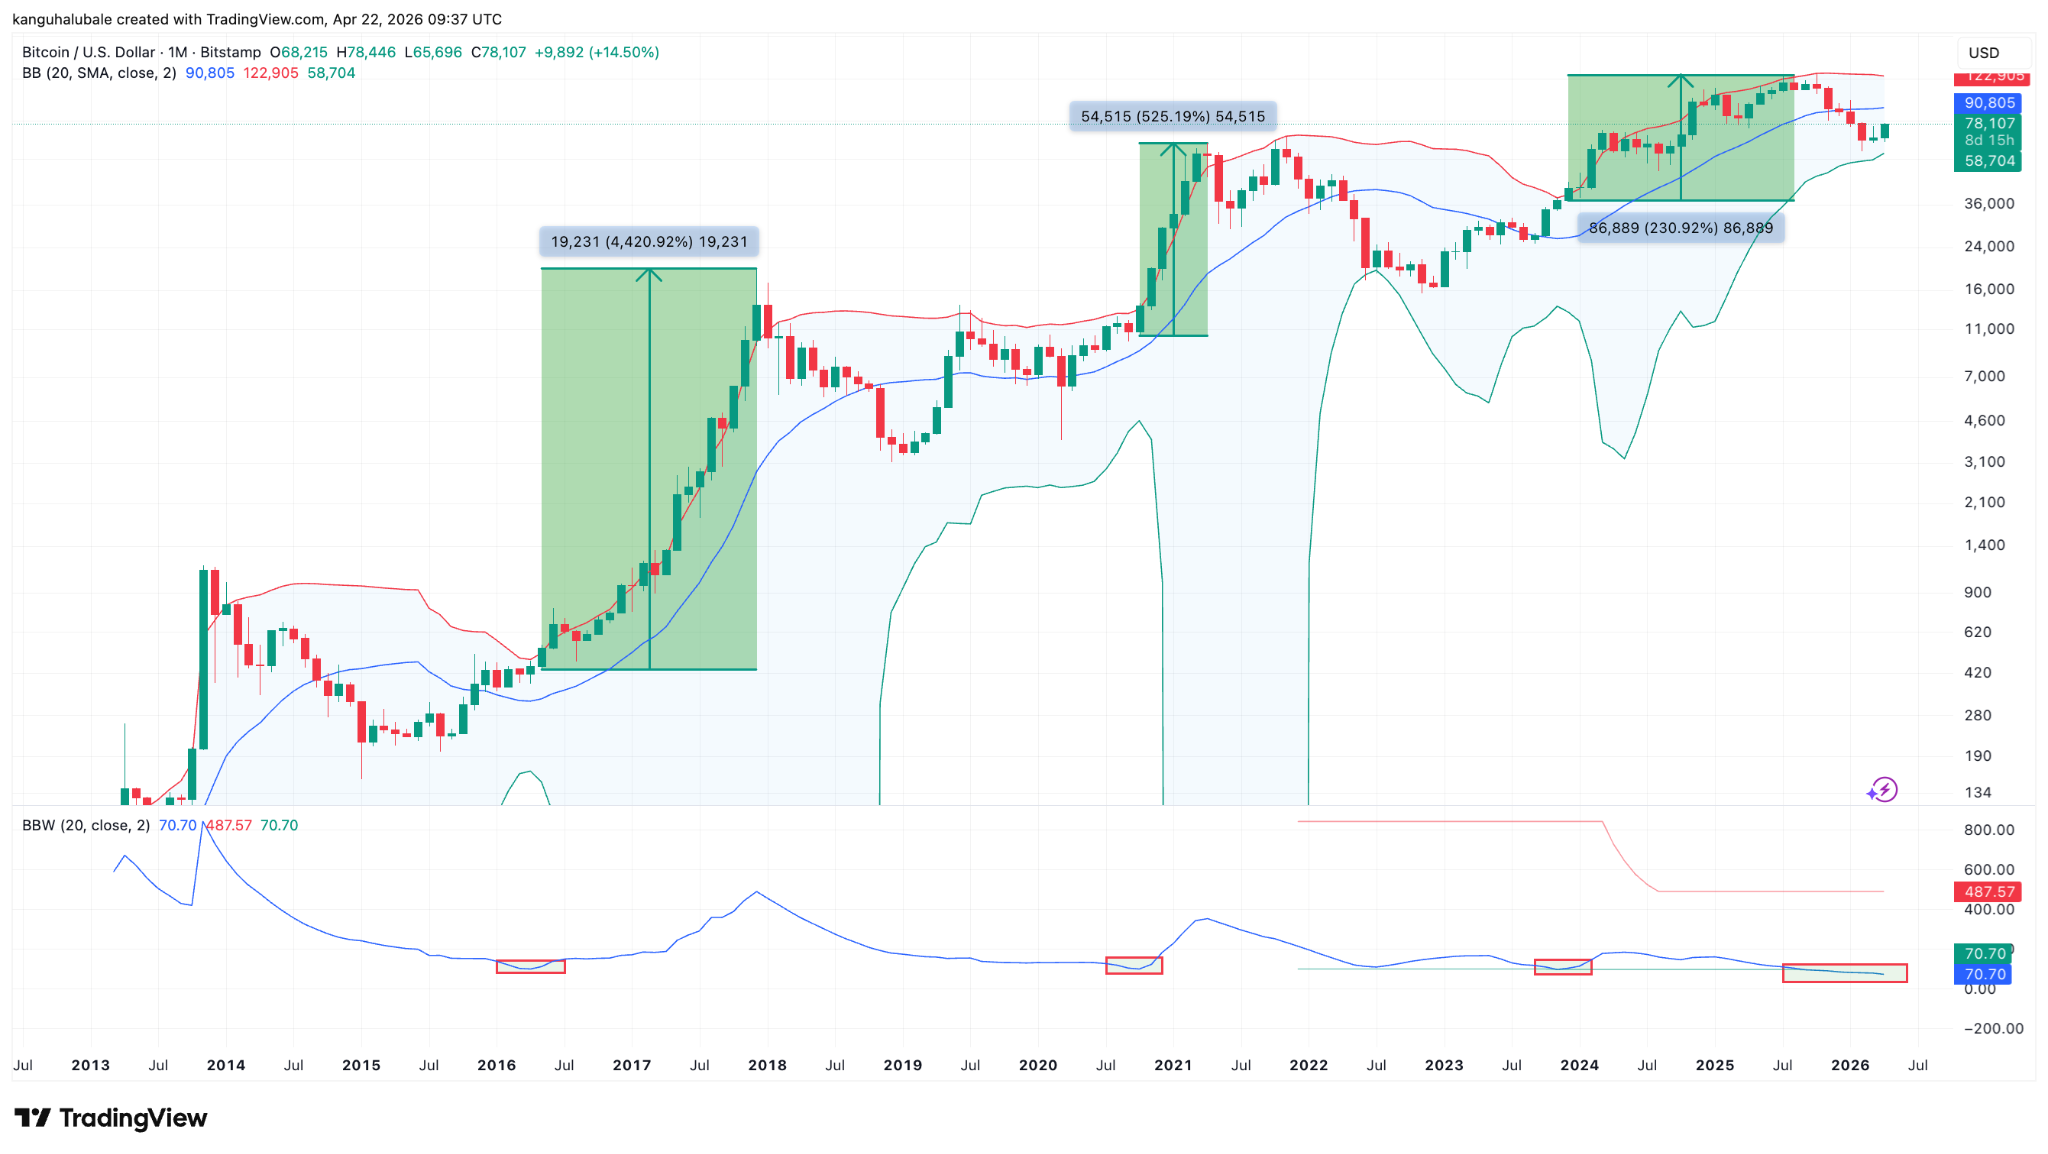
Bitcoin’s Bollinger Bands indicator now sees the potential for a massive price breakout.
-
BTC price needs to overcome resistance at $80,000 for more upside.
Bollinger Bands suggest Bitcoin’s “bull run is next”
Bitcoin’s Bollinger Bands have reached their tightest point ever on the monthly time frame, signaling that volatility should be expected soon.
Related: Bitcoin ‘Bull Score’ hits six-month high as 2022 bear-market fears linger
Bollinger Bands (BB) is a technical indicator used by traders to assess momentum and volatility within a certain range.
The “tightest Bitcoin monthly Bollinger band squeeze, ever,” said analyst Cantonese Cat in an X post on Wednesday.
“This will lead to a very powerful move when it expands,” the analyst added.
The BTC/USD pair gained about 230% between December 2023 and August 2025 to its current all-time high of $126,000, after breaking above the upper boundary of the Bollinger Bands.
Similar occurrences in 2020 and 2016 triggered the previous bull runs that saw BTC price rally more than 520% and 4,400%, respectively.

Meanwhile, Coinvo Trading shared a chart showing that Bitcoin’s monthly RSI has dropped to its lowest level since late 2022.
This coincided with the BTC/USD drop to a multi-year support trend line, an occurrence that has previously marked Bitcoin’s macro bottoms.
The last time this happened was at the bottom of the 2022 bear market, preceding a 350% BTC price rally to its previous all-time high of $73,800, reached in March 2024.
“The same exact trendline, the same oversold RSI, the same outcome,” Coinvo Trading said, adding:
“Bull run is next in line.”

As Cointelegraph reported, several Bitcoin metrics, including a bullish MACD crossover on the weekly chart, suggest that a BTC price breakout is about to begin.
Bitcoin must reclaim $80,000 next
Bitcoin’s 6% rally over the last three days saw the BTC/USD pair fill the $74,000-$77,000 CME gap created over the weekend.
Traders are now looking at the next CME gap above $80,000, formed in early February.

MC Capital founder Michael van de Poppe said resistance at $79,000 could temporarily “stall” Bitcoin’s upward momentum
“Likely we’ll test it first, come back down for a little, find extra stamina, and then we’ll push through to $86K.”

Meanwhile, Bitcoin’s whale order book showed “heavy sell pressure” between $78,000-$80,000, reinforcing the significance of this resistance level.

As Cointelegraph reported, a close above the $76,000-$78,000 resistance zone would confirm that the buyers are in control, clearing the path for a potential rally to $84,000.
This article is produced in accordance with Cointelegraph’s Editorial Policy and is intended for informational purposes only. It does not constitute investment advice or recommendations. All investments and trades carry risk; readers are encouraged to conduct independent research before making any decisions. Cointelegraph makes no guarantees regarding the accuracy or completeness of the information presented, including forward-looking statements, and will not be liable for any loss or damage arising from reliance on this content.
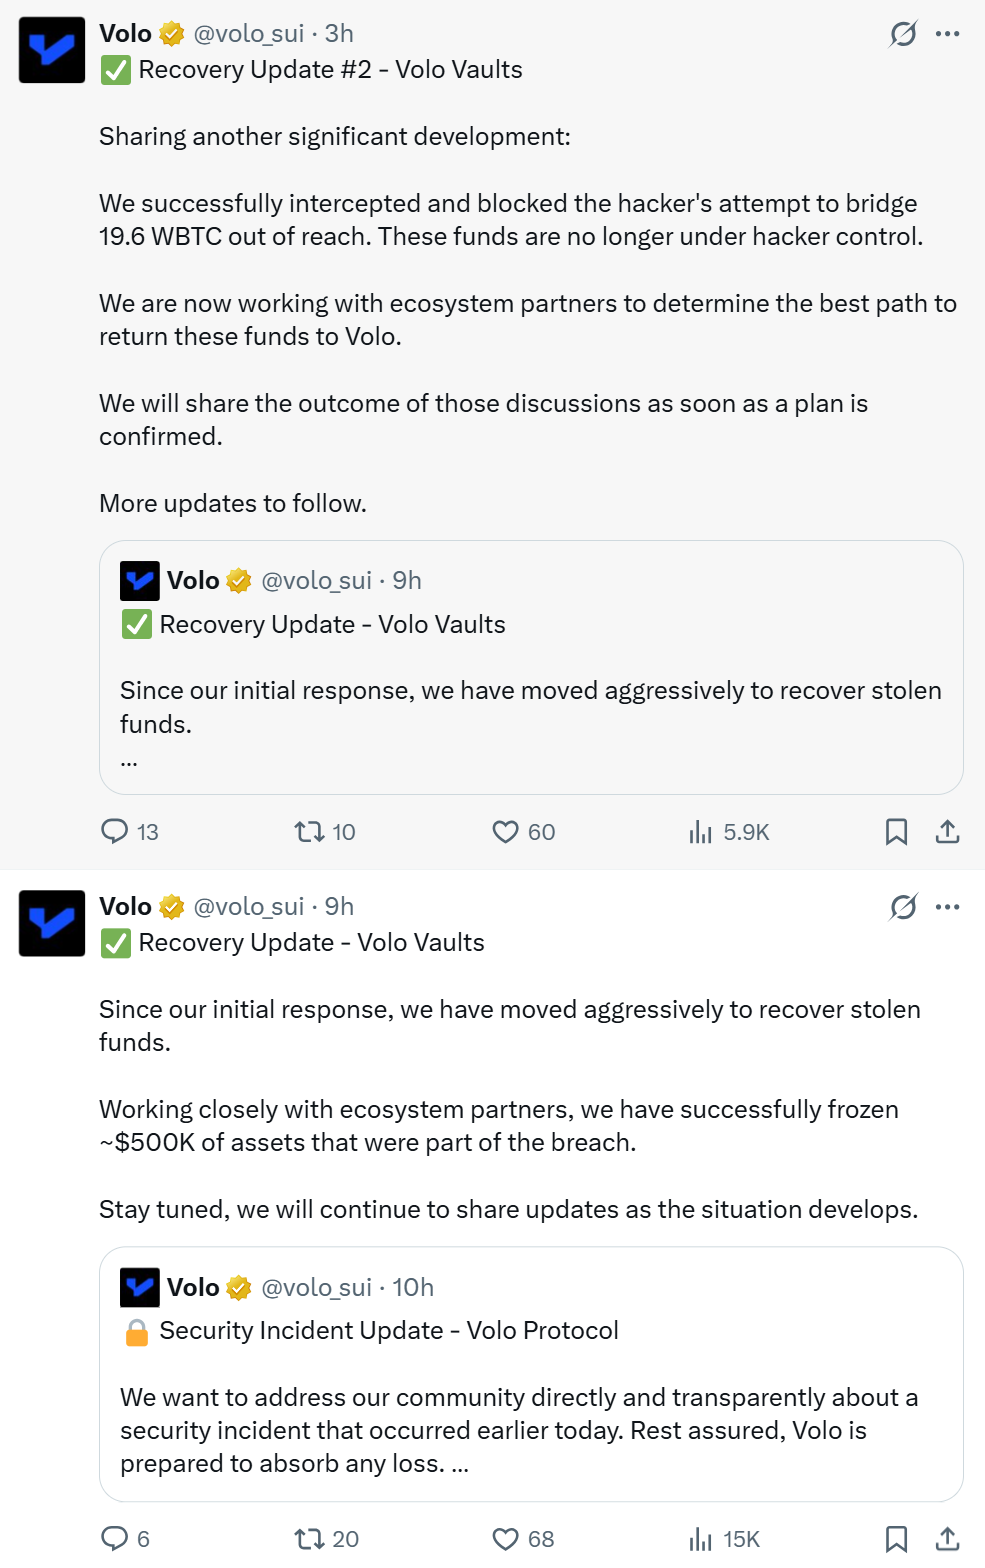
Decentralized finance (DeFi) protocol Volo has disclosed a security breach that resulted in the loss of approximately $3.5 million in digital assets, marking the latest incident in a series of exploits targeting DeFi platforms.
In a Wednesday post on X, the team said the attack affected select vaults and involved assets including Wrapped Bitcoin (WBTC), Matrixdock Gold XAUm and USDC (USDC). “We detected the attack, immediately notified the Sui Foundation and ecosystem partners to contain the damage, and froze the vaults to prevent any further exposure,” the team wrote.
The protocol added that around $28 million in total value locked across other vaults is safe, with the exploit limited to three isolated vaults and no shared vulnerability identified. It also revealed plans to absorb the losses rather than pass them on to users, though details of any remediation plan have yet to be finalized.
Volo is a liquid staking DeFi platform on the Sui blockchain, allowing users to stake their Sui (SUI) tokens and receive voloSUI (VSUI) in return. DeFi is already on edge, as the exploit comes as another liquid restaking protocol, Kelp, was hacked for approximately $293 million over the weekend, which has had a ripple effect across the broader ecosystem.
Related: Kelp DAO attacker moves $175M in Ether after exploit: Arkham
Volo freezes a portion of lost funds
In two separate updates, Volo said it has frozen or blocked roughly $2 million of the stolen funds so far. In the first update, the protocol said that roughly $500,000 linked to the breach has already been frozen. In a later update, the team claimed it had successfully blocked an attempt by the attacker to bridge 19.6 WBTC, effectively removing those funds from the hacker’s control.
“We are now working with ecosystem partners to determine the best path to return these funds to Volo,” the protocol wrote.

Crypto hacks claim $17 billion in 10 years
As Cointelegraph reported, more than $17 billion has been stolen in crypto over the past decade, with private key compromises identified as one of the major contributing attack vectors, according to DefiLlama.
Related: ZachXBT asks MemeCore to explain valuation and token supply
Roughly 22.3% of incidents are linked to brute-force key compromises, 18.2% to unknown methods and 10% to phishing attacks on multi-signature wallets. The findings show that many of the biggest losses stem from wallet security and user-side weaknesses rather than protocol bugs.
Magazine: 53 DeFi projects infiltrated, 50M NEO tokens could be ‘given back’: Asia Express
Crypto World
Tesla Reports Earnings After the Bell: Will Elon Musk’s AI Roadmap Trigger a Crypto Rally Before Midnight?

Tesla reports Q1 2026 earnings after market close today, and the AI roadmap update could move crypto markets before midnight.
The live Q&A webcast kicks off at 5:30 p.m. Eastern, with analysts watching every word on robotaxi expansion and Optimus progress.
Wall Street consensus sits at $0.30 EPS, a steep drop from Q4’s $0.50 beat, leaving the bar low enough that almost any positive AI catalyst could trigger a sharp move.
Cross-chain liquidity plays are already seeing elevated attention as institutional money rotates into infrastructure narratives ahead of the print.
Tesla’s April 2 production release confirmed 408,000+ vehicles built and 358,000+ delivered in Q1, alongside 8.8 GWh of energy storage deployed, steady numbers that kept the stock from collapsing pre-earnings.
The shareholder deck is expected to detail robotaxi expansion to nine cities in H1 2026, Cortex 2 compute buildout at the Texas Gigafactory, and a belated Optimus Gen 3 update after Q1’s promised unveil quietly didn’t happen.
A live earnings stream is already pulling significant viewer traffic ahead of the 4:30 p.m. CT call. The broader question isn’t whether Tesla beats — it’s whether the AI narrative holds up under analyst questioning. That answer will ripple well beyond TSLA.
Can TSLA’s AI Reveal Spark a Broader Risk Rally This Week?
With Q1 EPS projected at $0.30 against Q4’s actual $0.50 — a 25% beat over the $0.40 estimate, the year-over-year earnings compression is real.
The question is whether Tesla’s AI pipeline reframes the valuation story fast enough to matter. Robotaxi revenue is pre-commercial. Optimus is still pre-scale. Cortex 2 is burning capex. None of that is cheap.
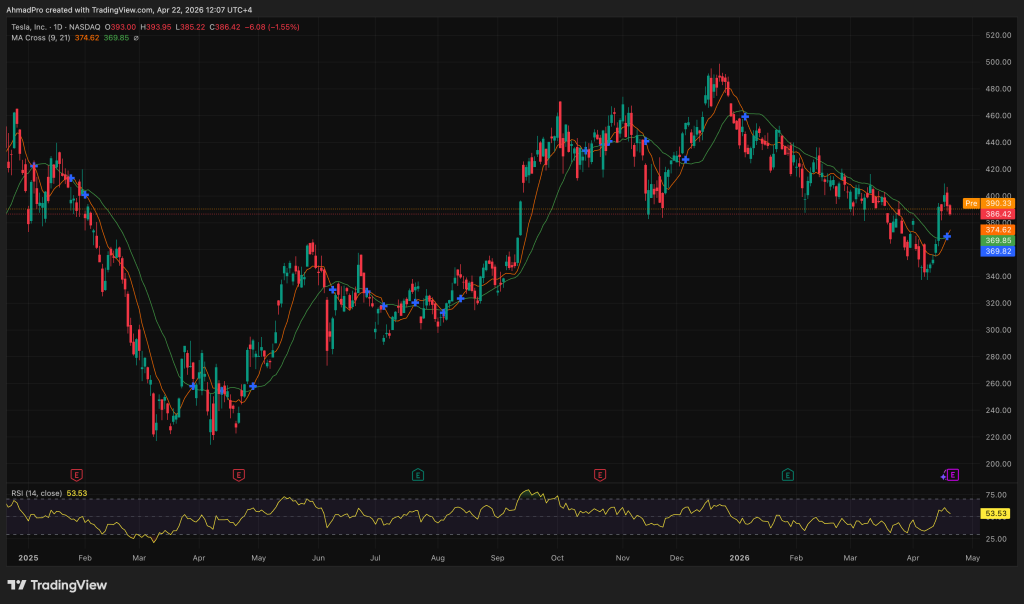
Technically, TSLA has been consolidating in a wide range ahead of the print, with momentum indicators suggesting indecision rather than conviction.
The bull case: a strong AI update, new robotaxi city timelines, Optimus production numbers, or Cortex 2 milestones, pushes sentiment into breakout territory and drags high-beta tech and crypto assets with it. Spot Bitcoin ETFs have already recorded $1B+ weekly inflows, signaling institutional appetite that a TSLA AI pop could amplify.
Base case: Tesla meets the $0.30 EPS print, management delivers cautious optimism on robotaxi rollout, and markets grind sideways into the weekend.
Bear case, and the genuine invalidation, is any hint that Full Self-Driving timelines are slipping further, Optimus production targets are being walked back, or Cortex 2 costs are running over. That scenario pressures AI-adjacent assets across the board. Three numbers to watch at 5:30 Eastern: gross margin, energy storage revenue, and any hard robotaxi fleet figure.
LiquidChain Targets Early-Mover Upside as TSLA Tests Key Catalyst Levels
Here’s the uncomfortable truth about chasing TSLA post-earnings: at any size, the asymmetric upside is gone before retail gets in.
The move happens in the first 90 seconds. On-chain liquidity signals are spiking ahead of tonight’s call, and that capital is increasingly looking for early-stage infrastructure plays where the entry point still exists.
LiquidChain ($LIQUID) is a Layer 3 infrastructure project built around a single proposition: fusing Bitcoin, Ethereum, and Solana liquidity into one unified execution environment. Developers deploy once, access all three ecosystems. The architecture includes a Unified Liquidity Layer, Single-Step Execution, Verifiable Settlement, and Deploy-Once infrastructure, targeting the fragmentation problem that costs DeFi protocols billions annually in lost efficiency.
The presale is currently priced at $0.01452, with $691,470.51 raised to date. That’s early by any measure.
Institutional narratives around BTC are accelerating, and a project merging BTC, ETH, and SOL liquidity rails is positioned directly inside that thesis. Risk is real — presales carry no liquidity guarantees, and token value is speculative until mainnet.
Research LiquidChain here before the next presale stage opens.
The post Tesla Reports Earnings After the Bell: Will Elon Musk’s AI Roadmap Trigger a Crypto Rally Before Midnight? appeared first on Cryptonews.

Disclosure: This article does not represent investment advice. The content and materials featured on this page are for educational purposes only.
Utility-driven new crypto coins gain momentum as investors target early-stage opportunities in 2026.
Summary
- DOGEBALL raised $200K+ in Stage 2, combining payments, gaming, and staking in one Layer 2 ecosystem.
- Built on DOGECHAIN, DOGEBALL enables crypto-to-fiat transfers with near-instant payments and zero FX fees.
- At $0.0004 presale price, DOGEBALL offers strong ROI potential before its planned $0.015 launch price.
The biggest winners in new crypto coins 2026 are emerging from projects that combine real-world utility with strong early-stage entry opportunities.
As innovation accelerates, investors are focusing on tokens that solve actual problems while offering measurable upside. This list highlights six projects shaping the next phase of blockchain adoption, including DOGEBALL, Celestia, Starknet, LayerZero, Sei, and zkSync.

Each of these coins brings a distinct advantage, from scaling infrastructure to enabling seamless global payments. Among them, DOGEBALL stands out with a live crypto presale that combines payments and gaming into a revenue-driven ecosystem. Let’s break down how these projects are positioning themselves for growth in 2026.
DOGEBALL presale gains momentum with $200k raised and real payment utility
DOGEBALL is a high-utility ecosystem built on its custom Ethereum Layer 2 called DOGECHAIN. It combines GameFi and PayFi to enable users to send crypto while recipients receive fiat directly into their bank accounts worldwide. With zero FX fees, no intermediaries, and near-instant transfers, DOGEPAY solves real problems in global remittances and digital payments.
Within the new crypto coins 2026 category, DOGEBALL stands out due to its direct link between usage and token demand. The DOGEBALL token powers transaction fees, gaming rewards, and staking, creating consistent buy pressure. The presale is currently in Stage 2 at $0.0004, with $200K+ already raised from 750+ participants, signaling strong early adoption ahead of its closing date on 2nd May 2026.
DOGEBALL crypto presale 2026 roi potential and bonus strategy
The DOGEBALL crypto presale 2026 offers a clear, data-driven entry point for investors. With a current price of $0.0004 and a confirmed launch price of $0.015, early buyers could see a potential ROI of 3650% within the 4-month presale period. This timeline started on 2nd January 2026 and creates a focused window to accumulate tokens before public listing.
Using the PAY35 bonus code gives an immediate 35% increase in token allocation, improving entry value from day one. On top of that, the Buyer of the Week competition adds another layer of incentive, where top buyers receive a 100% bonus on their weekly spend. The competition is intense, with last-minute buys of $2131 at 23:58 UTC and $2320 at 23:59 UTC securing the top spot, reinforcing urgency and strong demand.
Celestia expands modular blockchain adoption with new rollup integrations
Celestia is gaining attention for its modular blockchain design, which separates execution from consensus and data availability. This allows developers to deploy scalable rollups without building full blockchain stacks. Recent updates include enhanced data availability, sampling, and new integrations that make deployment faster and more cost-efficient.
This approach is attracting developers who want flexibility and scalability without high infrastructure costs. As more projects adopt modular architecture, Celestia is positioning itself as a foundational layer for the next generation of decentralized applications.
Starknet strengthens ZK rollup scaling with improved developer tools
Starknet continues to push forward as a leading ZK-rollup solution built on STARK proofs. Its ability to process high volumes of transactions while maintaining Ethereum-level security makes it a key scaling solution. Recent upgrades have focused on improving developer tools and reducing transaction costs.
Adoption is growing across DeFi and NFT ecosystems as projects look for scalable and secure infrastructure. Starknet’s continuous improvements are helping it maintain a strong position in the Layer 2 space.
LayerZero drives cross-chain growth with omnichain interoperability
LayerZero is solving the problem of blockchain fragmentation by enabling seamless communication across multiple networks. Its omnichain protocol allows assets and data to move without relying on centralized bridges, reducing risk and improving efficiency.
Recent partnerships and integrations have expanded its ecosystem, making it easier for developers to build cross-chain applications. This positions LayerZero as a critical infrastructure layer in a multi-chain future.
Sei Network accelerates trading with a high-speed execution architecture
Sei is designed specifically for trading applications, offering high-speed execution and low latency. Its parallelized architecture allows multiple transactions to be processed at the same time, making it ideal for DeFi trading platforms.
The network is seeing increased adoption from trading-focused projects and liquidity providers. Its performance-driven design gives it a competitive edge in sectors where speed and efficiency directly impact user experience.

zkSync enhances user adoption with low fees and seamless experience
zkSync is a Layer 2 solution that uses zero-knowledge proofs to scale Ethereum while keeping fees low. Its focus on user experience has led to improvements in onboarding, wallet integration, and transaction simplicity.
Developers are increasingly choosing zkSync for consumer-facing applications due to its balance of scalability and usability. Continued ecosystem growth is expected to drive further adoption in 2026.
Why DOGEBALL presale stands out among new crypto coins 2026
The new crypto coins 2026 list includes strong infrastructure projects, but DOGEBALL offers a unique advantage by combining real-world payments and gaming into a single ecosystem. Its ability to convert crypto to fiat instantly, eliminate fees, and enable global transactions gives it a practical use case that directly drives demand.
The DOGEBALL presale provides a limited 4-month opportunity to enter at $0.0004 before the expected $0.015 launch. With $200K+ already raised, strong competition for weekly bonuses, and the PAY35 code offering 35% extra tokens, the project presents a structured and high-potential entry point for investors seeking both utility and returns.
For more information, visit the official website, Telegram, and X.
FAQs for new crypto coins 2026
What are the top new crypto coins to invest in in 2026?
DOGEBALL, Celestia, Starknet, LayerZero, Sei, and zkSync are among the most promising projects due to their strong utility, scalability solutions, and growing ecosystems.
How does the DOGEBALL crypto presale 2026 work?
Investors can buy DOGEBALL at $0.0004 during the presale phase. The token is expected to launch at $0.015, offering significant ROI potential along with bonus incentives like PAY35 and weekly rewards.
Why do crypto presales offer high returns?
Crypto presales provide early access to tokens at lower prices before public listing. If the project gains traction and lists higher, early investors benefit from the price difference and additional incentives.
Disclosure: This content is provided by a third party. Neither crypto.news nor the author of this article endorses any product mentioned on this page. Users should conduct their own research before taking any action related to the company.


Strategy (formerly MicroStrategy) already pays 11.5% annualized dividends on its ultra-risky Stretch (STRC) but DeFi users are now adding risks and leverage to crank that up to 39%.
In finance, interest rates are often dictated by the risk of total loss. With very few exceptions, when someone offers a higher interest rate, it’s because they’re much more likely to not pay you back.
Unbothered, traders are now re-routing Strategy’s dividend payouts through multiple blockchain protocols to manufacture yields of double, triple, or more what STRC actually pays.
They add future obligations in exchange for near-term payouts, take advantage of temporary incentives for obscure DeFi protocols, and add exotic forms of leverage to amplify the notional exposure of an otherwise small investment.
In the curious underworld of tokenized STRC, there are at least five protocols offering the financial machinery for DeFi yield farmers, not to mention the risks of the custodians and technology providers involved with these protocols.
A daisy-chain of DeFi risks to amplify STRC
Apyx wraps roughly $136 million of STRC into a synthetic stablecoin-like token called apxUSD. Saturn packages approximately $85 million worth of STRC into its USDat product. Another tokenization protocol xStocks put approximately $53 million worth of STRC on-chain.
Meanwhile, Pendle Finance splits these STRC tokens and the dividends paid to STRC stockholders into separately tradable, fixed-rate and floating-rate components, and Morpho provides the loan-looping mechanism at the end to add even more financial leverage on these instruments.
Depositing assets to borrow these tokens, which trade under a variety of ticker symbols like STRCx, apyUSD, apxUSD, USADT, sUSADT, strcUSX, traders borrow tokens, re-deposit some portion of those loan proceeds to take out more loans, re-deposit some portion of those loan proceeds to take out more loans, and so on.
The more loops and the smaller the range of prices that a user collateralizes, the higher the probability that the protocol will forcibly liquidate the position.
Irresponsible dividends, amplified
The base yield of STRC with no tokenization whatsoever is already extreme. STRC pays 11.50% annualized, roughly 450 basis points above the average junk bond.
Indeed, Strategy has hiked its dividend rate seven times since launching STRC at 9% in July 2025.
Each hike tacitly admitted that demand at the prior rate was too weak to hold up STRC’s secondary trading on Nasdaq at its intended $100 per share.
Read more: We calculated the present value of STRC — it’s bad for MSTR
Rather than ease up on leverage in light of the thinning air, DeFi’s response has been to treat 11.5% as a stable case on which to construct even higher artifices.
Apyx Finance closed a $300 million valuation round in February as a self-described dividend-backed stablecoin protocol.
It issues apxUSD backed by STRC and a related preferred like Strive’s STRC-like SATA, with apyUSD as the yield-bearing version of the same claim. Saturn Credit raised $800,000 from Sora Ventures and Changpeng Zhao’s YZi Labs in January to run the same play through USDat and sUSDat.
Both of these STRC tokenizers wrap their resulting tokens into Pendle, where PT-apyUSD locks in fixed yields of roughly 14.84%.
Users then deposit those PT tokens on Defi protocol Morpho as collateral to borrow USDC at rates as low as 1.59%.
The arithmetic isn’t subtle. A 5x leverage loop landed on a 64% APY. A separate analyst account documented 39% APY.
Hoping and praying STRC never de-pegs for long
On April 14, STRC was approaching its monthly dividend snapshot date, going “ex-dividend” in the parlance of Wall Street, causing its price to decline. That sag dragged sUSDat’s exchange rate below the high-water mark Pendle uses to govern yield accrual for the Saturn token.
Pendle had to explain this basis phenomenon to its users. “Yield accrual on YT-sUSDat is currently paused due to STRC’s ex-dividend event on 14 April, which pushed the exchange rate below the watermark,” it said.
It reassured holders that “If STRC recovers to $100, the watermark is recaptured, yield accrual resumes, and your total earnings will be ultimately unaffected.”
As always, the conditional “if” is doing a lot of heavy lifting.
Indeed, if STRC trades near $100 and pays dividends near 11.5% forever, everything will work out wonderfully.
In fact, STRC fell to $90.52 on November 21, 2025, and to $93.10 in February 2026. That’s why the dividend rate is where it is. It shouldn’t be a mystery as to why Strategy needs to pay such as higher dividend rate.
Unfortunately for STRC traders in DeFi, neither is guaranteed. The quasi-peg has already failed twice in the last six months. Moreover, Strategy’s board of directors can cut the dividend at its discretion.
DeFi traders are also exposed to countless numbers of protocol, blockchain, smart contract, and custodian risks that multiply these risks even higher.
Got a tip? Send us an email securely via Protos Leaks. For more informed news, follow us on X, Bluesky, and Google News, or subscribe to our YouTube channel.
Bitcoin pushed above $78,000, lifting the broader crypto market. The move came as risk sentiment improved after U.S. President Donald Trump extended the ceasefire with Iran. Stock index futures also gained.
The cryptocurrency’s ascent ended the weeks of choppy trading between $65,000 and $75,000 that defined March and early April, finally giving momentum traders the green signal they had been waiting for.
Momentum traders buy when they see proof that an upward trend is underway. Bitcoin’s breakout is exactly that, and more buyers could pile in as a result, adding to the momentum. As the first law of motion says: An object in motion stays in motion until an outside force acts upon it, though Sir Isaac Newton may not have been thinking of financial markets at the time.
“The market spent months capped in the 65 to 75 box. Breaking out of that kind of range matters because it changes behavior. Sellers who were comfortable fading rallies above 74 now have to reassess. Momentum buyers who were waiting for confirmation finally have something to lean on,” analysts at Marex said.
Onchain indicators suggest the same. For instance, the number of coins held in wallets tied to centralized exchanges has dropped to a fresh multiyear low of 2.67 millon BTC, according to data source CryptoQuant. It points to continued investor accumulation, which could culminate in a supply shock.
“Bitcoin supply on exchanges continues to shrink, with fewer coins available to sell, more BTC moving to long-term holders, and liquidity tightening. Bitcoin is becoming increasingly scarce – supply down means volatility up,” Delta Exchange said on X.
Still, QCP Capital is urging caution, noting the persistent relative richness of bitcoin put options on Deribit. Puts are used as a hedge against potential price drops in the underlying asset. It added that crypto trends currently seem tied to the price of oil and the interest-rate outlook.
“The path forward remains anchored to oil and policy. A move lower in crude or clearer Fed signaling would support risk. Absent that, markets are likely to remain in a holding pattern, pricing uncertainty rather than resolution,” the Singapore-based firm said in a market update.
In traditional markets, WTI crude futures are trading around $90, having bounced from a low of $78 on Friday.
In the broader market, DeFi security risks remain an issue as hacks proliferate. Early today, the Sui-based Volo protocol was drained of over $3 million just days after the KelpDAO event that caused collateral damage across the sector. Stay alert!
Read more: For analysis of today’s activity in altcoins and derivatives, see Crypto Markets Today . For a comprehensive list of events this week, see CoinDesk’s “Crypto Week Ahead.”
What’s trending
This is an excerpt from CoinDesk newsletter ‘Daybook.’ Sign up here, if you haven’t already.
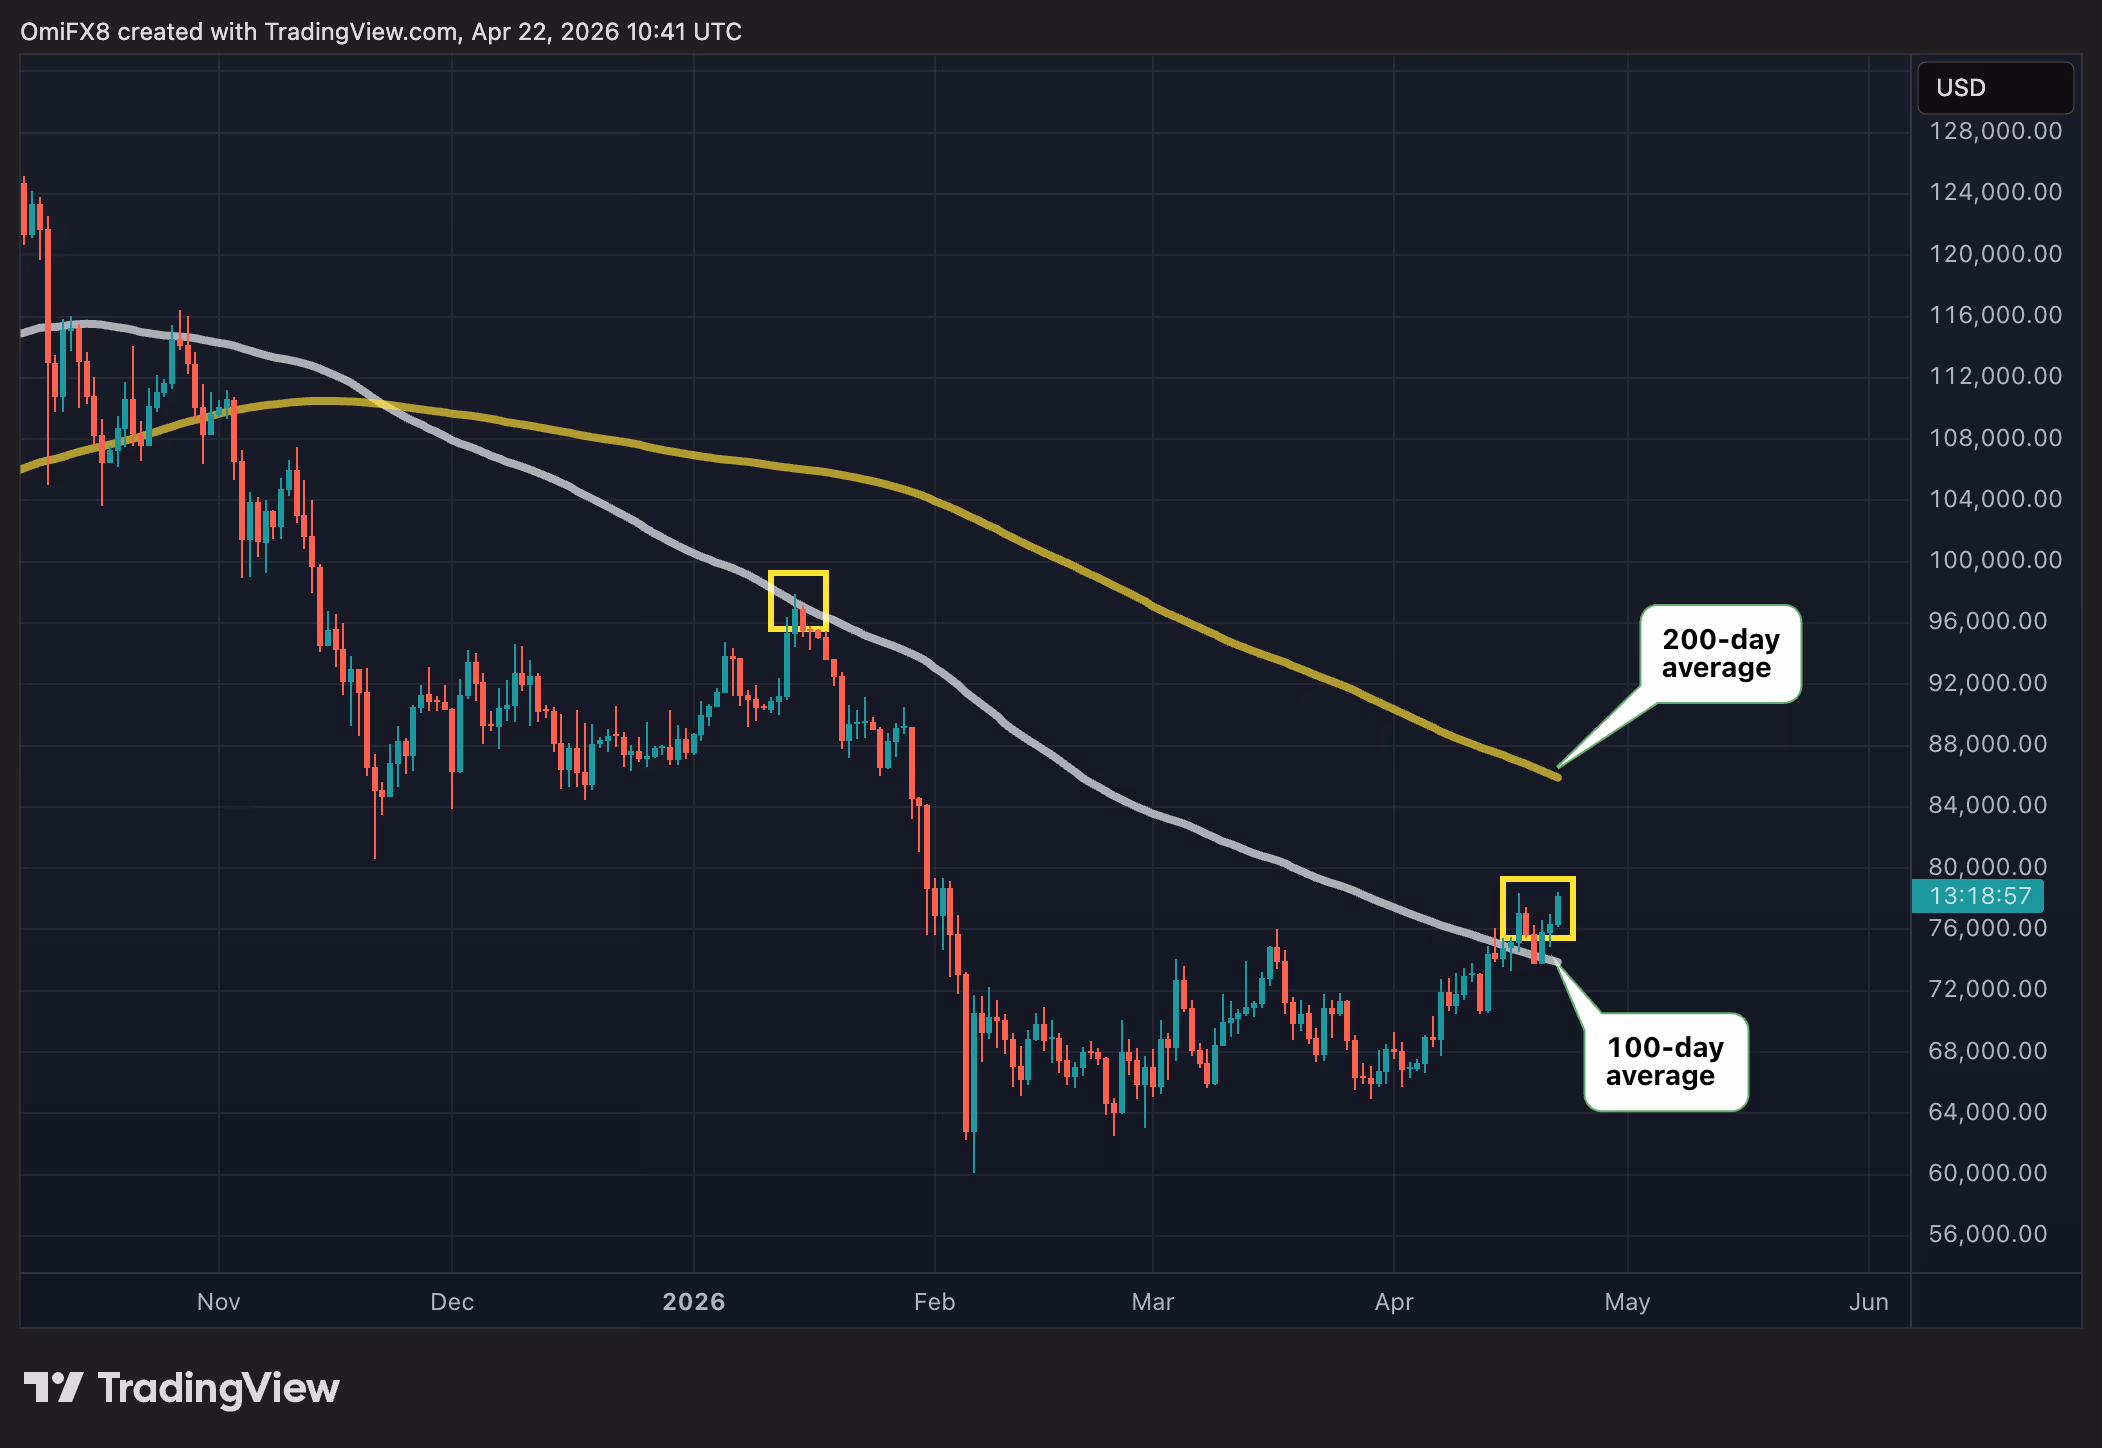
Today’s signal

The chart shows bitcoin’s daily price movements in candlestick format, with lines indicating the 100-day and 200-day average prices.
BTC’s price has established a firm foothold above the 100-day average, represented by the white line. This is pivotal because the 100-day average capped the bounce in January, following which sellers re-established control, leading to a deeper crash to nearly $60,000.
Now the price has pierced through, which typically signals a strengthening of bullish momentum, focus shifts to the 200-day average, currently positioned at $85,900.
Crypto World
WOJAK Crypto Meme Coin Pumps 87% as MAXI Targets $5M: Analyst Calls Most Obvious Trade of 2026

WOJAK crypto is moving again, and the meme coin faithful are paying attention. The original despair-fueled token surged as much as 87% in a 24-hour window, reigniting a sector that many had written off after months of sideways consolidation.
Whether this leg holds or fades fast is the question every trader is asking right now.
The rally appears supply-driven. On-chain data tracked by MEXC shows aggressive accumulation alongside a tightening circulating supply, with whale wallets absorbing selling pressure at key floor levels.
Volume spiked into the move, a distinction that separates genuine breakouts from low-liquidity noise. One chart making rounds on Crypto Twitter shows WOJAK printing its highest weekly close since its 2023 peak. That kind of structure demands a closer look.
The broader ETH memecoin sector is catching a bid at the same time, suggesting this isn’t an isolated pump. Ethereum-based meme tokens are drawing renewed capital as gas conditions improve and risk appetite expands, a context that matters when sizing any position here.
Can WOJAK Crypto Price Sustain Its Breakout or Is a Reversal Imminent?
WOJAK crypto is currently priced at approximately $0.0₆1021, sitting on a market cap of roughly $41.5M after the multi-day surge. That’s a meaningful number, small enough to move fast, large enough to attract institutional-grade meme traders who track this tier specifically.
The move here is not just a one-candle spike; it looks like sustained buying over a short window, with volume well above average, which usually signals real interest rather than a quick pump.
The structure is pretty clean when viewed in market-cap terms. Right now, the key resistance sits around $50M, and that is the level that decides whether this continues or stalls.
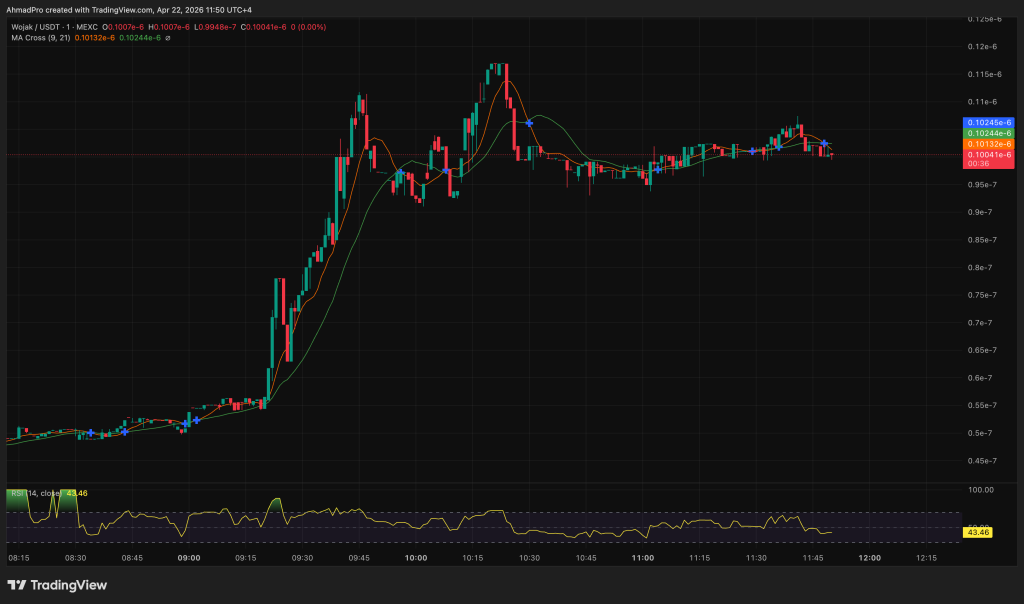
If it breaks above $50M with volume holding, that is where momentum can expand fast and open the path toward $100M as the next target, especially with traders chasing strength.
If it gets rejected there, the more realistic outcome is a cooldown, with price settling and accumulating around the $30M area while the market digests the move.
The risk is that it starts losing structure rather than consolidating, because once distribution kicks in, these moves unwind quickly.
And at this size, the further it runs without a reset, the worse the risk-reward gets, so anyone entering now is chasing momentum, not early positioning.
Maxi Doge Presale Nears $5M as WOJAK Traders Hunt Earlier-Stage Upside
WOJAK’s surge is validating the meme coin thesis — but at $21.5M market cap and already up 187%, the easy money has cleared the table (that’s just math). Traders who want the next WOJAK-style move, not the current one, are looking earlier in the funnel.
Maxi Doge ($MAXI) is currently the presale generating the most discussion in that context. Built on Ethereum as an ERC-20, the project has raised $4,748,137.43 at a current price of $0.0002814 — closing in hard on the $5M milestone.
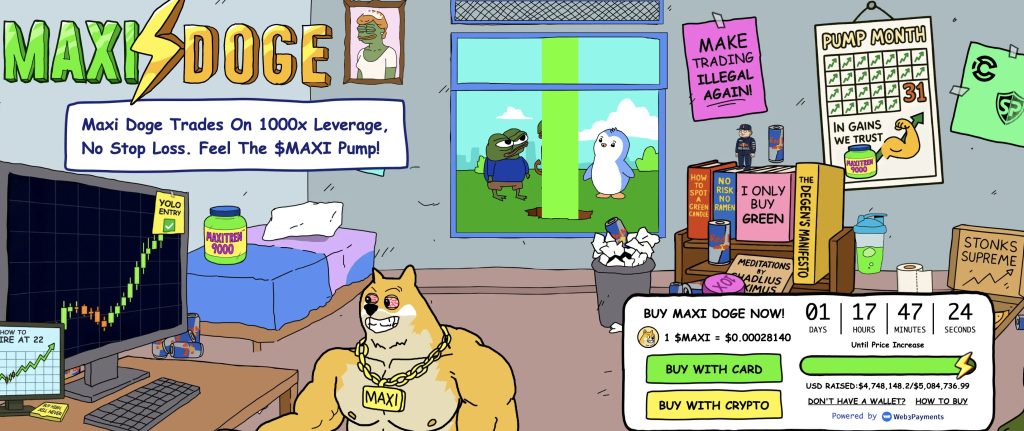
The concept is built around a 240-lb canine juggernaut embodying a 1000x leverage trading mentality: gym-bro energy meets aggressive market culture, packaged into holder-only trading competitions with leaderboard rewards and a Maxi Fund treasury backing liquidity and partnerships.
Recent coverage confirms the presale’s momentum toward that $5M threshold. Dynamic staking APY is live for current holders. The tagline, never skip leg-day, never skip a pump, is aggressively on-brand for the audience it’s targeting.
Presales carry real risk: no secondary market liquidity until launch, and meme projects live or die on community velocity. Do the work. But for traders who missed WOJAK’s entry, Maxi Doge is worth researching before that $5M milestone closes the current tier.
The post WOJAK Crypto Meme Coin Pumps 87% as MAXI Targets $5M: Analyst Calls Most Obvious Trade of 2026 appeared first on Cryptonews.
Bitcoin (BTC) price metrics are showing relief this month, but the risk of repeating the 2022 bear market remains.
Key points:
-
Bitcoin’s Bull Score Index combined price metric reaches its highest levels since October last year.
-
The relief may be short-lived, analysis warns, pointing to the 2022 bear market.
-
Crypto sentiment reaches its most bullish since January, per the Crypto Fear & Greed Index.
Bitcoin Bull Score Index ditches “bearish” zone
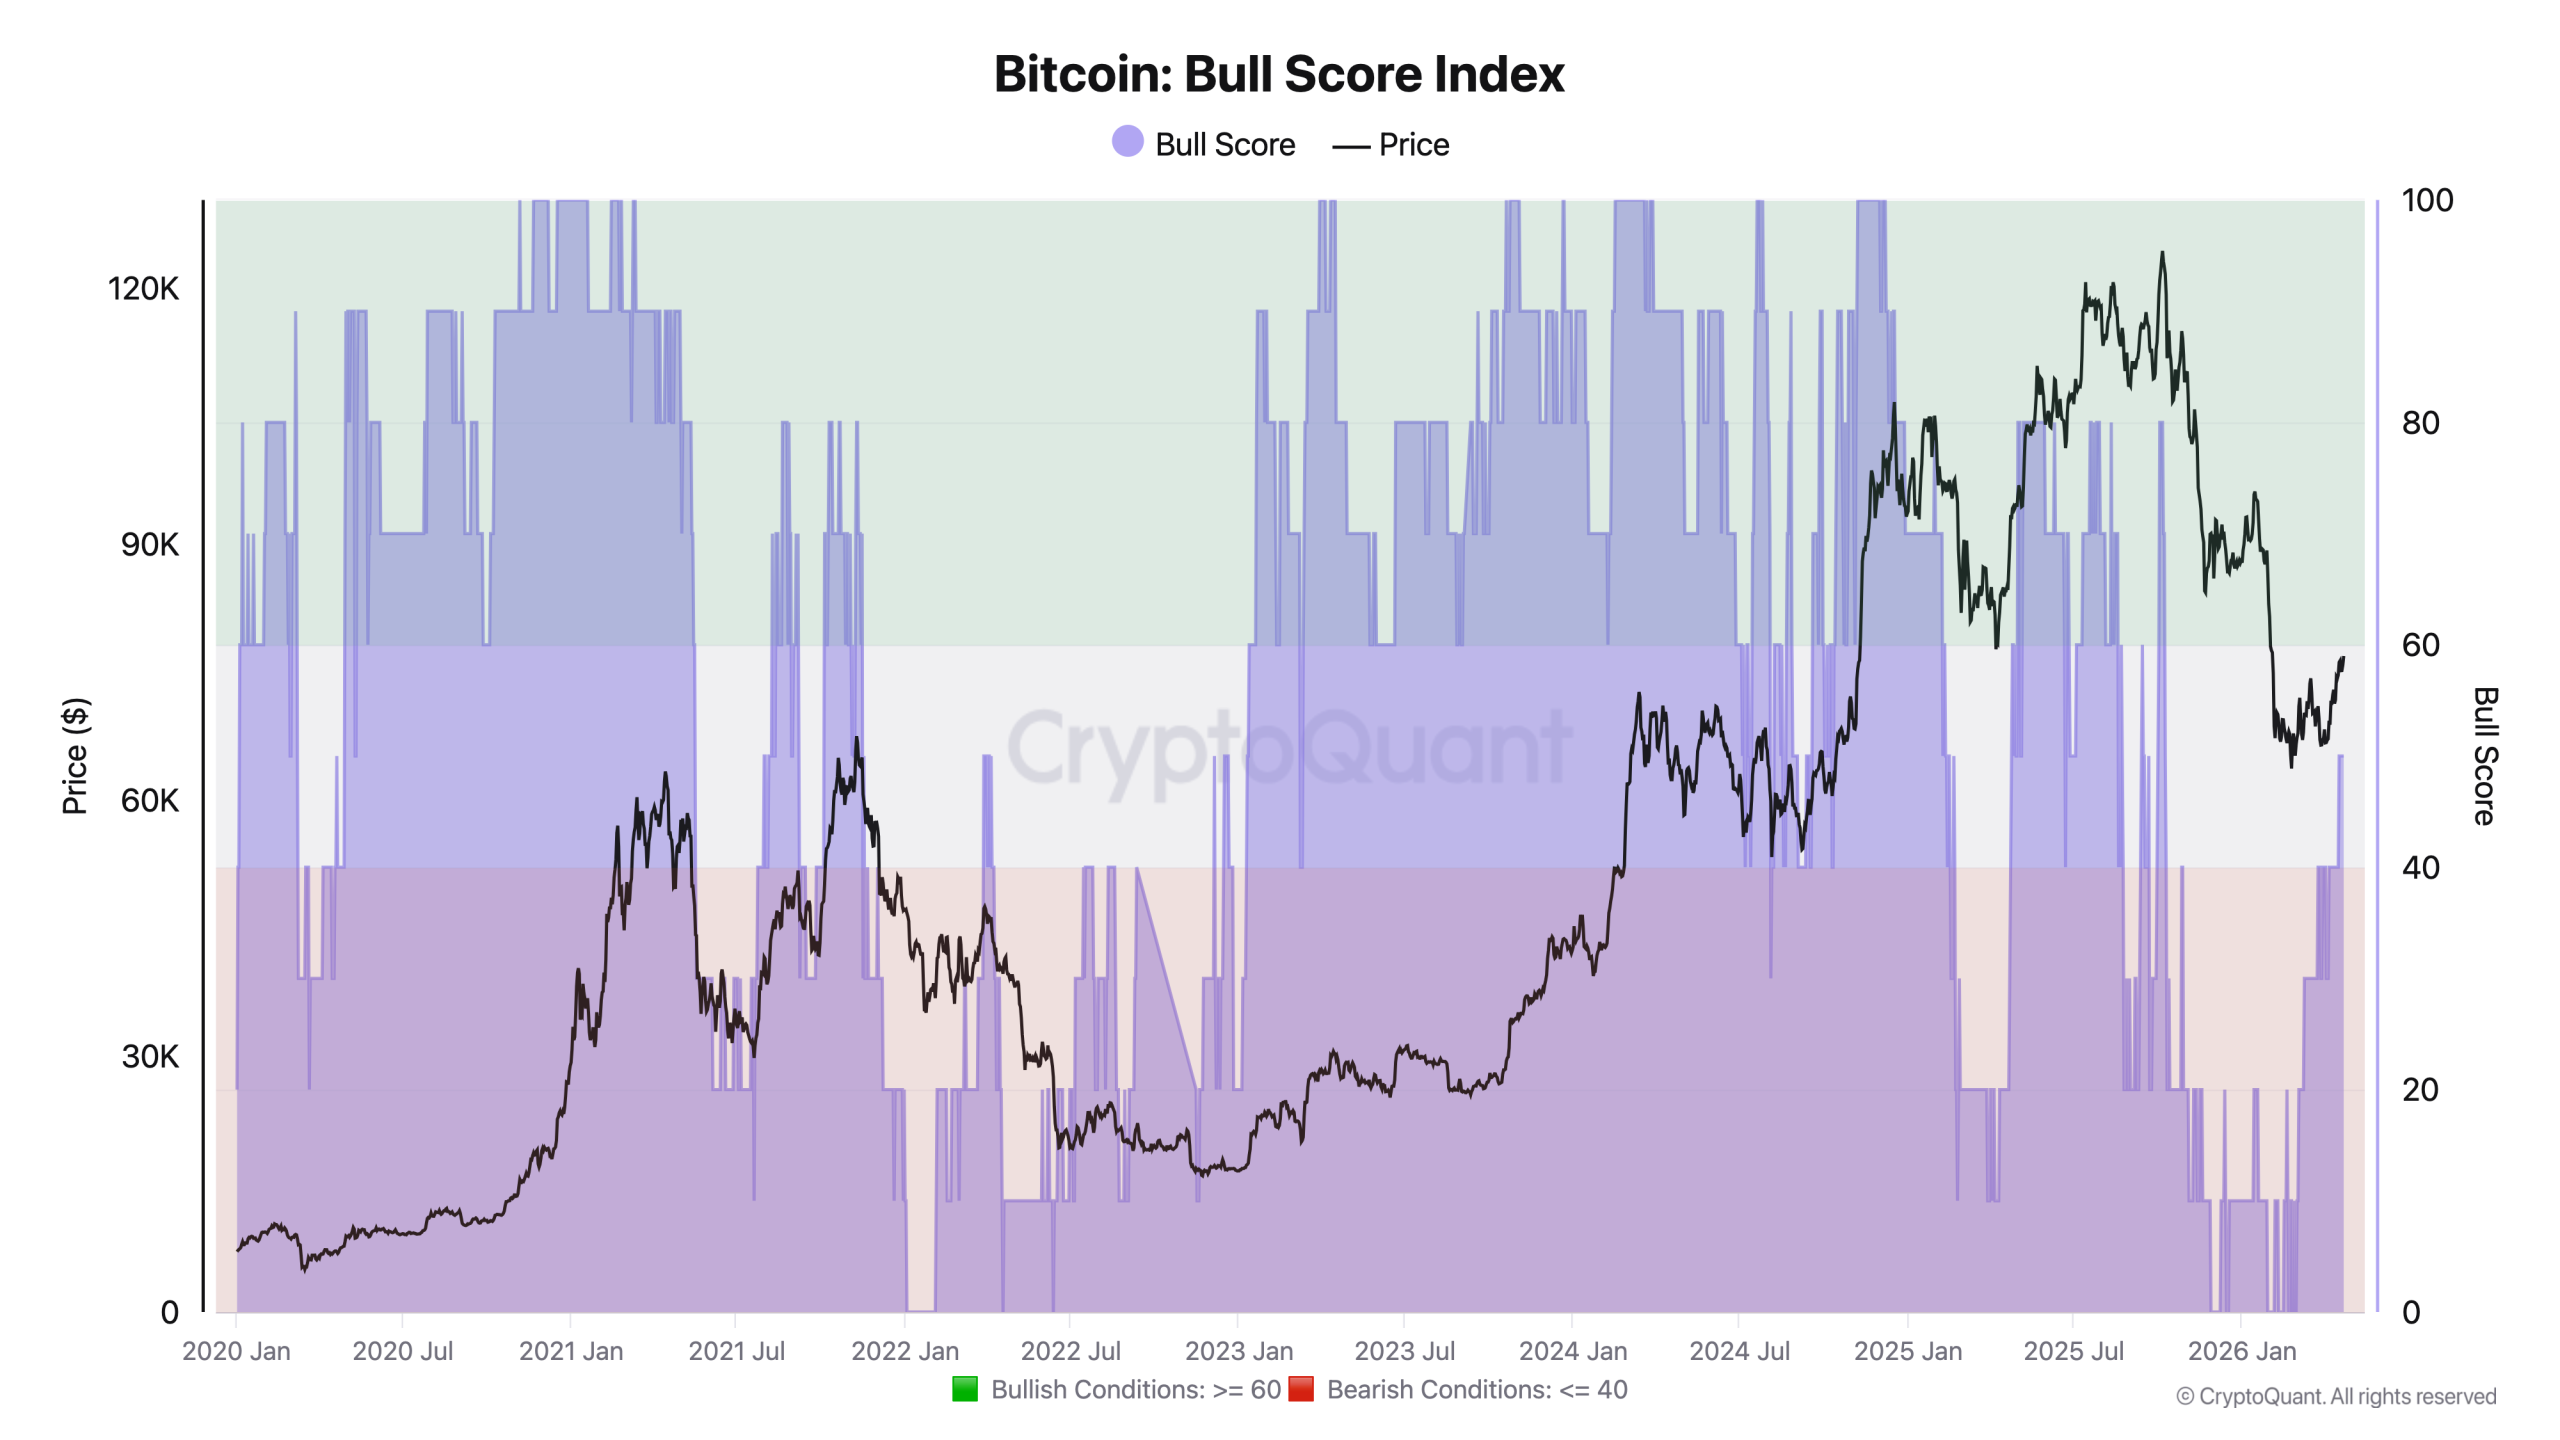
New data from onchain analytics platform CryptoQuant place the spotlight on the Bitcoin Bull Score Index (BSI).
Bitcoin has finally entered “neutral” territory with its push to $78,000, the latest BSI data confirms, with the Index climbing to its highest since October 2025.
BSI incorporates nine price metrics to give an overall impression of performance. Since the bear market began, it has been sharply bearish — just as in the early stages of the previous bear market four years ago.
“First time in this bear market that the Bull Score Index enters neutral zone (50),” CryptoQuant contributor Julio Moreno noted in an X post on Wednesday.

Moreno cautioned that despite the pressure being off for now, BSI also had a brief cooling-off period before the 2022 bear market continued.
“In March 2022, the Bull Score entered neutral territory for about a week, and then the price resumed its decline,” he added.
Should history repeat, attention will be on the Index’s performance into the April monthly close, as BTC/USD attempts to break out of a multi-month range.
Examining BSI readings last week, with price around $74,000, CryptoQuant contributor Arab Chain described a “balance between supply and demand forces.”
“On the other hand, the current BSI reading shows that the market is still far from the area of strong optimism (above 60), which typically indicates strong bullish conditions, while also remaining above the zone of extreme pessimism (clearly below 40),” they wrote in a “QuickTake” blog post.
“This places the market in a transitional phase, as investors await new catalysts to determine the next direction.”
Sentiment edges to most bullish since January
Other signs of a broader market recovery come from crypto trader sentiment.
Related: BTC price due new highs: Five things to know in Bitcoin this week
🚨 UPDATE: Crypto Fear & Greed Index sits at 32 (Fear) today, a notable recovery from Extreme Fear at 23 last week. pic.twitter.com/lmjfjh0Ui3
— Cointelegraph (@Cointelegraph) April 22, 2026
According to the Crypto Fear & Greed Index, a classic lagging indicator that uses a basket of factors to reflect the mood among investors, conditions are at their least negative since mid-January.
Fear & Greed measured 32/100 on Wednesday — still within its “fear” zone while like BSI also approaching the “neutral” bracket.
The Index value has nearly tripled in a little over a week.

This article is produced in accordance with Cointelegraph’s Editorial Policy and is intended for informational purposes only. It does not constitute investment advice or recommendations. All investments and trades carry risk; readers are encouraged to conduct independent research before making any decisions. Cointelegraph makes no guarantees regarding the accuracy or completeness of the information presented, including forward-looking statements, and will not be liable for any loss or damage arising from reliance on this content.
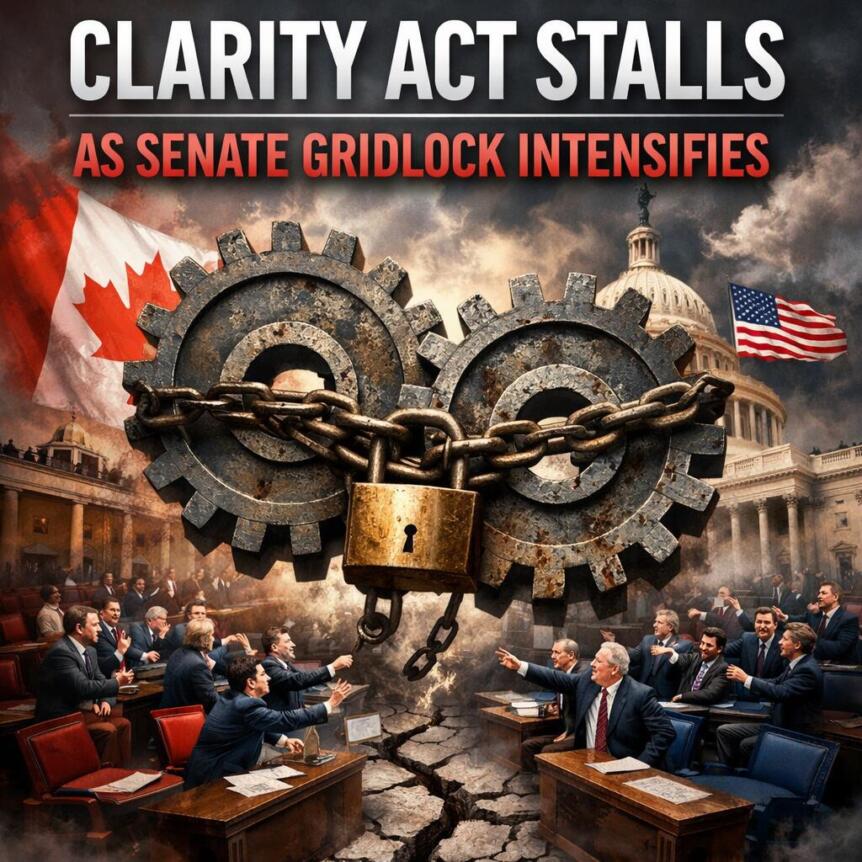
Stablecoin Dispute Blocks Legislative Progress
The CLARITY Act remains stalled in the Senate Banking Committee despite earlier bipartisan support. The bill passed the House in July 2025 with a 294–134 vote, signaling strong initial backing. However, disagreements over stablecoin yields have created a major obstacle.
Banks argue that allowing crypto platforms to offer yield-like rewards could trigger deposit outflows. They warn that reduced deposits may weaken lending capacity. Crypto firms, on the other hand, maintain that stablecoin rewards support their revenue models and user growth. This conflict has prevented consensus, as both sides continue to resist compromise.
The dispute reflects broader tensions between traditional finance and digital asset platforms. Lawmakers must balance financial stability concerns with innovation demands. Without agreement on this issue, the bill cannot advance to the next stage.
Industry Pushback and Senate Delays
Momentum weakened further in January 2026 when Brian Armstrong withdrew support for the Senate draft. He criticized provisions affecting stablecoin rewards and other industry concerns. Shortly after his statement, the Senate Banking Committee postponed its markup vote indefinitely.
This decision disrupted the legislative timeline and delayed progress by several months. The Senate Agriculture Committee approved its portion of the bill in January, yet the Banking Committee has not scheduled a new markup date. Ongoing negotiations continue, but lawmakers have not finalized key provisions.
The absence of a scheduled vote keeps the bill in legislative limbo. Each delay reduces the likelihood of timely passage. Industry divisions also complicate negotiations, as stakeholders push for favorable terms.
Time Pressure and External Priorities
The legislative calendar now poses a serious challenge. Lawmakers must move the bill through committees, secure Senate approval, and reconcile it with the House version. These steps require time and coordination.
However, attention is shifting toward the 2026 United States midterm elections. As election season approaches, legislative priorities often change. If the Senate does not act soon, the bill may face further delays or lose momentum entirely.
At the same time, geopolitical tensions, including issues involving Iran, have redirected focus toward national security matters. This shift reduces the time available for financial legislation.
The CLARITY Act now faces overlapping challenges. Policy disagreements, industry resistance, and limited legislative time continue to slow its progress.
Liverpool fan accused of racially abusing Antoine Semenyo sees trial pushed back

Anheuser-Busch invests $600M in US manufacturing, veterans and hiring

PEPE surges 4% as market sentiment improves, eyes Key resistance breakout
Manchester United reach agreement with Casemiro over contract clause amid transfer speculation

Steven Gerrard disagrees with Gary Neville over ‘shock’ Chelsea and Arsenal claim | Football

US brings back mandatory military draft registration


-

 Fashion5 days ago
Weekend Open Thread: Theodora Dress
-

 Sports5 days ago
NWFL Suspends Two Players Over Post-Match Clash in Ado-Ekiti
-

 Politics5 days ago
Palestine barred from entering Canada for FIFA Congress
-
Entertainment3 days ago
NBA Analyst Charles Barkley Chimes in on Ice Spice McDonald’s Fiasco
-

 Business3 days ago
Powerball Result April 18, 2026: No Jackpot Winner in Powerball Draw: $75 Million Rolls Over
-

 Politics3 days ago
Zack Polanski demands ‘council homes not luxury flats for foreign investors’
-

 Crypto World5 days ago
Russia Pushes Bill to Criminalize Unregistered Crypto Services
-

 Politics2 days ago
Gary Stevenson delivers timely reminder to register to vote as deadline TODAY
-

 Tech3 days ago
Auto Enthusiast Scores Running Tesla Model 3 for Two Grand and Turns It Into Bare-Bones Go-Kart
-

 Tech6 days ago
‘Avatar: Aang, The Last Airbender’ Leaked Online. Some Fans Say Paramount Deserves the Fallout
-
 Business6 days ago
Creo Medical agree sale of its manufacturing operation
-

 Business2 hours ago
Rolls-Royce Voted UK’s Most Iconic Trade Mark as IPO Register Hits 150
-

 Crypto World5 days ago
Russia Introduces Bill To Criminalize Unregistered Crypto Services
-
 Crypto World3 days ago
Kelp DAO rsETH Bridge Hack Drains $292M as DeFi Losses Top $600M in Two Weeks
-

 Sports6 days ago
British climbers complete new route in Swiss Alps
-

 Tech6 days ago
Ford EV and tech chief leaving automaker
-

 Sports6 days ago
“Felt Much Better Today”: Josh Hazlewood Opens Up On His Recovery Win Over LSG
-

 Entertainment7 days ago
Ruby Rose Accuses Katy Perry Of Sexual Assault, Police React
-

 Business6 days ago
Cheaper Doritos and Lays helps PepsiCo win back struggling snackers
-
 Entertainment6 days ago
Clavicular Says Streaming May Not Work Without Substances
You must be logged in to post a comment Login