
Crypto World
Bitcoin tops $81K as ETF inflows and sentiment recovery signal potential push toward $90K


Key takeaways
- Bitcoin briefly topped the $81,000 mark on Tuesday, the highest level in three months.
- Crypto sentiment improves, with inflows into US-listed spot ETFs totaling $154 million last week.
Bitcoin (BTC) is hovering just below the $81,000 mark on Tuesday after adding 1% to its value in the last 24 hours.
The broader crypto market remains constructive, with Ethereum (ETH) and XRP (Ripple) posting mild gains, reflecting a steady improvement in overall sentiment.
Sentiment improves as capital flows return
Market confidence is gradually recovering, supported by rising inflows into digital asset investment products. The Crypto Fear & Greed Index has climbed to 47 from 29 a day earlier — a sharp rebound, though still within the “fear” zone. Notably, this marks a significant improvement from last month’s average of 11, which signaled extreme fear.
If this upward trend continues, it could reinforce expectations for Bitcoin to reclaim $80,000 as support and potentially grind higher toward the $90,000 level.
Spot Bitcoin ETFs recorded their fifth consecutive week of inflows, adding $154 million through Friday. While this is down from the prior week’s $824 million, the data still highlights sustained investor appetite for crypto exposure — even amid geopolitical tensions such as the ongoing US–Iran situation.
Cumulative ETF inflows now stand at $58.72 billion, with assets under management averaging $103.78 billion, underscoring persistent institutional demand.
Bitcoin’s recent move above $81,000 triggered notable liquidations. Short positions took the largest hit, with approximately $138 million wiped out, compared to around $46 million in long liquidations.
Bitcoin eyes the $90k psychological level
The BTC/USD 4-hour chart is bullish and efficient as Bitcoin is trading above $80,800. While the price has reclaimed this long-term support, it remains capped below the 100-week EMA at $82,352, and the 50-week EMA at $85,777These levels continue to act as key resistance zones, limiting a full bullish breakout for now.
Momentum indicators suggest a market in recovery mode. The RSI on the daily chart sits near 48, close to neutral territory, while the MACD remains positive, signaling improving — but not dominant — bullish momentum.

If the rally persists, key resistance levels to watch include $82,352 (100-week EMA) and $85,777 (50-week EMA).
However, if the bears regain control, key support levels would be seen at $68,061 (200-week EMA) and $65,981 (trendline level).
A sustained weekly close above the upper resistance band would be needed to confirm a stronger medium-term bullish shift.


Quick Summary
- First quarter adjusted earnings per share of 55 cents exceeded analyst expectations of 48 cents
- Revenue reached $1.68 billion, marginally surpassing the $1.67 billion consensus forecast
- Annual EPS outlook upgraded to $2.35–$2.40 range, previously $2.25–$2.30
- Company initiating $275 million accelerated stock buyback program
- Approximately 1% pricing adjustment implemented to counter elevated input costs from Iran situation
Shares of DuPont (DD) advanced 1.6% to $46.15 during premarket hours on Tuesday following the specialty materials corporation’s announcement of first-quarter results that surpassed analyst projections and an improved annual forecast.
The company reported adjusted earnings per share of 55 cents, comfortably exceeding the FactSet consensus estimate of 48 cents. Revenue climbed to $1.68 billion from $1.61 billion in the year-ago period, narrowly topping the $1.67 billion analyst forecast.
On a GAAP basis, DuPont recorded net income of $161 million, translating to 39 cents per share, a significant reversal from the $589 million loss, or $1.40 per share, reported in the comparable quarter of the previous year.
[[LINK_START_3]]https://twitter.com/Finsee_main/status/2051612567613645120?s=20[[LINK_END_3]]
It’s important to recognize that year-over-year comparisons require context. The company completed the separation of its electronics division, Qnity Electronics, which impacts historical comparisons.
Additionally, the first quarter results incorporate a three-cent-per-share benefit from discontinued operations associated with the sale of the Aramids business, which was finalized on April 1.
Company Elevates Annual Forecast
Management increased its full-year adjusted earnings per share guidance to a range of $2.35 to $2.40, up from the previous $2.25 to $2.30 projection. Revenue expectations were similarly lifted to $7.16–$7.22 billion from the prior $7.08–$7.14 billion range.
These updated targets exceed current Wall Street expectations, which call for $2.27 per share in earnings on $7.10 billion in revenue.
For the second quarter, the company projects adjusted EPS of approximately 59 cents on revenue of roughly $1.8 billion. This aligns closely with analyst expectations of 58 cents per share on $1.8 billion in sales.
Chief Executive Lori Koch emphasized organic revenue growth, improved profit margins, and double-digit adjusted earnings expansion as key achievements during the quarter. Chief Financial Officer Antonella Franzen explained that the revised annual outlook incorporates approximately 4% organic growth, including about 1% from pricing actions designed to mitigate increased input costs stemming from the Iranian conflict.
Capital Allocation and Divisional Results
The company unveiled plans for a $275 million accelerated share repurchase program commencing immediately. This initiative is part of a comprehensive $2 billion buyback authorization granted by the board in November, which featured an initial $500 million accelerated component.
From a segment perspective, the Healthcare & Water Technologies division delivered 6% year-over-year sales growth, accompanied by a 1.1 percentage point expansion in operating margins. The Diversified Industrials segment achieved 3% revenue growth, likewise recording a 1.1 percentage point improvement in profitability.
DD shares had declined approximately 9% since the outbreak of the Iran conflict on February 28, as market participants assessed the impact of elevated oil prices on production costs. Prior to Tuesday’s trading, the stock remained up 13% year-to-date and had appreciated 66% over the trailing twelve-month period.
The second quarter projection of 59 cents in adjusted earnings per share on $1.8 billion in sales represents the company’s latest near-term guidance.

CoinDesk Indices presents its daily market update, highlighting the performance of leaders and laggards in the CoinDesk 20 Index.
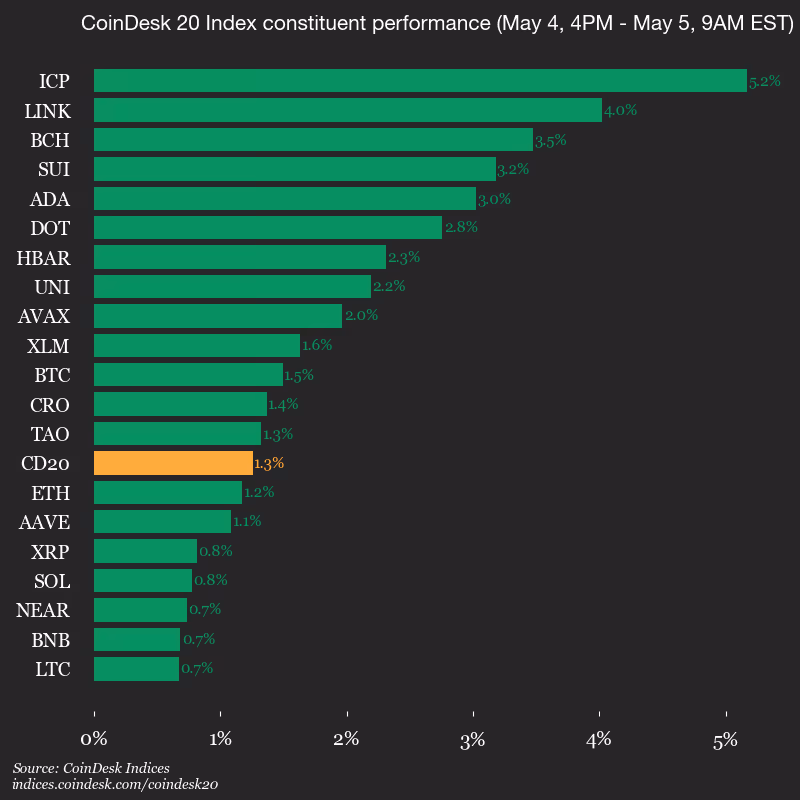
The CoinDesk 20 is currently trading at 2154.22, up 1.3% (+26.68) since yesterday’s close.
All 20 assets are trading higher.

Leaders: ICP (+5.2%) and LINK (+4.0%).
Laggards: LTC (+0.7%) and BNB (+0.7%).
The CoinDesk 20 is a broad-based index traded on multiple platforms in several regions globally.
Crypto World
Cardano Just Added Institutional-Grade Compliance Tools: Is This News the Missing Piece for ADA Adoption?
Cardano completed an integration with Scorechain’s blockchain analytics platform, deploying institutional-grade compliance tools, risk scoring, and transaction monitoring built specifically around Cardano’s UTXO model. This is bullish news for cardano.
For regulated entities that have been hesitant to touch ADA, this removes a genuine friction point.
The move is bullish by most reads, addressing compliance hurdles that have historically slowed institutional adoption.
Meanwhile, the Van Rossem hard fork (Protocol Version 11) and the Leios upgrade targeting 1,000+ TPS by end-2026 remain the ecosystem’s headline catalysts.
With Bitcoin holding above $80,000 and total market cap above $2.43 trillion, the macro backdrop isn’t the problem here.
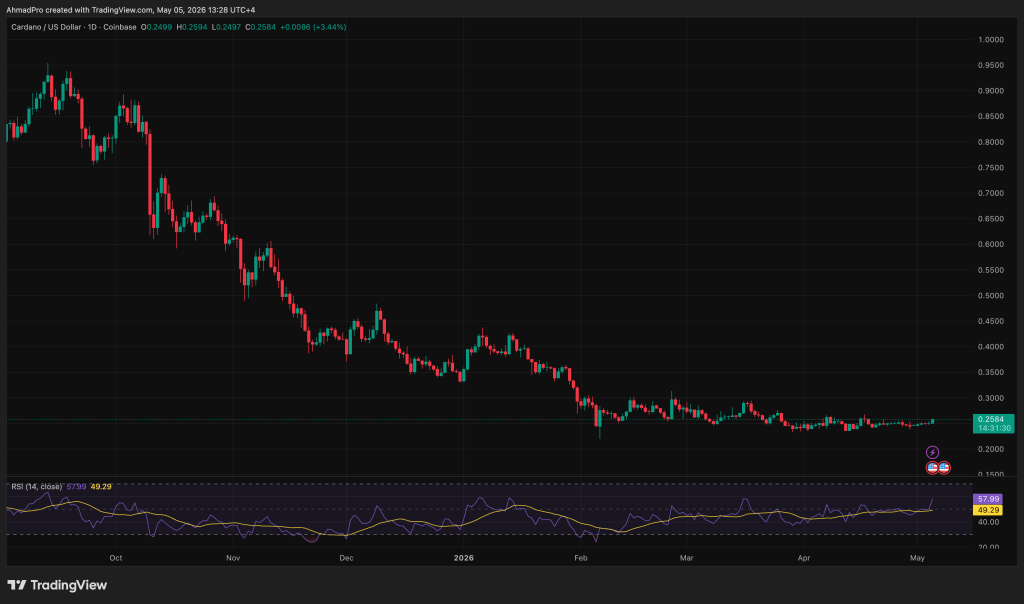
Can Cardano Price Break $0.28 This Week?
ADA is stuck in a tight range between $0.24–$0.25, and right now, it is just noise inside that band.
$0.26 is the first trigger. Reclaim that with volume, and ADA has a shot at breaking the descending trendline near $0.28, which then opens the move toward $0.30.

On the downside, $0.23 is the line to hold. Lose that, and the structure turns bearish fast, with room toward $0.22 and lower.
The derivatives picture leans cautious. Rising shorts with declining open interest suggest traders are not positioning for a breakout yet.
Most likely, for now, it keeps trading between $0.23 and $0.27 until a real catalyst emerges.
So the rule here is simple: bullish above $0.26, bearish below $0.23, everything in between is just chop.
LiquidChain Could Replace Cardano This Bull Cycle
ADA grinding sideways is the trade-off of scale. The fundamentals can look fine, but without a catalyst, the price can sit for weeks, and even the upside targets stay relatively modest.
That is why some traders start looking earlier in the cycle, where price discovery has not happened yet, and the upside is not capped by market cap.
LiquidChain is aiming at that space, focusing on cross-chain liquidity by connecting Bitcoin, Ethereum, and Solana into a single execution layer. The goal is to remove fragmentation so developers and users can interact across ecosystems without rebuilding or bridging complexity.

The presale is around $0.01456 with just over $718K raised, which puts it in an early stage where interest is building, but the asset is not fully priced.
But it is still unproven. Execution, adoption, and liquidity after launch are all unknowns, which is the trade-off with early-stage infrastructure.
So the contrast is clear, ADA offers a more established but slower-moving setup, while something like LiquidChain offers earlier positioning with higher potential, but also higher risk.
The post Cardano Just Added Institutional-Grade Compliance Tools: Is This News the Missing Piece for ADA Adoption? appeared first on Cryptonews.

GameStop submitted a non-binding $55.5 billion offer to acquire eBay at $125 per share on Sunday, proposing to fund the deal with $9.4 billion in cash and liquid investments plus up to $20 billion in financing backed by TD Securities.
The bid represents a 46% premium to eBay’s share price from early February, when GameStop began quietly building a 5% economic stake through shares and derivatives.
GameStop CEO says he's making an offer to buy eBay for $56B — Culture Crave
“There is nobody who is more qualified, based on my experience, to run the eBay business"
He’d be borrowing over $20B to help make the deal happen
(via @WSJ) pic.twitter.com/20LtVo6vbe
 (@CultureCrave) May 4, 2026
Now the crypto market has a single question: what happens to the $368 million Bitcoin treasury sitting on GameStop’s balance sheet?
CEO Ryan Cohen called the acquisition plan “way more compelling than bitcoin” and left the door open to selling the company’s BTC holdings to help finance the deal. That framing alone moved the conversation from corporate novelty to live market event.
Bitcoin is trading near $81,000, meaning GameStop’s 4,709 BTC position carries meaningful liquidation value, and meaningful sell pressure if Cohen pulls the trigger.

Discover: The best crypto to diversify your portfolio with
Should GameStop Liquidate Its $368M Bitcoin to Fund the eBay Deal?
GameStop’s $55.5 billion M&A bid dwarfs its current balance sheet, even with $9.4 billion in cash and a $20 billion financing commitment; the math is tight. Cohen explicitly described the eBay acquisition as a higher-priority capital deployment than bitcoin, and he confirmed GameStop has the “ability to issue stock in order to get the deal done.” If stock issuance proves insufficient or dilutive, the $368 million Bitcoin treasury becomes an obvious funding lever.
At current BTC prices, liquidating the full position would add roughly $368 million in cash, big but not big enough for a $55.5 billion transaction. The supply-side impact on Bitcoin markets would be limited in isolation, but the signal would carry weight: a company that adopted a Bitcoin Treasury reserve less than 18 months ago abandoning the position under M&A pressure is not a bullish corporate narrative.
GameStop shifted 4,709 BTC to Coinbase Prime as part of a covered call options strategy, generating income while retaining exposure. That is not the behavior of a company planning to dump.
If the eBay deal closes and the combined entity retains the BTC position, GameStop-eBay would control a Bitcoin treasury sitting alongside 135 million active buyers across 190 markets and nearly $80 billion in annual gross merchandise volume. Analysts have flagged this scenario as one that “could open the door for BTC payments integration” at serious scale.
Discover: The best pre-launch token sales
The post GameStop GME Eyes $55.5B eBay Takeover: $368M Bitcoin Treasury in Danger? appeared first on Cryptonews.


State Street Investment Management and Galaxy Asset Management (GLXY) have launched a tokenized fund designed to move a core piece of finance — cash management — onto blockchain networks, the firms said Tuesday.
The State Street Galaxy Onchain Liquidity Sweep Fund, trading under the ticker SWEEP, allows large investors to park stablecoins into a fund that generates yield, while keeping the ability to move in and out at any time. Unlike traditional money market funds that operate during market hours, the new structure runs continuously on blockchain infrastructure.
The market for tokenized funds has grown quickly over the past year, led by products like BlackRock’s BUIDL, which packages short-term U.S. Treasury exposure into a blockchain-based token. BUIDL has attracted billions of dollars, signaling that institutions are willing to hold tokenized versions of familiar instruments when the structure meets compliance and liquidity needs.
Other firms, including Franklin Templeton and now State Street with SWEEP, are building similar products, each experimenting with different blockchains and investor access models.
SWEEP launches on the Solana (SOL) blockchain, with plans to expand to Ethereum (ETH) and Stellar (XLM). Galaxy provides the underlying tokenization system, while Anchorage handles custody of digital assets and State Street oversees traditional securities held in the portfolio.
The move reflects a broader shift among large financial firms exploring how blockchain can update market plumbing. Today, moving cash between accounts or funds often involves delays, cut-off times and intermediaries. A blockchain-based system can, in theory, allow money to move instantly and around the clock.
The launch also deepens ties between State Street and Galaxy, which have worked together on digital asset investment products since 2024.
For State Street, which manages more than $5 trillion in assets, the fund signals a step toward offering traditional investment products in tokenized form. For Galaxy, it reinforces its push to build infrastructure that connects crypto markets with institutional finance.
Access to the fund is limited to qualified institutional investors, underscoring that, for now, the shift to onchain finance remains focused on large players rather than retail users.

Innovation City, a Ras Al Khaimah free zone focused on artificial intelligence and Web3, has unveiled what it calls the first blockchain-based digital business identity system. In a Monday release shared with Cointelegraph, the city said every company registered there will receive a sovereign, cryptographically verifiable identity issued on OPN Chain, the public blockchain infrastructure developed by UAE-based IOPn.
The release frames the initiative as converting a traditional business license from a static document into a dynamic on-chain asset, designed to reduce reliance on central intermediaries and to cut verification uncertainty across the free zone’s ecosystem.
The move aligns with a broader UAE push to replace traditional registries with blockchain-based identity systems and AI-driven workflows, a policy direction proponents say could streamline verification and digital operations for businesses operating in the United Arab Emirates.
Key takeaways
- Innovation City will issue on-chain, cryptographically verifiable business identities to its registered firms via the OPN Chain, covering more than 1,000 companies at launch.
- The onchain identity is intended as the native business registration primitive within the free zone, not merely an optional credential layered onto a traditional registry.
- OPN Chain uses a public validator network and a hybrid data model that stores core transaction data and proofs on-chain while handling sensitive or large datasets off-chain.
- The project emphasizes security through human-in-the-loop authorization for consequential actions and designs the agent layer with adversarial scenarios as a first principle.
- External adoption remains uncertain, with no specific banks, regulators, or exchanges named as current validators or acceptors of these onchain identities; questions persist about dispute handling and credential revocation when third parties are involved.
How the onchain business IDs work
Jimi Ibrahim, co-founder and chief operating officer of IOPn, told Cointelegraph that at launch the onchain identity framework is intended to extend across Innovation City’s client base of more than 1,000 companies, with immediate live utility within the free zone’s own digital ecosystem.
He described the core value not merely as issuing a digital certificate but as establishing a cryptographically verifiable business identity to be used for access and verification across Innovation City’s touchpoints, such as the business center and selected ecosystem services, with plans to broaden to partner providers in technology, marketing and legal services over time.
OPN Chain is presented as a public network where validator participation is open to institutions, infrastructure partners and governance-approved node operators. The system uses a hybrid data model in which core transaction data and proofs stay on-chain while sensitive or large datasets are handled off-chain, balancing transparency with privacy concerns.
Company registration under this framework is described as the native primitive within the free zone rather than an optional overlay on top of a conventional registry, distinguishing it from some digital-ID schemes such as Estonia’s e-residency example.
AI security and geopolitical risks
Recent exploits have highlighted how AI agents can be socially engineered to authorize transfers from wallets they control, underscoring the fragility of autonomous workflows. Ibrahim emphasized that every agentic workflow built on these identities will require human oversight for consequential actions, and that the agent layer is designed with adversarial scenarios as a core consideration from the outset.
The timing of the launch also intersects with regional tensions and new attacks affecting the UAE. Within this broader context, observers note that UAE investors have continued to allocate capital toward AI infrastructure, software and crypto-related assets, even amid volatility, according to data cited by Cointelegraph from eToro. Deutsche Bank researchers have also argued that the conflict may spur demand for AI rather than derail it.
Regulatory and market backdrop in the Gulf
The initiative sits within a wider policy push in the United Arab Emirates to move away from traditional registries toward blockchain-based identities and AI-enabled workflows. Government and industry watchers see potential benefits in streamlined verification, faster onboarding and more seamless cross-service operations, though practical adoption will hinge on external actors — banks, regulators, and service providers — recognizing and validating onchain credentials.
That context is underscored by the absence of named external banks or regulators currently recognizing Innovation City’s onchain identities, leaving questions about interoperability and dispute resolution when third parties are involved. The launch also arrives as the UAE seeks to attract AI and crypto investment, a dynamic reflected in investor behavior and market commentary cited by industry observers.
Uncertainties and next steps for external adoption
Key questions remain around how these onchain identities will be verified by external institutions such as banks and regulatory bodies, and how disputes or credential revocations will be handled when third parties are involved. The immediate utility is clear within Innovation City’s own digital ecosystem, but external integration will determine whether the model can scale beyond the free zone and become a broader standard.
As Innovation City pilots this approach, the next chapters will reveal whether the wider Gulf region and international partners will adopt similar onchain business identity primitives, and how issues of governance, data privacy and cross-border interoperability are resolved.
Readers should watch whether banks and regulators begin recognizing these onchain IDs outside Innovation City and how revocation or dispute handling will work as adoption expands.

TLDR
- Nvidia shares are hovering near $198, reflecting a 6.9% decline across the last five trading days after struggling to maintain the $200 threshold
- Manufacturing partner Foxconn disclosed 30% year-over-year April revenue expansion, attributing growth to robust AI server demand
- Wall Street’s consensus price target stands at $269.82, suggesting approximately 35% potential gains from present trading levels
- The stock carries a forward price-to-earnings multiple of roughly 22x, significantly lower than AMD’s 40x+ valuation
- The company’s May 20 earnings release is approaching; 48 analysts maintain “Buy” ratings on the shares
Nvidia shares commenced Tuesday’s session at $198.51, marking a position approximately 6.9% beneath the level established five trading days earlier.
The chip giant’s shares escaped their $165–$195 consolidation zone last week amid semiconductor sector optimism, only to surrender those gains rapidly. The psychological $200 barrier continues to present challenges.
Market participants may need to exercise patience until May 20 — when Nvidia releases its quarterly results — before witnessing more definitive price movement.
“Nvidia’s current valuation appears reasonable, potentially even attractive,” observed Julian Koski, chief investment officer at New Age Alpha, highlighting the company’s impressive streak of 12 consecutive quarters delivering revenue expansion.
Foxconn, a critical Taiwanese manufacturing ally of Nvidia’s, provided encouraging signals Tuesday. The electronics manufacturer disclosed 30% April revenue growth versus the prior year, propelled by AI server systems and cloud networking hardware.
Foxconn indicated that “AI rack deployments should sustain their upward trajectory,” despite traditional tech hardware markets entering typical seasonal weakness.
This represents a significant indicator. Foxconn’s primary revenue generator has shifted to cloud and networking infrastructure — surpassing its longstanding reliance on Apple product assembly.
Valuation Metrics Compare Favorably Against Competitors
Trading at a forward earnings multiple hovering around 22x, Nvidia appears attractively priced relative to AMD, which commands a valuation exceeding 40x ahead of its quarterly report scheduled for Tuesday evening.
Analyst consensus points to an average price objective of $269.82 per FactSet data — representing roughly 35% appreciation potential from current price levels.
Among 54 Wall Street analysts monitored by MarketBeat, 48 assign “Buy” recommendations, four rate it “Strong Buy,” while only two maintain “Hold” positions. Zero sell ratings exist.
Morgan Stanley maintains a $260 price objective. Wolfe Research projects $275. New Street Research reduced its forecast from $307 to $275 while preserving its “Buy” stance.
Potential Challenges on the Horizon
Not every indicator points upward. CEO Jensen Huang conceded that Nvidia presently holds “zero market share in China,” a direct result of American export restrictions on cutting-edge semiconductor technology.
Additional concerns emerge around customer diversification efforts. Anthropic has reportedly entered discussions with chip newcomer Fractile, while Cerebras pursues public market listing plans — suggesting certain buyers are exploring alternative suppliers.
Regarding insider transactions, CFO Colette Kress divested 20,000 shares during March at $174.89, representing a 19.41% reduction in her stake. Board member John Dabiri similarly decreased his holdings that month.
Institutional capital, conversely, has flowed inward. PDS Planning expanded its Nvidia allocation by 3.5% during Q4. Multiple additional funds increased their positions throughout the third and fourth quarters.
Bernstein analysts characterized AI agent-driven semiconductor demand as escalating “off the charts,” with supply chains unable to satisfy requirements — a situation that directly reinforces Nvidia’s pricing authority.
Nvidia’s most recent quarterly disclosure, published February 25, revealed $1.62 earnings per share, exceeding analyst projections of $1.54. Revenue reached $68.13 billion, representing 73.2% year-over-year growth.
The semiconductor leader maintains a market capitalization of $4.82 trillion, a minimal debt-to-equity ratio of 0.05, and established a 12-month peak at $216.82.
Attention now shifts entirely toward May 20.

Introduction
Reimagining financial primitives in a trust-minimized world
Decentralized Finance (DeFi) represents one of the most ambitious attempts to reconstruct the global financial system from the ground up. Built primarily on blockchain networks like Ethereum, DeFi replaces centralized intermediaries—banks, brokers, and clearinghouses—with transparent, automated protocols governed by code.
Where traditional finance relies on institutions to enforce trust, DeFi relies on cryptography, consensus mechanisms, and smart contracts. The result is a parallel financial system that is open, programmable, and globally accessible—yet not without its own structural vulnerabilities.
Replacing Traditional Banking Primitives
At its core, finance is built on a few fundamental primitives: custody, lending, borrowing, trading, and settlement. DeFi reconstructs each of these using blockchain-based infrastructure.
Custody Without Banks
In traditional systems, financial institutions hold and manage assets on behalf of users. DeFi replaces this with self-custody through digital wallets. Users maintain direct control over their funds, secured by private keys rather than institutional guarantees.
This shift eliminates counterparty risk tied to custodians—but introduces a new responsibility: the user becomes their own bank. There is no recovery mechanism for lost keys, no customer support desk, and no safety net.
Programmable Lending and Borrowing
DeFi lending protocols, inspired by early innovations in the ecosystem, allow users to lend assets and earn interest, or borrow against collateral, without credit checks or intermediaries.
Smart contracts automatically enforce loan conditions:
- Collateral is locked on-chain
- Interest rates adjust dynamically based on supply and demand
- Liquidations occur instantly when collateral thresholds are breached
This system replaces the bureaucratic processes of traditional banking with algorithmic efficiency—but also removes human discretion, often leading to abrupt and unforgiving outcomes during volatility.
Decentralized Exchanges (DEXs)
Instead of relying on centralized exchanges to match buyers and sellers, DeFi uses liquidity pools governed by automated market makers (AMMs). These pools allow users to trade assets directly from their wallets.
Liquidity providers supply capital to these pools and earn fees from trading activity, effectively becoming micro-market makers. This democratizes participation in financial markets, but also exposes participants to risks such as impermanent loss and volatile fee structures.
Yield Generation Without Intermediaries
One of DeFi’s defining innovations is the ability to generate yield without traditional financial intermediaries. Yield farming, staking, and liquidity provision enable users to earn returns by actively participating in protocol ecosystems.
Unlike savings accounts in traditional banks—where interest rates are centrally determined—DeFi yields are:
- Market-driven
- Highly dynamic
- Often incentivized by token emissions
This creates opportunities for significantly higher returns, but also introduces complexity and instability. Yield is not generated solely by underlying economic productivity; in many cases, it is subsidized by speculative incentives, raising questions about sustainability.
Risks in a Permissionless System
Despite its promise, DeFi is not a frictionless utopia. Removing intermediaries does not eliminate risk—it redistributes and, in some cases, amplifies it.
Smart Contract Failure
Smart contracts are immutable once deployed. A flaw in the code can lead to catastrophic losses, as exploits can drain funds within seconds. Unlike traditional systems, there is no central authority to reverse transactions or compensate users.
Audits and formal verification reduce risk but cannot guarantee safety. The system’s integrity ultimately depends on the quality of its code.
Liquidity Crises
DeFi markets rely heavily on liquidity pools. In times of stress, liquidity can evaporate rapidly, leading to cascading liquidations and extreme price slippage.
Because many protocols are interconnected, a failure in one can trigger systemic effects across the ecosystem—mirroring, and sometimes exceeding, the contagion risks seen in traditional finance.
Human Greed and Speculation
While DeFi is powered by code, it is driven by human behavior. Speculative mania, herd mentality, and short-term profit seeking often dominate decision-making.
This has led to:
- Rug pulls and fraudulent projects
- Unsustainable yield schemes
- Rapid boom-and-bust cycles
The absence of regulation allows for innovation—but also creates an environment where bad actors can operate with minimal resistance.
Bitcoin: A Store of Value, Not a Financial System
No discussion of DeFi is complete without addressing Bitcoin, the first and most recognized blockchain asset.
Bitcoin was designed as a decentralized store of value and a peer-to-peer payment system. Its architecture prioritizes security, simplicity, and immutability over programmability. As a result, it does not natively support the complex smart contracts required for DeFi applications.
This creates a fundamental distinction:
- Bitcoin functions as “digital gold.”
- DeFi operates as a programmable financial layer.
Efforts have been made to bridge Bitcoin into DeFi ecosystems through wrapped assets and sidechains, but these solutions often introduce additional trust assumptions—ironically reintroducing intermediaries that DeFi seeks to eliminate.
In this sense, Bitcoin sits adjacent to DeFi rather than fully within it: a foundational asset that provides value storage, but not the infrastructure for financial experimentation.
Conclusion
DeFi represents a radical rethinking of financial systems—one that replaces institutional trust with transparent, autonomous code. It reconstructs lending, borrowing, and trading into permissionless protocols that operate without centralized control.
Yet this transformation comes with trade-offs. Efficiency replaces oversight, automation replaces discretion, and accessibility replaces protection. The risks—technical, systemic, and behavioral—are not eliminated but reshaped.
The future of finance may not lie in the complete replacement of traditional systems, but in the convergence of both models: combining the resilience and innovation of DeFi with the safeguards and stability of established institutions.
For now, DeFi remains an evolving experiment—one that is simultaneously rebuilding finance and stress-testing the limits of decentralization.
REQUEST AN ARTICLE


Toncoin (TON) is rallying as messaging app Telegram takes a more direct role in the token’s parent network and pushes for lower transaction costs, a shift that seems to be driving the move.
TON has rallied more than 36% in the past 24 hours, hitting a four-month high of $1.80, according to data from CoinDesk. It is the native token of The Open Network, a Layer 1 blockchain designed to integrate crypto payments and applications within the Telegram messaging platform.
The bullish sentiment has spread across the Telegram-linked ecosystem, with Notcoin gaining nearly 26%, Dogs rising more than 100%, and several smaller TON-based tokens posting even larger daily moves.
The market seems to be reacting to Telegram’s decision to replace the Ton Foundation as the driving force behind TON.
In an X post on Monday, Telegram founder Pavel Durov said that the messaging platform would become TON’s largest validator and take over as the driving force behind the ecosystem, with new developer tools, performance upgrades, and a refreshed ton.org expected within two to three weeks.
A validator is a specialized node or participant responsible for verifying transactions, ensuring network security, and maintaining the accuracy of a blockchain.
Becoming the largest validator is indicative of Telegram’s willingness to put its own weight behind the chain’s security and direction. This likely reduces one of TON’s biggest overhangs, namely the gap between the Telegram narrative and TON Foundation’s execution.
The story doesn’t end there. In the same X post, Durov said TON fees have fallen sixfold to near zero, after previously announcing that transaction costs would drop to 0.00039 TON, or about $0.0005, with most transactions eventually moving toward a fee-less model.
Fees in TON have dropped 6× — to nearly zero.
Next step — Telegram replaces the TON Foundation as the driving force behind TON and becomes its largest validator.
The focus shifts to tech superiority.
New https://t.co/Me0w683UiK, new dev tools, new performance upgrades.…
— Pavel Durov (@durov) May 4, 2026
Near-zero transaction costs matter most for the kinds of products Telegram can actually distribute, such as on-chain tips, games, bot payments, mini-app transactions, collectibles, and small retail transfers.
A fee that looks irrelevant to a DeFi whale can still kill a consumer app if users are moving cents or dollars at a time. Fixed, tiny costs make TON more usable for high-frequency, low-value activity, broadening its appeal as a blockchain among existing users.
Various tracking sites put Telegram’s estimated monthly users at as much as one billion, though the company has not publicly claimed or denied those figures.
But TON’s fundamentals have failed to catch up to that hype in recent years. DefiLlama data shows TON captures just over $69 million in locked value across its decentralized finance (DeFi) applications, far below its 2024 highs near $800 million. Daily chain fees sit around $3,600, DEX volume around $29 million, and app revenue near $134,000.
Data from Tonstat shows shows daily active wallet activity on TON at just under 50,000, coming from around 136,000 unique wallets. That compares with roughly 700,000 daily activities across more than 2.2 million wallets during August and September 2024, according to the data.
Strategy stock heads into tonight’s Q1 earnings with the chart already breaking out of an inverse head and shoulders pattern in pre-market trade, up 47% from the February lows.
The options market has flipped from defensive to bullish. Analyst price targets keep rising. But volume concerns are showing up and a key technical line still caps the recovery. Additionally, Michael Saylor paused Bitcoin purchases into the print. The breakout is happening regardless. The question is whether tonight’s number lets it hold.
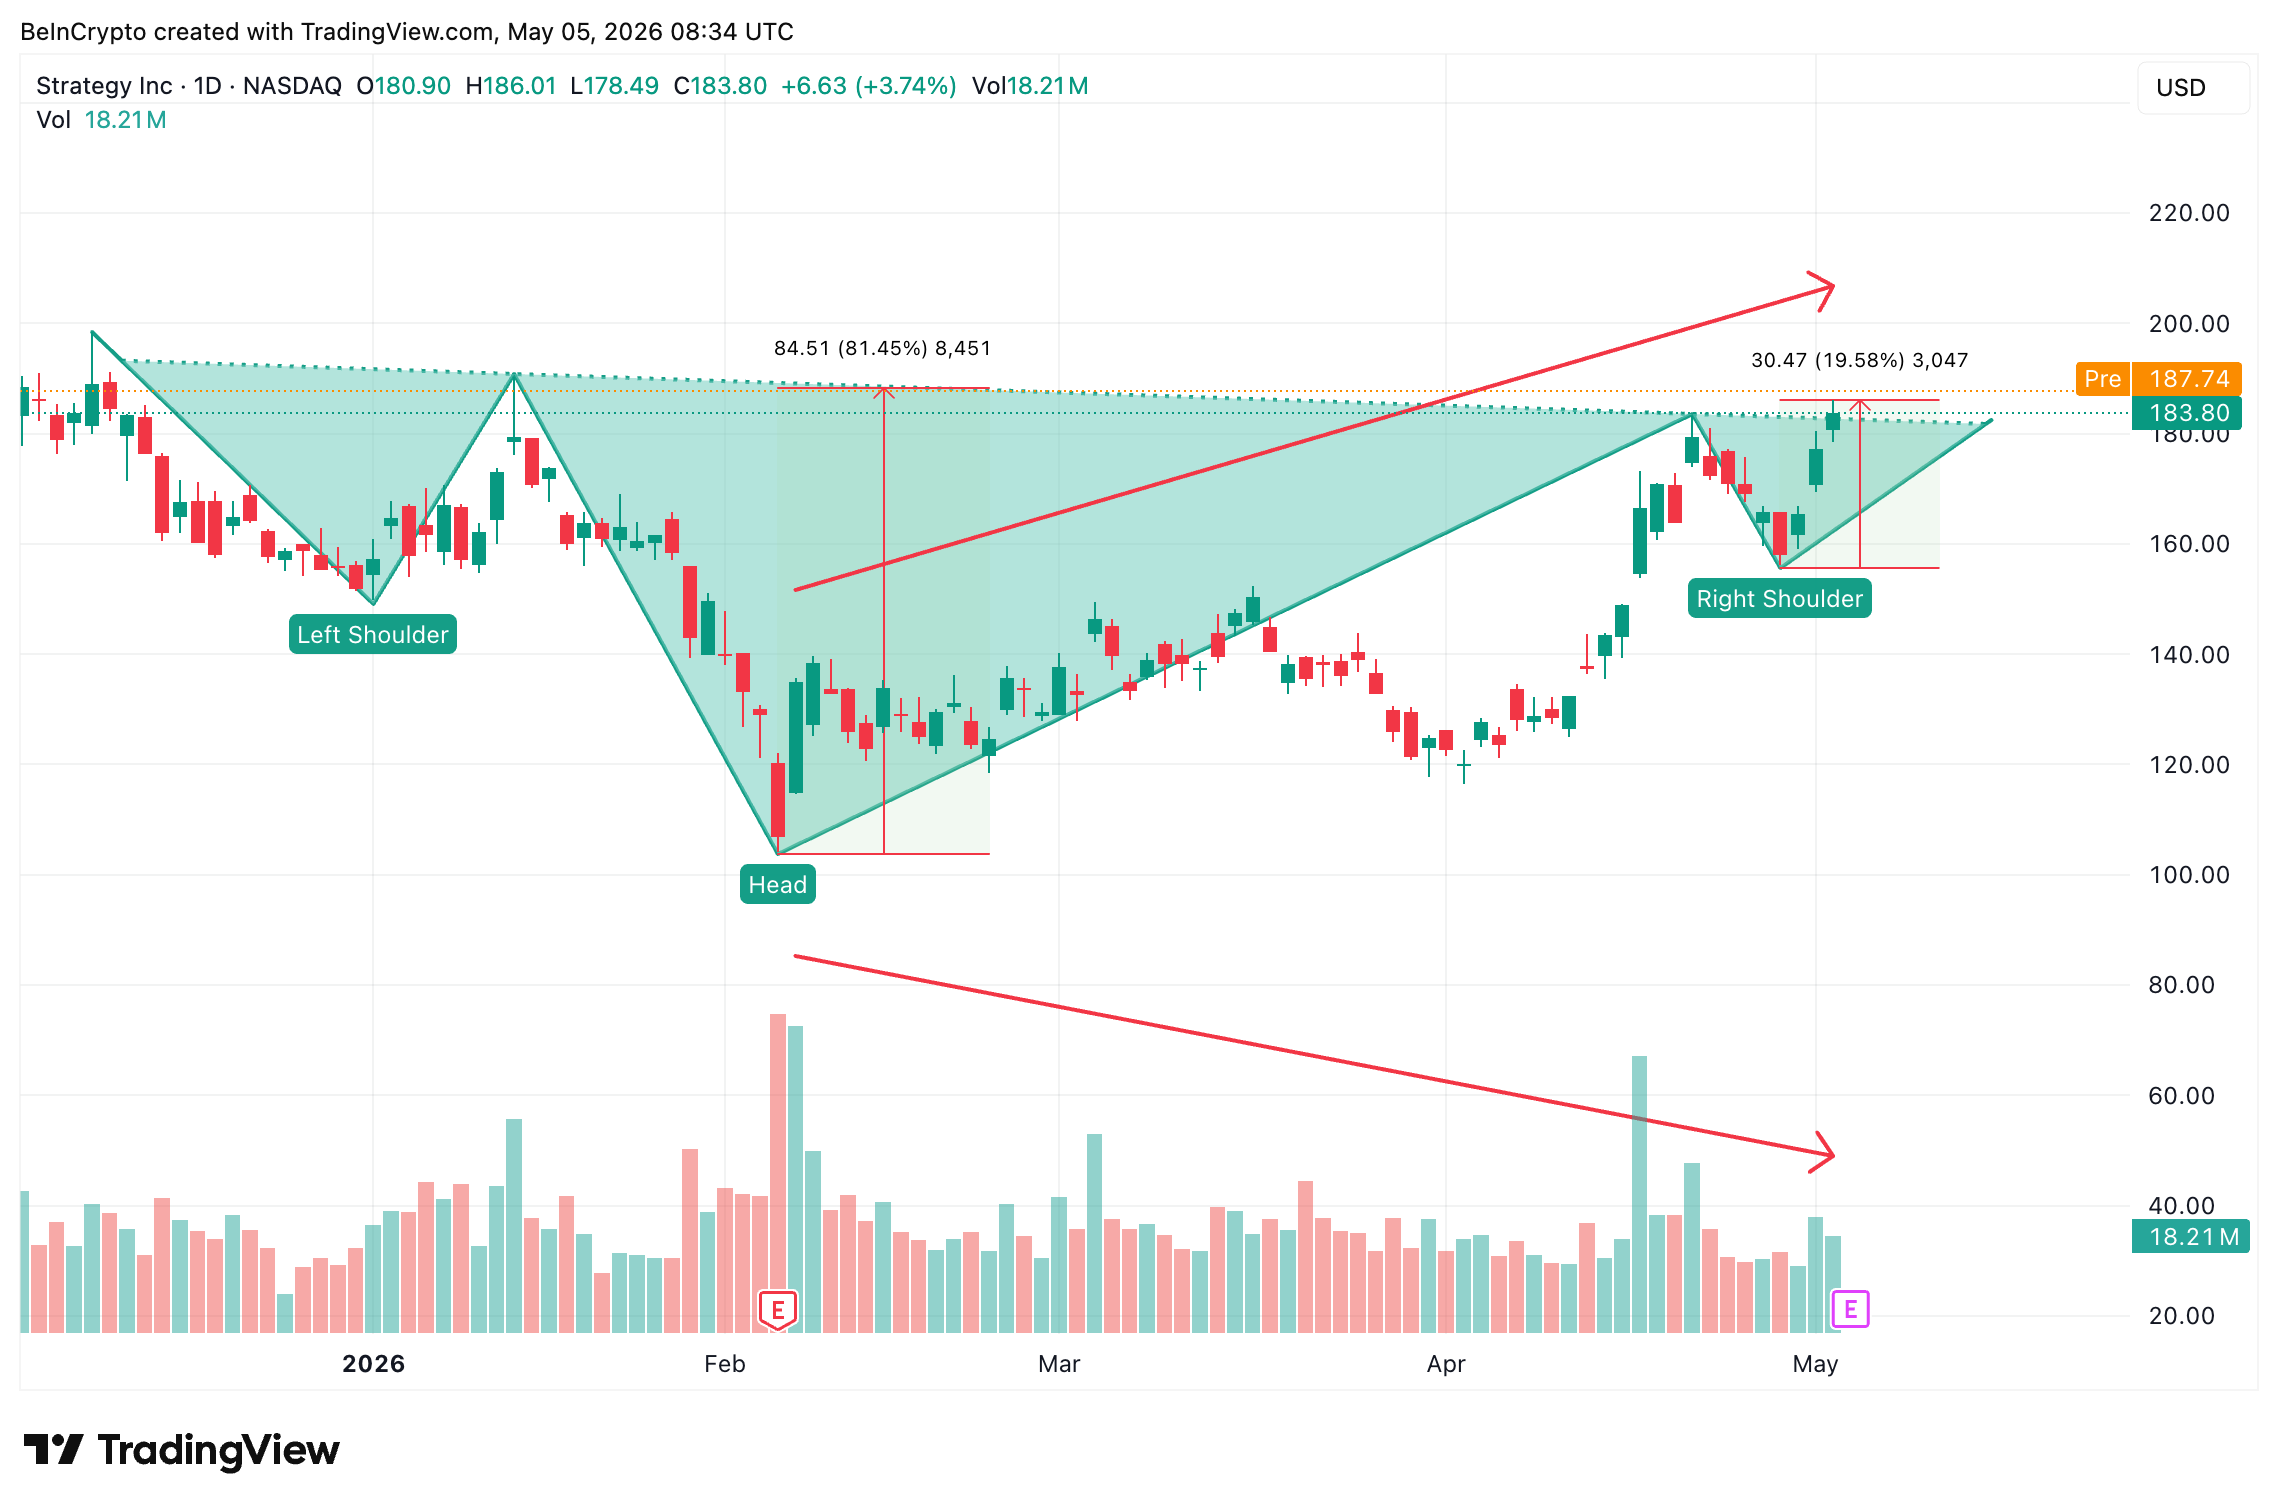
Strategy Stock Built an Inverse Head and Shoulders Off the February Lows
Strategy stock (NASDAQ: MSTR) has rallied roughly 47% since the company reported a $42.93 EPS loss on February 5, 2026, when Bitcoin’s price drop forced massive mark-to-market losses through the earnings line. The recovery from that low has formed a recognizable bullish reversal pattern, an inverse head-and-shoulders.
Want more insights like this? Sign up for Editor Harsh Notariya’s Daily Newsletter here.
The pattern’s neckline sits just slightly under the May 4 close. While it seems that the Strategy share price is almost above the neckline, at press time, a longish wick is hinting at exhaustion.

The setup is textbook bullish in structure. Inverse head and shoulders patterns historically resolve upward when the neckline breaks on rising volume, and the measured move from head depth to neckline gives an 80%+ price projection well above current levels.
The problem is volume.
Though the MSTR share price has trended higher between early February and early May, daily volume has trended lower rather than higher. Bullish reversal patterns require expanding volume to confirm participation. Strategy stock has the price structure but not the volume signature.
The pattern says one thing. The volume says something else. Tonight’s earnings reaction has to resolve which signal wins.
The Options Market and Analyst Action Show the Bull Case Is Already Priced In
The shift in options positioning between February’s earnings and tonight’s print captures how heavily the recovery is already discounted into Strategy share price.
On February 5, when Strategy stock closed at $106.99 ahead of the Q4 print, the put-call volume ratio sat at 1.66. Traders were positioning for downside, and the Q4 announcement validated that defensive stance with a $42.93 EPS miss.

Heading into tonight’s print, the put-call volume ratio has collapsed to 0.60 with the stock at $183.80. The same options market that anticipated the Q4 disaster is now positioned for the Q1 reversal. A volume ratio at 0.60 reflects far more call buying than put buying, a clean shift from defensive to offensive.

Options pricing has gotten expensive heading into the print, which signals that traders expect a sharp move in either direction. Implied volatility, a measure of how big a move options traders are betting on, sits at 74.42%.
Wall Street has been raising targets in lockstep. B. Riley raised its target from $188 to $200 on April 29 with a Buy reiteration. Cantor Fitzgerald raised its target from $192 to $212 on April 21 with a Buy reiteration.

The bull case rests on Bitcoin mark-to-market accounting. Strategy holds 818,334 BTC at an average cost of $75,537. With Bitcoin trading above $80,000, the unrealized gain sits near $3.7 billion. That gain reverses Q4’s mark-to-market loss directly through the Q1 earnings line.
But Michael Saylor paused Bitcoin purchases ahead of the print. The pause is unusual. Cash conservation, capital structure adjustments, or funding model strain are all possible reads. The options market and Wall Street say the rally is justified. Saylor’s pause says caution.
Strategy Stock Price Levels Define the Earnings Reaction
Strategy stock trades at $183.80, sitting at the neckline of the inverse head and shoulders pattern at $186.46. That neckline is the immediate test after tonight’s numbers.
While the volume divergence discussed earlier puts the neckline theory at risk, the looming EMA (exponential moving average) crossover, adds the bullish angle. An Exponential Moving Average (EMA) is a type of moving average that gives more weight to recent prices. Right now, the 20-day EMA line is closing in on the 100-day EMA line. That bullish trigger can push the MSTR stock price above the 200-day EMA line.

A clean break above the 200-day EMA exposes the 0.618 Fibonacci at $205.29, the 0.786 Fibonacci at $218.69, and the 1.0 Fibonacci at $235.77. At present the 0.786 Fib level is expected to offer the most resistance as it lies above the key analyst targets we just highlighted. The ultimate target, per pattern projection, sits at $338.91.
The downside levels show what failure looks like. A daily close below $186.46 invalidates the breakout attempt and pushes price back toward the 0.236 Fibonacci at $174.81.

The level math is binary. A confirmed neckline break above $186.46 opens the path toward $218.69 over the coming weeks. A close below $174.81 cracks the pattern. Tonight’s print decides which path the chart takes, starting Wednesday.
The post Strategy Stock Heads Into May With a Bullish Pattern and Q1 Earnings Catalyst appeared first on BeInCrypto.
New Historical Masterpiece Reveals One of the Best Trailers of 2026

BITCOIN $80K SQUEEZE: IT’S CONFIRMED (This is Next)!!! – Bitcoin News Today, Ethereum & Altcoins

Hollyoaks confirms staggering Sienna twist that changes everything | Soaps
Manchester United reach agreement with Casemiro over contract clause amid transfer speculation

US brings back mandatory military draft registration

Steven Gerrard disagrees with Gary Neville over ‘shock’ Chelsea and Arsenal claim | Football
BITCOIN $80K SQUEEZE: IT’S CONFIRMED (This is Next)!!! – Bitcoin News Today, Ethereum & Altcoins

#antique #money #antiquegold #reseller #gold #business #silver #fyp #ytshorts

3 Financial Milestones You Need To Hit Before 30
-

 Business7 days ago
Most Commercial Energy Audits Miss the Real Losses
-

 Fashion7 days ago
Kylie Jenner’s KHY Enters a New Era with ‘Born in LA’
-

 NewsBeat2 days ago
Channel 5 – All Creatures Great and Small series 7 new post
-
 Tech4 days ago
Trump’s 25% EU auto tariff breaches Turnberry Agreement that also covers semiconductors and digital trade
-
 Sports4 days ago
Paul Scholes issues Marcus Rashford reality check as agreement emerges over Man United star
-

 Business6 days ago
Barclay Brothers Avoid Bankruptcy: HSBC Drops High Court Petitions After IVA Deal
-
 Business6 days ago
Tesla Officially Registers Elon Musk’s Stock: What Investors Need to Know
-

 Tech7 days ago
Get Ready for More Brain-Scanning Consumer Gadgets
-

 Business5 days ago
Two Powerball Tickets Split $143 Million Jackpot in Indiana and Kansas
-

 Tech6 days ago
Texas Instruments made a new flagship graphing calculator: the TI-84 Evo
-
Business2 days ago
Winning Numbers Drawn as Jackpot Resets to $20 Million
-
 Crypto World5 days ago
CoreWeave (CRWV) Stock Climbs 8% Despite $45M Insider Share Dump
-
 Crypto World6 days ago
Securitize and Computershare Enable Tokenized Equity Issuance for Over 25,000 U.S.-Listed Stocks
-

 Entertainment5 days ago
Celebrities Who Are Attending the 2026 Met Gala Event
-

 Crypto World6 days ago
Gibraltar Proposes Tokenized Funds Regulation to Bolster Compliance
-

 Entertainment5 days ago
Insider Claims Reason Behind Key & Peele Split
-

 Entertainment4 days ago
Met Gala 2026 Rumored Guest List Is Turning Heads
-

 Business7 days ago
Alexandria Real Estate Equities, Inc. (ARE) Q1 2026 Earnings Call Transcript
-

 Fashion3 days ago
Mary J. Blige Vegas Residency Looks: Crystal-Embellished Fjolla Haxhismajli, Todd Fisher, and More!
-

 Crypto World6 days ago
Meta (META) starts stablecoin payout to creators in Circle’s USDC on Polygon, Solana via Stripe
You must be logged in to post a comment Login