

Crypto World
Ethereum News: Vitalik Buterin ‘Puts Skin in the Game’ with $113K Privacy Pools Transfer
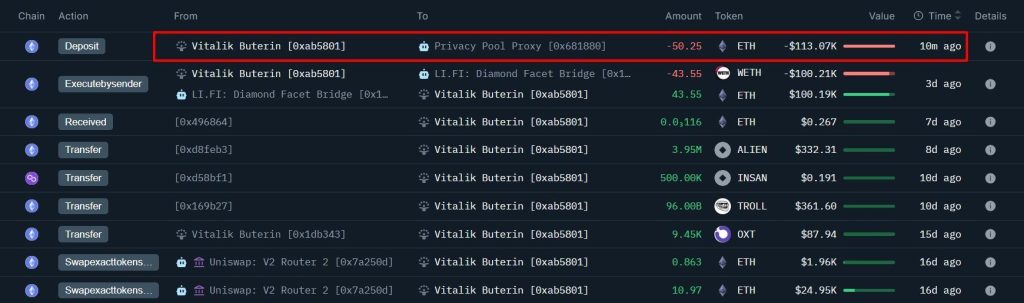
In the latest news, Ethereum co-founder Vitalik Buterin transferred 50.25 ETH, approximately $113,000 at current prices, through Privacy Pools, the compliance-aware privacy protocol he co-authored in a 2023 research paper, publicly validating the tool with real capital rather than white-paper advocacy.
The move comes weeks after 0xbow.io launched the protocol on Ethereum mainnet on March 31, 2025, positioning it as a regulatory bridge between user privacy and AML obligations. Buterin putting skin in the game is a signal, not a transaction.
Bullish signal for compliant privacy infrastructure on Ethereum.

The amount is deliberately modest relative to Buterin’s holdings; this is a functional demonstration and a public statement, not a liquidity event.
The central question the transaction raises is whether Privacy Pools can thread the needle that Tornado Cash could not: preserving meaningful Ethereum privacy while satisfying the on-chain security and regulatory standards that led to its predecessor’s sanction.
Discover: The best pre-launch token sales
How Privacy Pools Work Mechanically, and Why the Zero-Knowledge Architecture Changes the Compliance Calculus
The mechanism here is worth understanding precisely. Privacy Pools uses zero-knowledge proofs to allow a user to demonstrate that their withdrawal belongs to an approved “association set”, a curated subset of deposits filtered by off-chain analysis and encoded on-chain, without revealing which specific deposit was theirs. The user proves the fund’s cleanliness without surrendering their identity.
Those are not the same thing as full disclosure, and the distinction matters enormously for the regulatory argument.
Tornado Cash, sanctioned by OFAC in August 2022, offered no such selectivity. Every deposit was mixed indiscriminately, which meant honest users shared anonymity sets with wallets tied to North Korea’s Lazarus Group and other sanctioned actors, and regulators had no mechanism to distinguish between them. Privacy Pools encodes the distinction on-chain from the start.
@0xprivacypools v2 public testnet is now live! you can now make private transfers within the pool that don't reveal any details! @0xmikemcc, product lead at @0xbowio has been interviewed by @mdoorfard at @EthCC in Cannes. — coinix (@coin_ix) May 14, 2026
 Watch the interview on YouTube: https://t.co/vuk2hUdfcA pic.twitter.com/CorrQlkro1
The 0xbow implementation adds a semi-permissive operational layer: initial deposits are capped at 1 ETH per address, and the team retains the ability to pause new association sets if clear sanctions or AML issues emerge, while keeping withdrawals permissionless.
As of launch week, the protocol recorded more than 21 ETH across 69 individual deposits, including Buterin’s. The anonymity set is small but growing. The white paper argues that regulators could require users to produce proofs derived from “good” association sets rather than demanding full transaction histories, making compliance audits more targeted and less invasive than current surveillance-first approaches to Ethereum privacy.
Ethereum news: Why Buterin’s Privacy Pools Move Matters Beyond the $113K Transaction
The post-Tornado Cash landscape left Ethereum’s privacy infrastructure in an awkward position: the most widely used privacy tool was sanctioned, and no credible replacement existed.
Privacy Pools is the most architecturally serious attempt to fill that gap, and Buterin’s public use of it shifts it from a research proposal to a live, endorsed protocol in a single transaction.
The broader ecosystem context matters here. The CLARITY Act faces more than 100 amendments as legislators continue debating the regulatory perimeter around digital assets, including privacy tools. How Congress and OFAC ultimately treat selective-disclosure protocols will determine whether Privacy Pools becomes infrastructure or a footnote.
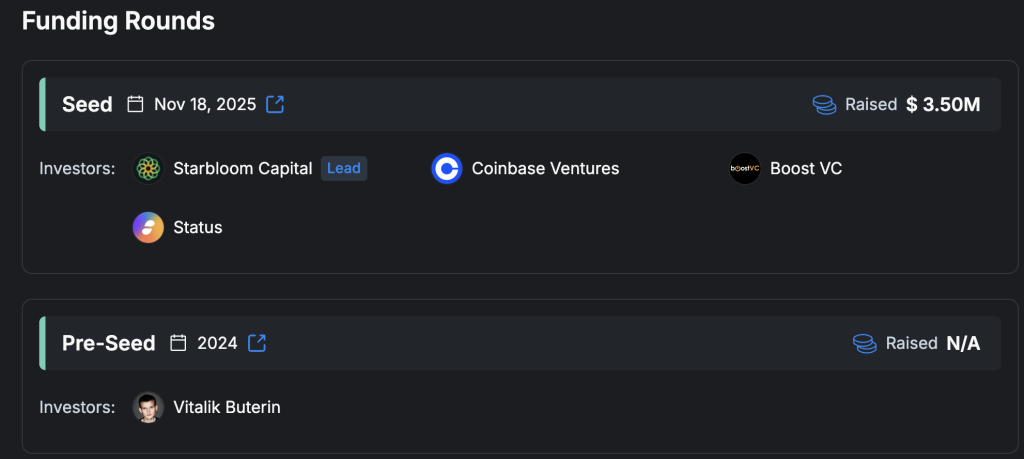
0xbow has backing from Number Group, BanklessVC, and Public Works, Coinbase Venture signaling VC conviction that regulation-friendly privacy is a distinct infrastructure category worth building toward.
The roadmap includes extending support for ERC-20 assets and integrating wallet and compliance dashboard tooling, which would dramatically expand the protocol’s reach beyond ETH-native users.
Meanwhile, Ethereum ecosystem activity continues to carry meaningful financial stakes for institutions watching on-chain developments closely.
If regulators treat Privacy Pools-style proofs as a valid compliance mechanism, the protocol becomes a template for the next generation of privacy tooling across DeFi.
If OFAC applies the same blanket logic it used against Tornado Cash, it forecloses the compliant privacy thesis entirely and pushes privacy tooling back underground. The cryptography is settled. The regulatory verdict is not.
Buterin’s 50.25 ETH transfer is the most credible public endorsement Privacy Pools has received. The association-set governance question is the variable that determines whether it survives regulatory scrutiny. That question runs directly through OFAC, and through whatever framework emerges from the current congressional markup.
Discover: The best crypto to diversify your portfolio with
The post Ethereum News: Vitalik Buterin ‘Puts Skin in the Game’ with $113K Privacy Pools Transfer appeared first on Cryptonews.


Polish lawmakers approved a government-backed bill Friday to bring the country’s crypto market under the European Union’s Markets in Crypto-Assets Regulation (MiCA) framework, after President Karol Nawrocki twice vetoed earlier versions.
The vote took place on Friday during the 57th sitting of the Sejm in Warsaw, where lawmakers adopted the legislation in a 241–200 decision, according to official parliamentary records.
Backed by the Ministry of Finance, the approved bill (No. 2529) designates the Polish Financial Supervision Authority (KNF) powers to oversee market participants, impose administrative sanctions and temporarily block accounts and transactions.
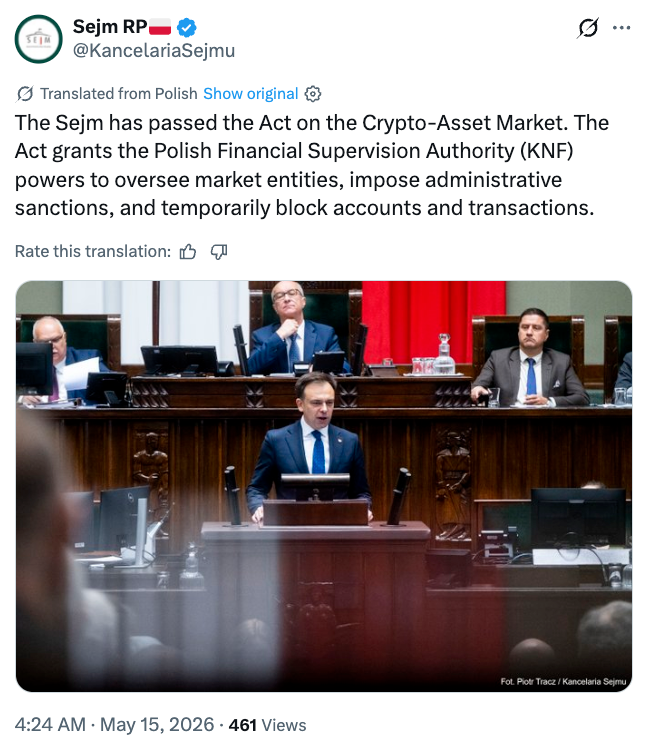
Source: Sejm RP
The vote marks the third attempt by the government to pass a crypto bill following two earlier presidential vetoes, with lawmakers favoring the state-backed approach over three competing draft bills.
Poland’s crypto regulation split: Four competing bills amid rising tensions
After Nawrocki vetoed two earlier government-backed crypto bills, lawmakers returned this week to a debate over four competing proposals.
Parliament’s latest vote was based on a consolidated committee text incorporating government bill 2529 alongside competing proposals from the president (No. 2528), Confederation (No. 2530), and a parliamentary draft (No. 2363), according to official records.
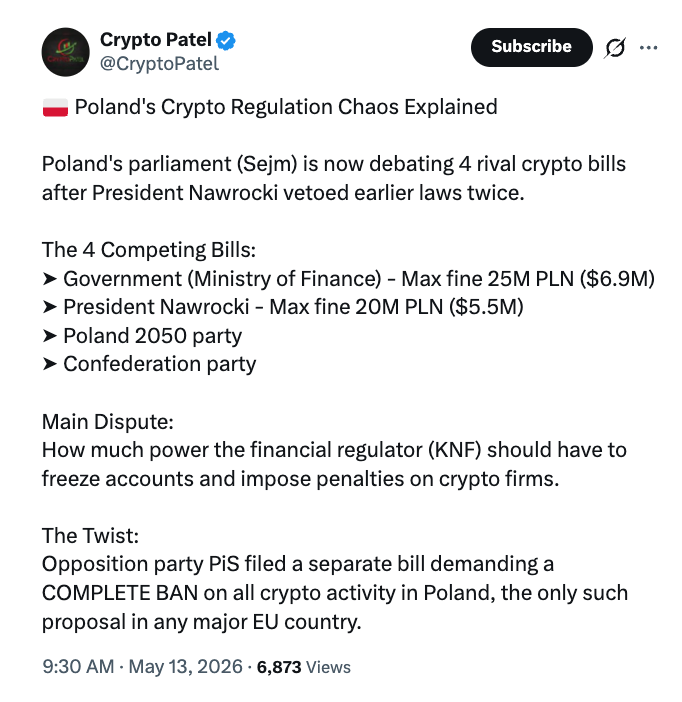
Source: Crypto Patel
The opposition Law and Justice party (PiS) also submitted a separate draft bill proposing a complete ban on all crypto-asset activity in Poland, according to local media.
Community expects another veto despite Zonda controversy
Market participants and crypto commentators reacted critically to the latest Sejm vote, with some expecting the president to veto the legislation again, as repeated parliamentary approvals have not resolved key disputes over supervisory powers and enforcement under KNF.
Critics highlighted ongoing concerns over account and domain blocking provisions, which they say remain largely unchanged despite earlier presidential objections, while proposed safeguards such as stronger judicial oversight were not included in the final text.
They warned that continued deadlock could prolong regulatory uncertainty as Poland aligns with the EU’s MiCA framework ahead of upcoming implementation deadlines in July.
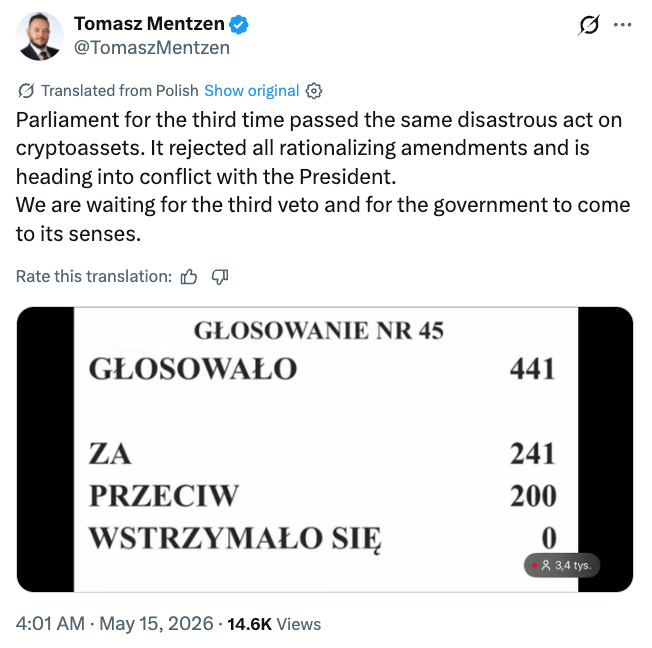
Source: Tomasz Mentzen
The latest debate has also been shaped by a deepening scandal around Zondacrypto, after prosecutors launched a fraud probe and thousands of users were reportedly unable to withdraw funds.
Related: Estonia’s FSA issues investor warning about Zondacrypto
The issue has entered Polish politics, with Prime Minister Donald Tusk alleging links between Zondacrypto and Russian capital and influence, citing its early history and later development under new ownership. Tusk also argued that the lack of a full investor protection framework delayed regulatory action, pointing to Poland’s repeated delays in aligning with the EU’s MiCA rules.
Magazine: How crypto laws changed in 2025 — and how they’ll change in 2026


- Zcash price fell to intraday lows of $532 after surging above $570.
- Over $5.1 million in Zcash futures positions were liquidated in the last 24 hours.
- Bullish case remains if buyers hold $500, but a breakdown could push ZEC toward $370.
Zcash (ZEC) fell back below the $550 level on Friday morning, trading near $530 as profit-taking emerged across the broader cryptocurrency market.
The pullback has coincided with elevated activity in derivatives markets, which analysts say suggests traders are still adjusting leverage and positioning following the token’s recent rally.
Zcash price drops below $550
Market data shows Zcash (ZEC) has declined over the past 24 hours, falling to intraday lows near $532.
The pullback follows a strong rally that pushed the token above $570 on Thursday, May 14.
The earlier gains came after The Wall Street Journal published an article comparing Bitcoin and Zcash, a development that Grayscale said “feels like one of those moments” that often precedes a surge in broader investor interest.
For $BTC, many early adopters trace their conviction to a single @WIRED piece in Nov 2011.
Today’s WSJ article on @Zcash $ZEC feels like one of those moments.
Grayscale Zcash Trust (Ticker: $ZCSH) is the only pure-play and publicly traded @Zcash $ZEC fund in the world.
Read…
— Grayscale (@Grayscale) May 14, 2026
While daily volume profiles show a modest decline, spot trading volume for Zcash (ZEC) remained near $256 million, while futures volume exceeded $2.7 billion.
The figures suggest speculative activity remains elevated. Data from CoinGlass shows that more than $5.1 million in Zcash futures positions were liquidated over the past 24 hours.
Despite the liquidations, open interest stands at about $978 million, although this is significantly lower than the $1.52 billion recorded on May 9.
Analysts say the decline points to traders continuing to reassess leverage and overall risk exposure.
Zcash price forecast
Price action over recent weeks saw ZEC climb to a high of $642, extending Zcash’s dramatic recovery from lows of $317 reached on April 29.
That relief rally followed deeper losses earlier in the year, when the privacy-focused token tested support near $185 as the crypto market sell-off intensified on Feb 5.
Thursday’s intraday dynamics illustrated the token’s sensitivity to momentum: a nearly 10% surge above $570 was later pared by a 4% decline from those intraday highs, culminating in the pullback under $550.

Despite the short-term pullback, the technical and fundamental picture remains bullish.
The recovery from April’s low and the subsequent climb toward the $640 area suggest investor interest in privacy coins.
Zcash’s recent progress on Quantum Recoverability is contributing to renewed attention.
If bulls defend the $500 level and broader market momentum persists, ZEC has a plausible path to revisit previous resistance above $700. Buyers may look to accumulate on dips.
However, failure to hold $500 could expose ZEC to a deeper correction.
A break below that pivot would likely open targets near $450, with a further decline toward $370 possible.
The sizable reduction in open interest from early May reduces the immediacy of a leveraged squeeze higher. But this leaves room for renewed volatility should traders re-enter with elevated positions.


The crypto exchange is also seeking fresh funding at a $20 billion valuation as it ramps up acquisitions and prepares for a public listing.
An imbalance in trading is a price zone where supply or demand heavily outweighs the opposite side, causing a sharp directional move with little trading in between. These zones sit at the heart of Smart Money Concept analysis. They shape how traders read momentum, structure, and entry points across forex and CFDs.
This article covers what drives imbalance in forex and CFDs and how it shows up on a chart. It walks through how an imbalance trading strategy may be built around price action, the link between an order flow imbalance and liquidity, and the difference between imbalance zones, fair value gaps, and order blocks.
What Is Imbalance in Trading?
Imbalance in trading is a price zone where buy or sell orders heavily outweigh the opposite side, causing a sharp directional move with little trading in between. This imbalance of orders can significantly influence asset prices, pushing them up or down. It’s a fundamental concept in forex, crypto*, commodity, and stock markets.
Three related terms appear often:
- Imbalance: any zone where one side of the order flow dominates and price displaces sharply.
- Fair value gap (FVG): a three-candle pattern where wicks of the outer candles fail to overlap.
- Liquidity void: a wider displacement zone, often spanning several candles, that may contain multiple FVGs.
A market imbalance occurs when there’s an overwhelming interest from buyers (buy-side imbalance) or sellers (sell-side imbalance) without enough opposite-side orders to match. These zones are read by retail traders as visible footprints of large activity. Institutional desks often cause the imbalance themselves through size-driven execution the order book cannot absorb on one side.
Imbalance zones in trading are critical components of the Smart Money Concept (SMC), a framework that focuses on understanding the actions of institutional investors. SMC proponents argue that by analysing where and how these imbalances occur, traders can align their strategies with those of the market’s most influential players. The rationale is that institutional movements, often the cause behind significant imbalances, have the power to drive market trends.
Types of Imbalance in Trading
Order imbalances in trading come in different forms depending on direction, structure, and timeframe. Knowing which type is in front of you may shape how the zone is read and what reaction is expected.
- Buy-side vs sell-side imbalance: a buy-side imbalance is a sharp upward move where aggressive buy orders overwhelm available supply, leaving a thin zone below that price may revisit. A sell-side imbalance is a sharp downward move, where heavy selling pressure creates an unfilled gap above as price drops quickly.
- Fair value gap vs volume imbalance: a fair value gap is a structural three-candle pattern, while a volume imbalance focuses on disparity in traded volume between bid and offer at a level. Both highlight inefficiency but rely on different inputs.
- Micro vs macro imbalance: micro imbalances appear on 1-minute and 5-minute charts and may resolve within a session. Macro imbalances sit on the daily or weekly chart and may take weeks or months to fill.
Higher-timeframe imbalances usually carry more weight than lower-timeframe ones. For deeper context on the wider zones, the FXOpen article on liquidity zones and liquidity voids covers the mechanics in more detail.
Fair Value Gaps vs Imbalance vs Order Blocks
Imbalances, fair value gaps (FVGs), and order blocks are related but not identical. They sit on a spectrum of the same idea: a market inefficiency that price may return to.
An imbalance is the broad category. A fair value gap in forex is one specific imbalance pattern. An order block is the cause behind many imbalances, not the imbalance itself. Traders often combine the three: a fair value gap that forms just after an order block, in line with the prevailing trend, may carry stronger confluence than any single element alone.
Why Imbalances Matter in Trading
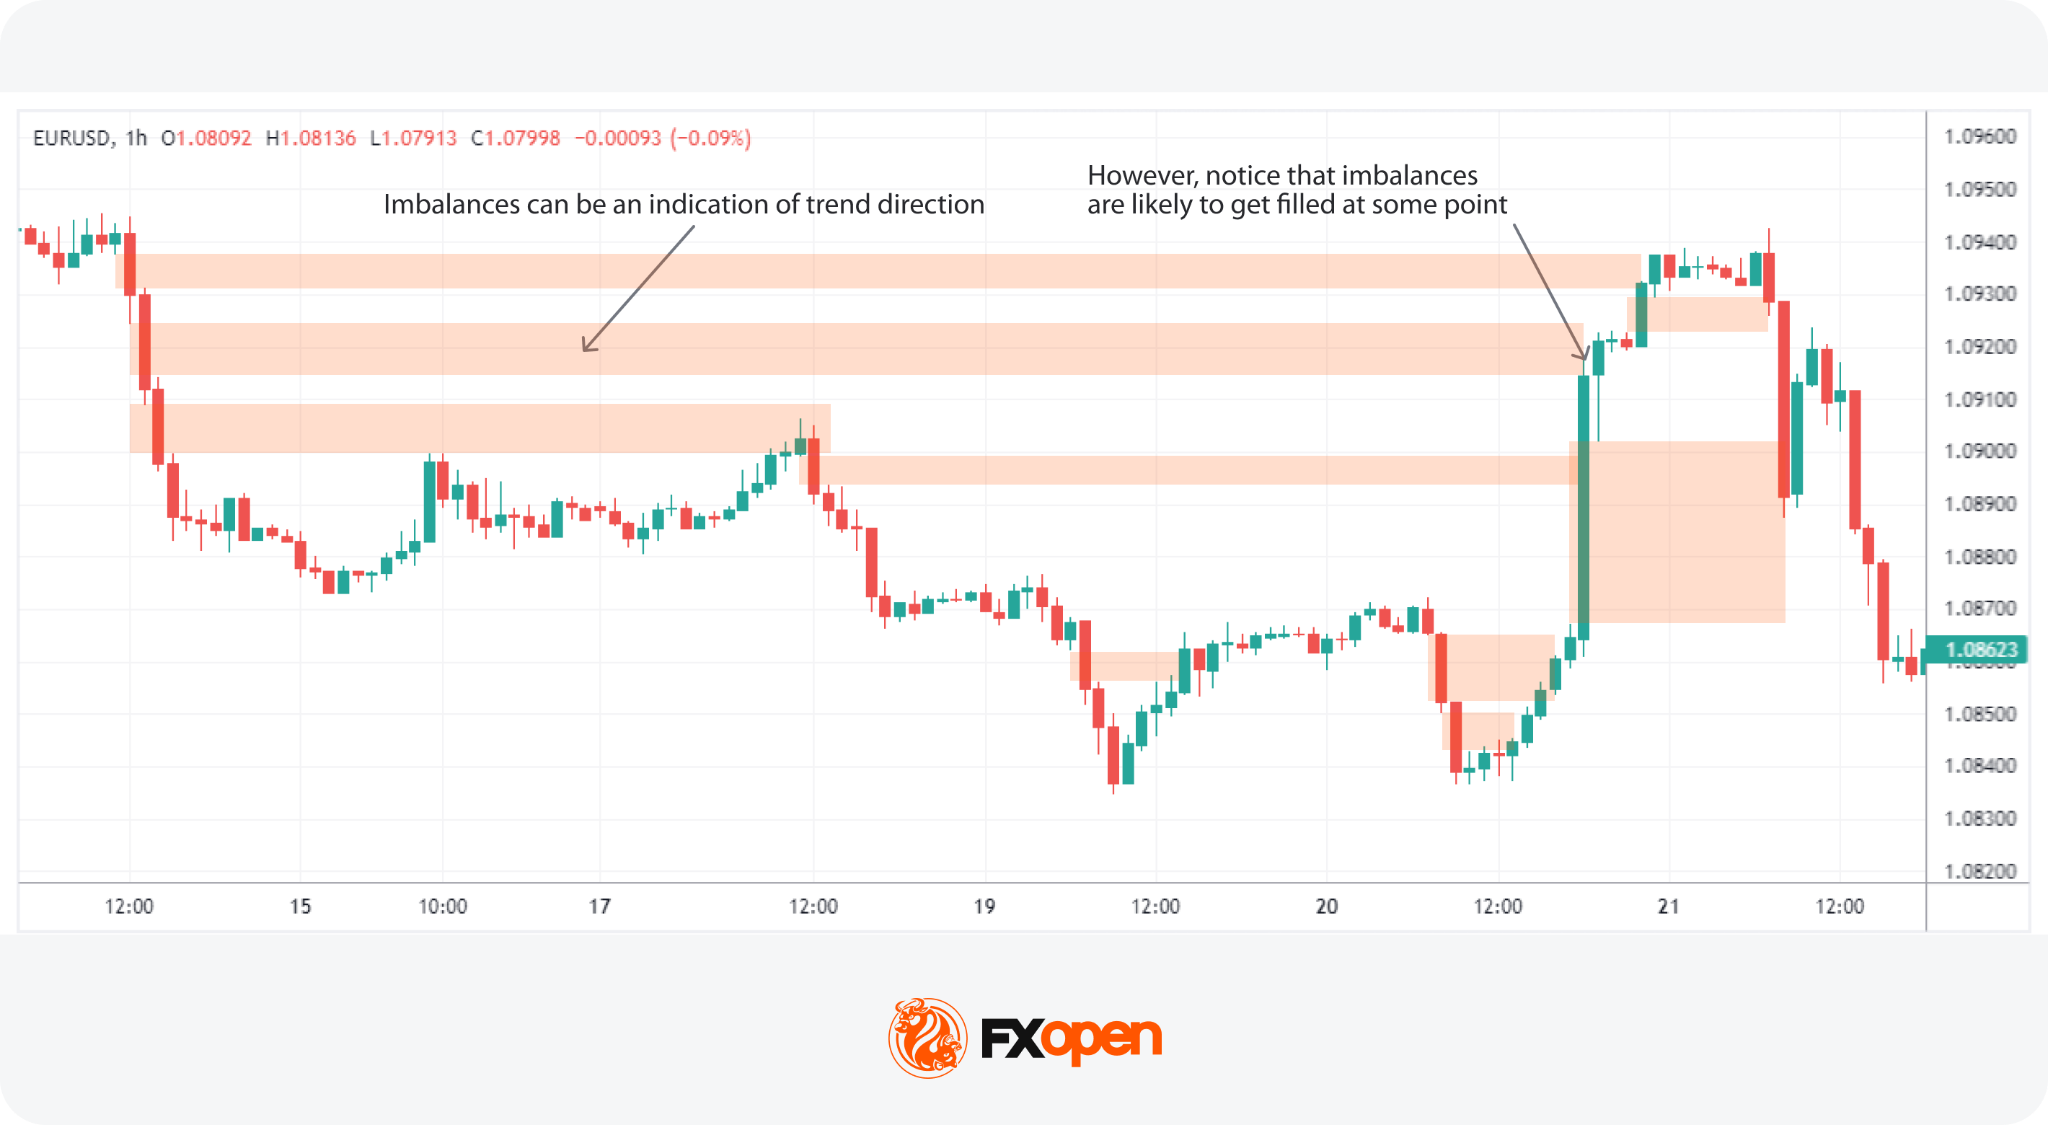
Traders often use imbalances to gauge market sentiment and direction. Large imbalances indicate a pronounced market preference for either buying or selling, suggesting that the trend in the direction of the imbalance is likely to persist. This directional insight is particularly potent with substantial imbalances (also known as liquidity voids), whereas smaller ones may be less useful for market analysis.
Markets tend to “fill” imbalance gaps, created by a lack of trading volume in a price range. This phenomenon hinges on the idea that prices gravitate towards areas of minimal resistance.
Price often returns to fill them, but some remain unfilled for weeks, months, or indefinitely, especially when tied to fundamental repricing events.
Three main reasons traders track imbalances:
- Trend continuation: an imbalance that forms with the higher-timeframe trend may act as a continuation signal.
- Mean reversion: price often retraces back into an imbalance before resuming, offering a reference point for entries.
- Liquidity targeting: large participants may push price through imbalances to access resting orders on the other side. Order flow analysis is a complementary concept here.
Imbalances offer probability, not certainty.
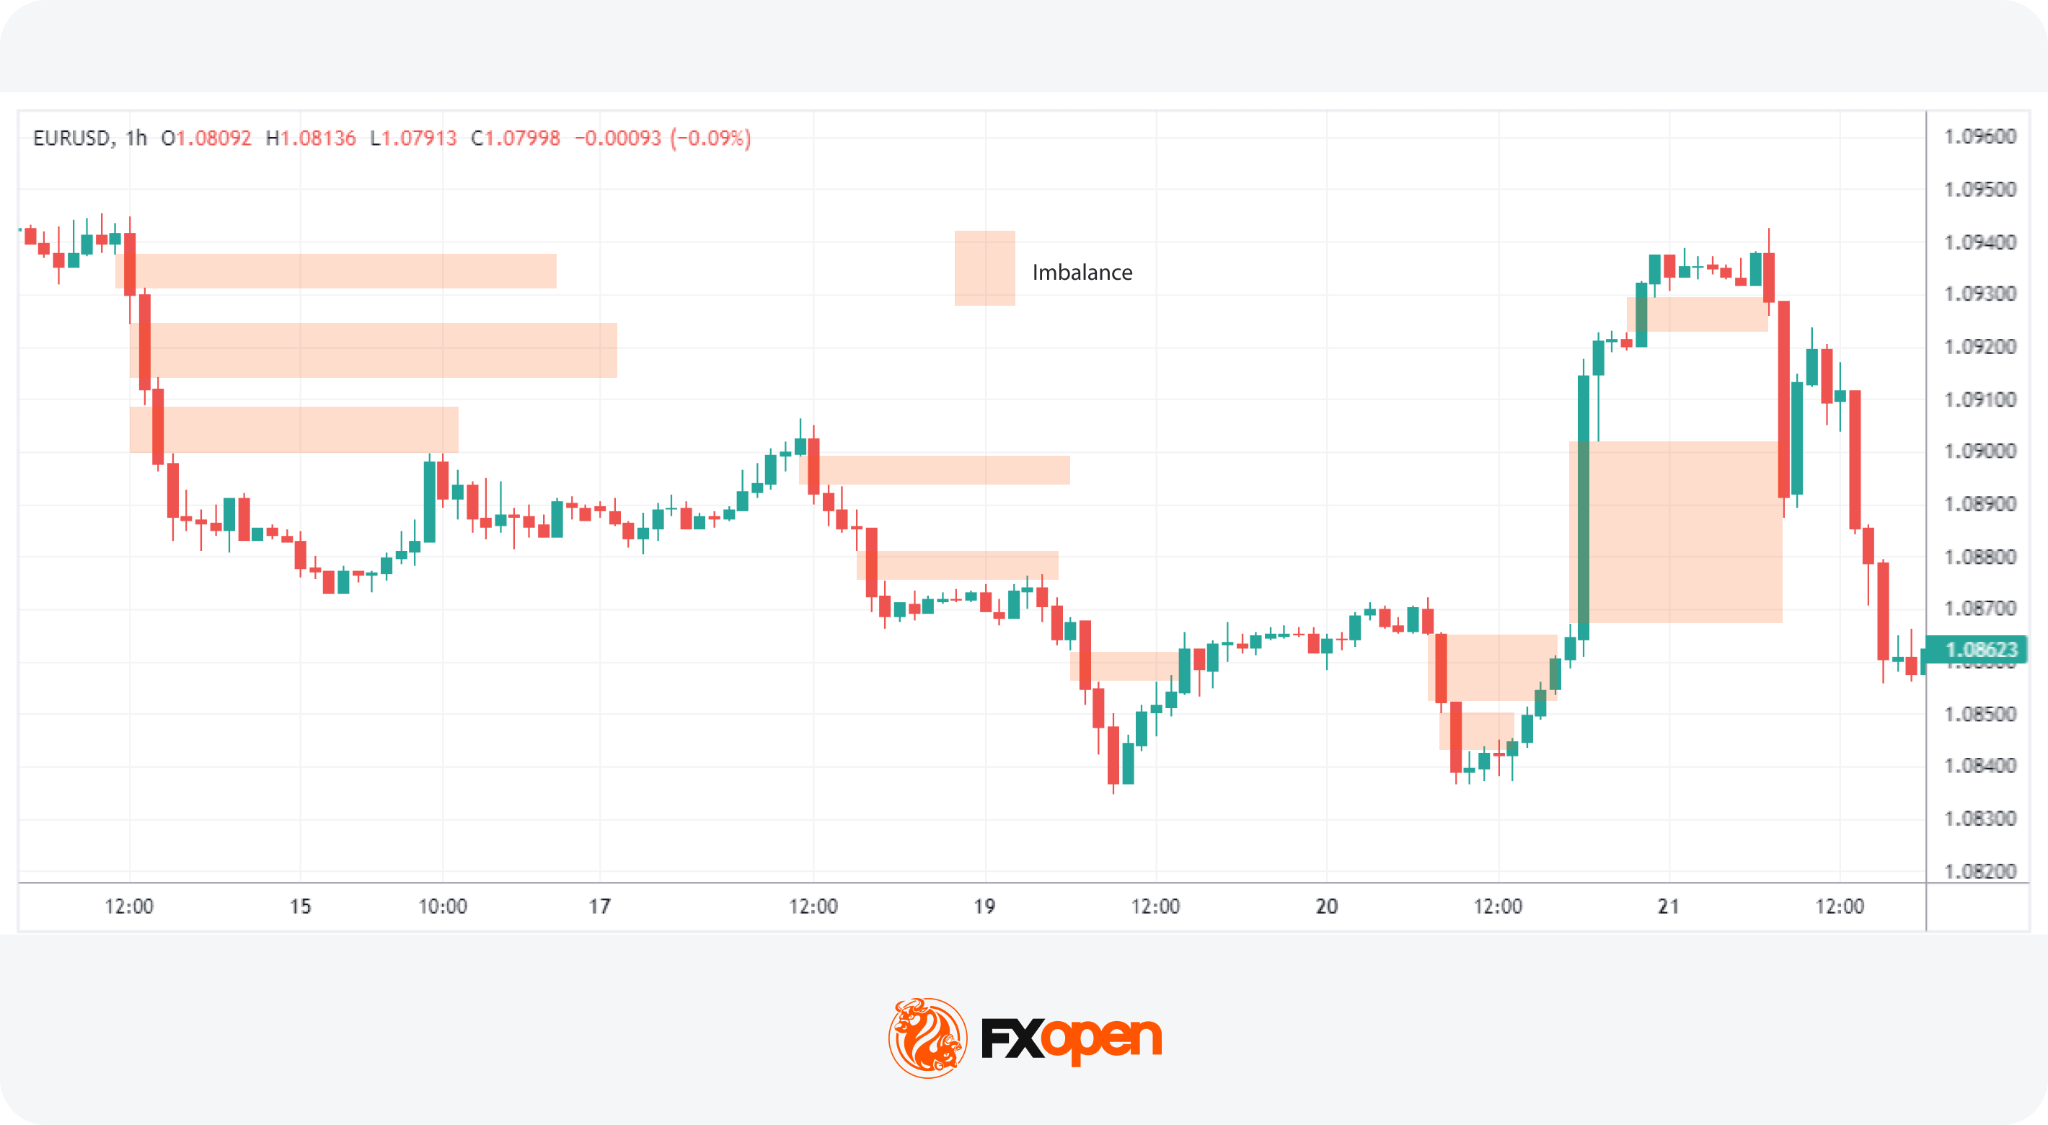
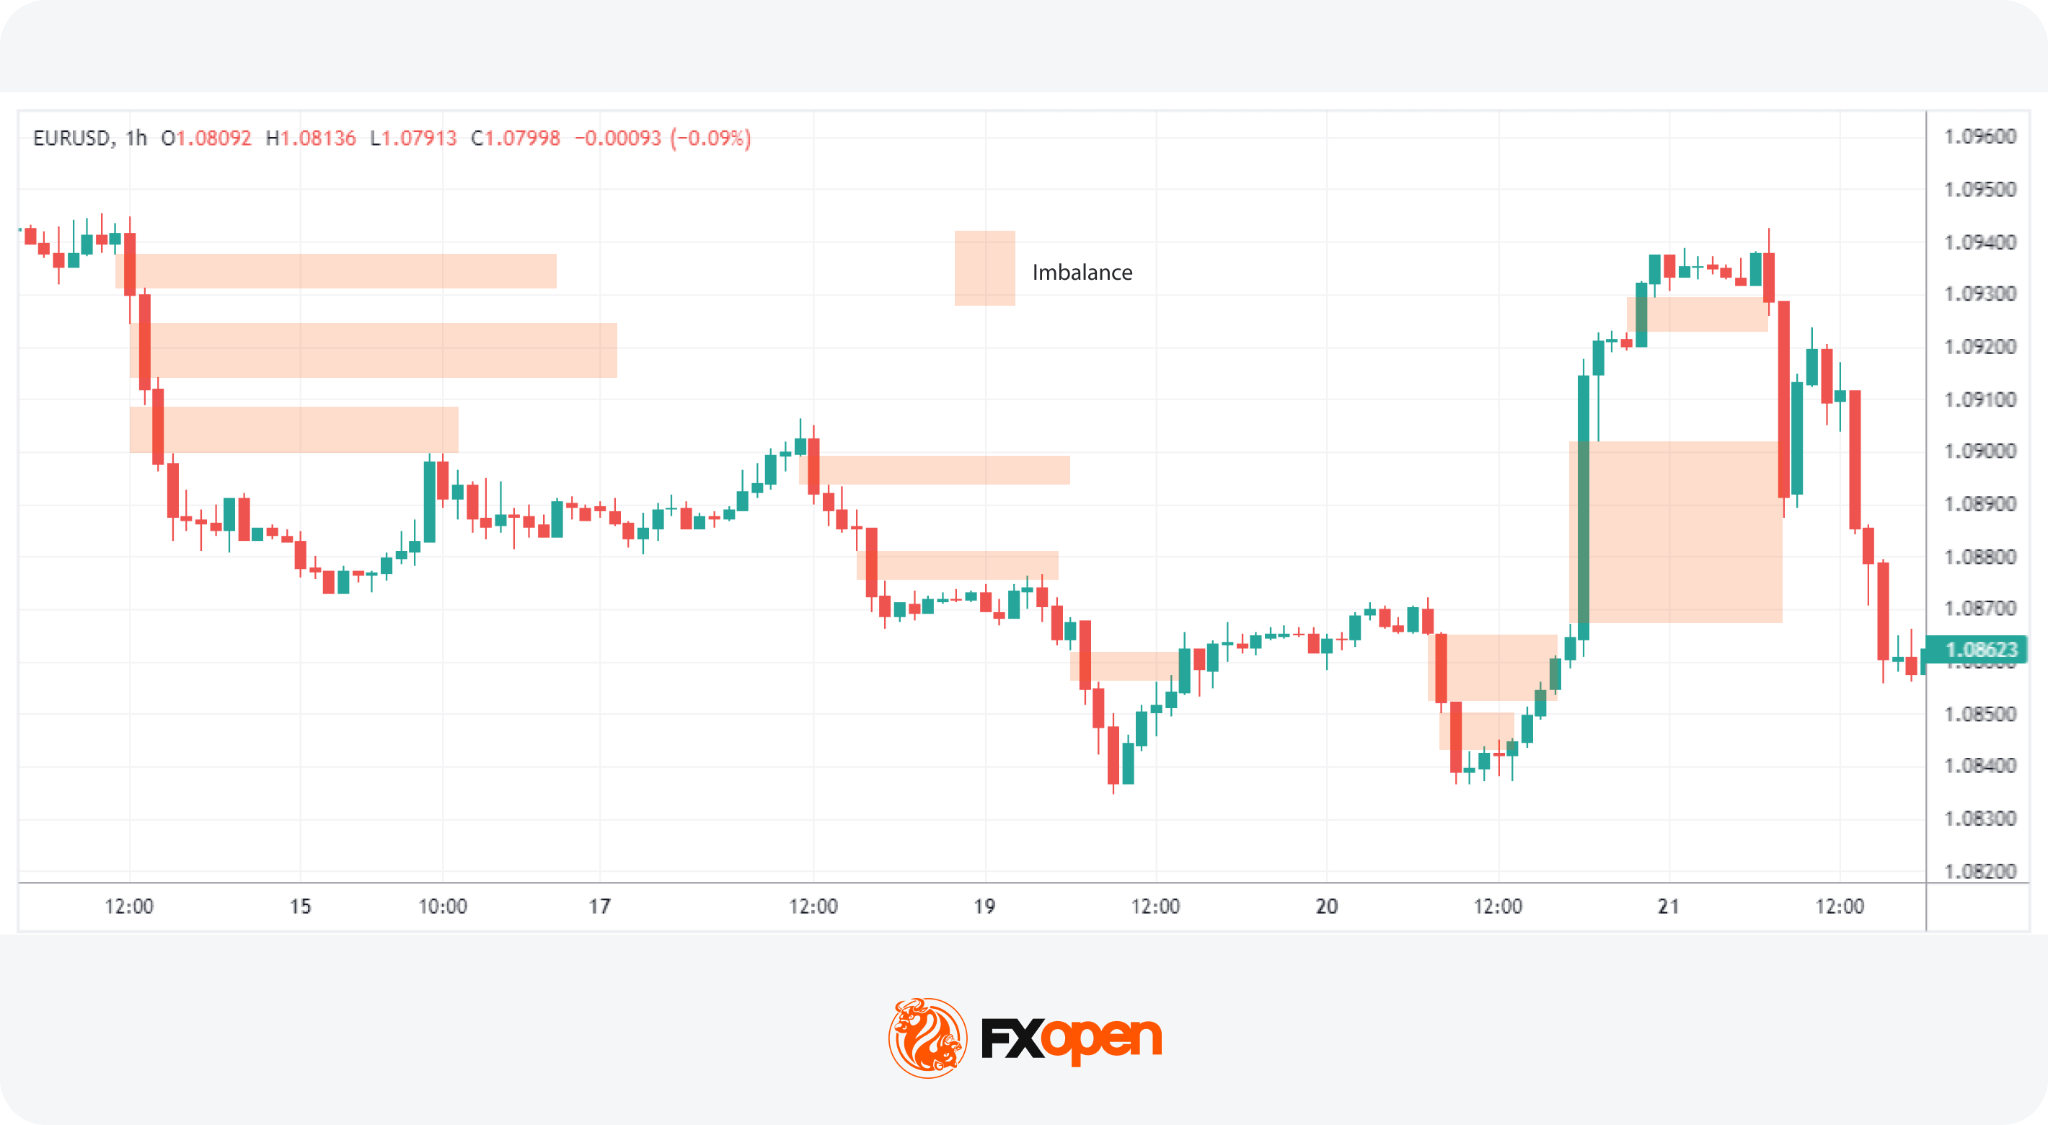
Identifying Imbalances on a Chart
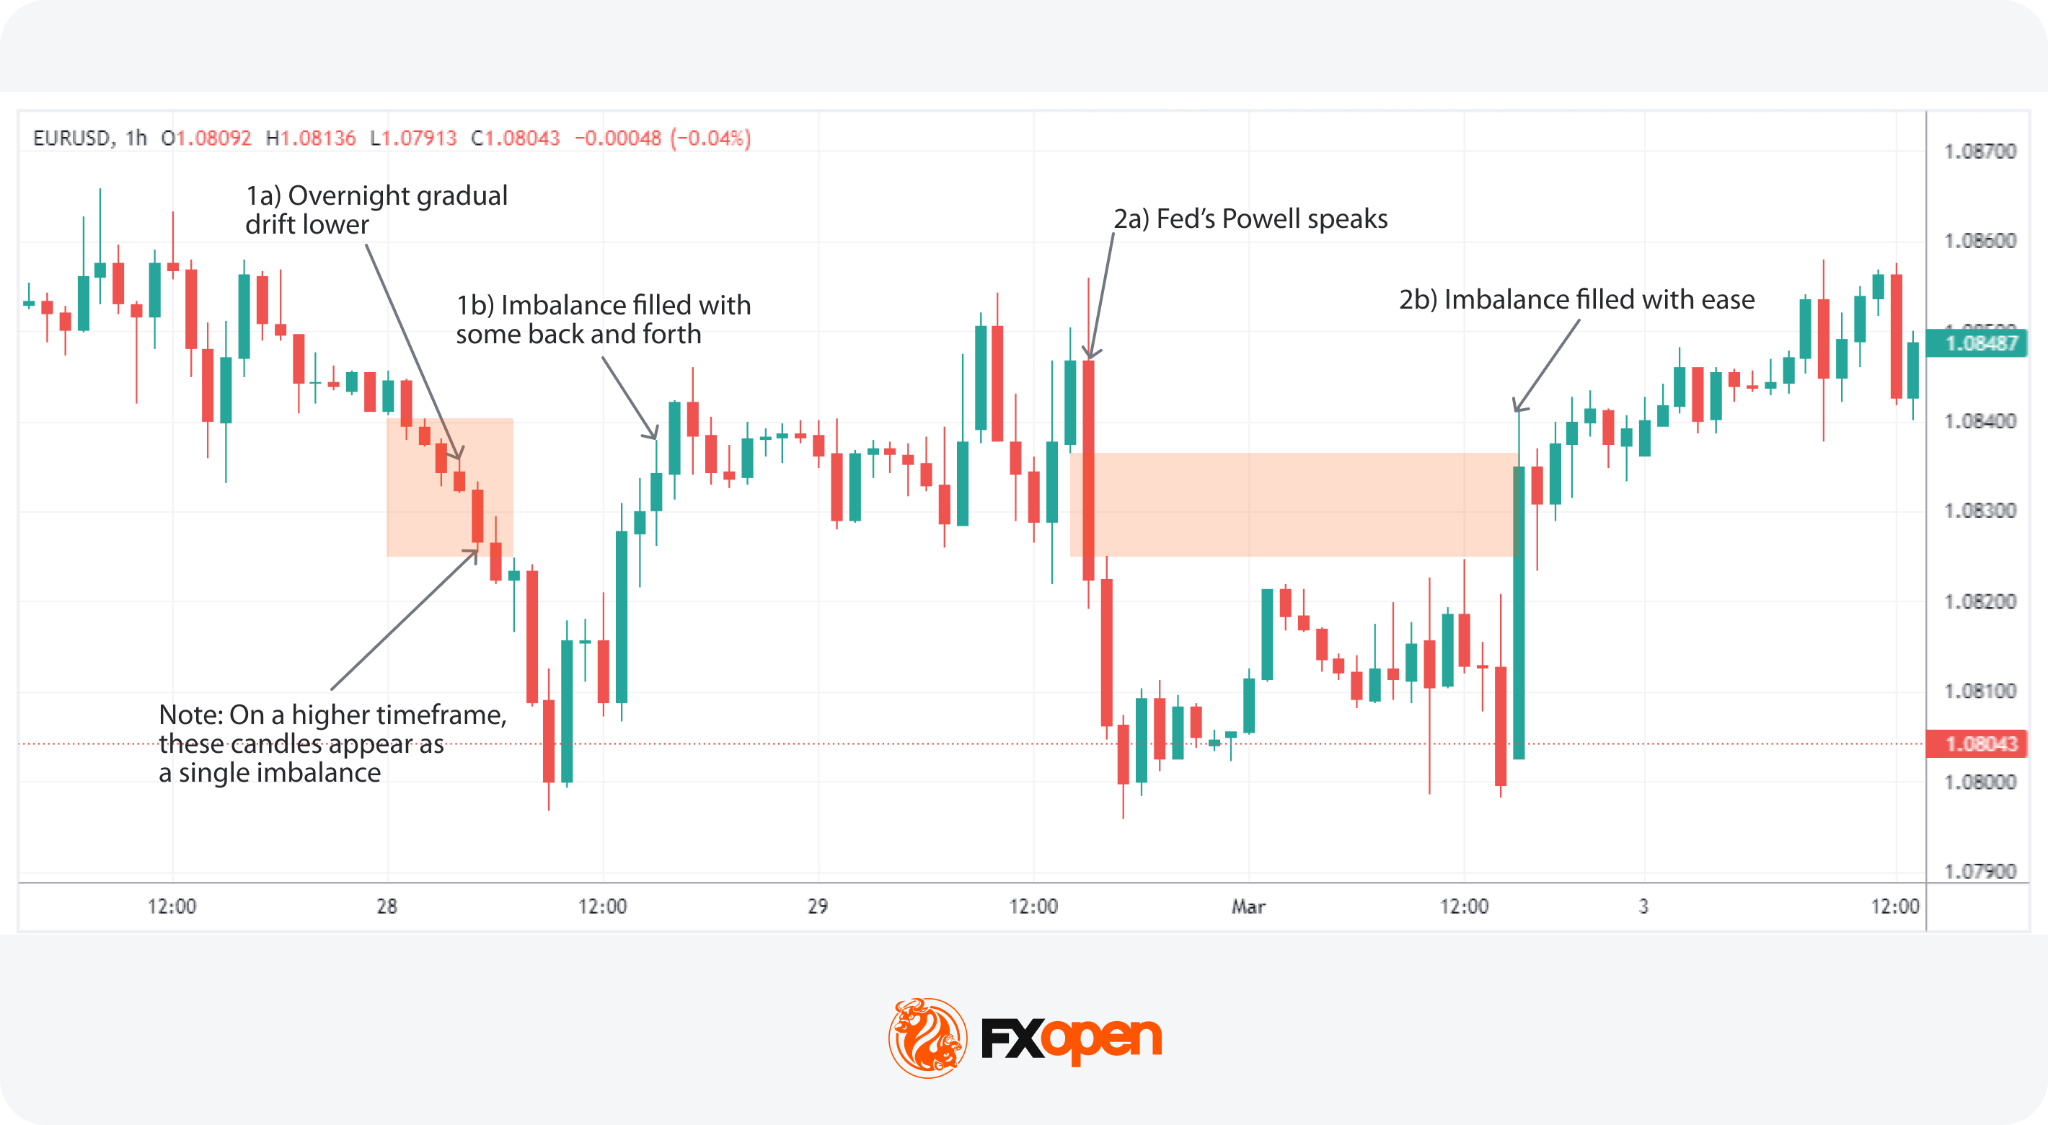
How to identify imbalance in forex and CFD charts? In imbalance trading, traders look for areas where price moved rapidly with limited opposing activity. These conditions often reflect aggressive order flow entering the market while available liquidity on the opposite side remains limited. Fair value gaps (FVGs) are among the most common visual representations of imbalance on a forex or CFD chart.
A fair value gap is typically identified through a three-candle pattern. The central candle represents a strong impulsive move, while the candles before and after it create the boundaries of the imbalance zone. Once the third candle closes, the pattern may indicate that price moved through the area too quickly to establish balanced trading activity.
Strong displacement candles are often associated with meaningful imbalances. Common visual characteristics include:
- large candle bodies
- limited or no wick rejection
- breakout from consolidation
- expansion in volume
- rapid directional movement
The stronger the displacement, the more significant the imbalance is often considered.
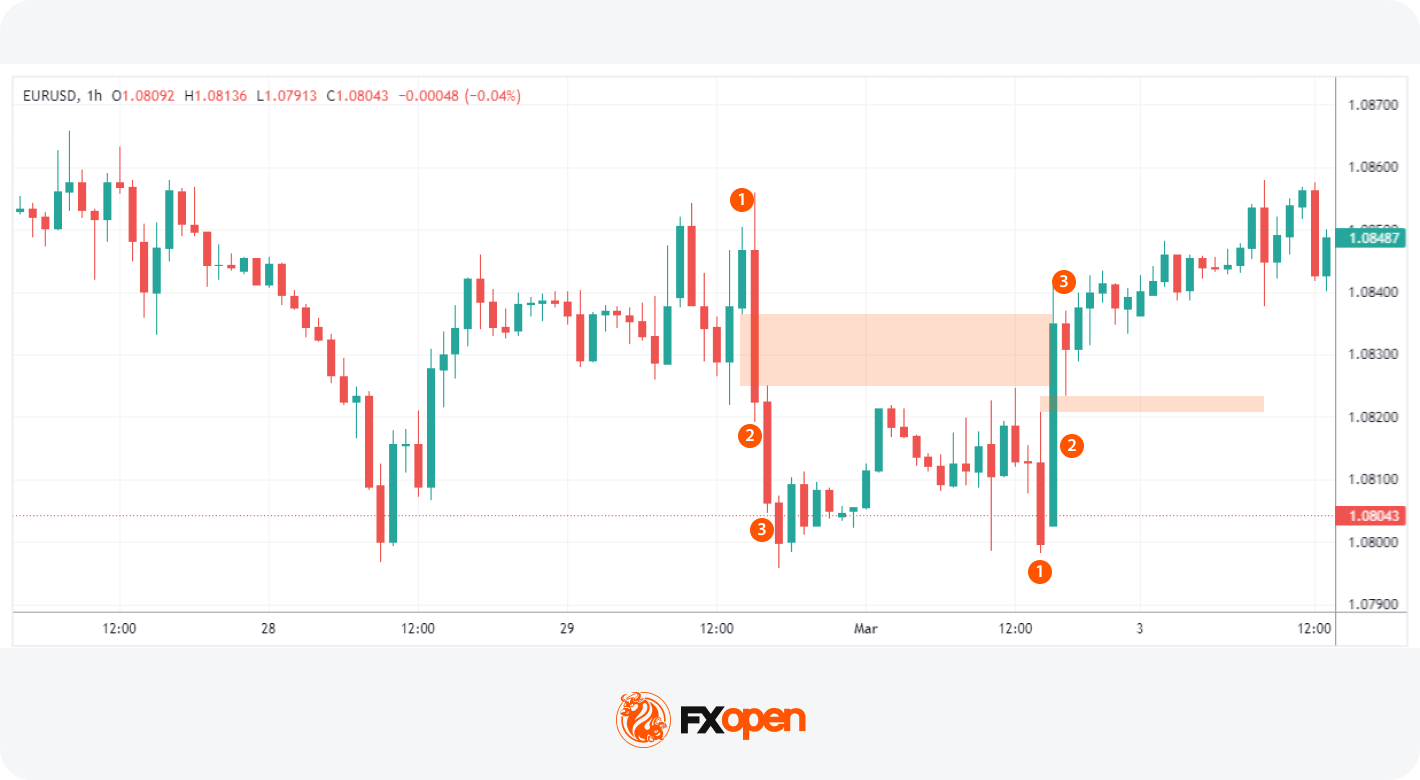
Imbalances may also appear as thin trading or low-interaction zones rather than textbook FVG structures. These areas often show limited candle overlap and minimal back-and-forth price action, indicating that the market moved rapidly through the zone.
A common process for identifying imbalance includes:
- identifying a strong impulsive move
- checking for limited candle overlap
- defining the imbalance boundaries
- comparing the setup with higher-timeframe structure
Timeframe hierarchy also matters. Imbalances that remain visible across both higher and lower timeframes are often considered more significant than those appearing only on lower charts. A daily imbalance may therefore carry more weight than a similar formation on a 5-minute chart. Higher-timeframe imbalance zones are often used as the primary reference area, while lower-timeframe imbalances may help refine entries.
Imbalance Trading Strategy Explained
An imbalance trading strategy combines trend direction, structure, and zone identification into a repeatable framework. According to theory, in an imbalance trading strategy, traders stick with the prevailing market trend. By combining trend analysis with imbalance identification, traders can align themselves with the market’s momentum and identify valuable setups.
The Smart Money imbalance framework runs in four steps:
- Trend identification. In SMC, traders usually identify trends by examining market structure: higher highs and higher lows for bullish conditions, lower highs and lower lows for bearish. An Exponential Moving Average (EMA) may be applied as a simpler proxy. A downward-sloping EMA typically indicates a bearish trend, while an upward slope reflects bullish conditions.
- Imbalance formation. A strong displacement move may create an imbalance or fair value gap. Traders often monitor whether price later revisits this area before continuing in the direction of the prevailing trend.
- Order block identification. Traders then identify the last significant countertrend movement before a strong impulsive move. In Smart Money Concepts (SMC), this area is commonly referred to as an order block and may represent a zone where institutional activity previously entered the market.
- Entry point. Some traders wait for price to retrace back into the imbalance or order block after the impulsive move to enter the market in the trend direction. In bullish conditions, attention is usually placed on retracements into bullish imbalance zones; in bearish conditions, traders typically focus on retracements into bearish imbalance zones.
- Risk and exit planning. Stop-loss placement, position sizing, and exit logic are all defined before entry.
Consider following along on live charts in FXOpen’s TickTrader platform for the deepest understanding.
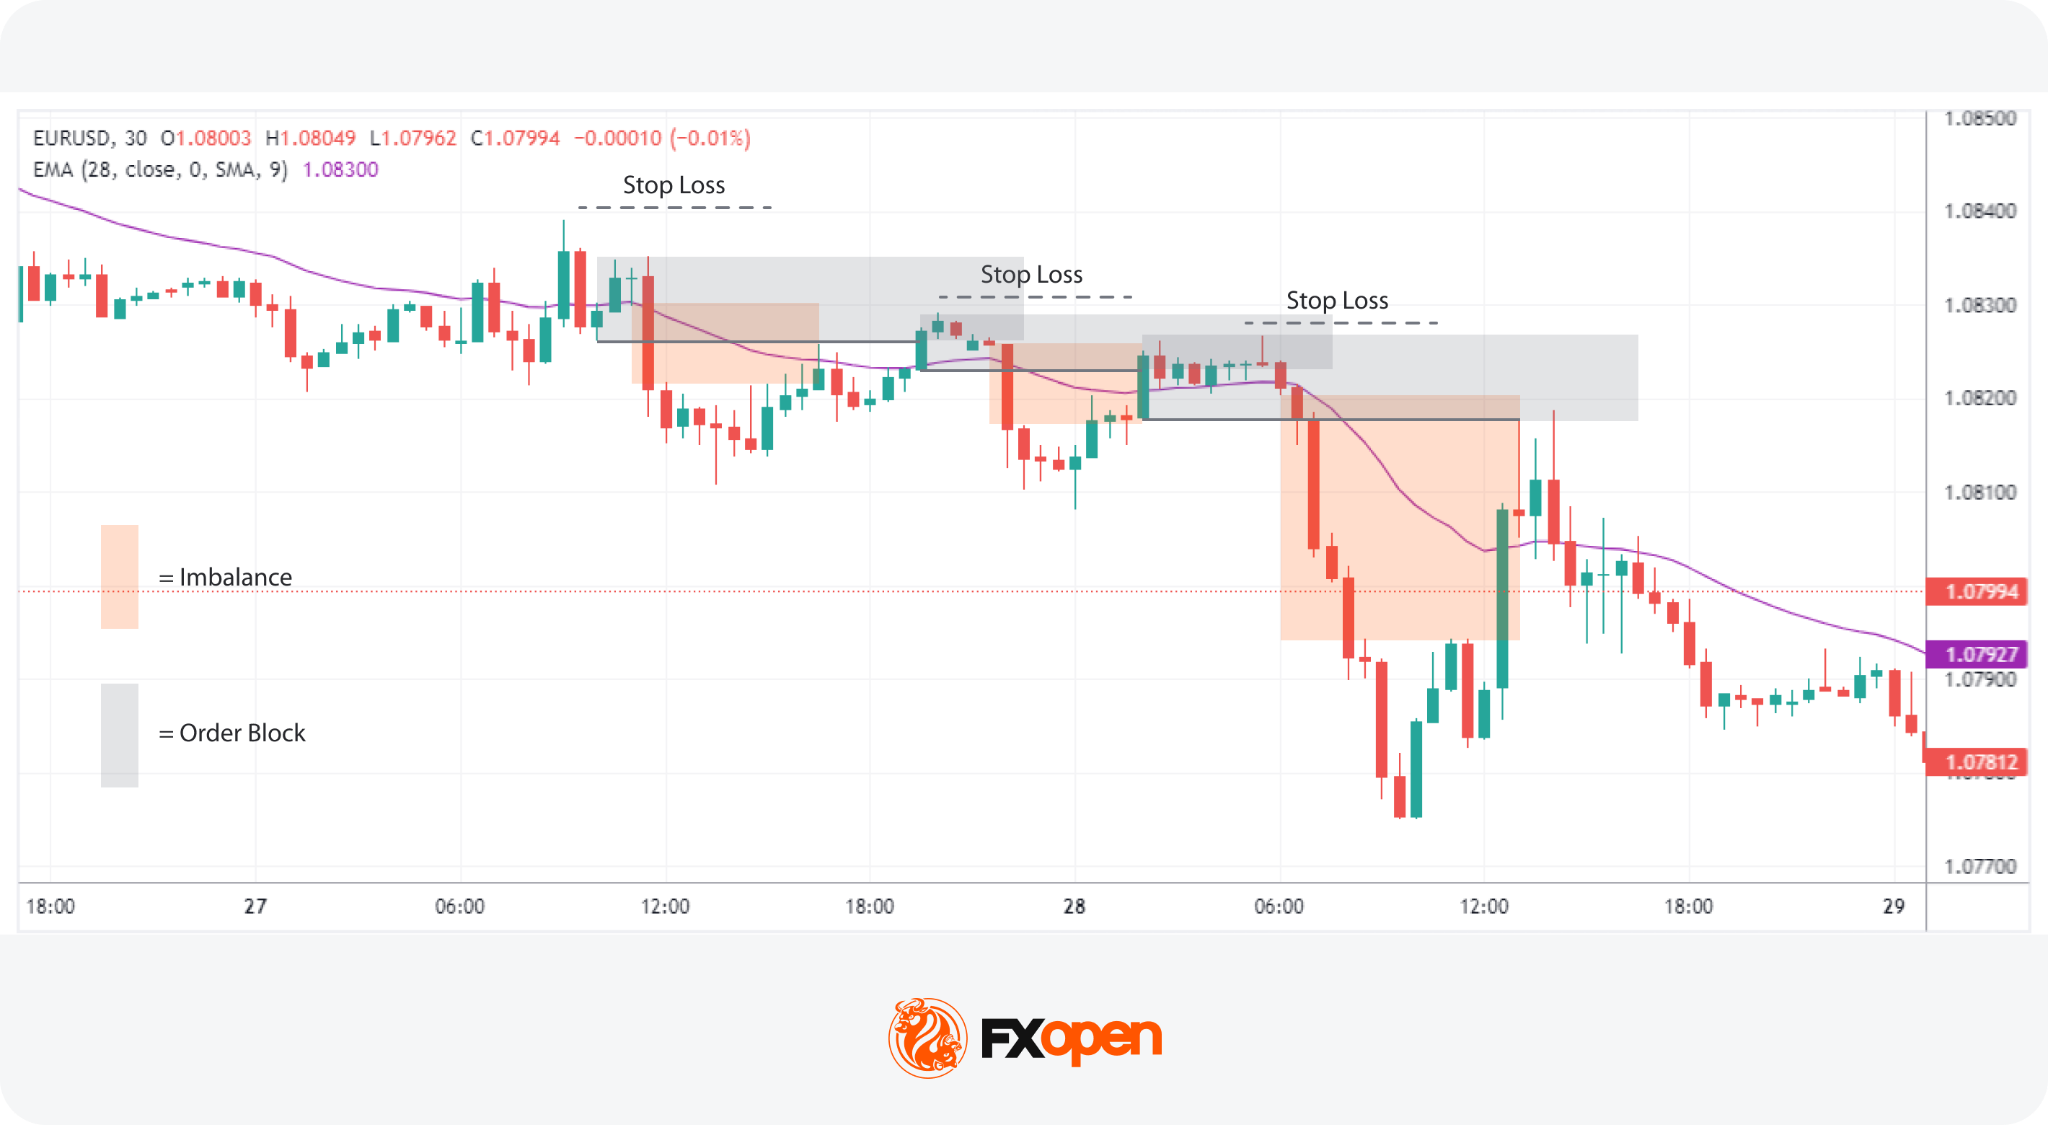
Entry
- Traders identify the market trend using the slope of an EMA.
- They look for an imbalance that results in a new high or low in line with the identified trend.
- The entry point in the trend direction may be set at the high (bullish trend) or low (bearish trend) of the last strong counter-trend candle before the imbalance.
Stop Loss
- A stop loss may be set just beyond the order block. This anchors risk to the structure that triggered the trade rather than an arbitrary pip distance.
Take Profit
- Profit-taking strategies may involve waiting for the price to fill another imbalance or reaching a predetermined technical level.
- To make the most of the trend, traders could employ trailing stops above or below new swing points or follow a longer-term moving average as a dynamic exit radar.
When Not to Trade
Some conditions reduce the reliability of imbalance trading setups:
- Just before major news releases, where volatility may spike and stops may be filled on noise rather than direction.
- When the imbalance forms against the higher-timeframe trend.
- In choppy, range-bound markets where directional bias is unclear.
- When multiple imbalances stack with no clean retracement, making entries harder to define.
Risk Considerations in Imbalance Trading
Imbalance setups offer structure, but they carry the same downsides as any pattern-based approach. Three areas warrant particular attention.
- False signals. Not every imbalance fills. Some price moves continue without retracement, especially during strong trends or trend reversals. A retracement into the zone is not guaranteed.
- News volatility. High-impact data releases can create imbalances that look textbook but resolve in unexpected ways. Slippage and widened spreads during these windows mean stop-losses may be filled at worse prices than expected.
- Overfitting and confirmation bias. Traders sometimes draw imbalances after the fact, marking only the patterns that worked. Without rules defined before the move, the strategy drifts into hindsight pattern-matching rather than systematic trading.
Defining clear entry, stop, and invalidation rules before the trade may support consistency. Risk management may potentially reduce reliance on any single signal when combined with broader structural analysis
Imbalance vs Liquidity
Imbalances and liquidity are linked mechanically. An imbalance forms precisely because liquidity on one side of the order book runs thin, allowing aggressive buying or selling to push price through several levels without resistance.
When aggressive buying or selling outpaces available counterparties at a price level, rapid repricing follows. This is the order flow imbalance in action, and it leaves the visible footprint traders mark as a fair value gap or liquidity void.
What Causes Imbalance in Trading?
Imbalances in forex and CFDs are driven by four main forces: news shocks, institutional flow, sentiment shifts, and technical triggers. Each one shifts the order book in a distinct way, and the order flow impact behind each helps explain why the visible gap forms on the chart. Academic work on market microstructure, including the Bank for International Settlements paper on market liquidity, examines how these forces interact at the deepest level.
High-impact news releases and economic events can quickly skew the balance as traders react en masse to new information, either flooding the market with buy orders or triggering a sell-off. Central bank decisions, inflation prints, and employment data are among the most common triggers. The order flow impact is immediate: liquidity providers widen spreads or pull resting orders, and price gaps to a new level.
Due to their sheer volume, large institutional orders create imbalances by outpacing the market’s ability to absorb them, sharply moving prices in one direction. The order flow impact here is more deliberate. A fund executing a sizable trade may break the order across price levels, but the cumulative pressure still consumes resting liquidity and leaves a visible imbalance behind.
Shifts in market sentiment, driven by broader economic indicators or trending market narratives, can collectively tilt trading activity towards buying or selling, further contributing to order flow imbalance. The shift is often gradual rather than sudden, but the cumulative result still drives one side of the book to dominate.
Technical factors, like prices reaching critical support or resistance levels, can activate automated trading algorithms that rapidly buy or sell, exacerbating the imbalance as these systems execute large-scale trades based on pre-set conditions. The order flow impact tends to be self-reinforcing: a breakout triggers more algorithmic activity, which extends the move and deepens the imbalance.
The Bottom Line
Order imbalances can serve as an indicator of market sentiment, helping traders recognise when supply and demand are not synchronised. By learning how to identify these situations and incorporating them into a structured trading approach, traders may spot potential price moves before they unfold. As with any strategy, combining order imbalance analysis with risk management and other technical tools can support traders when making trading decisions and provide a more balanced view of the market.
If you seek to apply these concepts in real-world scenarios, you can consider opening an FXOpen account, which offers trading with tight spreads and low commissions.
FAQs
What Is Imbalance in Trading?
In trading, an imbalance refers to a situation where buy orders significantly outnumber sell orders, or vice versa, leading to potential shifts in asset prices. This disproportion indicates strong market sentiment towards either buying or selling, impacting price movement direction.
What Causes Imbalance in Forex Markets?
Trade imbalances are primarily caused by significant news releases, large institutional orders, shifts in market sentiment, and technical triggers. These factors can lead to a sudden surge in buying or selling activity, creating an imbalance between supply and demand.
What Is an Imbalance Zone?
An imbalance zone is a specific area on a trading chart where the price has moved sharply, creating a gap known as a fair value gap. This gap signifies a period during which trading volume was minimal, suggesting a potential area for price to return to in the future.
What Is the Order Imbalance-Based Strategy?
The order imbalance-based strategy involves identifying moments when buy or sell orders dominate and using this information to anticipate future price movements. Traders use these imbalances to inform their entry and exit points.
What Is the Difference Between a Fair Value Gap and a Volume Imbalance?
A fair value gap refers to a price area skipped over during rapid market movement, indicating a potential return point for the price. Volume imbalance, however, specifically relates to the difference in volume between buy and sell orders, impacting price direction without necessarily creating a visual gap on the chart.
What Is a Fair Value Gap?
A fair value gap (FVG) is a three-candle pattern where the wicks of the outer two candles fail to overlap, leaving a gap between them. It is one specific form of imbalance and often appears during sharp directional moves. Traders watch FVGs as zones may be revisited before continuing the prevailing trend.
Does Price Always Return to an Imbalance?
No, price does not always return to an imbalance. Many imbalances are filled within hours, days, or weeks, but some remain open indefinitely, particularly those tied to fundamental repricing events such as central bank decisions or major economic shifts. Traders treat imbalance fills as probable rather than guaranteed and combine them with broader structural analysis.
What Is the Difference Between Imbalance and Order Block?
An imbalance is the visible gap or thin zone left after a strong directional move. An order block is the last opposing candle before that move, where institutional orders are thought to have been placed. The order block is the cause, the imbalance is the effect. Traders often look for both elements to align before entering.
How Is Imbalance Identified on a Chart?
Imbalance is commonly identified through strong displacement candles, fair value gaps, or areas with limited candle overlap. Traders often look for rapid directional movement, breakout conditions, and low-interaction price zones that suggest the market moved too quickly to establish balanced trading activity.
What Timeframes Are Used for Imbalance Trading?
Imbalance trading is applied across all timeframes, from 1-minute charts up to the weekly. Higher timeframes such as 4-hour, daily, and weekly tend to produce stronger imbalances. Lower timeframes are typically used for entry refinement once a higher-timeframe imbalance has been located. Multi-timeframe analysis sits at the core of the approach.
*Important: At FXOpen UK, Cryptocurrency trading via CFDs is only available to our Professional clients. They are not available for trading by Retail clients. To find out more information about how this may affect you, please get in touch with our team.
This article represents the opinion of the Companies operating under the FXOpen brand only. It is not to be construed as an offer, solicitation, or recommendation with respect to products and services provided by the Companies operating under the FXOpen brand, nor is it to be considered financial advice.
Bitcoin’s (BTC) Thursday rally to $82,000, buoyed by the Senate Banking Committee’s advancement of the CLARITY Act, has stalled amid stiff overhead resistance and weakening ETF demand. Still, analysts said that BTC’s upward momentum may increase if key conditions are met.
Key takeaways:
- BTC bulls must flip the $82,000-$84,000 into new support.
- Return of strong institutional demand via spot Bitcoin ETFs is required for the uptrend to continue.
Bitcoin price must establish $82,000 as new support
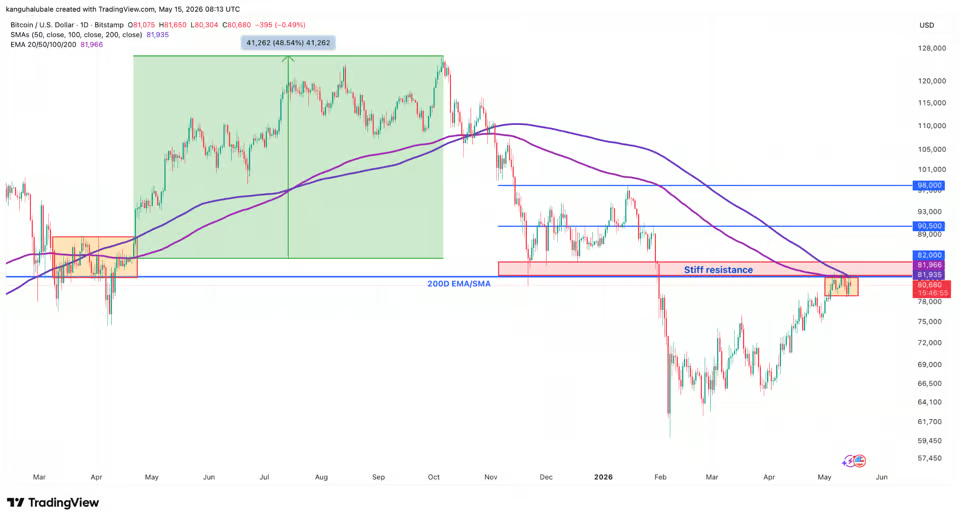
Data from TradingView showed BTC tested overhead resistance at $82,000, which has rejected the price since last week.
Note that this is where the 200-day simple moving average (EMA) and the 200-day exponential moving average (SMA) converge, reinforcing the importance of this level.
Related: Bitcoin trades at a ‘discount’ on Coinbase: Is a $76K retest next?
“If Bitcoin is going to go higher, it should really break above the 200 EMA now at $82,000 and hold it,” analyst Sykodelic said in a Thursday post on X, adding:
“Reject again here and I think we will get a deeper retrace, $74k – $77k levels.”
Analysts at Galaxy Trading said that the price has been trading below these moving averages since October 2025, and breaking them will be “another bullish confirmation” for Bitcoin.

BTC/USD daily chart. Source: Cointelegraph/TradingView
The last time BTC price broke convincingly above the moving averages with strong volume was in April 2025, triggering a 48.5% rally to its current all-time high of $126,000.
Bitcoin’s cost-basis distribution heatmap reveals another major level of resistance, sitting further up, between $84,000 and $85,400, where investors acquired roughly 1.05 million BTC.
Analyst Sherlock said this is “one of the biggest supply clusters” that the BTC market must absorb to continue higher.

Bitcoin cost basis distribution heatmap. Source: Glassnode
Meanwhile, Bitcoin’s liquidation heatmap shows heavy ask orders at $82,000-$83,000, highlighting the bears’ main line of defense.

Bitcoin liquidation heatmap. Source: X/AlphaBTC
As Cointelegraph reported, a break and close above $82,000-$84,00 opens the gates for a rally to the $92,000 resistance zone. A close above this resistance zone could signal the beginning of the next leg up.
Bitcoin ETF outflows diminish
One factor that could trigger a BTC price breakout is a resurgence in institutional demand, which has faltered amid inconsistent inflows into spot Bitcoin exchange-traded funds (ETFs).
Data from Farside Investors shows that spot Bitcoin ETFs snapped a five-day inflow streak totaling nearly $1.7 billion with $269 million in outflows on May 7 as Bitcoin dipped below $80,000.
These outflows continued this week, with the $635 million on Wednesday, marking the largest withdrawal since late January.

Spot Bitcoin ETF flows table. Source: Farside Investors
Strong and consistent inflows must return for Bitcoin to continue its recovery, Glassnode said in this week’s newsletter, adding:
“If sustained, continued institutional accumulation could provide the demand base required for Bitcoin to challenge higher overhead supply zones in the weeks ahead.”
Data from Capriole Investments, meanwhile, shows that while the number of Bitcoin treasury companies buying BTC daily has increased slightly over the last few weeks, it remains significantly lower than its peak seen in mid-2025.

Bitcoin treasury companies buyers. Source: Capriole Investments
Michael Saylor’s Strategy, the largest corporate Bitcoin treasury holder, is one of the few companies consistently buying, adding 535 BTC for $43 million last week.
The purchase brought Strategy’s total Bitcoin holdings to 818,869 BTC, purchased for about $61.86 billion at an average price of $75,540 per coin.
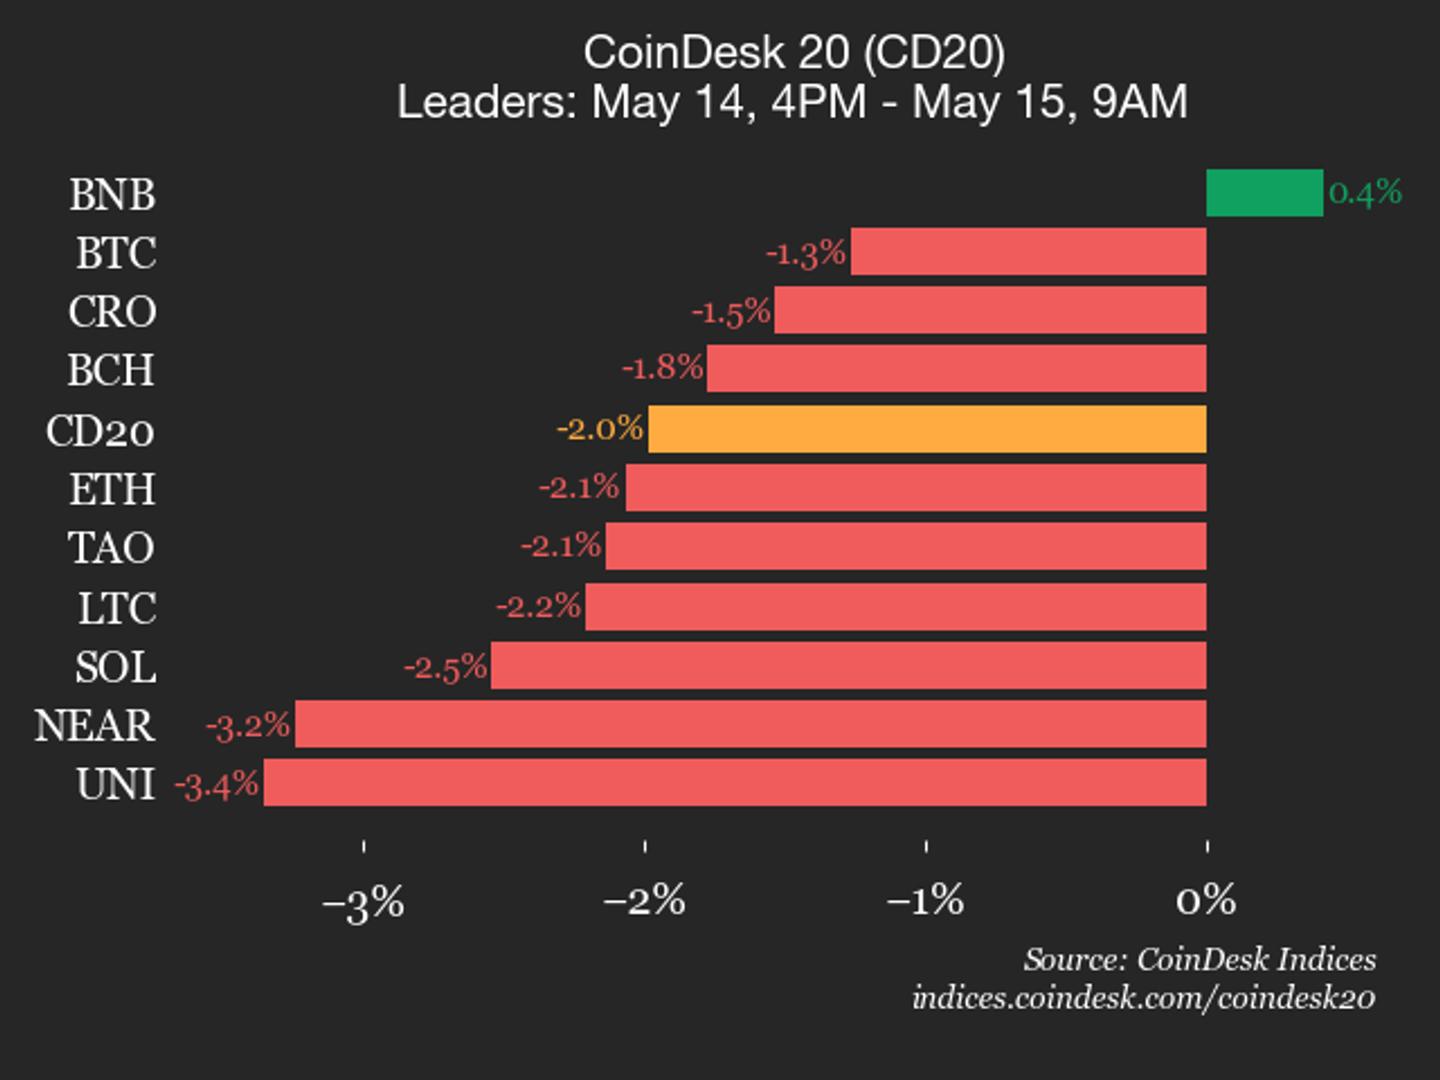

BNB (BNB) rose 0.4% while Bitcoin (BTC) fell 1.3% from Thursday.


Crypto Fear and Greed Index sits at 42 today, up 9 points from yesterday and well off April’s “extreme fear” lows, but still shy of neutral as risk appetite grinds back.
Summary
- The CoinGlass Crypto Fear and Greed Index stands at 42 this morning, up 9 points from yesterday, but still signaling “fear” rather than neutral or greed.
- The 7‑day average for the index is also 42, while the 30‑day average sits at 36, showing sentiment has recovered from “extreme fear” levels seen earlier in April but remains cautious.
- The index aggregates volatility, volume, momentum and derivatives data into a 0–100 score, with lower readings indicating fear and higher ones greed, offering a shorthand for crypto market psychology.
The Crypto Fear and Greed Index compiled by CoinGlass is currently printing 42, a reading the provider classifies as “fear” even after a 9‑point jump from yesterday’s level. That move follows a month‑long climb off early April’s “extreme fear” territory, when the gauge dropped as low as 14 before grinding higher through the 20s and 30s as prices stabilized.
On a slightly longer horizon, the 7‑day rolling average of the index also comes in at 42, while the 30‑day average is 36, underscoring how the market has spent most of the past month in a state of subdued risk appetite rather than outright panic or frothy optimism. CoinGlass describes its indicator as a composite of inputs including price volatility, trading volume, market momentum, and derivatives positioning, mapped onto a 0–100 scale where 0 represents maximum fear and 100 maximum greed.
Functionally, that means today’s reading at 42 is sitting just below the “neutral” band—CoinGlass has previously flagged levels in the mid‑40s as a transition zone after fear and before sustained risk‑on behavior takes hold. Other providers, such as CoinMarketCap’s Fear and Greed Index, use similar 0–100 gauges to track whether sentiment skews toward capitulation or euphoria, arguing that extreme fear can coincide with undervalued conditions while extreme greed often precedes corrections.
In short, a print of 42 with matching 7‑day averages and a 30‑day mean of 36 paints a picture of a crypto market that has pulled itself out of a deep sentiment trough but has not yet flipped into aggressive dip‑buying mode—investors are less terrified than they were a few weeks ago, but they are still far from complacent.
Crypto World
Amazon (AMZN) Stock: Wall Street Analysts Raise Targets on Grocery Delivery and Cloud Expansion

Key Takeaways
- Goldman Sachs reaffirms strong conviction in Amazon, setting a $325 price target after citing robust Q1 performance with unit growth reaching post-pandemic highs.
- AMZN shares declined 1.7% to $262.82 during premarket hours on May 15.
- TD Cowen maintains Buy rating with elevated $350 price target, highlighting Amazon’s expansion into 30-minute grocery delivery service.
- The company introduced Amazon Now with ultra-fast grocery delivery in four major metro areas, with expansion to additional cities underway.
- In 2025, Amazon fulfilled 8 billion orders within same-day or next-day windows, representing a 30% annual increase, with grocery items comprising 50% of volume.
Amazon (AMZN) shares retreated during premarket activity on May 15, declining 1.7% to reach $262.82, despite receiving renewed endorsements from two prominent investment firms on Wall Street.
Goldman Sachs reinforced its bullish position on the e-commerce and cloud computing giant following a thorough analysis of the company’s first-quarter financial results and CEO Andy Jassy’s yearly letter to shareholders. Eric Sheridan, the firm’s analyst covering the stock, maintained a 12-month valuation target of $325.
Sheridan characterized the first quarter as demonstrating substantial strength. The company’s unit growth reached levels not witnessed since the pandemic era, fueled by accelerated demand for everyday necessities outpacing overall category expansion. Advancements in expedited delivery capabilities and rapid commerce initiatives also received favorable assessment.
The investment firm identified three critical focal points for investor monitoring: global consumer spending patterns, advertising services expansion, and developments in the AI landscape. Sheridan emphasized AWS profitability trends and the transformation of AI pipeline opportunities into actual revenue streams as essential metrics.
Company leadership emphasized AI momentum across product discovery, supply chain operations, and advertising platforms during the quarterly earnings discussion, while confirming expectations for an aggressive capital reinvestment phase.
Amazon Now: Ultra-Fast Grocery Delivery Initiative
TD Cowen independently maintained its Buy recommendation and $350 valuation target, concentrating on an alternative growth driver — the company’s newly unveiled 30-minute grocery delivery platform.
Amazon Now debuted on May 12, providing thousands of fresh groceries and household essentials with delivery times of 30 minutes or less. The offering is currently operational in Atlanta, Dallas-Fort Worth, Philadelphia, and Seattle metropolitan areas.
Prime subscribers are charged $3.99 per delivery for purchases exceeding $15. Standard customers pay $13.99. Amazon intends to expand the program to numerous additional markets progressively.
This initiative leverages an already robust logistics network. The company completed 8 billion same-day or next-day deliveries in 2025 — representing a 30% year-over-year surge. Grocery and essential products accounted for half of this delivery volume.
Jassy noted that the expedited delivery strategy propelled Amazon to become America’s second-largest grocery retailer in 2025.
TD Cowen’s Consumer Research Supports Grocery Strategy
TD Cowen’s proprietary consumer research revealed that 36% of consumers purchased groceries online within the preceding 30 days as of Q4 2025 — equaling peak pandemic-era penetration rates.
This finding carries significance because it indicates online grocery shopping behaviors persisted beyond COVID-related restrictions. Consumer adoption has remained stable, and Amazon is strategically positioned to capture increasing market share.
The company’s revenue reached $742.78 billion during the latest reporting period, reflecting 14% growth. The stock has appreciated 17% year-to-date and was approaching its 52-week peak of $278.56 before the premarket pullback.
Amazon recently unveiled Alexa for Shopping, an AI-powered shopping companion embedded within its mobile application, website, and Echo Show hardware, engineered to deliver customized product suggestions based on individual purchase patterns.
Twenty-five Wall Street analysts have recently increased their earnings projections for the company’s next reporting period.


Gemini’s revenue improved 42% year-over-year to $50.3 million, helping narrow its net loss by 27% from $149.3 million a year earlier.


Disclosure: This article does not represent investment advice. The content and materials featured on this page are for educational purposes only.
AI trading bots gain wider retail adoption as investors seek automation in volatile 2026 markets.
Summary
- AI trading bots are helping retail investors manage faster, more volatile markets with automated execution.
- BulkQuant simplifies AI quantitative trading through automated strategies, portfolio tracking, and retail-friendly tools.
- The guide compares top AI trading bots for 2026, focusing on usability, risk control, and automation quality.
AI trading bots are no longer niche tools used only by technical traders. In 2026, they are becoming part of how retail investors manage faster, noisier, and more automated markets.
Crypto trades around the clock. Stocks react quickly to inflation data, earnings reports, ETF flows, liquidity shifts, and interest rate expectations. AI-related sectors can rotate sharply before many retail traders even have time to review the chart.
That creates a clear problem: most individual investors are not slow because they lack interest. They are slow because they are human. They sleep, work, hesitate, panic, chase momentum, and sometimes change strategy at the worst possible moment.
This is where automated trading becomes useful.
The best AI trading bots help retail investors build a more reliable trading process. They can monitor markets, execute strategies, track performance, and support risk management without requiring constant screen time.
But not every trading bot is worth using. A weak bot only adds another layer of confusion. A strong AI trading bot helps investors act with more structure, more visibility, and better control.
Below are five of the best AI trading bots for 2026, selected for retail investors who want practical automation instead of unnecessary complexity.
Why AI trading bots matter for retail investors in 2026
Retail investors used to compete mainly on information. Today, they also compete on execution.
A good market view is not enough if the trade is entered late, managed emotionally, or closed during panic. In fast markets, the difference between a good idea and a poor result is often the process behind the trade.
Manual trading often turns every price move into a decision. Should I enter now? Should I wait? Should I cut the trade? Should I add more? Should I stop the strategy after one bad day?
That constant pressure is where many retail traders lose discipline.
A good AI trading bot does not remove risk, guarantee profit, or replace judgment. What it can do is turn repeated trading decisions into a more organized system.
That is the real value of automated trading in 2026. The goal is not to stare at charts longer. The goal is to build a better process around execution, risk control, portfolio visibility, and strategy discipline.
Quick comparison overview
| Platform | Core Strength | Main Use Case | Most Suitable For |
| BulkQuant | Simplified AI-powered quantitative automation | Guided automated trading | Retail investors who want easier automation |
| Pionex | Built-in exchange bots | Grid and DCA bot trading | Beginners entering crypto automation |
| 3Commas | Advanced customization | Strategy-based bot control | Active and experienced traders |
| Cryptohopper | Strategy marketplace and cloud bots | Testing automated approaches | Intermediate users refining strategies |
| Bitsgap | Multi-exchange visibility | Portfolio and bot management | Investors using several crypto exchanges |
How we selected these AI trading bots
The best AI trading bot is not always the one with the longest feature list.
For retail investors, too many settings can become another source of risk. A platform may look powerful, but if the user does not understand what the bot is doing, automation quickly becomes a black box.
This guide focuses on practical value. A strong platform should make trading easier to manage, not harder to understand. It should help users see what is happening, control risk, monitor performance, and stay consistent when markets become unstable.
The five platforms below were selected because each one solves a different problem for retail investors. BulkQuant focuses on simplified AI quantitative automation. Pionex lowers the first barrier for beginners. 3Commas gives active traders deeper control. Cryptohopper provides room for testing and learning. Bitsgap helps investors manage trading activity across multiple exchanges.
That difference matters because there is no single “best” bot for every investor. The right choice depends on what is missing in the investor’s current trading process.
1. BulkQuant
New users can claim a $10 real reward and a $50 trial credit for free!
BulkQuant is one of the strongest AI trading bots for retail investors who want automated trading without turning the process into a technical project.
Many platforms claim to offer AI automation, but the setup often becomes complicated very quickly. Investors may be asked to configure indicators, connect APIs, adjust trading pairs, set stop rules, select strategy logic, and monitor several dashboards before they understand how the system actually behaves.
That may be fine for experienced traders. For many retail investors, it creates friction before automation even begins.
BulkQuant takes a cleaner approach. It focuses on AI-powered quantitative trading, automated execution, real-time portfolio visibility, and adaptive market participation in a more retail-friendly environment.
Its advantage is not that it gives users endless controls. Its advantage is that it makes AI quantitative automation easier to use consistently.
Why BulkQuant stands out
BulkQuant treats automated trading as a complete investment workflow, not just a trade execution feature.
That difference is important. A basic bot may place orders faster, but speed alone does not solve the real problem for most retail investors. The real problem is inconsistency.
A trader may enter too late after watching a move unfold. They may exit too early after a small pullback. They may increase risk after a loss because they want to recover quickly. They may abandon a strategy after one volatile day.
BulkQuant is built for investors who want to reduce that kind of decision pressure. By combining AI-driven market analysis, automated monitoring, simplified controls, and clearer performance visibility, it helps users stay closer to a structured process.
This makes it especially useful for investors who want exposure to AI trading and quantitative automation but do not want to become full-time strategy builders.
Automation and market adaptability
Markets in 2026 rarely move in a straight line.
One week may reward momentum. Another may punish it. A strategy that works during a clean trend can behave very differently during sideways volatility or sudden liquidity shocks.
BulkQuant is designed to adjust trading activity based on changing market behavior, including volatility, liquidity, and momentum conditions. That makes it more useful than rigid bots that repeat the same actions in every environment.
For retail investors, this matters because most users cannot monitor the market every hour. They need a system that can respond to changing conditions without requiring constant manual intervention.
User experience
BulkQuant is strongest when automation needs to feel clear and manageable.
The platform gives users a direct way to follow automated trading activity, portfolio behavior, and performance without burying them under unnecessary technical settings. That makes it suitable for beginners, passive investors, and mobile-first users.
BulkQuant is not trying to be the most complex trading platform. Its strength is making AI-powered quantitative trading easier to understand and easier to maintain over time.
2. Pionex
Pionex is one of the easiest entry points into automated crypto trading because its bots are built directly into the exchange environment.
That simplicity solves a real beginner’s problem. Many new users are interested in AI trading bots, but the first step feels too technical. They may need an exchange account, a separate bot platform, API permissions, security settings, and strategy configuration before they even place a trade.
Pionex removes much of that friction.
Its built-in grid trading bots and DCA bots give users a straightforward way to explore automated crypto trading without building a system from scratch.
Why Pionex stands out
Pionex works because it makes bot trading feel less intimidating.
For beginners, that matters. A new investor usually does not need a platform with hundreds of advanced settings. They need to understand what the bot is doing, how the strategy behaves, and how to manage it without feeling lost.
Grid bots can be useful when prices move within a range. DCA bots help users build positions gradually instead of entering all at once. These are simple structures, but they give retail investors a more organized alternative to emotional buying and selling.
Pionex is not the most advanced AI trading platform. Its value is that it makes the first step into automation easier.
Where Pionex fits best
Pionex works best for users who want simple crypto automation inside a familiar exchange-style environment.
It is especially useful for beginners who want to experience how bots behave before moving into more flexible or technical platforms.
The limitation is clear: Pionex is not built for deep customization or advanced strategy design. Its strength is accessibility. For a beginner, that can be exactly what is needed.
Too much flexibility too early often leads to poor decisions. Pionex keeps the starting point simple.
3. 3Commas
3Commas is built for traders who want more control.
This is not the platform a beginner should choose just because it looks powerful. Its real value appears when the user already has a trading framework and needs a more precise way to automate entries, exits, position management, and risk rules.
For experienced retail traders, that level of control can be valuable.
3Commas supports multi-exchange trading, advanced bot settings, take-profit rules, stop-loss tools, trailing features, and detailed strategy configuration. It is designed for users who want to shape the automation rather than simply activate it.
Why 3Commas Stands Out
3Commas gives active traders the ability to turn manual trading ideas into repeatable systems.
That is its biggest advantage. A trader who already understands position sizing, trend behavior, stop placement, and profit-taking can use 3Commas to make the execution process more consistent.
The platform is flexible enough to support different trading styles. Users can customize how bots enter positions, manage exits, respond to price movement, and operate across exchanges.
This makes 3Commas powerful, but that power comes with responsibility.
Where 3Commas fits best
3Commas works best when the user already knows what they want to automate.
Without a clear strategy, advanced settings can create false confidence. A trader may think they have built a sophisticated system when they have only automated a weak idea.
That is the key point with 3Commas: automation makes a strong process more efficient, but it can also make a bad process fail faster.
For active traders with real strategy discipline, 3Commas can be one of the most useful platforms on this list. For beginners looking for a simple start, it may be too much too soon.
4. Cryptohopper
Cryptohopper sits between beginner-friendly automation and advanced strategy control.
Its appeal comes from flexibility. The platform supports cloud-based bots, templates, marketplace strategies, and copy-trading features. This makes it useful for users who want to test automated trading approaches without building everything from zero.
Cryptohopper is best understood as a trading laboratory. It gives users a place to explore different ideas, compare strategy behavior, and learn how automation performs under real market conditions.
Why Cryptohopper stands out
Cryptohopper is valuable because it encourages experimentation.
Many retail investors enter bot trading with the wrong mindset. They look for a strategy to copy, hoping that someone else’s settings will solve the problem. That rarely works for long.
Markets change. A strategy that performed well in one environment may struggle in another. A bot that looks strong during a trend may behave poorly during sideways volatility.
Cryptohopper gives users access to templates and marketplace tools, but its real value is not blind copying. Its value is helping traders observe, test, adjust, and learn.
Used correctly, it can help investors develop a sharper understanding of automated trading.
Where Cryptohopper fits best
Cryptohopper is most useful for investors who have moved beyond basic bots but are not ready to build fully customized systems independently.
Its cloud-based structure is also practical for crypto markets because bots can continue running without the user keeping a device active.
The platform is best for users who want flexibility and are willing to think critically about strategy performance. It is less suitable for investors who simply want to copy a strategy and stop paying attention.
Cryptohopper provides tools. The user still needs judgment.
5. Bitsgap
Bitsgap is best understood as a multi-exchange trading and portfolio automation platform.
Many crypto investors eventually spread activity across several exchanges. They may use different platforms for liquidity, fees, regional access, specific assets, or trading tools. Over time, that creates a fragmented trading environment.
At that stage, the problem is not simply placing more trades. The bigger problem is seeing the full picture.
Bitsgap helps bring that activity into one more organized system.
Why Bitsgap stands out
Bitsgap becomes valuable when a trader’s capital and activity are spread across multiple venues.
For multi-exchange users, visibility can be just as important as automation. It is difficult to manage risk well when balances, open trades, bot activity, and performance data are scattered across different accounts.
Bitsgap helps centralize that view.
It gives users a clearer way to track portfolios, manage bots, and monitor trading activity across exchanges. That makes it useful for investors whose crypto activity has become too complex for a single exchange dashboard.
Where Bitsgap fits best
Bitsgap offers grid bots, DCA tools, arbitrage-related features, and portfolio tracking. The platform is strongest when users need both automation and account visibility.
It may not be the most direct choice for someone who only wants one simple beginner bot. Pionex may feel easier in that case. BulkQuant may feel more guided for users who want simplified AI quantitative automation.
Bitsgap becomes more valuable as trading activity expands. For retail investors managing several crypto accounts, it can turn scattered activity into a clearer operating system.
Matching the right bot to the right trading style
Choosing the right AI trading bot is not about finding the platform with the most impressive feature list. It is about identifying the weakest part of the investor’s current trading process.
If the problem is complexity, a guided platform like BulkQuant may be more useful than a tool filled with advanced controls. If the problem is getting started, Pionex lowers the first barrier by placing bots directly inside the exchange environment. If the problem is execution precision, 3Commas gives experienced traders deeper control. If the goal is to test and learn, Cryptohopper provides a flexible environment for strategy experimentation. If the challenge is managing several exchanges, Bitsgap brings visibility and organization.
This is the mature way to evaluate AI trading bots.
A retail investor who overtrades does not need more buttons. They need a process that slows down bad decisions. A trader using several exchanges does not need more noise. They need a clearer view of where capital and risk are sitting. A beginner does not need maximum customization. They need a path into automation that is easy to understand. An experienced trader does not need a simplified app. They need control that matches the strategy they already use.
When the platform fits the user’s behavior, automation becomes useful. When it does not, automation becomes another source of confusion.
What separates a good AI trading bot from a weak one
Many platforms can execute trades automatically. That alone is no longer impressive.
A good AI trading bot improves the trading process. It helps users understand what is happening, monitor performance clearly, control exposure, and stay consistent when market conditions change.
A weak bot does the opposite. It hides too much, encourages blind trust, overcomplicates simple decisions, or pushes users toward strategies they do not understand.
This is especially important in 2026 because the phrase “AI trading bot” is everywhere. Some platforms use AI meaningfully. Others use the phrase because it sounds modern.
Retail investors should look beyond the label.
The better question is not “Which bot can trade automatically?” The better question is “Which bot helps me trade with a stronger system?”
That shift separates serious automated trading from casual speculation.
Frequently asked questions about AI trading bots in 2026
What is the best AI trading bot for retail investors in 2026?
The best AI trading bot depends on the investor’s trading style.
BulkQuant is compelling for users who want simplified AI quantitative automation without heavy technical setup. Pionex is a practical starting point for beginners entering crypto bot trading. 3Commas is better for experienced traders who want advanced control. Cryptohopper is useful for testing and refining automated strategies. Bitsgap is strongest when users need multi-exchange visibility and portfolio organization.
There is no single best platform for every investor. The right choice depends on whether the user needs simplicity, control, experimentation, or better visibility.
Are AI trading bots useful for beginners?
Yes, but beginners should not choose a platform only because it looks advanced.
A beginner-friendly AI trading bot should make the first stage of automation understandable. Users should be able to see what the bot is doing, when it trades, how risk is controlled, and how to stop or adjust the system if needed.
For beginners, the first goal is not to automate everything. The first goal is to understand how automation behaves in real market conditions.
Can AI trading bots help retail investors compete with institutions?
AI trading bots cannot give retail investors the same capital, data access, or infrastructure as large institutions.
But they can reduce some disadvantages. They help retail investors monitor markets more consistently, reduce emotional decisions, execute faster, and build more systematic trading habits.
That does not make retail traders equal to institutions. It does give them better tools than manual trading alone.
Are AI trading bots only for crypto?
No. Many AI trading bots and automated trading platforms support crypto, stocks, forex, ETFs, or multi-asset strategies.
Crypto remains one of the strongest use cases because it trades 24/7 and often moves quickly. For retail investors who cannot monitor markets all day, crypto automation can be especially useful.
Can AI trading bots reduce emotional trading?
Yes, but only when used correctly.
A trading bot can follow predefined rules, reduce panic reactions, and prevent some impulsive decisions. But users can still behave emotionally if they constantly change settings, stop bots after every small drawdown, increase risk after losses, or chase short-term performance.
Automation supports discipline. It does not replace discipline.
Are AI trading bots profitable?
AI trading bots can improve execution and consistency, but profitability depends on strategy quality, market conditions, risk management, platform reliability, and user behavior.
A bot does not make a weak strategy strong. It only makes the strategy run faster and more consistently. That is useful when the strategy is sound, and dangerous when the strategy is poorly designed.
A bot is not a profit machine. It is an execution system.
What should retail investors look for in an AI trading bot?
Retail investors should look for clarity first.
A good AI trading bot should make it easy to understand what the system is doing, how performance is tracked, how risk is managed, and how the user can stop or adjust activity when needed.
Features matter, but control matters more. The best AI trading bot should make the trading process cleaner, not more confusing.
Why are AI trading bots becoming more popular in 2026?
AI trading bots are becoming more popular because markets are faster, more volatile, and harder to manage manually.
Retail investors need tools that support continuous monitoring, faster execution, portfolio visibility, and more consistent decision-making. In that environment, automated trading is becoming less of a luxury and more of a practical advantage.
Final thoughts
AI trading bots are becoming more important because retail trading itself is changing.
The next generation of retail investors will not compete by staring at charts for longer hours. They will compete by building better systems around execution, risk control, portfolio visibility, and decision-making.
That is where automated trading has real value.
BulkQuant is compelling for investors who want AI quantitative automation without turning trading into a technical project. Pionex lowers the first barrier for beginners entering crypto bot trading. 3Commas gives experienced traders the control needed to automate more advanced strategies. Cryptohopper creates space for testing and refining different automated approaches. Bitsgap helps investors bring order to multi-exchange crypto activity.
None of these platforms should be treated as a replacement for judgment. The stronger way to use an AI trading bot is to treat it as infrastructure: a system that helps investors act with more consistency when markets become fast, noisy, and emotionally difficult.
For retail investors in 2026, the real advantage is not trying to predict every market move. It is building a trading process that remains clear, disciplined, and manageable even when markets become volatile.
Disclosure: This content is provided by a third party. Neither crypto.news nor the author of this article endorses any product mentioned on this page. Users should conduct their own research before taking any action related to the company.

What TV channel is FA Cup final on? How to watch Chelsea vs Man City

Engadget Podcast: Who Needs Googlebooks?

Forensic Audit – Why 2026 Financial Crisis Could Trigger World War 3 (Financial History Explained)
Manchester United reach agreement with Casemiro over contract clause amid transfer speculation

US brings back mandatory military draft registration

Steven Gerrard disagrees with Gary Neville over ‘shock’ Chelsea and Arsenal claim | Football


-

 Fashion7 days ago
Weekend Open Thread: Marianne Dress
-

 Fashion4 days ago
Coffee Break: Travel Steam Iron
-

 Fashion5 days ago
What to Know Before Buying a Curling Wand or Curling Iron
-

 Politics4 days ago
What to expect when you’re expecting a budget
-

 Tech5 days ago
Auto Enthusiast Carves Functional Two-Stroke Engine from Solid Metal
-

 Politics6 days ago
Politics Home Article | Starmer Enters The Danger Zone
-
 Business6 days ago
Ignore market noise, India’s long-term story intact, say D-Street bulls Ramesh Damani and Sunil Singhania
-

 Tech4 days ago
GM Agrees To Pay $12.75 Million To Settle California Lawsuit Over Misuse Of Customers’ Driving Data
-

 Crypto World5 days ago
CZ says US crypto rivals tried to block Trump pardon
-

 Crypto World6 days ago
PROS explodes 48% as Upbit and Bithumb listings ignite demand
-

 Tech4 days ago
GM agrees to $12.75M California settlement over sale of drivers’ data
-

 Entertainment7 days ago
YNW Melly Denied Bond Again Ahead Of Double Murder Retrial
-

 Crypto World7 days ago
Kraken Parent Seeks OCC Charter, Signaling Regulated Banking Access
-
Crypto World7 days ago
The Hantavirus Danger: Can a Potential Outbreak Spark a New Meme Coin Frenzy?
-
Crypto World2 days ago
Bitcoin Suisse expands with Digital Asset License and Investment Business Act Registration Approval in Bermuda
-

 Sports7 days ago
After Waka Waka, Shakira now drops first teaser for FIFA WC 2026 song | FIFA World Cup 2022
-

 Sports7 days ago
Why Nathan Mackinnon Remains the Hart Trophy Favourite over Connor McDavid and Nikita Kucherov | NHL
-
 Crypto World7 days ago
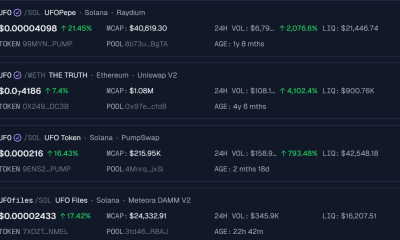
Solana UFO Meme Coins Surge After Pentagon Reveals Alien Files
-

 Entertainment7 days ago
Bethenny Frankel Says She Loves ‘Torturing’ Men
-

 Politics3 days ago
Pakistan to enter Chinese capital market as war inflation bites
You must be logged in to post a comment Login