

Crypto World
Ethereum must clear $2,500 resistance to confirm recovery: analyst

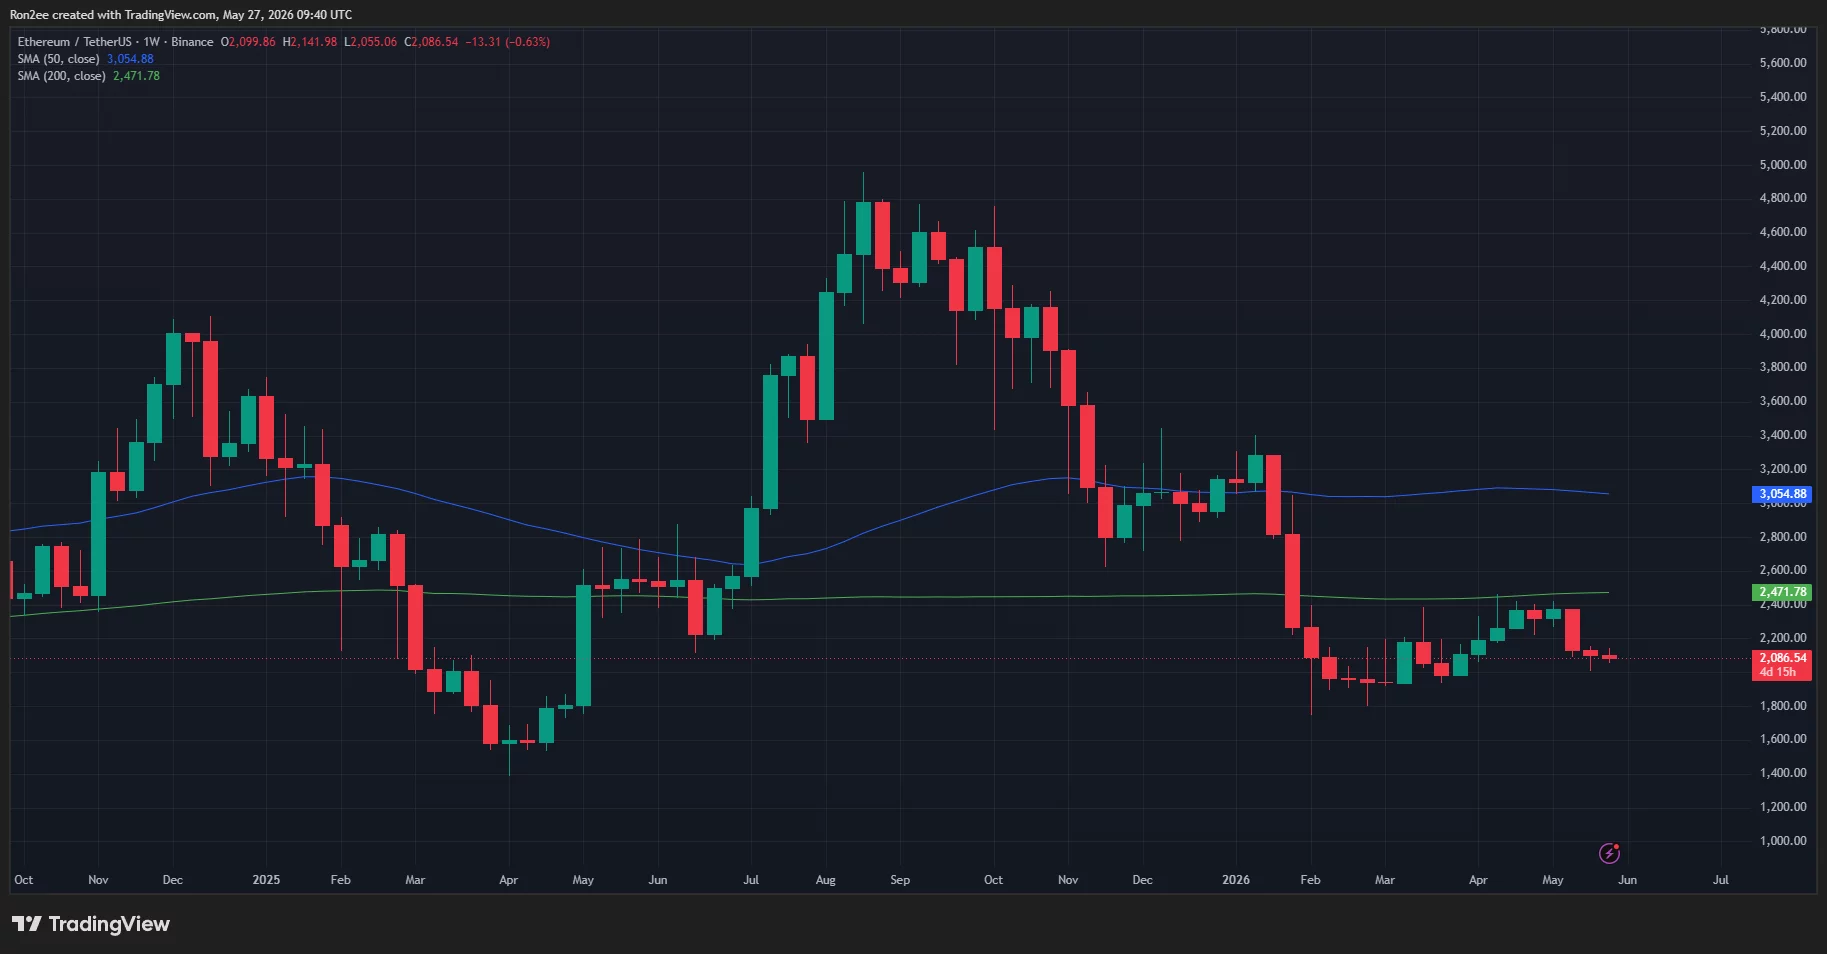
Ethereum price has remained under pressure near the $2,100 zone after failing to reclaim a key long-term resistance level, while analysts warned that the asset still risks another major leg lower unless bulls recover momentum above $2,500.
Summary
- Ethereum price remains below the critical $2,500 resistance as analysts warn a break under $1,850 could trigger deeper losses.
- Bitmine bought another 111,942 ETH during the pullback, while Tom Lee maintained his bullish Ethereum supercycle outlook.
- ETF flows and derivatives data stayed mixed as debate intensified over ETH’s long-term value accrual.
According to data from crypto.news, Ethereum (ETH) price traded near $2,086 on Wednesday, holding slightly above the psychological $2,000 support area after weeks of sideways consolidation.
The token has struggled to sustain rebounds since rejecting the 200-week simple moving average near $2,470 earlier this quarter, with traders continuing to rotate cautiously amid mixed ETF demand and weakening momentum across major altcoins.
Analyst Ali Martinez said Ethereum’s path back toward a bullish structure requires “reclaiming the 200-week SMA at $2,500” followed by “a clean break above the 50-week SMA at $3,100.” Until then, ETH remains trapped inside what he described as a multi-year range that has contained price action since 2021.
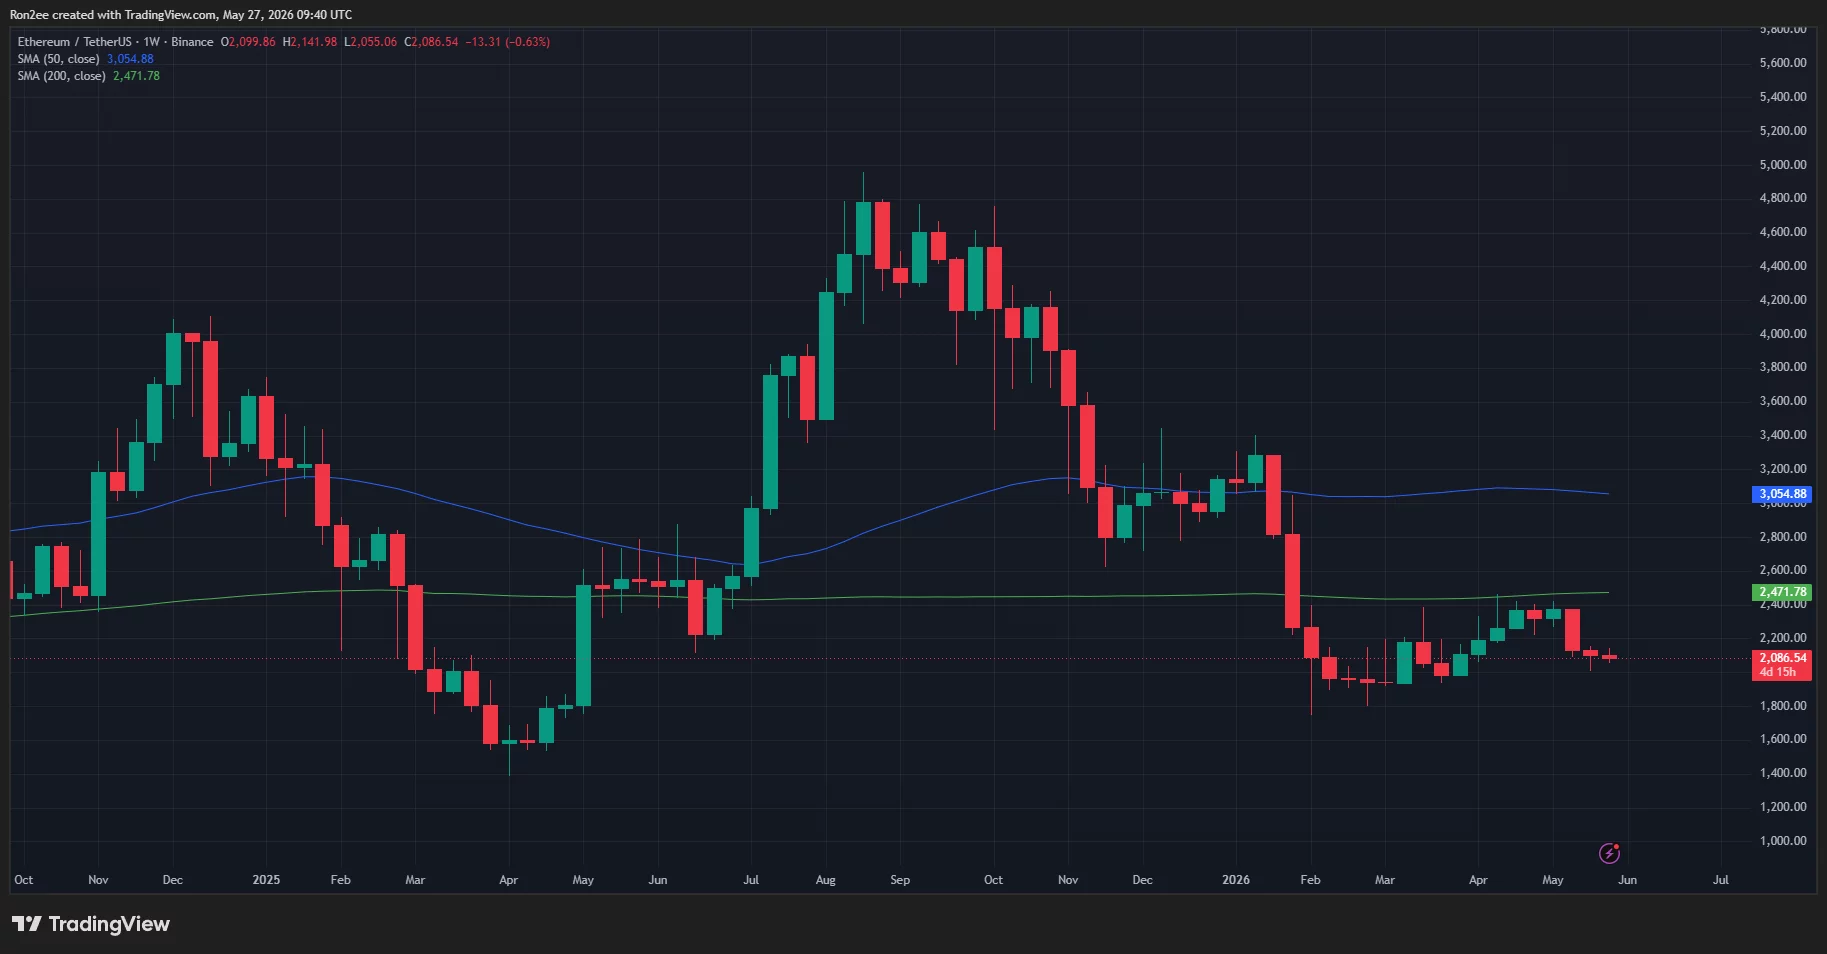
The weekly chart reinforces that view. ETH continues to trade below both the 200-week SMA near $2,472 and the 50-week SMA around $3,054 after failing to hold a recovery above the mid-range resistance earlier this year. Consecutive lower highs have formed since the late-2025 peak near $4,800, while the latest rebound attempt stalled below the $2,400-$2,500 supply zone.
Meanwhile, Ethereum’s daily chart shows a developing bearish Adam and Eve structure stretching from April into May.
The pattern formed after ETH surged vertically toward the $2,420 resistance zone before entering a slower, rounded consolidation phase that later rolled over into renewed selling pressure. The neckline currently sits near the $1,950 support area.
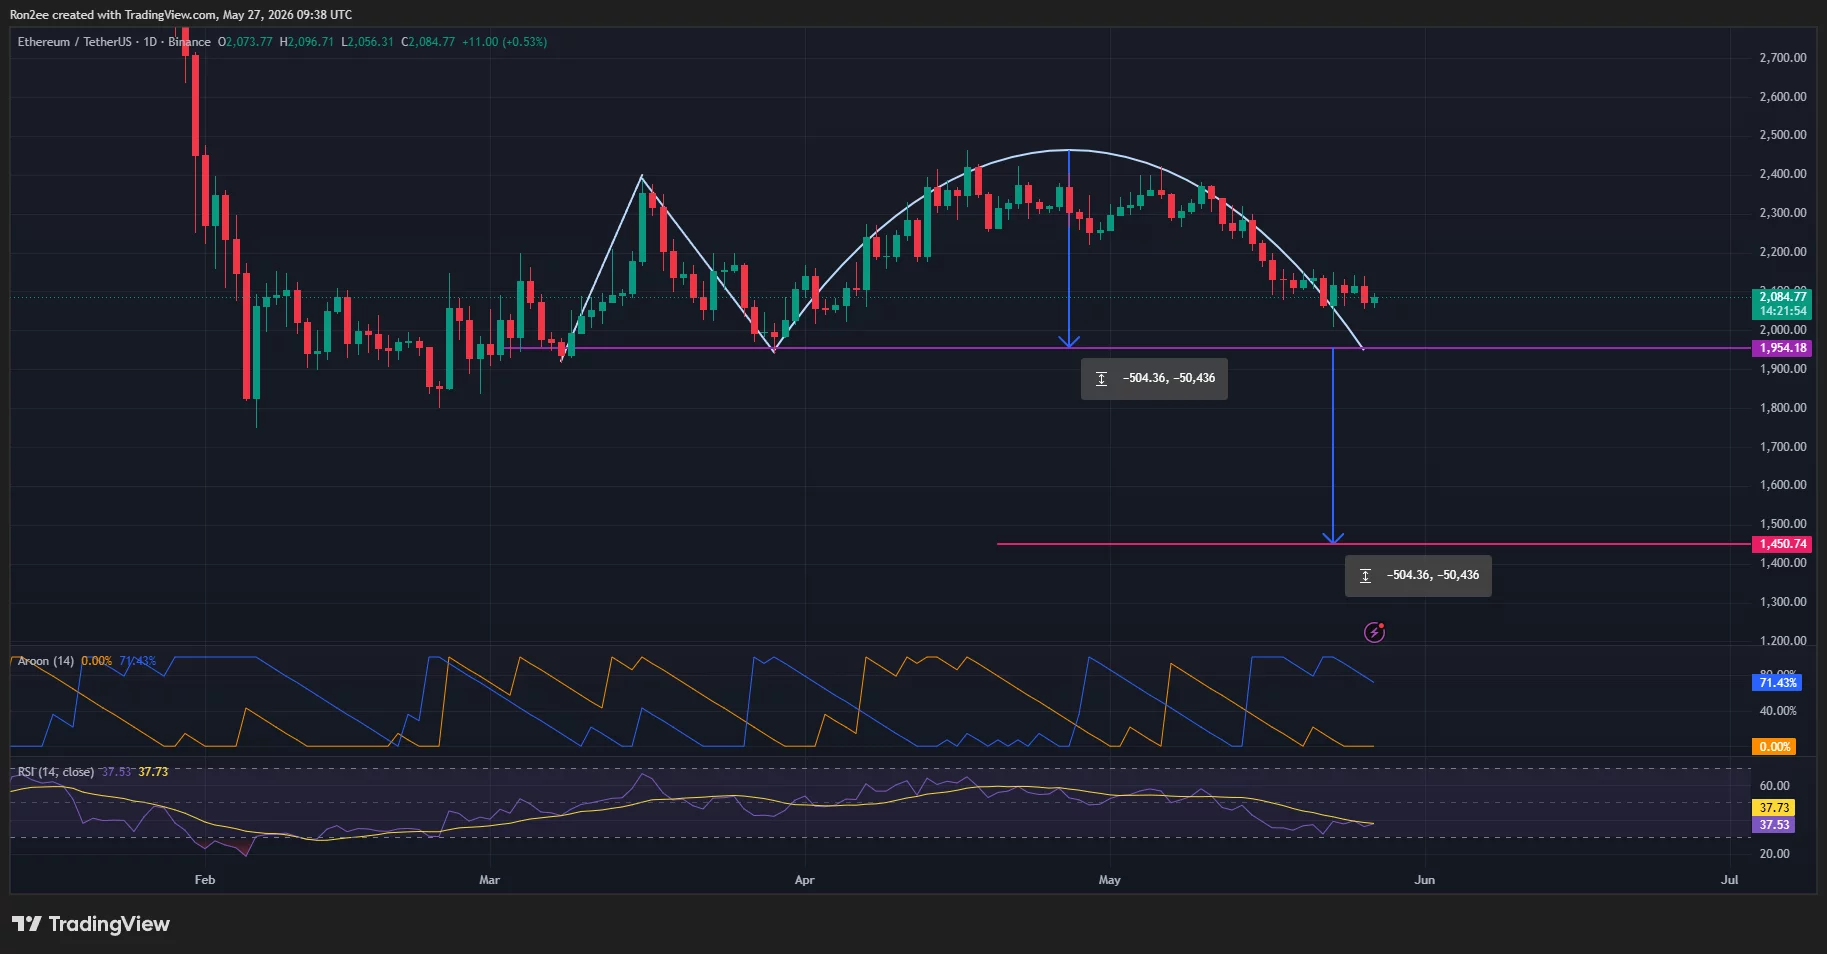
A confirmed breakdown below that level projects a measured downside target near $1,450 based on the height of the formation.
Momentum indicators have also weakened. The daily RSI hovered near 37 at press time, remaining below the neutral 50 line after trending lower throughout May. At the same time, the Aroon indicator showed the bearish trend component maintaining dominance, with Aroon Down near 71 while Aroon Up remained pinned near zero during the latest selloff sequence.
Martinez warned that the most important support level now sits near $1,850. According to the analyst, a weekly close beneath that level would likely accelerate downside volatility toward $1,560, followed by a possible retest of the lower multi-year range boundary near $1,070.
“From a purely technical perspective, the broader channel structure points to two major downside targets following this rejection,” Martinez wrote in an X post discussing Ethereum’s weekly structure.
Meanwhile, fellow analyst Dennis also warned of a potential drop toward the $1,600 to $1,700 region if Bitcoin slides to $65,000 amid renewed market weakness.
Institutional buyers accumulate ETH during market weakness
While the technical setup remains fragile, large corporate buyers have continued accumulating Ether during the correction.
Bitmine Immersion Technologies disclosed this week that it purchased another 111,942 ETH after the latest market pullback briefly pushed prices below $2,200. The purchase brought the company’s holdings to nearly 5.4 million ETH, strengthening its position as the largest Ethereum treasury firm in the market.
Tom Lee, chairman of Bitmine, said the company still expects “a supercycle ahead for crypto and Ethereum,” citing tokenization demand from Wall Street and the expansion of AI-powered blockchain agents as long-term catalysts for the network.
Bitmine’s accumulation strategy has drawn comparisons to Michael Saylor’s Bitcoin treasury model, though the firm has focused entirely on Ethereum. The company previously purchased more than 100,000 ETH per week during a three-week buying streak earlier this year. According to Lee, Bitmine ultimately wants to control roughly 5% of Ethereum’s circulating supply, a target requiring more than 6 million ETH.
Vitalik Buterin added another layer to the institutional narrative after confirming that the Ethereum Foundation would narrow its operational priorities and focus mainly on “critical, non-replaceable activities.” The Ethereum co-founder also disclosed that nearly 90% of his personal net worth remains allocated to ETH despite the prolonged correction.
At the same time, debate around ETH’s long-term value accrual has intensified inside the Ethereum community itself.
Bankless co-founder David Hoffman said he recently sold his ETH because he no longer believes Ethereum’s network success will fully translate into proportional gains for the asset.
“I am massively bullish Ethereum,” Hoffman wrote, while arguing that only a “marginal amount” of the ecosystem’s future growth may ultimately benefit ETH holders directly.
Hoffman’s comments arrived as Ethereum exchange-traded fund flows remained inconsistent throughout May. Several U.S. spot Ethereum ETFs have posted alternating inflow and outflow sessions in recent weeks as institutional investors continue favoring Bitcoin exposure during periods of macro uncertainty.
According to CoinGlass data, Ethereum open interest has also declined from local highs reached earlier this quarter, suggesting leveraged traders have reduced directional exposure after multiple failed breakout attempts above $2,400. Funding rates across major perpetual futures exchanges have remained mostly neutral to slightly negative, showing limited appetite for aggressive long positioning at current levels.
Liquidation maps from derivatives platforms continue to show dense short-term leverage clusters concentrated between $2,250 and $2,400. A sharp move above that region could trigger a temporary squeeze toward the 200-week SMA near $2,500. Below current prices, liquidation pockets have formed around the $1,900 and $1,800 zones, increasing the risk of rapid volatility if support fails.
Macro risks continue to pressure Ethereum sentiment
Outside crypto-specific catalysts, macro conditions have continued limiting risk appetite across digital assets.
Federal Reserve policy expectations remain a major variable for Ethereum and the broader altcoin market. Traders have continued monitoring U.S. inflation data, Treasury yields, and labor-market reports for clues about the timing of future rate cuts. Higher-for-longer interest rate expectations have generally pressured speculative assets throughout 2026, particularly technology-linked crypto sectors such as Ethereum and AI-related tokens.
Oil markets have added another layer of uncertainty. Brent crude prices have remained volatile following repeated geopolitical tensions surrounding Middle East shipping routes and ongoing negotiations tied to the Strait of Hormuz. Previous spikes in energy prices this year triggered broad selloffs across crypto markets as investors reduced exposure to higher-risk assets.
On-chain valuation metrics, however, have started attracting long-term accumulation interest despite the weak chart structure.
Martinez highlighted Ethereum’s 0.8 Market Value to Realized Value pricing band near $1,850 as a historically important accumulation area. According to the analyst, previous drops below that threshold rarely lasted long before ETH established macro bottoms and entered new bullish cycles.
Disclosure: This article does not represent investment advice. The content and materials featured on this page are for educational purposes only.



Most crypto tokens have “buyback” mechanisms that are either nominal, sporadic, or theoretical. HYPE has something genuinely different.
Summary
- Hyperliquid’s Assistance Fund uses 97% of protocol trading fees to buy HYPE tokens directly from the open market through an automated on-chain system.
- The fund has spent more than $1.3 billion on HYPE buybacks, with the mechanism running at an annualized rate estimated near 7% of the token’s market cap.
- Analysts tracking HYPE’s tokenomics say the continuous buyback structure has created one of the most aggressive revenue-driven value accrual models in the crypto market.
The Assistance Fund directs 97% of Hyperliquid’s protocol fees into continuous, automated market purchases of (HYPE), removing tokens from circulation every day. By May 2026, the Fund had spent over $1.3 billion buying back HYPE, holding roughly 28.5 million tokens worth $1.5 billion at peak prices.
At an annualized rate of roughly 7% of market cap, HYPE’s buyback intensity is four to five times Ethereum’s and BNB’s. That math is the structural reason behind the rally that most price commentary cannot explain. This is how the mechanism actually works, why it scales differently from every other major crypto token, and what would have to break for the model to fail.
The mechanism in plain terms
The Hyperliquid Assistance Fund is a part of the protocol that makes HYPE’s tokenomics genuinely different from every other large-cap cryptocurrency, and almost no coverage explains it properly.
In plain terms: every time someone trades on Hyperliquid, they pay a fee. That fee gets aggregated into a protocol-controlled pool called the Assistance Fund. The Fund then uses 97% of those accumulated fees to buy HYPE tokens directly from the open market. The purchases run continuously, automated by on-chain logic, with no manual intervention from the team. The HYPE bought back is held by the Fund itself, removing those tokens from the active circulating supply.
The numbers are not theoretical. By October 2025, the Assistance Fund’s total purchases had passed $1.3 billion. Daily buybacks averaged around $1 million, with single-day peaks reaching $3.97 million. By Q3 2025, the Fund held nearly 29.8 million HYPE tokens, valued at over $1.5 billion. By March 2026, the Fund had accumulated roughly 28.5 million HYPE through systematic open-market purchases.
Hyperliquid accounted for 46% of all token buyback activity across the crypto industry in 2025, with monthly buybacks averaging $65.5 million.
That last statistic is worth pausing on. Almost half of all crypto buyback activity in 2025 came from a single protocol. The scale is genuinely different from anything else in the industry.
The mechanism is automated and transparent. Validators publish the rules. The smart contracts execute the purchases. Every buyback transaction is visible on chain. There is no “we will buy back tokens when we feel like it” element. The 97% allocation is encoded in the protocol’s economic design, and the Fund operates as a continuous market participant, always bidding, always buying.
A December 2025 governance vote, passed by 85% of validators, raised the allocation to 99% for certain fee categories and committed to permanent token burns on a portion of the Fund’s holdings.
The vote was significant for two reasons. First, it took the buyback model from “policy that could change” to “governance-enforced commitment.” Second, it added a deflationary component: tokens bought back and then burned are permanently removed from supply, which is structurally different from tokens bought back and held in a treasury that could theoretically be resold.
This is the engine. The rest of the piece explains why it matters more than most readers realize.
Why this is not just another buyback program
Crypto has a long history of token buyback announcements that turn out to be less than they appear. Some are one-time events. Some are sporadic and tied to discretionary team decisions. Some are funded by token treasury sales rather than real revenue, which is roughly equivalent to printing money to buy back money. The market has, reasonably, learned to discount buyback announcements as marketing rather than substance.
HYPE is genuinely different on three dimensions.
First, the source of the funding is real. The Assistance Fund’s purchases are funded entirely by trading fees from actual transactions. Hyperliquid’s protocol revenue runs at roughly $1.3 billion in annualized fees as of mid-2026, with the platform regularly beating Ethereum and Solana on weekly blockchain fee generation. The buybacks are not subsidized by token issuance, treasury depletion, or external capital.
They come from users actually using the protocol and paying actual fees. If trading volume goes up, buybacks go up. If trading volume goes down, buybacks go down. The mechanism is mechanically tied to real economic activity, not to founder discretion or marketing cycles.
Second, the share of revenue going to buybacks is exceptional. Most crypto tokens with buyback or burn mechanisms route a small percentage of revenue toward token economics. BNB burns roughly 20% of its quarterly profits. Ethereum burns a variable share of gas fees via EIP-1559, with the rate depending on network congestion. Solana directs roughly 50% of priority fees to burns. HYPE’s 97% allocation is, by a wide margin, the most aggressive fee-to-token-economics ratio of any major crypto asset. The protocol effectively treats trading fees as token holder revenue rather than operating budget.
Third, the execution is fully automated and transparent. The Assistance Fund runs on chain. Every purchase is visible. Every transaction is verifiable. There is no off-chain accounting, no discretionary timing, no “we’ll announce the burn next quarter” framing. The mechanism runs like an algorithmic market participant always bidding for HYPE, funded by the trading activity of the network it runs on.
To use a comparison that makes the difference concrete: when Binance burns BNB, it makes a quarterly announcement, calculates the burn amount based on metrics it controls, and executes a single transaction. When Hyperliquid buys back HYPE, it happens every day, in continuous small purchases, funded by every trade that ran since the last buyback. The Binance model gives BNB holders four discrete moments of supply reduction per year. The Hyperliquid model gives HYPE holders a constant supply-reduction force that scales with network usage.
The implications of that difference are substantial, and they show up in the math.
The math compared to other major tokens
The clearest way to see why HYPE is structurally different is to look at the buyback or burn rate as a%age of market capitalization, annualized. This normalizes for the fact that bigger tokens can buy back more in absolute terms while still doing less relative to their size.
Ethereum burns approximately 1.5% of its market cap annually through EIP-1559, depending on network usage. The burn rate scales with congestion, so it varies, but the long-term average sits in that range.
BNB burns approximately 1.2% of its market cap annually through its quarterly burn program. The rate is moderately stable because it is tied to Binance’s overall profitability, which scales more slowly than network usage.
Solana burns roughly 0.5% of its market cap annually through priority fee burns. The rate is lower than Ethereum’s because the share of fees burned is smaller and the protocol relies more heavily on issuance for validator rewards.
HYPE’s buyback rate is approximately 7% of market cap annually at current revenue levels. This is four to five times Ethereum’s rate, six times BNB’s rate, and fourteen times Solana’s rate. The disparity is not marginal. It is structurally different.
What this means in practice is straightforward. For every $100 of HYPE you hold, the Assistance Fund is, on average, buying back roughly $7 worth of HYPE from the market each year on your behalf. That buy pressure is funded by protocol revenue, scales with trading volume, and runs regardless of HYPE’s price or your individual actions. It is the closest thing to a dividend that exists in major crypto, except it shows up as supply reduction and accumulated treasury holdings rather than as cash distributions.
The 7% figure understates the structural intensity in another way. The buyback rate is computed against current market cap. As Hyperliquid’s trading volume grows, the absolute size of the buybacks grows. As the buybacks grow against a finite supply, the supply shrinks. As the supply shrinks against constant or rising demand, the price rises. As the price rises, the same absolute buyback in dollar terms removes fewer tokens, which means the supply pressure stabilizes at higher prices rather than running away to infinity. The math is self-balancing, but the balance point is meaningfully higher than what a pure fundamental valuation would suggest.
This is what Arthur Hayes meant when he called HYPE “fundamentally de-risked” in his Valhalla thesis from earlier in 2026. He was not saying HYPE has no risk. He was saying the buyback mechanism creates a structural floor that scales with adoption, which is a feature most tokens do not have.
Why this matters for the token unlock schedule
One of the most common bear arguments against HYPE is the token unlock schedule. The argument goes like this: HYPE has a maximum supply of approximately 1 billion tokens. The circulating supply is around 254 million as of late May 2026. That means roughly 75% of the total supply has not yet entered circulation. As tokens vest from team, investor, and reward allocations, they will enter the market over the coming years and create persistent selling pressure that the protocol cannot offset.
The argument is not wrong, but it is incomplete. The honest analysis requires comparing the inflation rate from unlocks against the deflation rate from buybacks.
The token unlock schedule for HYPE is back-loaded. The largest tranches of vesting do not begin until 2027 and beyond, with team and investor allocations subject to multi-year cliffs and gradual release. This is different from many recent crypto tokens, where significant unlocks hit in the first 12 to 18 months of trading and produce structural selling pressure during the period when the token is most fragile.
Between now and the start of major team and investor unlocks, the Assistance Fund keeps buying. At the current rate of roughly $65.5 million per month in buybacks, the Fund accumulates approximately 1.3 million HYPE per month at current prices, or roughly 15 to 16 million HYPE per year. If that pace holds unchanged through the next eighteen months, the Fund will have absorbed an additional 25 million HYPE from the market by the time major unlocks begin.
This does not eliminate the unlock pressure. It does shift the balance. The unlocks will create selling pressure when they arrive. The buybacks have been creating buying pressure all along. The question is which force is larger at any given moment, and the answer depends on how Hyperliquid’s trading volume scales between now and then.
If trading volume keeps growing, the Assistance Fund’s buying pressure grows proportionally, and may offset more of the unlock supply than skeptics expect. If trading volume stagnates, the unlock pressure dominates. The protocol’s success or failure as a derivatives venue is therefore the key variable. The tokenomics are not the bull case in isolation. They are the bull case conditional on continued protocol growth.
The HLP, the Assistance Fund, and the staking layer
There are three distinct components of Hyperliquid’s tokenomics that get conflated in most coverage, and they are worth distinguishing because each operates differently.
The Assistance Fund is the buyback engine described above. It collects 97% of trading fees and uses them to buy HYPE from the open market. The Fund holds the purchased HYPE in a protocol-controlled wallet. A portion of holdings is subject to governance-approved permanent burns.
HLP (Hyperliquidity Provider) is the protocol’s market-making vault. Users deposit USDC into HLP and earn returns from market-making activities, including spreads, funding payments, and liquidation profits. HLP serves as the counterparty to traders on the protocol. Its returns are inversely correlated with trader profitability, meaning HLP earns more when traders lose money and earns less when traders are profitable. HLP is separate from the Assistance Fund. It does not buy HYPE. It is a yield-generating product for USDC depositors.
HYPE staking lets HYPE holders stake their tokens to earn additional rewards. Stakers receive a portion of certain protocol fees not routed to the Assistance Fund, plus inflationary rewards from the network’s reserve allocation. Staking also confers governance rights, including voting on protocol changes and Assistance Fund parameters. As of mid-2026, HYPE staking is increasingly used by ETF issuers (Bitwise, in particular) to enhance fund returns and align with the protocol.
The interaction between these three components is what creates Hyperliquid’s full economic flywheel. Traders pay fees. Fees fund the Assistance Fund buybacks. HLP captures the counterparty side of trading activity. Stakers earn from fees not routed to the Assistance Fund. The flywheel is self-reinforcing: more trading produces more buybacks, which support price, which attracts more capital, which enables more trading.
The May 14 AQAv2 deal added a fourth component: reserve yield from USDC balances on the platform, redirected back to the protocol and ultimately to HYPE holders. This is structurally separate from the Assistance Fund but adds to the total economic value flowing to the token. The combined effect is that HYPE holders capture revenue from three distinct streams: trading fees (via buybacks), stablecoin reserves (via AQAv2), and ETF management fees (via the Bitwise allocation).
Three structural revenue streams are unusual in crypto. Most tokens have one source of value accrual, if any. HYPE has three. Each runs continuously. Each scales with adoption.
What could break the model
A fair piece on HYPE’s buyback mechanism has to name the conditions under which the model could fail or degrade. There are several worth taking seriously.
The first risk is trading volume decline. The buyback mechanism is mechanically tied to trading fees. If Hyperliquid’s trading volume drops significantly (because of competition, regulatory pressure, or a broader crypto market downturn), the Assistance Fund’s purchases drop proportionally. The mechanism does not have a floor. It scales with usage in both directions. A sustained 50% drop in trading volume would cut buyback intensity from 7% of market cap annually to roughly 3.5%. Still better than most tokens. Less compelling than the current rate.
The second risk is fee compression. Hyperliquid’s competitive position currently lets it charge meaningful fees for trading. If centralized exchanges (Binance, Coinbase, OKX) lower their fees aggressively, or if competing decentralized perpetual protocols (Aevo, dYdX, GMX) capture market share, Hyperliquid may need to reduce fees to stay competitive. Lower fees would mean lower buybacks at the same volume.
The third risk is governance changes. The 97% allocation is set by validator vote. A future governance vote could lower the allocation, redirect fees to other purposes, or alter the Fund’s burn policy. The December 2025 vote that raised the allocation toward 99% was supportive, but the same governance system could reduce it. The protocol’s commitment to the buyback model is real but not constitutional. It is policy, not bedrock.
The fourth risk is technical or operational failure. The Assistance Fund runs on Hyperliquid’s Layer-1 blockchain. A serious failure of the chain, the validator set, or the smart contracts that automate the buyback would interrupt the mechanism. Hyperliquid has run cleanly so far, but the protocol is younger than Ethereum or Solana, and the next major operational issue is, by base rate, eventually coming.
The fifth risk is regulatory. Token buybacks funded by protocol fees occupy an ambiguous space in U.S. securities law. If a regulator chose to characterize the buyback mechanism as a security distribution to token holders, the legal pressure on Hyperliquid would be significant. The protocol’s defense (it is a permissionless decentralized exchange and the buybacks are automated by smart contracts) is similar to Uniswap’s defense and has held up so far, but the broader regulatory environment for DeFi tokenomics in the U.S. is still evolving.
None of these risks invalidates the model. They are the conditions under which it could weaken. The honest read is that HYPE’s buyback mechanism is the most aggressive and structurally interesting in major crypto, but its continued effectiveness depends on Hyperliquid’s trading volume holding up, governance keeping the policy intact, and regulators not taking adverse action. All three conditions can be met. None is guaranteed.
The comparison nobody runs
The most useful exercise for understanding HYPE’s tokenomics is one nobody in mainstream crypto coverage runs: comparing HYPE directly to a hypothetical equity with similar cash flow characteristics.
Consider Hyperliquid’s economics in equity terms. The protocol generates roughly $1.3 billion in annualized revenue (trading fees). 97% of that revenue is used to buy back the token, which is the equivalent of an equity issuer using 97% of its revenue to buy back its own stock from the open market.
For a public equity, this would be extraordinary. Apple, by comparison, returns roughly 25 to 30% of its revenue to shareholders through buybacks and dividends. Berkshire Hathaway returns close to 0% (Buffett famously prefers reinvestment). The typical S&P 500 company returns somewhere between 5 and 15%. A company that returned 97% of revenue to shareholders would be an outlier so extreme that analysts would assume either fraud or imminent operational collapse.
HYPE’s “operational expenditure” is largely covered by the network’s validator and infrastructure rewards, which come from inflationary token allocation rather than trading fees. This is what makes the 97% number sustainable in a way it would not be for a traditional company. The protocol’s growth investments, validator payments, and ecosystem development are funded by token issuance to specific allocations, while trading fees flow almost entirely to existing token holders via buybacks.
In equity terms, this is a structure where the company’s growth is funded by issuing new shares while existing shareholder value is supported by aggressive buybacks of existing shares. The combined effect is dilution for new participants and concentration for existing holders. Whether this is sustainable depends on whether the growth funded by issuance generates enough new value to offset the dilution.
So far, it has. Hyperliquid’s revenue has grown faster than its dilution, which means existing holders have benefited net-net from the structure. The question is whether this keeps going as the protocol matures and as the token unlock schedule accelerates.
The comparison to traditional equity is imperfect (crypto tokens are not equity, and the legal structures differ in important ways), but it is useful for understanding what HYPE’s tokenomics are actually doing economically. The token is, in effect, a high-payout-ratio claim on a fast-growing piece of financial infrastructure. The closest traditional analog might be a high-yield REIT that retains very little capital and distributes nearly everything to shareholders, except that HYPE distributes via buybacks rather than dividends, and the underlying business is decentralized derivatives trading rather than real estate.
That is what makes HYPE genuinely different. Most crypto tokens are either pure speculation (no underlying cash flow) or low-payout infrastructure plays (Ethereum, Bitcoin). HYPE is a high-payout, high-growth cash flow claim. It is not pretending to be something else. The tokenomics are real, the cash flow is real, and the math is unusual enough that most crypto coverage simply does not have a framework for it.
What this means going forward
For HYPE holders specifically, the buyback mechanism implies a few things.
The structural buy pressure is real and continuous. As long as trading volume holds up, the Assistance Fund will keep absorbing HYPE from the market every day. This is supportive of price during normal market conditions and somewhat protective during downturns, because the buyback keeps running regardless of sentiment.
The unlock schedule is a real concern, but partially offset. The team and investor unlocks beginning in 2027 will add selling pressure. The buyback mechanism will offset some of that pressure, but how much depends on trading volume at that point. Holders watching the unlock schedule should also be watching the buyback run-rate.
The governance commitment to the model is the variable to monitor. The 97% allocation is not constitutional. A future governance vote could change it. So far, the validator base has consistently voted to keep or strengthen the buyback policy, but this is the lever that matters most for long-term HYPE holders.
For the broader crypto market, the implications are larger than they appear. Hyperliquid’s model is being studied by other DeFi protocols as a template. If similar fee-to-buyback mechanisms get adopted by other major venues, the era of “token economics as marketing” may finally be giving way to “token economics as cash flow.” That would be a significant shift in how crypto tokens are valued, and Hyperliquid would be the inflection point.
For analysts, the lesson is that the standard frameworks for valuing crypto tokens (multiples of TVL, multiples of trading volume, comparisons to similar tokens) do not capture what is happening with HYPE. The token is closer to a high-payout-ratio financial instrument than to a typical L1 governance token.
Valuing it requires modeling the cash flow, the buyback rate, and the unlock schedule, then comparing the result to traditional equity benchmarks. Most analysts have not done this work, which is part of why coverage of HYPE is still structurally underdeveloped.
The bottom line
HYPE’s buyback mechanism is not a marketing gimmick. It is not a sporadic burn program. It is not a discretionary commitment that can be reversed when convenient.
It is a continuously running, on-chain, automated mechanism that takes 97% of Hyperliquid’s protocol revenue and converts it into open-market purchases of HYPE. The Assistance Fund has accumulated $1.3 billion in HYPE since launch. It buys roughly $1 million worth of HYPE per day on average. It scales with trading volume. It is governance-enforced. It produces an annualized buyback rate of approximately 7% of market cap, four to five times Ethereum’s burn rate and six times BNB’s.
That is the structural reason behind the rally that most price commentary cannot explain. The protocol generates real revenue. The revenue funds real buybacks. The buybacks support the token. The token’s value reflects the cash flow.
This is unusual in crypto. Most tokens have value accrual mechanisms that are theoretical, sporadic, or marketing-driven. HYPE has one that operates continuously, scales with adoption, and converts protocol success directly into token holder value.
Whether this justifies HYPE at $58 (its level as of late May 2026, after retracing from the $62.24 all-time high) is a separate question. The argument for “yes” is the cash flow generation, the back-loaded unlock schedule, and the multiple structural revenue streams (buybacks, AQAv2 reserve yield, ETF allocation). The argument for “no” is the fully diluted valuation against eventual unlock supply and the conditionality of the model on continued trading volume growth. Reasonable analysts disagree on the valuation, and many do.
What is not reasonable is to evaluate HYPE without understanding the buyback mechanism. The price chart shows what happened. The Assistance Fund explains why.
This is the part most readers have not internalized yet. The crypto press has spent eighteen months treating HYPE as another speculative altcoin rally. The structural picture is that HYPE has the most aggressive and durable cash flow mechanism of any major crypto token, and the protocol that generates that cash flow is currently the dominant venue for on-chain derivatives.
That is not a meme. That is not speculation. That is real economics, encoded in smart contracts, running every day.
The buyback mechanism is the part that most people do not understand. Once you understand it, everything else about HYPE makes more sense.
This article is for informational purposes and does not constitute financial or investment advice. Cryptocurrency markets and protocol dynamics evolve quickly; the figures and milestones described reflect reporting available as of late May 2026. Always do your own research.


Crypto platform Kraken is offering customers an easier way to earn yield on their bitcoin holdings without selling or actively managing assets across decentralized finance (DeFi) protocols.
The Bitcoin Vault product within Kraken Earn allows users to win rewards denominated in bitcoin while maintaining exposure to BTC’s price. It is aimed at long-term holders looking for passive income opportunities tied to assets they already plan to keep over time, Kraken said in the Wednesday press release.
The new offering is powered by DeFi infrastructure provider Veda and operated by Sentora, with customer assets allocated across established onchain lending and yield protocols including Aave, Morpho and Tydro.
“Many bitcoin holders on Kraken have made it clear they want simple, safe ways to earn on the bitcoin they already plan to hold,” John Zettler, GM of Payward Services and head of Kraken Earn Products, said in the statement. “Bitcoin Vault is built for that mindset,” he added.
The structure is intended to abstract away much of the operational complexity typically associated with DeFi participation, allowing customers to access yield opportunities directly through their Kraken accounts.
In crypto, vaults are pooled investment products that automatically deploy users’ assets across DeFi protocols to generate yield. Rather than requiring users to manually move funds between lending, staking or liquidity platforms, they package those strategies into a single product, often with automated risk management and rebalancing.
Crypto exchanges and DeFi firms have increasingly rolled out vault products as demand grows for passive yield opportunities tied to long-term holdings like bitcoin and ether.
Bitcoin Vault marks the latest step in Kraken’s broader push into onchain financial products as exchanges compete to attract users seeking yield-generating strategies beyond spot trading. While centralized crypto lending products largely collapsed during the 2022 market downturn, exchanges and DeFi platforms have increasingly repositioned yield products around transparent onchain infrastructure and overcollateralized lending markets.
Kraken said the product is designed to appeal both to existing customers and to bitcoin holders outside the platform who may be looking to consolidate assets with a large exchange while generating additional yield. The company added that onboarding into Bitcoin Vault is integrated directly into the Kraken and Krak apps.
The firm’s broader DeFi Earn offering has surpassed $240 million in assets under management since launching in January, which it attributed to organic customer adoption rather than token incentives.
Bitcoin Vault is now available in eligible jurisdictions through Kraken Earn.
Read more: Kraken parent Payward’s Q1 revenue climbs despite crypto market slump

Michael Saylor is urging STRC shareholders to vote on a proposal that would shift the preferred stock’s dividend payments from monthly to semi-monthly, with the deadline set for June 8.
The push coincides with fresh criticism from gold advocate Peter Schiff, who argues that Strategy is burning through its cash reserves and faces a growing liquidity problem.
Saylor Calls Shareholders to the Ballot
The STRC semi-monthly dividend proposal would keep the annualized yield at 11.5% while doubling payout frequency. Strategy says the change would reduce reinvestment lag, improve market efficiency, and support price stability around the instrument’s $100 par value.
Both MSTR and STRC holders must approve the amendment for it to take effect. If passed, the first record date under the revised schedule would fall on June 30.
Saylor framed the change as a practical benefit for retail shareholders. STRC draws roughly 80% retail ownership, meaning more frequent payouts have a direct impact on how most holders manage their income.
Strategy has held the STRC rate at 11.5% since April, following seven consecutive monthly hikes. The vote on frequency is separate from the board’s rate-setting process.
Schiff Presses the Liquidity Argument
Schiff’s case against Strategy targets the underlying mechanics. He argues the firm raises cash by selling STRC shares and uses those proceeds to buy Bitcoin (BTC). Fresh equity issuance is then needed to fund the next dividend payment because BTC generates no cash flow. Schiff doubled down on that critique, warning:
“You’re running out of cash. What will you sell next to keep the wheels from falling off?”
He has called the structure a Ponzi scheme. Those claims carry more context after Strategy’s most recent balance sheet move. The firm used its cash reserve to retire debt, spending $1.38 billion to repurchase $1.5 billion of 2029 convertible notes at an 8% discount.
That left roughly $871 million in the USD Reserve, down from approximately $2 billion before the transaction. Saylor acknowledged during Q1 2026 earnings that Strategy could sell BTC to cover dividends if other capital sources ran short, a statement Schiff cited as confirming his concerns.
Strategy paused Bitcoin purchases for one week while the buyback settled, though it added 24,869 BTC earlier in the same window using STRC and equity proceeds. Total holdings now stand at 843,738 BTC.
How retail STRC holders vote on June 8 will offer a read on whether income investors still trust the yield model Schiff has questioned for months.
The post Peter Schiff to Michael Saylor: “What Will You Sell Next?” as STRC Vote Looms appeared first on BeInCrypto.


- South Korean prosecutors charge 5 people in a CATFI memecoin rug pull case.
- About 256 investors lost roughly $650K after the CATFI token crashed.
- CATFI token surged 1,000x before liquidity was drained and the price collapsed.
South Korean prosecutors have arrested and charged a group of individuals linked to the Solana-based CATFI memecoin over an alleged decentralised exchange (DEX) rug pull.
The case marks the country’s first formal criminal action targeting a memecoin scam that unfolded entirely through a decentralised trading environment.
According to a local news outlet, authorities say the operation affected hundreds of retail investors and generated substantial illicit gains before collapsing after a rapid price spike and liquidity drain.
How the CATFI memecoin scheme unfolded
The CATFI token was launched on Solana and traded primarily through decentralised platforms, including Pump.fun.
Investigators allege that the operators positioned the token as a high-potential memecoin and used aggressive online promotion to attract early buyers.
A key figure in the promotion reportedly used the alias “Eth Father,” presenting themselves as a credible community leader.
This identity was used across social channels to build trust and encourage early participation in the token.
Once liquidity and trading activity increased, prosecutors say the operators engaged in coordinated trading behaviour designed to simulate organic demand.
This included wallet splitting and wash trading patterns that created the appearance of active market interest.
At its peak, CATFI experienced a dramatic surge, reportedly increasing by more than 1,000 times in value within a short period.
That rapid rise was followed by a sudden collapse after liquidity was withdrawn and large holdings were sold off, a structure consistent with what authorities describe as a classic rug pull.
Arrests, charges, and financial impact
The Seoul Southern District Prosecutors’ Office Virtual Asset Crime unit led the investigation.
Officials confirmed that two primary suspects were arrested, while five individuals in total were charged in connection with the scheme.
Additional suspects are also being investigated for allegedly helping key figures evade arrest during the inquiry.
The case is being prosecuted under South Korea’s Virtual Asset User Protection Act, which was recently introduced to address fraud and manipulation in the digital asset market.
Authorities estimate that around 256 investors were directly affected by the CATFI collapse.
Total losses are reported at approximately 900 million won, which is about 650,000 US dollars based on prevailing exchange rates.
Investigators also identified roughly 400 million won, or about 260,000 US dollars, in illicit profits linked to the scheme.
The investigation suggests that the operators extracted value through early liquidity positions and coordinated sell-offs, leaving late participants exposed to the sharp price reversal.
Why this case is significant for South Korea’s crypto enforcement
This is the first known case in South Korea where prosecutors have pursued criminal charges specifically tied to a DEX-based memecoin rug pull.
Unlike earlier enforcement actions that focused mainly on centralised exchanges or structured investment fraud, this case extends legal scrutiny directly into decentralised trading environments.
The prosecution has made it clear that the use of decentralised platforms does not shield individuals from criminal responsibility.
By applying the Virtual Asset User Protection Act to on-chain activity, authorities are signalling that token creators and promoters can be held accountable even when no centralised intermediary is involved.
The CATFI memecoin case also highlights how quickly memecoin ecosystems can amplify both gains and losses.
The token’s reported 1,000x surge drew in a large number of retail traders, but the subsequent collapse wiped out those gains almost immediately after liquidity was removed.
With 256 confirmed victims and losses reaching hundreds of millions of won, regulators appear to be treating the incident as more than a simple market failure.
Instead, it is being positioned as a coordinated financial fraud operation built around token manipulation and misleading promotion.
The outcome of this case is likely to influence how future memecoin projects are launched and monitored in South Korea.
Prosecutors are now actively tracing wallet activity, promotional networks, and liquidity movements tied to token launches on decentralised exchanges.

Key Takeaways
- Shares of Verra Mobility (VRRM) collapsed more than 46% during Wednesday’s premarket session following Avis Budget Group’s decision to terminate their partnership, set to take effect in September 2026.
- The terminated agreement will eliminate $135M–$145M in annual commercial services revenue and reduce segment profits by $120M–$125M.
- Management slashed 2026 revenue projections to $985M–$995M, a significant drop from the previous $1.02B–$1.03B forecast.
- David Roberts, the company’s CEO, expressed shock and disappointment over the unexpected termination following extensive negotiation efforts.
- Baird analyst David Koning downgraded VRRM from Outperform to Neutral and reduced the price target from $20 to just $8.
Shares of Verra Mobility were hovering around $13.08 during Wednesday’s premarket hours, representing a staggering 46% decline after the company disclosed late Tuesday that Avis Budget Group has decided to end their business relationship. The partnership will officially conclude in September 2026.
Verra Mobility Corporation, VRRM
The Avis partnership represents approximately 13.5% of Verra Mobility’s total 2025 revenue — making this a substantial blow to the company’s financial foundation. Management projects the contract loss will strip away $135 million to $145 million in annualized commercial services revenue, while segment profitability will decline by $120 million to $125 million annually, even before implementing any operational efficiency measures.
David Roberts, the company’s CEO, expressed his candid reaction. “We were surprised and disappointed to receive this notice from Avis Budget Group given our longstanding partnership and the significant time invested by both parties in ongoing extension negotiations,” he stated.
Roberts emphasized that management is now implementing cost reduction strategies, adjusting operational frameworks, and recalibrating the business for future expansion.
Avis Budget Group has not issued a public statement regarding the decision as of this reporting.
Financial Outlook Revised Downward
Verra Mobility has substantially revised its 2026 full-year projections following the contract termination. Total revenue expectations have been lowered to a range of $985 million to $995 million, marking a decrease from the $1.02 billion to $1.03 billion range the company provided just weeks ago.
Adjusted EBITDA forecasts were reduced to $380 million–$385 million, compared to the earlier projection of $405 million–$415 million.
Adjusted earnings per share guidance was lowered to $1.19–$1.25 from the previous $1.32–$1.38 range, while free cash flow expectations dropped to $140 million–$150 million from $150 million–$160 million.
This represents a comprehensive reduction in financial expectations for a company whose commercial division was already showing signs of weakness.
Wall Street Responds
Baird wasted no time adjusting its position. David Koning, an analyst at the firm, downgraded VRRM from Outperform to Neutral while dramatically cutting the price target from $20 down to $8.
Koning highlighted concerns that leverage ratios will now climb to approximately 3.5 times on a pro forma basis. He also warned that should Verra lose contracts with Enterprise or Hertz — both scheduled for renewal during 2027 — the commercial segment’s sustainability would face serious questions. Comparing to similar companies like FISV, FIS, and GPN that trade at 4–7 times 2027 projected earnings with comparable leverage, Baird’s analysis suggests VRRM could be valued between $4 and $8 per share using the same valuation methodology.
According to InvestingPro analytics, six analysts have reduced their earnings projections for the company’s upcoming reporting period.
Before this announcement, Verra Mobility had delivered first quarter 2026 revenue of $223.6 million, slightly exceeding analyst expectations, with adjusted earnings per share of $0.25 compared to the $0.24 consensus estimate. However, commercial services revenue had already declined 4% year-over-year during that period to $97.8 million, a red flag that, in hindsight, signaled potential trouble ahead.
Prior to Wednesday’s dramatic decline, the stock had already fallen 41.6% year-to-date through Tuesday’s market close and was down 44% over the past twelve months. The latest selloff has pushed shares perilously close to the 52-week low of $12.83.

A market dynamic that characterized the steep bitcoin and crypto market selloff early this year is making a comeback: Traders are again preferring dollars over the largest cryptocurrency.
This is evident from trends in their respective dominance rates, a measure of a cryptocurrency’s share in the total market value of the digital asset market.
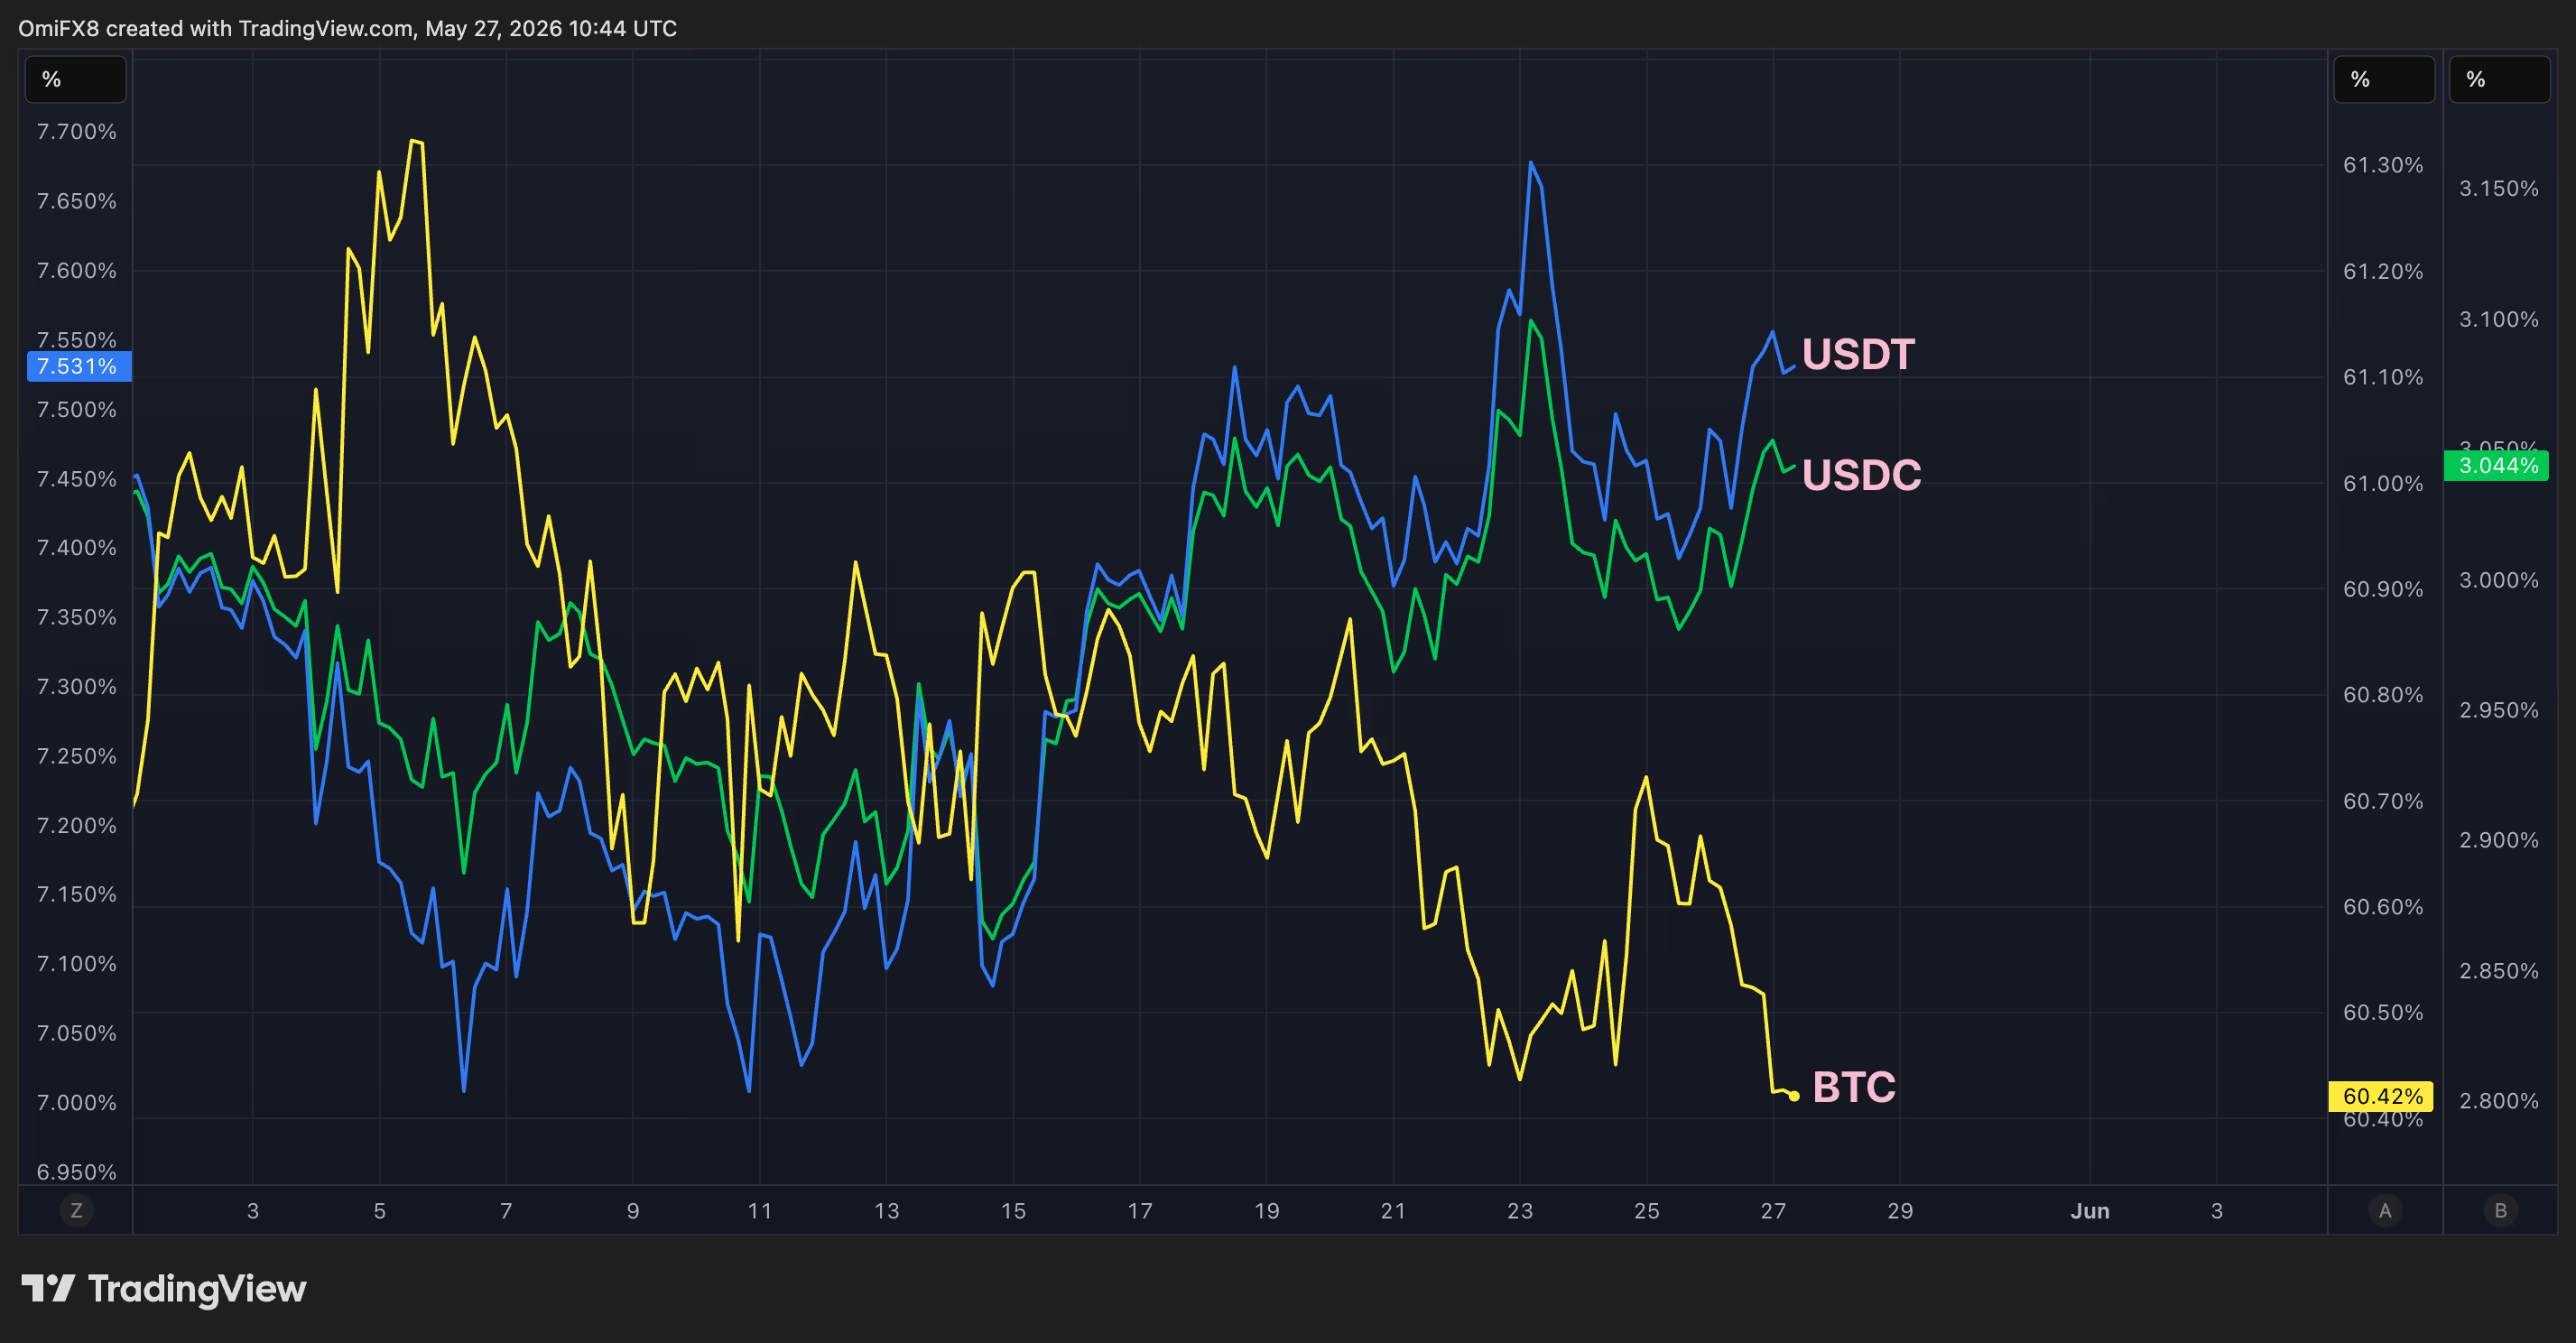
BTC’s dominance rate has pulled back to 60% from 61.20% since May 5. At the same time, the dominance rate for Tether’s USDT, the largest dollar-pegged stablecoin, increased from 7% to 7.5% while Circle Internet’s (CRCL) USDC, the second-largest, rose from 2.8% to 3%.
In other words, money seems to be rotating back into tokenized versions of the U.S. currency. That makes sense because bond markets suggest the Fed may keep interest rates elevated longer than previously anticipated. Higher interest rates make the dollar and dollar-linked investments attractive. Assets like bitcoin, meanwhile, offer no inherent yield or cash flow.
It’s not the first time this has happened this year. A similar scenario occurred in late January, just before the selloff in BTC gathered pace, driving prices down to $63,000 in early February. These trends, therefore, need to be closely watched.
Bitcoin was recently trading near $75,900, having put in lows near $75,200 early today after reports of a large block trade in BlackRock’s bitcoin ETF, IBIT. The transaction saw shares worth over a billion dollars change hands.
The 11 spot ETFs lost over $333 million on Tuesday, following the $2.26 billion in outflows over the past two weeks. Meanwhile, gold and precious metals funds have been pulling in investor money. Talk about rotation!
Ether (ETH), XRP, solana (SOL) and the CoinDesk 20 Index have each dropped about 2% in 24 hours.
“If cryptocurrencies are once again acting as a barometer of sentiment in global financial markets, this looks like an early signal of a reversal towards profit-taking,” said Alex Kuptsikevich, the chief market analyst at FxPro. “Perhaps investors prefer to take their money off the table ahead of the start of summer, beginning with the riskiest segment.”
In traditional markets, Nasdaq e-mini futures traded at record highs above 30,000 points and WTI oil fell 3% to $90 per barrel. The U.S. ADP employment report due today could add volatility to markets. Stay alert!
Read more: For analysis of today’s activity in altcoins and derivatives, see Crypto Markets Today . For a comprehensive list of events this week, see CoinDesk’s “Crypto Week Ahead.”
What’s trending
Today’s signal

The chart shows trends in dominance rates for bitcoin, USDT and USDC since May 5.
While BTC’s share of the total crypto market has declined, the dollar-pegged tokens’ shares have increased.
These diverging trends point to renewed trader preference for the U.S. currency, a sign of capital flight to safety and potential risk aversion ahead.
Crypto World
SpaceX’s $2 Trillion IPO: Why Tech Giants Nvidia (NVDA), Apple (AAPL), and Microsoft (MSFT) May Face Pressure

Key Takeaways
- June 2026 will see SpaceX debut on public markets with an unprecedented $2 trillion price tag, setting a new record for initial public offerings.
- The aerospace company’s artificial intelligence division hemorrhaged $6.36 billion throughout 2025, with the xAI purchase expected to worsen financial bleeding.
- Sources indicate Anthropic currently spends $1.25 billion monthly for access to unused capacity at xAI’s Colossus computing facilities.
- The massive public offering may compel shareholders to liquidate positions in established technology companies, including Nvidia, Apple, and Microsoft.
- Market analysts caution that the listing could push S&P 500 concentration to unprecedented levels, with artificial intelligence behemoths potentially representing approximately 50% of the benchmark index.
The aerospace powerhouse is gearing up for its public market entry scheduled for June 12, 2026, targeting a staggering $2 trillion market capitalization. This figure would shatter all previous records for stock exchange debuts.
With this price point, SpaceX would command a market value exceeding all but half a dozen publicly listed corporations globally.
The organization submitted its registration statement to the Securities and Exchange Commission in recent weeks, offering market observers their inaugural glimpse into the company’s financial performance.
Top-Line Growth Masks Expanding Red Ink
For fiscal year 2025, the company generated $18.7 billion in sales—a 33% year-over-year increase representing robust expansion.
However, expenditures accelerated even faster. The firm’s operating results flipped from a $466 million gain to a $2.6 billion deficit during this timeframe.
A substantial portion of this shortfall stems from artificial intelligence operations. The AI division alone recorded a $6.36 billion operating deficit throughout 2025.
This calculation predates the February 2026 xAI transaction. Industry observers anticipate the acquisition will amplify cash consumption as the company battles OpenAI and Anthropic for engineering talent and computing resources.
Evidence suggests xAI may face challenges maximizing data center utilization. Reports indicate Anthropic currently commits $1.25 billion monthly for computing resources at xAI’s Colossus infrastructure. While this arrangement provides immediate revenue, it simultaneously prevents SpaceX from deploying these resources for its proprietary Grok AI model.
The arrangement includes termination provisions allowing Anthropic to withdraw prior to the 2029 expiration date.
Implications for Established Technology Equities
The public offering targets $75 billion in capital raises. These funds must originate from investor portfolios.
Bank of America research indicates affluent individual investors maintain historically minimal cash positions—merely 9.9% of total assets. Equity allocations stand at 66%.
Consequently, market participants seeking SpaceX exposure will probably need to divest existing positions.
Bob Doll, CEO of Crossmark Global Investments and former equities chief at BlackRock, said the selling could hit other tech names. “Logically, you would think if I’m going to buy a stock in that space, I’ll probably sell a stock in that space,” he said.
MSCI analysis projects Nvidia, Apple, and Microsoft will experience the heaviest redemptions as SpaceX and comparable newcomers gain inclusion in major benchmarks like the Nasdaq 100.
Market Concentration Reaches Critical Levels
Following index rebalancing, strategists caution the equity landscape may undergo dramatic transformation.
Artificial intelligence megacaps could constitute nearly half the S&P 500’s total value. Asher Regovy, chief investment officer at Magnifina, highlighted how this positioning creates vulnerability to isolated negative developments—such as disappointing quarterly results—cascading throughout the entire benchmark.
Doll indicated current technology sector valuations remain relatively attractive, tempering immediate concerns. His allocation strategy balances defensive positions with artificial intelligence exposure, emphasizing companies demonstrating superior return on equity metrics.
UBS recently counseled clients to decrease reliance on dominant American technology corporations. The Swiss bank recommended increasing allocations to Japanese, Chinese, and Swiss markets, alongside European consumer discretionary and global healthcare sectors.
Elon Musk has floated the concept of orbital data centers to minimize thermal management expenses. Industry analysts generally characterize this as speculative long-term thinking rather than imminent commercial strategy.
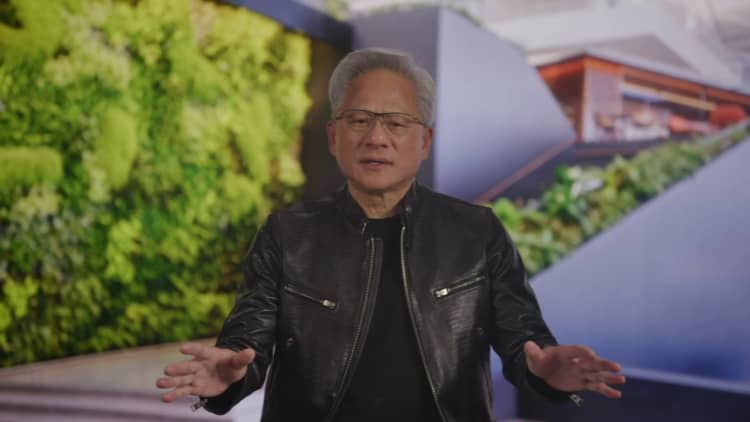
Nvidia CEO Jensen Huang announced plans for a new campus in Taiwan during an employee meeting on May 27, 2026.
Nvidia
Nvidia is expanding heavily in Taiwan with a new campus and a tenfold increase in annual spending, CEO Jensen Huang announced Wednesday, as the chipmaker plans for artificial intelligence-powered growth.
Taiwan’s Taiex stock index climbed 1.7% to a record close on Wednesday. Also helping gains was news that South Korea’s SK Hynix and U.S.-based Micron became the latest chip-related companies to reach $1 trillion in market value.
“Now we’re spending $100 [billion], going to $150 billion in Taiwan each year,” Huang said in Taipei, noting that’s up from $10 billion to $15 billion annually just four or five years ago.
By the end of the year, Nvidia will begin building a new office complex called Constellation, which can accommodate 4,000 employees in northern Taipei when it opens in 2030, he said. That would be four times the company’s existing headcount in Taiwan.
Shares of Taiwan chip manufacturing giant TSMC closed 1.3% higher on Wednesday, while MediaTek gained 8.8% and Delta Electronics rose by 7.2%. The three stocks — all semiconductor industry giants — are the largest companies by market capitalization on the Taiex index.
Nvidia designs chips while TSMC manufactures them. Nvidia is expected to surpass Apple this year as TSMC’s largest customer.
A $150 billion annual outlay in Taiwan would be among Nvidia’s largest spending plans to date, and exceed what the company made in revenue in a single quarter. The company reported a record $81.6 billion in revenue in the quarter ended April 26, and predicts $91 billion in revenue for the current quarter.
The company has announced plans to invest $500 billion in AI infrastructure in the U.S. with local manufacturers over four years — which averages out to $125 billion annually in U.S. value creation.
China race accelerates
The investment comes as Nvidia faces growing regulatory hurdles in selling to the mainland Chinese market. Revenue from Taiwan surged by more than 50% from a year ago in the latest quarter, while revenue from mainland China and Hong Kong halved.
Shares of leading mainland China chip players including SMIC tumbled on Wednesday, with Cambricon falling 5% and Hygon down 7%.
The shares had rallied earlier in the week after Chinese telecom giant Huawei announced Monday morning that it had developed a new approach to producing advanced semiconductors. The company plans to use its new “LogicFolding” engineering in a smartphone chip this fall, and in its Ascend chips that power data centers “by around 2030.”

Earlier this month, widely followed venture capitalist Chamath Palihapitiya also said Taiwan could become less important to global semiconductor development in 18 months due to advances by U.S.-based Neuralink.
“Taiwan is the epicenter of the AI revolution,” Huang said Wednesday.
AI combined with hardware, or “physical AI,” is going to “transform manufacturing,” Huang added. “In Taiwan, our partners will benefit from all our technologies that will transform manufacturing.”
—CNBC’s Katie Tarasov contributed to this report

The move comes as Authentic prepares for its next growth phase, and follows indications from Salter that the company could seek a public listing within the next 12 months.
Salter, who established Authentic Brands Group in 2008, previously served as chief executive. In his new capacity, Salter will focus on the company’s long-term strategic initiatives, which include mergers and acquisitions, global partnerships, and other priorities designed to fuel international expansion.
“As Founder and Executive Chairman, I will continue to do what I’ve always done: being laser-focused on driving strategic, transformational opportunities that will position our peerless company for continued growth,” Salter commented.
“I’ll remain actively involved, partnering closely with Matt and the entire leadership team, as we continue building the world’s leading brand, marketing and entertainment platform.”
Maddox, who became president of Authentic Brands Group in January 2025 after twenty years at Wynn Resorts, now assumes the role of chief executive officer.
In this position, he will report to Salter and join the board of directors, overseeing the company’s global operations and focusing on driving growth and value creation for shareholders and partners.
Maddox added: “I look forward to working side by side with Jamie to build on that foundation and accelerate our growth. Authentic’s leadership bench is exceptional, and it is a privilege to step into the role of CEO and lead a team of this calibre forward. The opportunity ahead is significant, and we are just getting started.”
The announcement also comes as Salter confirmed to CNBC that the company is targeting a public listing in the near term.
Salter said: “We’ve almost gone public twice, we’ve filed twice and both times we were taken out by other private equity firms at much higher prices. I think this time, the company has grown so big that I think this time we’ll probably end up going public sometime in the next 12 months.”
Authentic’s portfolio boasts more than 50 fashion brands including Reebok, Champion, Sports Illustrated, GUESS, Brooks Brothers, Ted Baker, Juicy Couture and Billabong.
“Authentic Brands Group reshuffles leadership, hints at IPO” was originally created and published by Just Style, a GlobalData owned brand.
The information on this site has been included in good faith for general informational purposes only. It is not intended to amount to advice on which you should rely, and we give no representation, warranty or guarantee, whether express or implied as to its accuracy or completeness. You must obtain professional or specialist advice before taking, or refraining from, any action on the basis of the content on our site.

A single entity just moved $1.289 billion in BlackRock’s IBIT off-exchange as Bitcoin tries to hold its footing amid bearish price prediction. The trade was executed via dark pool, or a privately negotiated transaction designed to prevent the spot price from being instantly crushed. It’s the largest dark-pool trade of its kind that we have ever seen.
The move landed on a brutal day. U.S. spot Bitcoin ETFs logged $336 million in total net outflows, extending what is now a seven-consecutive-day bleed, the second-longest since ETF launch in January 2024.
Total losses over that stretch clocked at $1.88 billion. IBIT alone processed $192.44 million in net redemptions on the day, as overall momentum was controlled by sellers.
Arthur Hayes has directly linked Bitcoin’s recent crash to IBIT outflows, pointing to the $1.2 billion exiting spot Bitcoin ETFs across just three trading days. Macro fragility, basis-trade unwinds, and leveraged long liquidations are compounding the pressure.
Discover: The Best Crypto to Diversify Your Portfolio
Bitcoin Price Prediction: Recover Above $78,500?
Bitcoin is currently oscillating in the $75,000–$78,000 range, with $78,500 identified as a critical pivot level in the options market, acting as both a ceiling and a structural marker for any short-term recovery attempt. The recent selloff represents nearly a 7% drawdown from the $83,000 zone, making it Bitcoin’s steepest weekly decline since October 10th last year.
On-chain demand signals are equally grim. CryptoQuant analyst flags apparent demand at a year-to-date low of -147,000 BTC. A number that reinforces a corrective bias until buying volume reverts.
Technical reads on Bitcoin’s chart describe price action as consolidation after rejection from higher levels, inside a broader downward channel originating at the all-time high of $126,000.

If IBIT flows reverse with a sustained inflow return, BTC could reclaim $78,500 and target $83,000 resistance. Historical precedent shows ETF inflow inflections mark local bottoms. However, if $75,000 fails as support, the price could retest sub-$70,500 lows seen during the latest selloff leg.
BlackRock’s own analysis cites Fed policy uncertainty, leverage reduction, and the clearing of “outsized positions” as the primary volatility drivers — none of which have been fully resolved. Resistance on any recovery sits at $89,500–$90,500, with a more distant target near $93,300–$95,500 if momentum rebuilds.
Discover: The Best Token Presales
Bitcoin Hyper Targets Early Mover Upside as Bitcoin Stalls
When the market’s largest asset drops by 7% in two weeks, traders start reassessing where asymmetric upside actually lives. Spot BTC at $75,000 offers recovery potential, but recovery to what, exactly?
Even a return to $95,000 is a 26% move. Early-stage infrastructure targeting Bitcoin’s own scalability limitations is a different conversation entirely.
Bitcoin Hyper ($HYPER) is positioning directly in that gap. It’s the first Bitcoin Layer 2 integrating the Solana Virtual Machine (SVM), delivering sub-second finality and low-cost smart contract execution, while preserving Bitcoin’s underlying security.
The pitch is direct: break through Bitcoin’s core bottlenecks, such as slow transactions, high fees, and no programmability, without sacrificing the trust layer.
The project has already raised $32 million, with the current presale price at $0.0136807 and staking rewards available for early participants. A Decentralized Canonical Bridge handles BTC transfers natively.
Researching Bitcoin Hyper represents a structurally different risk profile from spot BTC at current prices.
The post Bitcoin Price Prediction: Whale Dumped Blackrock ETF in The Dark Pool appeared first on Cryptonews.
Argus downgrades Zoetis stock rating on competition, margin pressure

Why HYPE is different: inside Hyperliquid’s buyback

Marshals Stars Address Possible Exit From Yellowstone Spinoff


-

 Crypto World6 days ago
Blockchain.com files with SEC for U.S. IPO
-

 Fashion5 days ago
Holiday Weekend Open Thread – Corporette.com
-
 Crypto World5 days ago
Bitcoin Accumulation Weakens as BTC Realized Losses Hit $600M
-
 Business5 days ago
Dell Technologies DELL Stock Surges 15% on AI Server Momentum and Analyst Upgrades in 2026
-

 Crypto World4 days ago
Robinhood crypto COO Tanya Denisova exits
-

 Business3 days ago
NYT Strands Answers May 24 2026 Revealed for Puzzle No. 812 Theme Summer Essentials
-

 Politics5 days ago
Makerfield: a tale of two social-media histories
-
 Crypto World5 days ago
Space X IPO Is ‘Bad News’ for Tech Stocks: But What About Bitcoin?
-

 Tech2 days ago
Microsoft’s quiet Claude Code retreat and the real cost of enterprise AI
-
 Crypto World5 days ago
MicroStrategy’s Saylor Says Miners No Longer Set Bitcoin Price, Another Force Has Taken Over
-

 Tech6 days ago
WhatsApp ads could make Irish debut after discussions with DPC
-
 NewsBeat6 days ago
Charity run by Reform leader Malcolm Offord accused of ‘law breaking’ over Scottish registration
-
 Tech5 days ago
A 0.12% parameter add-on gives AI agents the working memory RAG can’t
-

 Crypto World5 days ago
AI infrastructure race heats up as IREN pitches full-stack strategy, WhiteFiber lands $160M deal
-
 Crypto World2 days ago
Nvidia (NVDA) CEO Calls on Super Micro to Strengthen Export Controls Amid Smuggling Probe
-

 Tech5 days ago
You Can Now Add ChatGPT To PowerPoint
-

 Business5 days ago
Trump Invests $1M-$5M in Kura Sushi USA Chain With 27 California Locations
-

 Tech2 days ago
Westone Audio and Etymotic Acquired by Fidelity Collective in Major IEM Market Move
-

 Sports5 days ago
2026 CJ Cup Byron Nelson leaderboard: Brooks Koepka finds putting stroke in Round 1
-

 Crypto World7 days ago
Exa Labs raises $250 million in funding led by a16z
You must be logged in to post a comment Login