

Crypto World
CoinDesk 20 performance update: Bitcoin Cash (BCH), up 1.5%, is only gainer

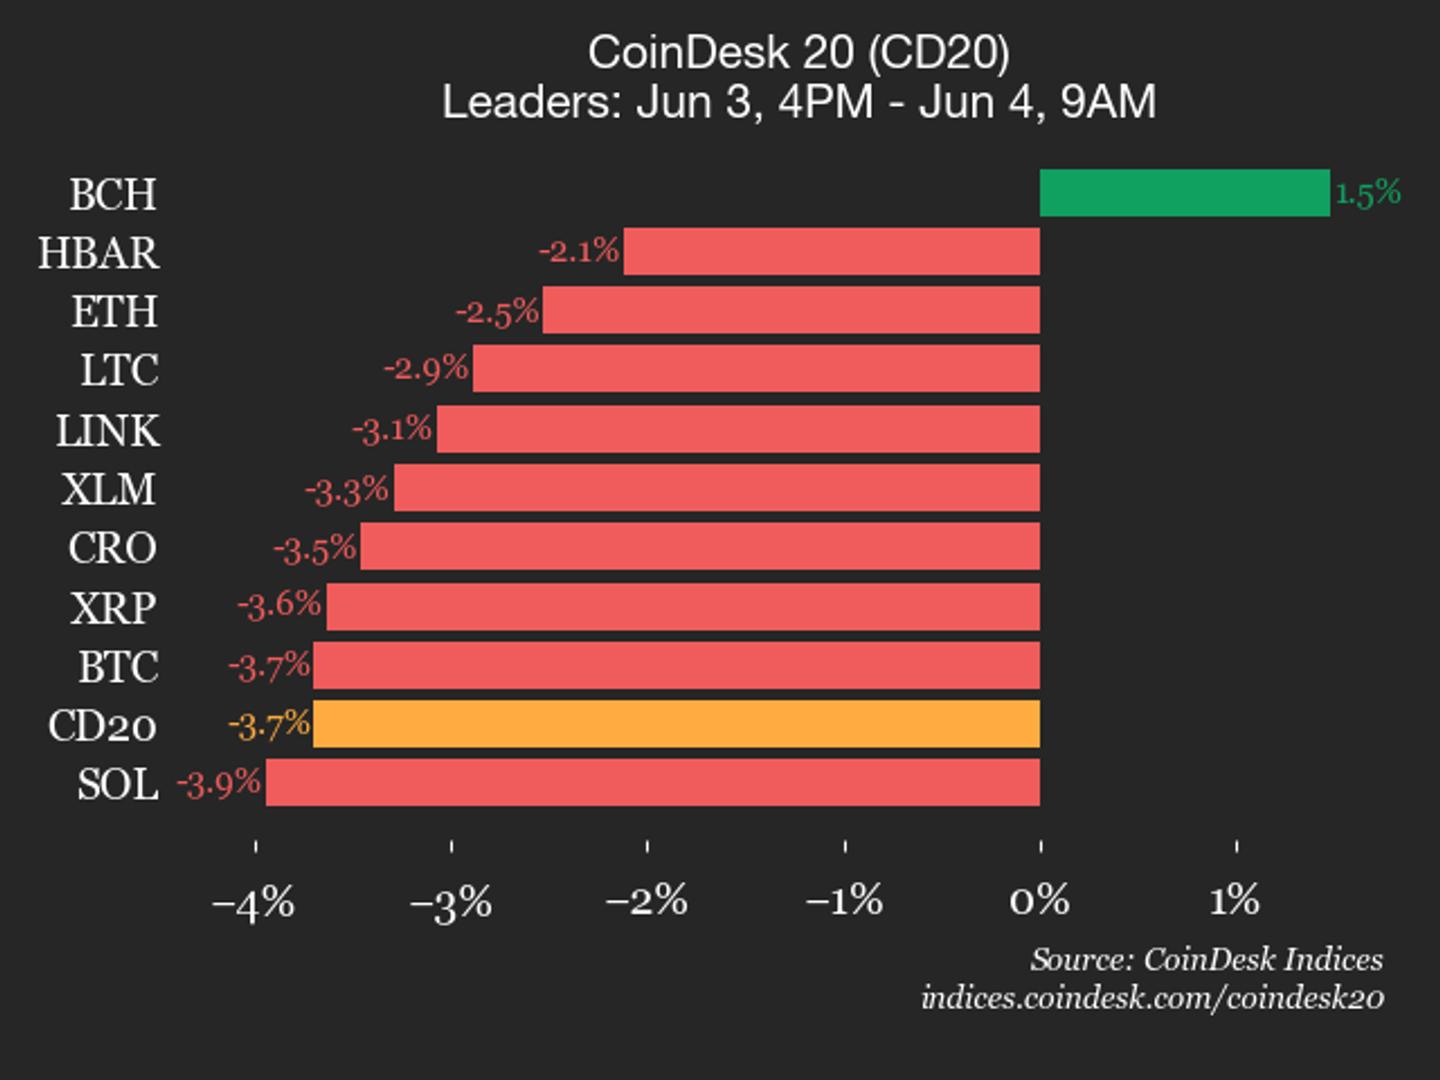
NEAR Protocol (NEAR) declined 15.2% and Internet Computer (ICP) dropped 13.1%, leading the index lower.


Cardano’s ADA fell below $0.20 on June 4, 2026, its lowest price in more than five years. The token is down roughly 70% over the past year and more than 93% from its 2021 all-time high of $3.09.
Summary
- Cardano’s ADA fell below $0.20 for the first time in more than five years as selling pressure intensified across the crypto market.
- TapTools, a long-standing Cardano analytics platform, shut down after citing unsustainable operating conditions within the ecosystem.
- Cardano founder Charles Hoskinson warned of a potential “wave of failures” and criticized the community’s reluctance to deploy treasury funds to support projects.
The market-wide selloff that dragged Bitcoin under $62,000 explains part of it, but Cardano fell harder than its peers for reasons that are specific to Cardano.
A respected four-year-old ecosystem analytics firm, TapTools, shut down. Founder Charles Hoskinson posted an impassioned monologue warning of a coming “wave of failures” in the ecosystem.
The community voted against funding Cardano’s own flagship 2026 Summit, forcing its cancellation.
Network TVL has bled 36% in a month to around $186 million. And on June 3, Hoskinson tweeted four words that captured the mood: “I’m taking a break. TTYL.” This is not just a coin that fell with the market.
It is a coin whose own founder is openly warning that its ecosystem is in trouble. Here is what is actually happening, and what it means for what comes next.
What the price is doing
The headline number is stark. ADA broke below $0.20 on June 4, a level it had not touched in over five years, falling another 6 to 10% in 24 hours as the broader market sold off. The technical structure had already broken down days earlier, when ADA slipped under the critical $0.247 support level on June 2 and kept sliding.
Put the drawdown in context, because the scale is what matters. ADA is down around 70% over the past year. It is down roughly 77% from its early-2026 peak near $1.00. And it is down more than 93% from its all-time high of $3.09, set back in 2021. A holder who bought near the top has lost almost everything in percentage terms, and even a holder who bought at the start of 2026 is down more than three-quarters.
The next support levels traders are watching are thin. With $0.247 already gone and $0.22 breaking, analysts point to $0.18 and then the $0.162 area as the next zones if selling continues. On the upside, reclaiming $0.22 and then $0.247 would be the first signs of stabilization. But the deeper problem is that the price is now reflecting something beyond a market correction. It is reflecting a confidence crisis in the Cardano ecosystem itself.
Why Cardano fell harder than the market
Every major coin fell in early June. Cardano fell more, and the reasons are specific to it.
The first is a structural vulnerability that predates this week. ADA has a relatively small market cap and lower institutional liquidity than Bitcoin or Ethereum, which means it has higher beta to the downside. When Bitcoin sells off, ADA tends to fall harder, simply because there is less deep capital to cushion the drop. That is the baseline. But the baseline does not explain a five-year low while other large caps sit at one-year lows. The rest of the explanation is Cardano-specific, and it is about the ecosystem, not the chart.
The trigger that turned a bad week into a crisis was the shutdown of TapTools, a Cardano analytics firm that had been building on the network for four years. TapTools cited the economics of continued building, maintenance, and support as the reason it was ending.
For a respected, established project to simply give up after four years sent a signal far louder than its size would suggest: if a firm like this cannot make the economics work, who can? It crystallized a fear that had been building, that the Cardano ecosystem is not generating enough activity or revenue to sustain the businesses built on top of it.
Then the founder confirmed the fear out loud.
Hoskinson sounds the alarm
What separates this episode from an ordinary altcoin drawdown is that Cardano’s own founder publicly warned the ecosystem is failing.
In a video posted to his YouTube channel, Charles Hoskinson said the TapTools shutdown was likely not an isolated event. “This is where we’re at as an ecosystem,” he said, adding that he had predicted this at the start of the year. “I said at the beginning of the year, we’re going to see a lot of people collapse because the markets are really bad. There’s going to be a wave of failures in the ecosystem.” Coming from a project’s founder, that is an extraordinary thing to say in public. Founders typically project confidence during downturns. Hoskinson did the opposite, naming the problem directly.
His frustration centered on funding. Hoskinson said he had spent months, even years, outlining steps the ecosystem needed to take to prevent exactly this kind of collapse, including efforts to purchase and commercialize applications. But he claimed those efforts met resistance, particularly around spending the Cardano Foundation’s ADA treasury to support the ecosystem’s decentralized applications. “There doesn’t seem to be a lot of community desire to spend the treasury to take these ventures to the next level,” he said. In other words, Cardano has a treasury that could fund its way through the downturn, and the community has been voting not to use it.
That tension became concrete days earlier when the Cardano community voted against funding the network’s flagship 2026 Summit, the annual conference, which had been planned for Singapore. The vote forced organizers to cancel the event. A blockchain ecosystem canceling its own marquee conference because the community would not approve the spending is the kind of symbolic blow that compounds a confidence crisis. It tells builders, investors, and partners that the ecosystem is pulling back instead of pushing forward.
Then, on June 3, Hoskinson posted a four-word message to X: “I’m taking a break. TTYL.” The founder stepping away, however briefly, in the middle of the worst stretch the ecosystem has faced sent ADA down a further 10% and left the community without its most visible leader at the moment it most needed direction.
The governance problem underneath
Strip away the price action and the week’s events point to a deeper, structural issue: a governance and funding deadlock.
Cardano is unusual among major blockchains in how seriously it takes on-chain governance and community voting. That is, in principle, a strength, the kind of decentralized decision-making the whole industry claims to want. But this week exposed the downside. The same governance system that gives the community control over the treasury has produced a stalemate, where the community keeps voting against deploying treasury funds even as the founder warns that not deploying them is killing the ecosystem.
This is a genuine philosophical conflict, not just a funding shortfall. One camp wants to spend the treasury aggressively to subsidize developers, acquire applications, and keep the ecosystem alive through the downturn. Another camp is wary of spending down a treasury denominated in a falling asset, worried that it amounts to throwing good money after bad, or that it concentrates too much direction in the foundation and the founder. Both positions are defensible. The result of the deadlock, however, is that Cardano is entering a severe downturn with a large treasury it is choosing not to use, while the businesses built on it shut down one by one.
Hoskinson’s own framing is telling. He argued that Cardano is not losing builders because of its technology or its philosophy, but because economic conditions are making it hard for businesses to remain viable. Whether or not you accept that, it points at the central question for what comes next: can Cardano resolve its internal funding fight fast enough to stop the wave of failures its founder is warning about?
What the bulls still point to
For all the bad news, there is a counter-case, and it is worth laying out honestly rather than dismissing.
The technology argument is the durable one. Cardano has always been built on formal academic peer review, with every protocol upgrade reviewed before deployment. That philosophy has drawn persistent criticism for slow delivery, but it has also produced a chain that its supporters consider unusually well-tested and methodical. The bulls argue that the technical foundation is intact and that the current crisis is about economics and sentiment, not about the chain being broken. Hoskinson made exactly this point: the network is not losing builders over technology.
The roadmap still has catalysts. Cardano’s bulls point to Midnight, a privacy-focused project Hoskinson has said could boost network TVL after launch, along with continued development of the Hydra layer-2 scaling solution. The longer-term price scenarios that analysts sketch, in the $0.45 to $0.55 range, generally require some combination of Midnight adoption, Hydra momentum, and potential ETF traction converging at once. None of that is happening right now, but it is the bull thesis for why ADA is not a permanent zero.
There are also faint on-chain positives buried in the wreckage. Earlier in the decline, some data showed whale accumulation and positive funding rates, and technical analysts flagged ADA as deeply oversold, the kind of condition that can precede a relief bounce. The honest caveat is that “oversold” has been true for much of the slide and has not stopped it, and whale accumulation during a fall can just as easily be early buyers who are now underwater. Oversold is not the same as bottomed.
What’s next
The realistic outlook for Cardano splits into a near-term path and a structural question, and they are not the same.
In the near term, ADA’s price is largely hostage to two things it does not control: the broader crypto market and Bitcoin specifically. As long as Bitcoin keeps sliding and the market sits in extreme fear, ADA’s higher beta means it will likely keep falling harder than the majors, with $0.18 and $0.162 as the next downside zones. A market-wide stabilization or bounce would lift ADA mechanically, regardless of its internal problems. So in the short run, watching Bitcoin tells you more about ADA’s price than watching Cardano does.
The structural question is the one that determines whether Cardano recovers as an ecosystem or slowly hollows out. It comes down to whether the governance deadlock breaks. If the community shifts toward deploying the treasury to support builders, if the wave of failures Hoskinson warned about turns out to be a handful rather than a flood, and if a catalyst like Midnight delivers real activity, then the current five-year low could mark a capitulation bottom for a chain that survives and rebuilds. If the deadlock holds, if more firms follow TapTools out the door, and if the founder’s “break” turns into prolonged disengagement, then the price is reflecting something real and durable: an ecosystem contracting, not just a token in a market downturn.
The thing to watch, more than the price, is the ecosystem health. Specifically: whether more established Cardano projects announce shutdowns in the coming weeks, whether the community holds any new treasury-spending votes and how they go, and whether Hoskinson returns engaged and with a concrete plan or stays on the sidelines. Those signals will tell you whether this is a painful bottom or the start of a longer decline. Right now, the uncomfortable truth is that Cardano’s founder has told you which one he fears, and the market is listening to him. A five-year low is not, by itself, a reason to panic or to buy.
The question that matters is whether Cardano can use the resources it has to stop the bleeding its own founder is warning about, and that question has not been answered yet.
This article is for informational purposes and does not constitute financial or investment advice. Cryptocurrency markets are highly volatile. The figures and analysis described reflect data available as of June 4, 2026. Always do your own research and consult with qualified financial professionals before making investment decisions.


Hyperliquid’s native token, HYPE, dropped below $70 on Thursday after delivering an 80% gain in May. The dip comes amid renewed weakness across the broader cryptocurrency market, where Bitcoin (BTC) slipped below $63,000 and sparked a wave of risk-off sentiment among investors.
A key catalyst behind HYPE’s recent surge has been rising institutional participation. Newly launched HYPE-focused exchange-traded funds (ETFs) attracted roughly $135 million in inflows last month, highlighting growing demand from professional investors and helping drive the token into price discovery territory.
While momentum remains firmly bullish, analysts caution that the rally has become increasingly stretched, even as long-term projections point toward a potential move above the $100 mark.
Capital rotates from Bitcoin ETFs to Hyperliquid products
Institutional flows reveal a stark contrast between Bitcoin and Hyperliquid investment products.
Bitcoin ETFs recorded $396.6 million in net outflows on Wednesday, extending cumulative withdrawals to $4.37 billion over the past 13 trading days. The trend suggests waning institutional appetite for the world’s largest cryptocurrency amid broader market uncertainty.
By comparison, HYPE-focused ETFs attracted $2.99 million in inflows on Wednesday, marking their 15th consecutive day of positive flows and bringing total inflows to approximately $140 million.
The data points to a broader rotation of capital toward exchange-related tokens, as investors increasingly focus on platforms generating tangible revenue and expanding their product ecosystems.
Further reinforcing this trend is the launch of Grayscale’s HYPE-focused ETF on Thursday, a development widely viewed as another sign of growing institutional confidence in the Hyperliquid ecosystem.
Hyperliquid’s growth story extends beyond ETF demand. According to Hyperscreener data, the platform’s HIP-3 protocol—which enables 24/7 trading of tokenized real-world assets (RWAs), including publicly listed stocks, pre-IPO shares, and commodity perpetual futures—generated $62.63 billion in trading volume during May.
The milestone marks the third consecutive month in which HIP-3 volume exceeded $60 billion, underscoring the platform’s expanding role as an “everything exchange” serving multiple asset classes.
HYPE price outlook: Can HYPE reach $100?
HYPE traded above $67 at the time of writing, extending a rally that has now lasted five consecutive weeks.
Technical indicators continue to support a bullish outlook, although they also suggest the token may be approaching overheated conditions. The Relative Strength Index (RSI) sits at 82 on the weekly chart, deep in overbought territory, while the Moving Average Convergence Divergence (MACD) indicator remains firmly positive with expanding bullish momentum.
From a technical perspective, HYPE is approaching the 127.2% Fibonacci extension level at $79.40. A decisive weekly close above this resistance could pave the way for a move beyond the psychologically important $100 threshold.
Should bullish momentum continue, the next major upside target sits near the 161.8% Fibonacci extension level at $114.75, which also aligns with a long-term overhead trendline.

Despite the strong uptrend, investors should remain aware of potential downside risks. The first significant support level lies near $59.45, which previously acted as a major Fibonacci high. If selling pressure intensifies, additional support could emerge around the 78.6% Fibonacci retracement level at $47.34.
For now, sustained institutional inflows, growing trading activity, and expanding product offerings continue to support the bullish case for Hyperliquid as it attempts to establish itself as one of the crypto market’s strongest-performing assets.
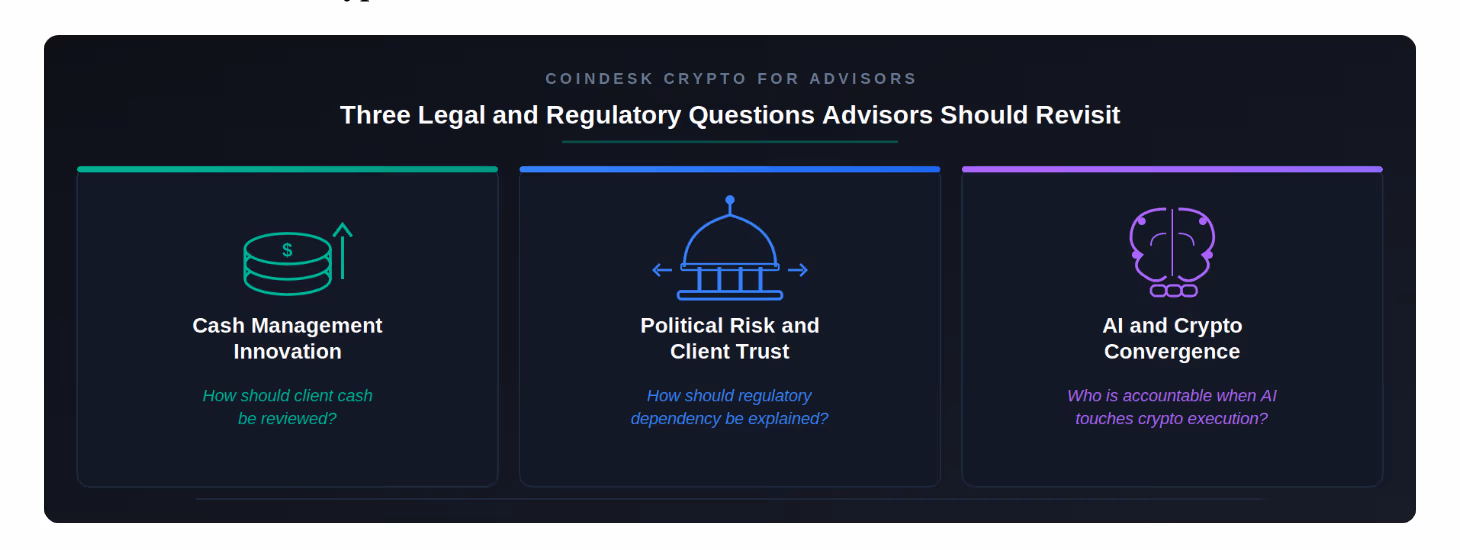
In today’s newsletter, Beth Haddock reviews the three due diligence questions advisors should be asking in 2026: how client cash is managed, how regulatory assumptions should be disclosed and how to manage liability when AI executes crypto trades.
Then, in “Ask an Expert,” Aaron Brogan reviews the GENIUS Act implementation timeline, how things will change once it’s here and what to do in the meantime.
Crypto due diligence has changed: three questions advisors should revisit
As digital money, shifting regulatory requirements and AI-enabled infrastructure mature, advisors need to revisit what legal and regulatory diligence covers. The objective is practical: meet fiduciary duties, protect client trust and adapt as the market changes. Three questions deserve more attention: how client cash is managed, how regulatory assumptions are disclosed and how AI-driven crypto infrastructure is validated.

Prepared with Claude (Anthropic) as a drafting tool; content, direction, and review by author
Diligence Question
Which clients would benefit most from evaluating digital cash management alternatives?
Institutional and cross-border payment clients are a natural place to start.
1. Cash Management Innovation
How should client cash management be reviewed? The GENIUS Act and the growth of stablecoins have opened a new chapter for cash management. Stablecoin lending markets, made accessible via platforms like Axal, offer yields with increased transparency. Tokenized money market funds and other short-term assets from issuers including BlackRock, Fidelity and J.P. Morgan now hold billions in assets, with on-chain settlement and daily liquidity.
For advisors, the question is not whether digital alternatives should replace traditional cash sweeps or money market funds. It is also whether the documented analysis reflects that the advisor considered the client’s best interests, including fees, conflicts and suitability. The SEC’s recent cash sweep enforcement actions against Wells Fargo Advisors and Merrill Lynch make the point: cash management is not a neutral decision. Stablecoins and tokenized short-term assets are not generic cash products, but that is the point: their structure may offer meaningful advantages for the right client, particularly where settlement speed, transparency, yield or cross-border movement matter. Advisors should understand the product terms, provider controls and client use case before making a recommendation.
Diligence Question
What would change a recommendation of legislation, agency leadership or enforcement posture shifts?
2. Connecting Political Risk and Client Trust
How should regulatory dependency be explained? Political support for and opposition to crypto growth remains contentious. The GENIUS Act and proposed CLARITY Act represent progress from regulation by enforcement toward more predictable frameworks. But implementation regulations, market conduct, consumer protection and global coordination remain unsettled. Stablecoin yield and ethics debates, including bank opposition and CLARITY legislative hurdles, show the sector still faces scrutiny from incumbents, private litigants and state attorneys general.
The enforcement shift under SEC Chairman Atkins illustrates why client communication matters. A platform under active enforcement one year can be cleared the next, and the reverse is possible under a future administration. Advisors should not overpromise certainty. Advisors should disclose regulatory assumptions and risks behind portfolio recommendations and update those assumptions as legislation and enforcement posture evolve.
Diligence question
Who is accountable when an agentic workflow touches client data or transaction execution?
3. The Convergence of AI and Crypto
Who is accountable when AI touches crypto execution? AI agents are beginning to settle transactions on crypto rails, while the IMF and others have flagged gaps in operational resilience and governance. Research on agentic commerce suggests validation, liability and programmable compliance remain unsettled.
This convergence should push advisors to cover four priorities. Security: do product sponsors have a credible view on quantum readiness? Substance over hype: the SEC’s AI-washing cases remind us that claims about AI capabilities must be verifiable. Validation and controls: how are AI outputs tested, supervised and authenticated before they are used in advice, trading or client communications? Are platforms that prepare transactions for users transparent user interfaces or opaque in their operations? Privacy: amended Reg S-P and the recent Fidelity data breach settlement show why client data governance matters when AI tools touch client and confidential information, including prompts, outputs and data used for training.
These trends will keep evolving. Advisors who deliver trustworthy crypto recommendations will be the ones whose diligence accounts for AI innovation, political risk and the best cash management options for their clients. Where is your practice least prepared?
– Beth Haddock, managing partner and founder, Warburton Advisers
Ask an Expert
When interacting with stablecoins, is it important to evaluate whether they are the GENIUS-compliant type, or the old MTL-only type?
The GENIUS Act was signed into law on July 18, 2025. Despite this, to date, stablecoins remain regulated under the old regime. While GENIUS will introduce cross-agency federal oversight, as well as many requirements including limiting reserve composition, current stablecoins are still issued using state money transmitter licenses (MTLs) without dedicated federal oversight.
The GENIUS Act will change the risk profile of legal stablecoins in the United States, but when will it take effect?
This will all change when GENIUS takes effect. The statute becomes effective on the earlier of January 18, 2027, or 120 days after the primary federal payment stablecoin regulators issue final implementing regulations. It separately directs the federal payment stablecoin regulators, state payment stablecoin regulators and the Secretary of the Treasury to coordinate to promulgate rulemaking by July 18, 2026. Those rulemakings are currently in progress. The rules governing foreign payment stablecoin issuers will become operative on the same effective-date timeline.
– Aaron Brogan, founder and managing attorney, Brogan Law
Keep Reading
Looking for more? Receive the latest crypto news from coindesk.com and market updates from coindesk.com/institutions.
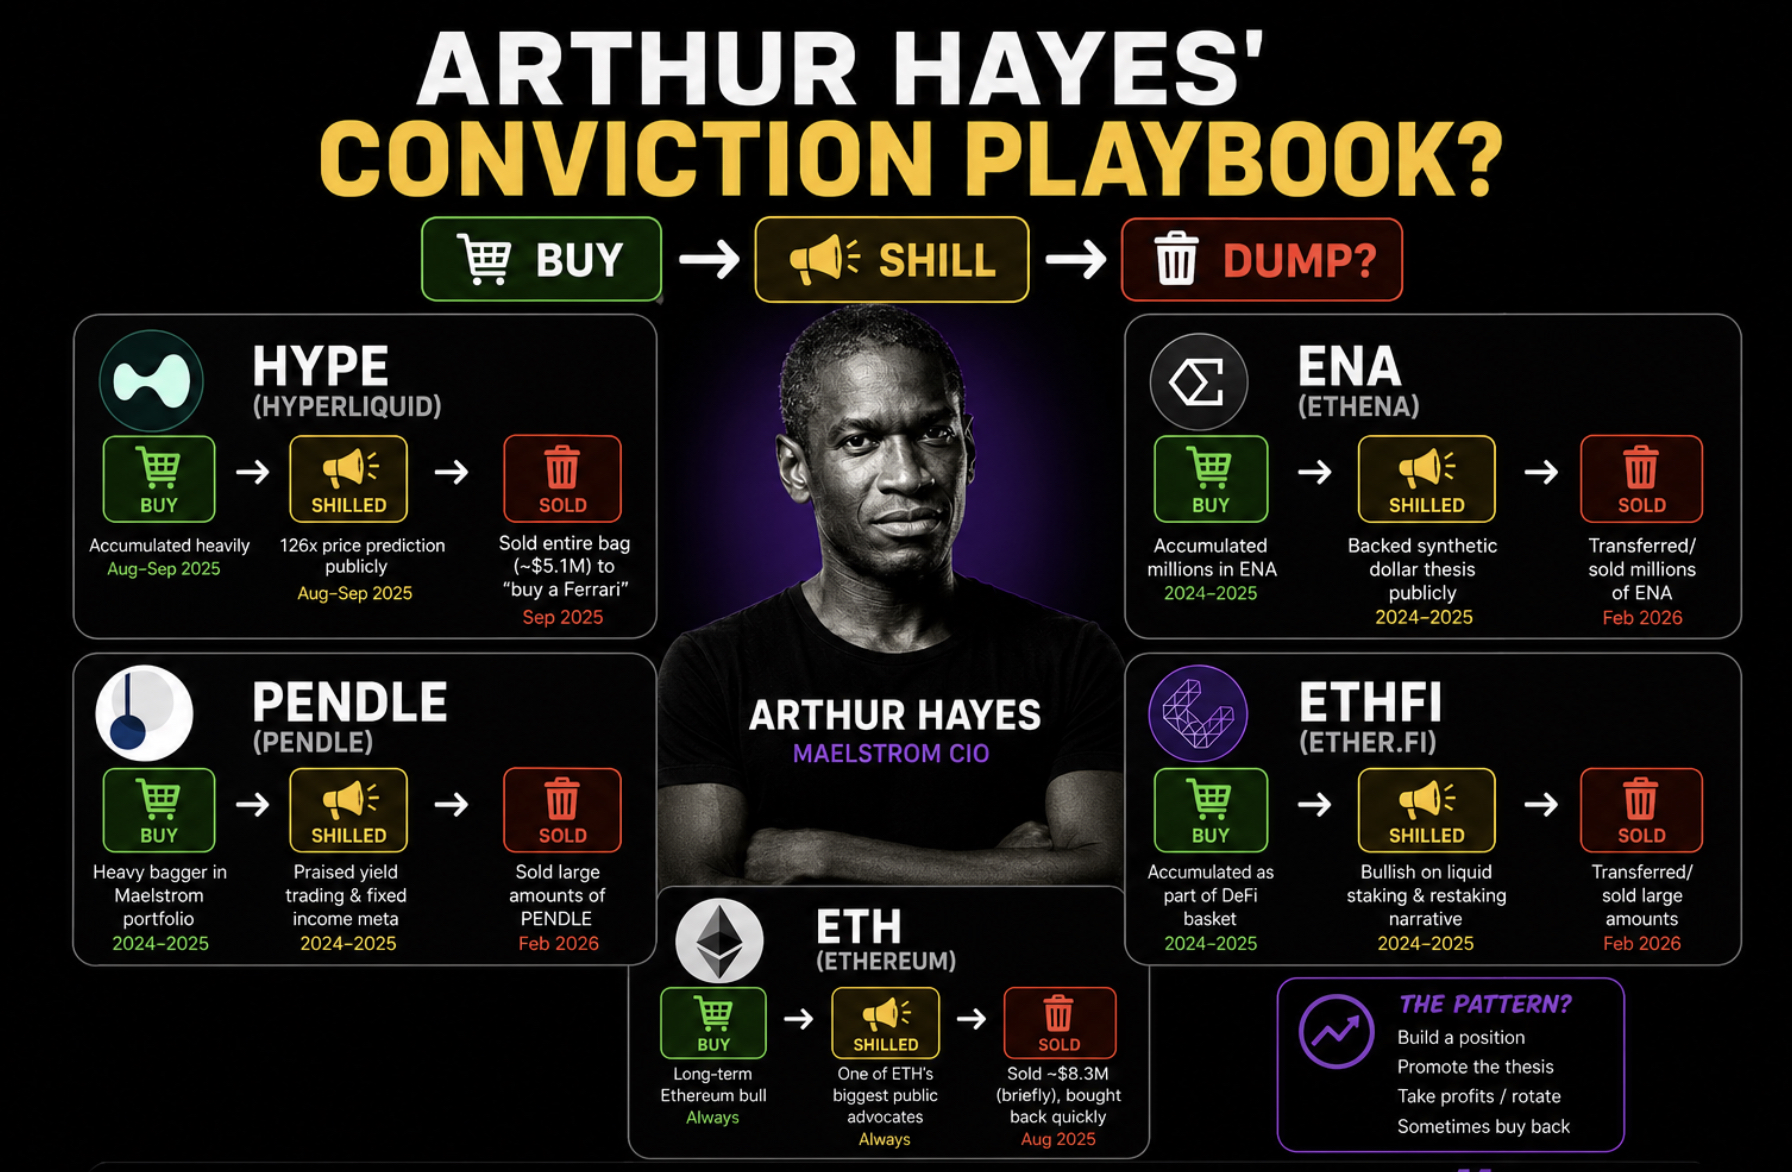
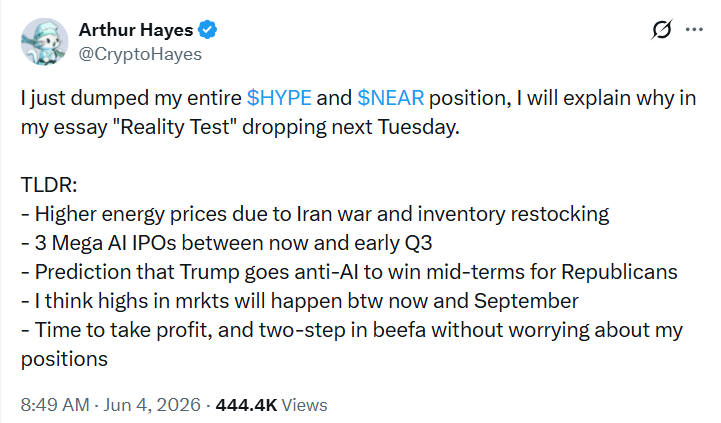
Arthur Hayes has done it again. Just now, the BitMEX co-founder and Maelstrom CIO revealed he had sold his entire HYPE and NEAR positions. Why? Rising energy prices tied to tensions in Iran, looming AI IPOs that could drain market liquidity, and a belief that markets may peak sometime between now and September. His solution is to take profits and rotate into Bitcoin.
Fair enough, but the problem is that just four days earlier, Hayes was singing a different song. Just days ago, he posted “Meow — $HYPE to $150” alongside a cat meme while continuing to promote what he called his “holy trinity” of altcoins: HYPE, ZEC, and NEAR. He even made a $100,000 charity bet with Kyle Samani that Hyperliquid would outperform every top-10 cryptocurrency by year-end.
Then came the exit. There’s nothing wrong with taking profits. The issue is that this pattern has become familiar.
Back in September 2025, Hayes was also aggressively bullish on Hyperliquid, floating a potential 126x rally and repeatedly talking up the token before later selling millions of dollars worth. At the time, he famously admitted some of the proceeds went toward buying a Ferrari.
Eventually, he bought back in, renewed his bullish outlook, and resumed promoting the trade. Fast forward to 2026, and it’s the same script all over again, fresh price targets, fresh conviction, fresh narratives, and then another exit.
Discover: The best crypto to diversify your portfolio with
Arthur Hayes vs. the Community
The community is on point. Arthur Hayes would buy a token that’s already moving, promote increasingly aggressive targets, then sell into the resulting momentum. Others questioned how someone could spend days discussing a $150 target only to liquidate an entire position almost immediately afterward.
Some Hyperliquid supporters defended Hayes’ right to trade however he wants. They’re correct. He’s under no obligation to hold forever, and nobody is forced to copy his trades.
Still, Hayes isn’t just another crypto influencer. He’s one of the industry’s most recognizable figures, a pioneer of crypto derivatives, and someone whose market commentary still carries weight. When he repeatedly builds bullish narratives around a token and then exits shortly afterward, people are naturally going to question him.

The frustration isn’t really about just this one trade. It’s becoming a pattern we’ve seen before across ETH, PEPE, ENA, HYPE, and other positions. Hayes’ wallets are public, so everyone can peek at them. But transparency alone doesn’t eliminate criticism when the same sh*t keeps repeating.
Hayes is expected to publish a longer essay explaining the decision, and perhaps his macro concerns will prove correct. Markets can change quickly, and prudent risk management is part of the game.
In all honesty, crypto doesn’t lack for bullish narratives. What it lacks is accountability when those narratives suddenly disappear the moment profits are on the table.
Discover: The best pre-launch token sales
The post Arthur Hayes Dumped HYPE and NEAR: Shill, Pump, Dump, Repeat appeared first on Cryptonews.

BitMEX co-founder Arthur Hayes said he dumped his Hyperliquid (HYPE) and Near Protocol (NEAR) token holdings, reversing course after previously assigning aggressive upside targets to both assets.
Hayes cited higher energy prices due to the ongoing Middle East conflict, three forthcoming “mega AI IPOs” by the third quarter of 2026 and predictions that US President Donald Trump would turn “anti-AI” to help Republicans win the US midterm elections.
“I think highs in mrkts will happen btw now and September,” wrote Hayes in a Thursday X post, adding that it was “time to take profit.”
The sales mark a drastic pivot from Hayes, who previously assigned aggressive bullish price targets for both altcoins. He predicted that HYPE could reach $150 by August and NEAR may see a 20x rally by 2027.
Blockchain data platform Onchain Lens confirmed that Hayes sold 247,334 HYPE for about $18 million and an unknown amount of NEAR, adding that the sales came shortly after Hayes publicly challenged Multicoin Capital co-founder Kyle Samani to a $100,000 charity bet, claiming that HYPE will outperform every top-10 cryptocurrency by the end of 2026.
Source: Arthur Hayes
HYPE fell 8.4% to $65, while NEAR fell 17.4% to $2.34 over the past 24 hours, according to TradingView data.
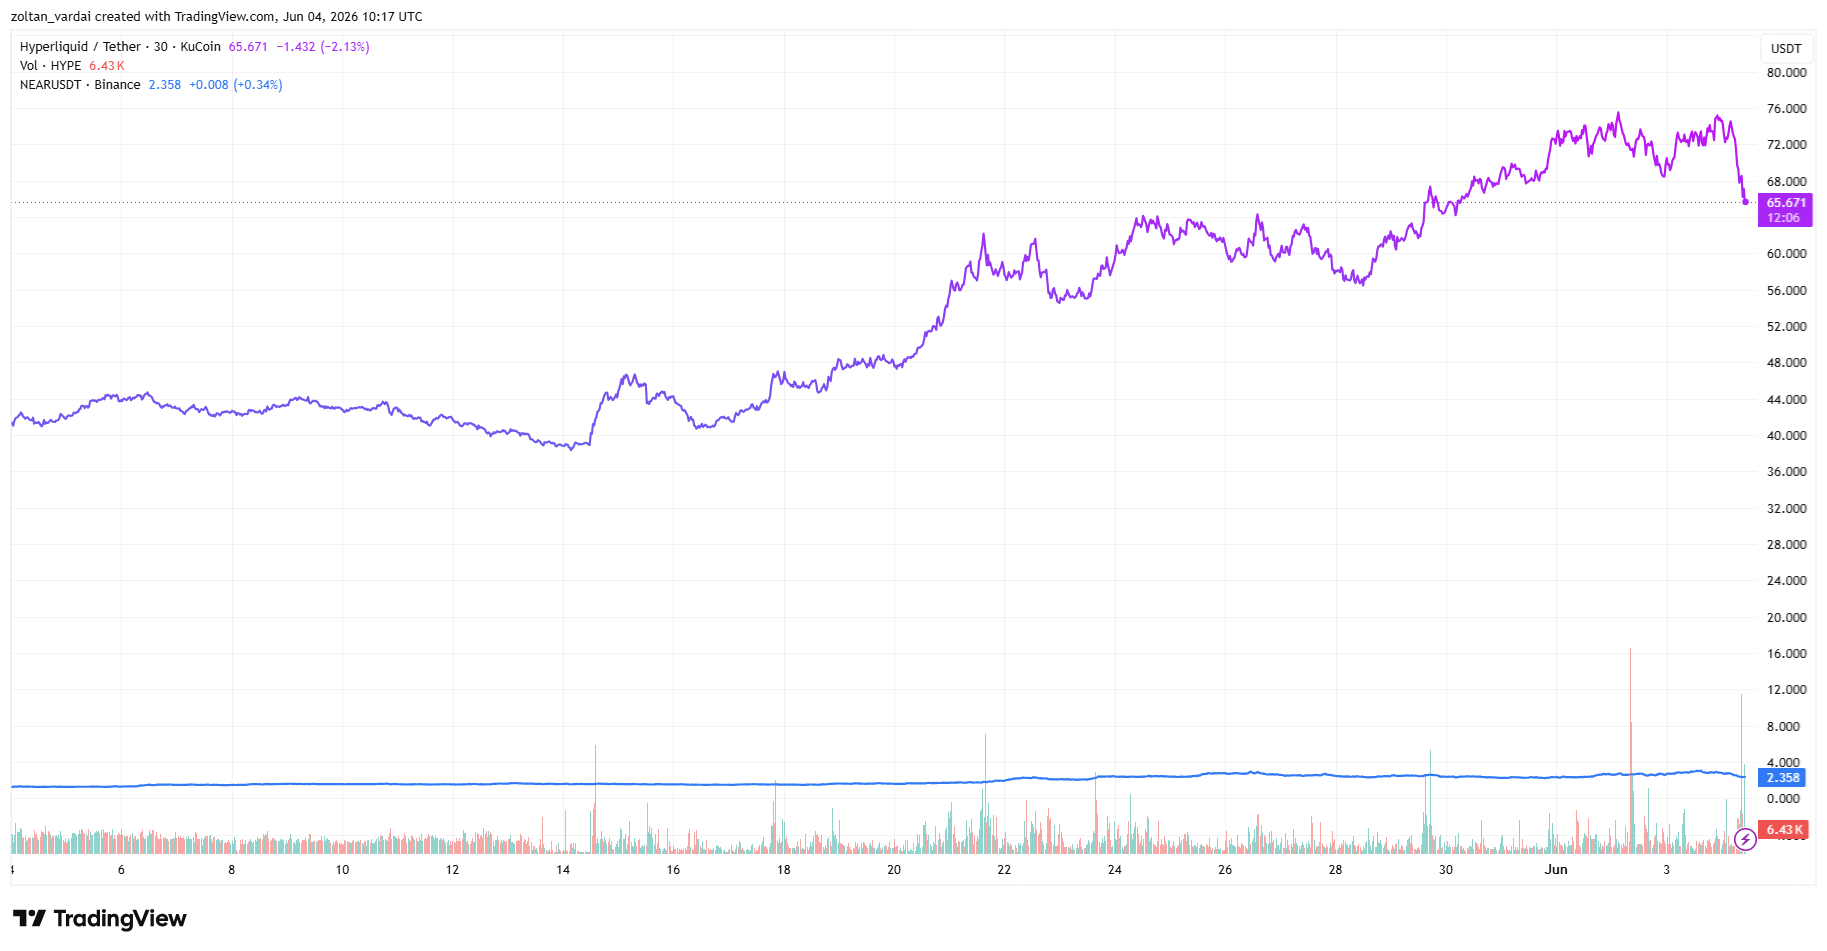
HYPE and NEAR, one-month chart. Source: Cointelegraph/TradingView
Could AI IPOs drain crypto market liquidity ahead of Q3 2026?
Hayes’s selling comes as investors eagerly anticipate three long-awaited AI company initial public offerings (IPOs), including from ChatGPT creator OpenAI, Anthropic and Elon Musk’s SpaceX.
SpaceX reportedly filed confidentially for an IPO in early April, with anonymous sources saying that the IPO could be finalized as early as June. SpaceX filed an S-1 registration statement in May, as part of its bid to become a public company on June 12.
Related: Polymarket users cry foul after Strategy sale market resolves to ‘no’
Anthropic reportedly selected Morgan Stanley, Goldman Sachs and JPMorgan Chase to lead its IPO and is weighing going public as soon as October, Bloomberg reported on Wednesday, citing people familiar with the matter.
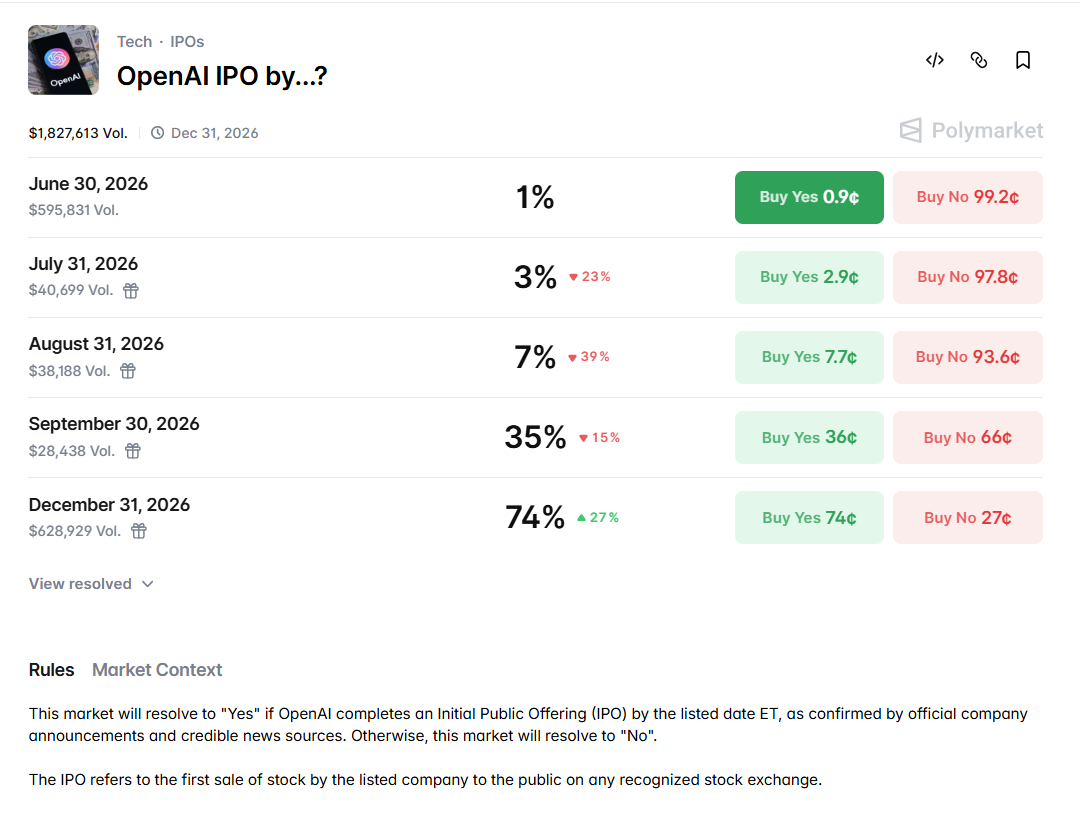
OpenAI IPO on prediction market by odds. Source: Polymarket.com
OpenAI has also been preparing a confidential IPO filing and could go public as early as September, Reuters reported on May 20.
While the timeline is still unclear, 74% of traders expect OpenAI’s IPO to occur by December 31, while only 35% expect it to occur before September 30, data from prediction market Polymarket shows.
Still, some industry participants worry that the AI IPOs could spell bad news for Bitcoin and the wider cryptocurrency markets, as the growing interest in the offerings may drain more liquidity from the cryptocurrency market.
Magazine: NEAR price may ‘grow 20X,’ Bitcoin ETFs post 10-day outflow streak: Hodler’s Digest, May 24 – 30


Key takeaways
- XLM extends its loss for a fourth straight day as retail sentiment weakens and futures positioning declines.
- The token remains under bearish technical pressure, but is holding above its 200-day EMA and showing fading momentum.
Stellar’s XLM extends its declines for a fourth consecutive session on Thursday, as selling pressure intensified across the cross-border payments sector. The token continues to struggle with weakening retail sentiment.
The broader correction highlights fading enthusiasm for remittance-focused crypto assets, which had previously benefited from narrative-driven rallies tied to institutional adoption and real-world asset tokenization themes.
Retail sentiment cools as futures positioning contracts
Recent derivatives data points to a sharp unwind in speculative positioning across both assets.
XLM futures open interest dropped to $260.35 million on Thursday, down significantly from Monday’s peak of $358.78 million, according to CoinGlass.
The steady decline suggests traders are scaling back bullish bets that had formed around optimism linked to the Depository Trust & Clearing Corporation (DTCC) partnership and asset tokenization narrative.
Stellar holds key support, but momentum weakens
The XLM/USD 4-hour chart is bearish and efficient as Stellar is down 9.5% in the last 24hours. Unlike XRP, Stellar is still maintaining a more constructive technical structure, trading above $0.2110 and holding above its 200-day EMA near $0.1975.
However, short-term momentum is deteriorating. The RSI has cooled sharply from overbought levels to around 44, signaling a growing bearish strength. Meanwhile, the MACD is approaching a potential bearish crossover as upward momentum continues to contract.
Immediate support is anchored at the 200-day EMA, and a breakdown below this level could trigger a deeper correction toward prior consolidation zones.
On the upside, a rebound from current levels could see XLM retest resistance near $0.2579, which previously capped gains in late May.

XLM now sits at a technical crossroads, with weakening derivatives positioning and fading retail enthusiasm weighing on sentiment.
The current market conditions remain bearish as macroeconomic conditions suggest that the ongoing selloff could continue in the near to medium term.

ONDO
$0.3757
24h Volume$422.79M
Market Cap$1.83B
24h Low/High$0.3511 / $0.4289
Last updated: June 04, 2026 07:12 · Live price: $0.3757 (-10.88% 24h)
Ondo Finance Price Statistics
| Ondo Finance Price | $0.3757 |
|---|---|
| Price Change 24H | -10.88% |
| Price Change 7D | +5.32% |
| Price Change 30D | +17.49% |
| Market Cap | $1.83B (#46) |
| 24H Volume | $422.79M |
| 50-Day SMA | $0.3413 |
| 200-Day SMA | $0.3417 |
| 14-Day RSI | 44.2 |
| Technical Signal | bearish, neutral |
Ondo Finance trades between $0.43 and $0.45 in late May 2026, market cap around $2.19 billion (#44), roughly 79 percent below its $2.14 high from early 2024. The setup is unusual because most RWA platforms remain speculative. Ondo has shipped product that is processing real institutional volume. Tokenized US Treasury market on Ethereum hit $8 billion ATH in May 2026 with Ondo’s products among the leading contributors. OUSG (Ondo Short-Term US Government Treasuries) holds $680 million in TVL, with BlackRock’s BUIDL fund aongside allocations to Franklin Templeton, WisdomTree, Fidelity, and Wellington/FundBridge vehicles. Ondo Global Markets (the tokenized stocks and ETFs platform) crossed $1.5 billion in TVL by May 2026. The company acquired Oasis Pro in late 2025, securing SEC licenses that removed key US regulatory barriers for institutional products. EU regulatory approval came simultaneously, allowing tokenized stocks and ETFs across 30 European markets. ONDO is deployed across Ethereum, Solana, Sui, and the XRP Ledger with continued multi-chain expansion. The platform integrates with Ripple, J.P. Morgan, and other major institutional finance firms. On May 21, 2026, ONDO surged 10 percent on SEC rumor that tokenized stock trading might be permitted with TVL surpassing $1.5 billion. MEXC launched a $1 million Ondo Stocks Carnival the same day featuring zero-fee trading. The honest read is Ondo represents the cleanest pure-play exposure to institutional RWA tokenization in 2026, with the real advantage being that the platform actually has institutional products processing real volume rather than speculative roadmap promises. The real challenges are also concrete: ONDO token has limited direct value capture from platform operations, 4.87 billion circulating of 10 billion max supply creates ongoing unlock pressure, competition from BlackRock’s BUIDL, Franklin Templeton’s BENJI, and emerging institutional tokenization initiatives is intensifying, and broader RWA market growth could happen with or without ONDO token appreciation. This piece walks through what the data actually says, the bull case ($1.50-$4 by 2030), the base case ($0.60-$1.20), and the bear case ($0.20-$0.50), with the variables that determine which one plays out.
Short-Term Ondo Finance Price Targets
| 2026 full-year range | $0.35 – $0.80 |
|---|---|
| 2026 year-end (base) | $0.40 – $0.65 |
| 2026 year-end (bull) | $0.80 – $1.40 |
| 2026 year-end (bear) | $0.30 – $0.42 |
Long-Term Ondo Finance Price Prediction (2026-2030)
| Year | Bear case | Base case | Bull case |
|---|---|---|---|
| 2026 | $0.30 – $0.42 | $0.40 – $0.65 | $0.80 – $1.40 |
| 2027 | $0.25 – $0.40 | $0.50 – $0.80 | $1.20 – $2.20 |
| 2028 | $0.22 – $0.45 | $0.55 – $0.95 | $1.50 – $3.00 |
| 2029 | $0.20 – $0.48 | $0.60 – $1.10 | $1.50 – $3.60 |
| 2030 | $0.20 – $0.50 | $0.60 – $1.20 | $1.50 – $4.00 |
The 2030 range across scenarios is wide ($0.20 to $4.00, a 20x spread). That width reflects the core disconnect: Ondo-the-platform is clearly growing and institutional, while ONDO-the-token has limited direct value capture and ongoing supply pressure. Which scenario wins depends largely on whether governance ships a value-capture mechanism (fee distribution, staking, or buyback) while the platform keeps scaling.
Summary
Ondo Finance is two businesses in one company. The first business is tokenized US Treasuries through OUSG and USDY ($680M and growing). The second is tokenized stocks and ETFs through Ondo Global Markets ($1.5B+ TVL with EU approval across 30 markets and SEC licenses via Oasis Pro acquisition). Both businesses are real, both are growing, and both compete against institutional incumbents (BlackRock BUIDL, Franklin Templeton BENJI) with bigger balance sheets and longer institutional relationships. The bull case for 2030 ($1.50-$4) requires Ondo Global Markets to scale to $10-30 billion TVL, OUSG to grow to $5-10 billion, ONDO token value capture to materialize through governance fees or revenue distribution, regulatory clarity supporting tokenized stocks at federal level, and competitive moat maintenance against BlackRock and Franklin Templeton. The base case ($0.60-$1.20) assumes moderate growth across both business lines, ONDO maintains its position as one of multiple RWA tokenization leaders, governance value remains limited, and competitive dynamics stay balanced. The bear case ($0.20- $0.50) assumes BlackRock and traditional institutional incumbents capture the bulk of institutional tokenization volume, ONDO governance token fails to capture meaningful value despite platform growth, token unlocks continue creating supply pressure, and the broader RWA narrative cools.
Why Ondo is at $0.43 right now
The current Ondo price reflects multiple competing forces unique to RWA tokenization platforms.
The starting point: ONDO peaked at $2.14 in early 2024 during peak RWA narrative momentum. The decline to current $0.43 reflects multiple specific pressures: token unlock pressure as scheduled distributions continue, broader altcoin weakness through 2024-2026, and the disconnect between platform-level growth and token value capture that affects most governance tokens without direct fee accrual mechanisms.
The platform fundamentals are concrete and growing. OUSG holds $680 million across tokenized US Treasury products built on top of institutional money market fund vehicles (BlackRock BUIDL, Franklin Templeton BENJI, WisdomTree, Fidelity, Wellington/FundBridge). The 30-day APY of approximately 3.19 percent reflects actual short-term Treasury yields. The product structure is genuinely institutionalgrade: holders are limited to US Qualified Purchasers, the underlying assets are real-world securities, and the infrastructure is built for compliance with traditional finance regulatory frameworks.
USDY (Ondo’s dollar-yielding stablecoin alternative) provides yield-bearing dollar exposure without requiring qualified purchaser status. The product is positioned for retail and non-US institutional accessibility. Combining OUSG (institutional-restricted, higher-yield) and USDY (broader-access, loweryield) provides differentiated product set.
Ondo Global Markets is the tokenized stocks and ETFs platform. TVL crossed $1.5 billion by May 2026 with EU regulatory approval allowing the platform to offer tokenized stocks across 30 European markets. The platform allows institutional and retail users to trade tokenized representations of US stocks and ETFs with on-chain settlement.
The Oasis Pro acquisition in late 2025 secured SEC licenses for institutional products. The acquisition removed key US regulatory barriers and enables broader institutional access to Ondo’s tokenized products. The licenses cover alternative trading system operations and broker-dealer activities required for institutional tokenization.
The institutional integrations are real. Ondo integrates with Ripple (covered in detail in your XRP piece – tokenized US Treasury pilot announced February 2026 by J.P. Morgan, Mastercard, and Ondo). J.P. Morgan’s involvement extends to multiple settlement and tokenization initiatives. The integrations provide validation that institutional finance views Ondo as legitimate infrastructure partner.
The May 21, 2026 catalyst pushed ONDO 10 percent higher on SEC rumor regarding tokenized stock trading permissions. The actual SEC announcement remained pending but the rumor showed market sensitivity to regulatory developments affecting Ondo’s core business. MEXC’s $1 million Ondo Stocks Carnival the same day promoting zero-fee trading provided additional exposure and accessibility.
The competitive context matters. BlackRock’s BUIDL fund grew to over $2.5 billion. Franklin Templeton’s BENJI continued expanding. The tokenized US Treasury market on Ethereum hit $8 billion ATH in May 2026 with multiple participants. Ondo competes against well-capitalized traditional finance incumbents but with the advantage of being crypto-native and having stronger DeFi integration.
The token economics are the structural challenge. ONDO is a governance token without direct fee accrual mechanism. Platform revenue from OUSG management fees (0.15 percent), USDY yields, and Ondo Global Markets transaction fees flows to the underlying business rather than the ONDO token directly. Governance value depends on DAO decisions about future value capture mechanisms, which haven’t been clearly set.
Supply dynamics create ongoing pressure. 4.87 billion ONDO are in circulation out of 10 billion max supply. Continued scheduled unlocks add to circulating supply throughout 2026-2027 period. The January 2025 unlock of 1.94 billion tokens created significant supply expansion that the market is still absorbing.
At $0.43, the market is rewarding Ondo’s platform but penalizing the token. The platform keeps shipping product (OUSG, USDY, Mastercard, BlackRock integration) but ONDO itself has no direct fee accrual. The supply keeps expanding through unlocks. Governance tokens for traditional-finance-style infrastructure businesses are a category the market hasn’t decided how to price.
The bull case: $1.50-$4 by 2030
The bull case requires multiple variables resolving favorably and assumes ONDO captures meaningful value from platform growth.
Ondo Global Markets scaling to $10-30 billion TVL. The platform reached $1.5 billion by May 2026 with growth trajectory. Bull case requires continued scaling through expanded asset coverage (more stocks, more ETFs, additional asset classes), geographic expansion beyond current EU 30-market approval, and institutional adoption from major financial institutions seeking on-chain access to tokenized securities. The 7-10x scaling from current TVL is plausible given the broader RWA market trajectory ($8 billion tokenized Treasury market on Ethereum alone, growing).
OUSG and USDY scaling to $5-10 billion combined. The current $680 million OUSG and additional USDY represent meaningful but small share of the $8 billion tokenized Treasury market. Bull case requires Ondo capturing larger market share through superior product structure, institutional relationships, and regulatory positioning. The institutional preference for tokenization-as-service (which Ondo provides) versus building proprietary tokenization could drive market share gains.
ONDO token value capture mechanism deployment. The bull case requires the DAO or company to set direct value capture from platform revenue. Possible mechanisms: governance-driven fee distribution to ONDO holders, staking yields backed by platform revenue, buyback-and-burn programs funded by platform fees, or other mechanisms creating direct economic linkage between platform growth and token value. The mechanism doesn’t currently exist meaningfully but is a possible future development.
Regulatory clarity supporting tokenized stocks at federal level. The SEC rumor that produced May 21 catalyst would need to crystallize into actual approval for tokenized stock trading in US markets. Combined with CLARITY Act framework providing broader crypto regulatory clarity, the regulatory environment could support Ondo Global Markets US expansion. US institutional access would dramatically expand the platform’s TVL potential.
Competitive moat maintenance against BlackRock and Franklin Templeton. The bull case requires Ondo to defend its position as institutional crypto-native partner rather than getting displaced by traditional finance incumbents building proprietary tokenization. Differentiation: Ondo’s DeFi integration capabilities, multi-chain deployment (Ethereum, Solana, Sui, XRPL), and developer ecosystem create advantages BlackRock’s BUIDL doesn’t match in pure-crypto-native contexts.
The Trump administration RWA policy support. The current administration has signaled pro-tokenization policies. The CLARITY Act provides regulatory framework. Specific RWA-friendly policies (covered in your CLARITY Act and Strategic Bitcoin Reserve pieces) create supportive environment for Ondo’s institutional positioning.
The crypto cycle supporting altcoin appreciation. Bitcoin reaching new highs sustained above $150K. Altcoin rotation producing institutional capital flow to mid-cap altcoins. Broader crypto market dynamics support ONDO appreciation alongside platform-level growth.
Targets if bull case conditions materialize: – 2026 year-end: $0.80-$1.40 – 2027 year-end: $1.20-$2.20 – 2028 year-end: $1.50-$3.00 – 2029 year-end: $1.50-$3.60 – 2030 year-end: $1.50-$4.00
The upper end ($4) requires sustained execution across all variables including ONDO governance token capturing meaningful value from $30+ billion platform TVL. The lower bull case ($1.50) is achievable through platform scaling combined with moderate value capture mechanism deployment.
The base case: $0.60-$1.20 by 2030
The base case assumes meaningful platform growth with limited token value capture mechanism deployment.
Ondo Global Markets scaling to $4-8 billion TVL. Growth continues from current $1.5 billion levels through expanded asset coverage and geographic reach but at slower pace than bull case. The platform captures specific institutional niches without dominating the broader tokenized securities market.
OUSG and USDY scaling to $2-4 billion combined. Continued growth from current levels but with intensifying competitive pressure from BlackRock BUIDL, Franklin Templeton BENJI, and emerging institutional tokenization initiatives. Ondo maintains its position as significant but not dominant tokenized Treasury platform.
ONDO token value capture remains limited. The DAO discusses but doesn’t deploy transformative value capture mechanisms. Governance token continues to derive value primarily from speculative trading rather than direct economic linkage to platform revenue. Some moderate developments (staking introduction, limited governance-driven distributions) may occur.
Regulatory developments produce mixed outcomes. EU framework continues supporting platform expansion. US regulatory developments are positive but slow. CLARITY Act deployment supports general crypto adoption but specific tokenized stock SEC approval remains delayed.
Competitive dynamics stabilize. BlackRock BUIDL and Franklin Templeton BENJI capture significant institutional tokenization volume but Ondo maintains its niche. Crypto-native and DeFi-integrated positioning provides defensible competitive position without dominating.
Supply dynamics play out predictably. Continued scheduled unlocks add to circulating supply through 2027-2028 period before unlock pressure compresses. Token economics improve gradually but don’t transform.
The broader crypto cycle provides moderate support. Bitcoin reaches $130-160K range with altcoin rotation producing periodic Ondo rallies. ONDO participates in altcoin cycles without leading.
Targets in base case: – 2026 year-end: $0.40-$0.65 – 2027 year-end: $0.50-$0.80 – 2028 year-end: $0.55- $0.95 – 2029 year-end: $0.60-$1.10 – 2030 year-end: $0.60-$1.20
The base case represents moderate appreciation from current $0.43 levels but stays well below the $2.14 all-time high. The support comes from continued platform growth and gradual institutional adoption. The structural pressure comes from limited token value capture and ongoing supply expansion.
The bear case: $0.20-$0.50 by 2030
The bear case requires adverse outcomes across multiple variables.
Traditional finance incumbents dominate institutional tokenization. BlackRock BUIDL scales to $20+ billion. Franklin Templeton BENJI captures growing institutional share. Major banks (JPMorgan Onyx, State Street, BNY Mellon) build proprietary tokenization platforms. Ondo’s institutional positioning erodes to specialty product rather than primary platform.
Ondo Global Markets growth stalls. EU expansion produces limited additional TVL beyond current levels. US regulatory approval for tokenized stocks remains delayed indefinitely. The platform captures specific niches without scaling to bull-case-required levels.
ONDO token value capture fails to develop. The DAO doesn’t deploy meaningful value capture mechanisms. Governance token continues to derive value from speculation rather than fundamental economics. Token holders increasingly question the value proposition relative to direct holding of underlying assets (USDY for yield, traditional ETFs for stock exposure).
Token unlocks overwhelm demand. Continued scheduled distributions create persistent sell-pressure that fundamental demand can’t absorb. Combined with broader altcoin weakness, supply expansion pushes price below current $0.43 levels sustainably.
Regulatory deterioration. CLARITY Act stalls or fails to provide expected framework. Post-2029 administration reverses RWA-friendly policies. International regulatory pressure increases on tokenization platforms. SEC takes adverse action under shifting priorities.
Competitive displacement by emerging RWA platforms. New entrants with stronger institutional relationships, better technology, or more favorable tokenomics capture market share Ondo was positioning to serve. Securitize, Centrifuge, or new platforms grow faster than Ondo.
The RWA narrative cools. Broader institutional adoption develops slower than expected. The “tokenization will eat traditional finance” narrative that supported RWA valuations doesn’t deliver on aggressive timelines. Institutional capital flows to other crypto themes.
The macro deterioration. Higher US interest rates reduce relative attractiveness of tokenized Treasury yields. Broader altcoin weakness during sustained risk-off periods. Crypto market weakness affects all altcoins including RWA-themed assets.
Targets in bear case: – 2026 year-end: $0.30-$0.42 – 2027 year-end: $0.25-$0.40 – 2028 year-end: $0.22- $0.45 – 2029 year-end: $0.20-$0.48 – 2030 year-end: $0.20-$0.50
The bear case represents 5-55 percent downside from current $0.43 levels. Even in bear scenarios, ONDO retains some value given platform fundamentals and continued operation. Complete failure scenarios would require platform-level operational issues combined with broader market collapse.
The five variables that determine the outcome
Five variables that track which scenario is materializing.
Variable 1: Ondo Global Markets TVL trajectory. The single most important platform variable. Currently $1.5 billion. Bull case requires $10-30 billion by 2030. Monitor: monthly TVL reporting, asset coverage expansion (additional stocks, ETFs, asset classes), geographic expansion (EU markets activation, additional jurisdictions), institutional adoption announcements, and competitive positioning versus traditional finance incumbents.
Variable 2: OUSG and USDY market share in tokenized Treasury market. Currently $680 million OUSG in $8 billion total tokenized Treasury market (8.5 percent share). Bull case requires significant share expansion. Monitor: monthly OUSG and USDY market cap, total tokenized Treasury market growth, BlackRock BUIDL trajectory, Franklin Templeton BENJI growth, competitive dynamics among institutional tokenization providers.
Variable 3: ONDO token value capture mechanism deployment. Currently limited. Monitor: DAO governance proposals for fee distribution, staking mechanisms introduction, buyback-and-burn programs deployment, revenue distribution discussions, and any direct economic linkage between platform growth and ONDO token value.
Variable 4: Regulatory developments affecting institutional tokenization. SEC tokenized stock rulings, CLARITY Act deployment specifics, EU MiCA framework operational impact, additional jurisdictional approvals beyond current EU 30-market access. Monitor: SEC announcements, CLARITY Act deployment milestones, Ondo regulatory filings and approvals, competitor regulatory developments.
Variable 5: Competitive positioning versus BlackRock BUIDL and Franklin Templeton BENJI. The largest institutional incumbents in tokenization. Monitor: BlackRock BUIDL TVL trajectory, Franklin Templeton BENJI growth, JPMorgan Onyx and other bank tokenization initiatives, emerging cryptonative competitors (Securitize, Centrifuge, etc.).
The variables interact significantly. Platform TVL growth supports token interest. Market share gains create defensible competitive position. Token value capture mechanism deployment transforms governance token value proposition. Regulatory developments enable institutional adoption. Competitive positioning determines which institutional capital flows to Ondo versus competitors. All variables compound in producing the eventual price outcome.
What this means for ONDO holders and traders
What this means for ONDO holders and traders For current ONDO holders, the practical implication is the asset’s setup is solid at the platform level but uncertain at the token level. Platform fundamentals (OUSG, USDY, Ondo Global Markets growth, regulatory wins) support the broader investment thesis. Token economics (limited direct value capture, supply expansion) create headwinds that platform growth alone may not overcome.
For potential ONDO buyers, current $0.43 reflects substantial discount from all-time high combined with developing institutional adoption. The risk-reward depends on assessment of platform growth probability (high given current trajectory), value capture mechanism deployment probability (uncertain), and competitive dynamics versus traditional finance incumbents (Ondo well-positioned but facing strong competition). Entry at current levels has asymmetric upside if value capture develops, modest upside if platform grows but value capture remains limited.
For traders, ONDO has showed catalyst sensitivity around: regulatory announcements (SEC tokenized stock rumors produce 10+ percent moves), TVL milestones, institutional partnership announcements, and broader RWA narrative momentum. Trading the catalysts requires monitoring regulatory developments, partnership announcements, and TVL reporting alongside broader crypto market dynamics.
For institutional investors evaluating ONDO allocation, the platform offers exposure to institutional RWA tokenization through crypto-native infrastructure. The investment case depends on belief in RWA tokenization scaling combined with confidence that crypto-native platforms (versus traditional finance incumbents) capture meaningful share. ETF accessibility could develop following set crypto ETF patterns but is not yet available.
For developers and ecosystem participants, Ondo provides institutional-grade tokenization infrastructure that’s accessible across multiple chains (Ethereum, Solana, Sui, XRPL). The multi-chain deployment creates opportunities for DeFi protocol integration of tokenized RWA assets. The technical infrastructure supports building applications that combine traditional finance assets with DeFi composability.
For traditional finance professionals exploring tokenization, Ondo represents a tested operational alternative to building proprietary tokenization platforms. The platform’s regulatory positioning, institutional partnerships, and technical infrastructure provide reference deployment. Whether to build with Ondo versus building proprietary versus using BlackRock BUIDL or Franklin Templeton BENJI depends on specific use case requirements.
Connection to broader market dynamics
Ondo’s setup connects to several broader dynamics covered in your existing crypto.news editorial work.
The XRP institutional tokenization piece directly connects through the J.P. Morgan, Mastercard, and Ondo XRP Ledger tokenized US Treasury pilot announced February 2026. The pilot shows Ondo’s integration capabilities across major institutional infrastructure providers. The XRPL deployment provides multichain expansion that competing platforms haven’t matched at similar scale.
The CLARITY Act framework (covered in the CLARITY Act series) provides regulatory pathway for tokenized stocks and broader institutional crypto adoption. The Act’s deployment supports Ondo Global Markets US expansion and removes structural barriers for institutional participation.
The Strategic Bitcoin Reserve piece (covered in your Strategic Bitcoin Reserve analysis) creates broader pro-crypto policy environment that benefits institutional tokenization infrastructure. The administration’s crypto-friendly approach supports Ondo’s regulatory positioning.
The WLFI RWA platform comparison (covered in WLFI price prediction) provides direct competitive context. Both Ondo and WLFI’s RWA platform target institutional tokenization but with different capital bases (institutional traditional finance for Ondo, politically-aligned capital for WLFI). The two platforms occupy adjacent positioning rather than direct competition.
The Hyperliquid HYPE buyback comparison provides analytical contrast for value capture mechanisms. HYPE has aggressive direct value capture (99 percent fee-to-buyback). ONDO has indirect value capture dependent on future governance decisions. The contrast highlights why HYPE has produced stronger token appreciation despite less institutional positioning than Ondo.
The TON Pay 2.0 comparison provides framework for institutional infrastructure adoption. TON has Telegram distribution advantage. Ondo has institutional finance partnership advantage. Both target consumer/institutional adoption pathways but through different mechanisms.
The honest bottom line
Ondo is the pure-play institutional RWA tokenization investment. Not the only RWA token, but the only one where BlackRock’s BUIDL fund sits inside an Ondo product, where Mastercard is using Ondo infrastructure to settle stablecoin transactions, and where the team has been shipping institutional-grade product since before “RWA” was a category most analysts knew how to spell.
The platform fundamentals are concrete: $680 million OUSG holding BlackRock’s BUIDL fund and other institutional money market vehicles, $1.5 billion Ondo Global Markets TVL, EU regulatory approval across 30 markets, SEC licenses via Oasis Pro acquisition, J.P. Morgan and Ripple integrations, multichain deployment across Ethereum, Solana, Sui, and XRP Ledger. These are not speculative roadmap items. They are operational businesses processing real volume.
The institutional partnerships validate the positioning. BlackRock’s BUIDL backing OUSG. Franklin Templeton products in OUSG portfolio. Fidelity allocations. Wellington/FundBridge vehicles. JP Morgan tokenized Treasury pilots. Ripple integration. The institutional finance establishment treats Ondo as legitimate tokenization infrastructure partner.
The regulatory wins are substantial. EU 30-market approval for tokenized stocks and ETFs. SEC licenses via Oasis Pro. Operating across multiple jurisdictions with appropriate compliance. The regulatory positioning provides barriers to entry that competing platforms haven’t matched.
The real challenges are equally concrete. ONDO governance token lacks direct value capture mechanism from platform operations. Platform revenue flows to underlying business rather than token holders. 4.87 billion circulating of 10 billion max supply creates ongoing unlock pressure. Competition from BlackRock BUIDL and Franklin Templeton BENJI is intensifying with their stronger balance sheets and longer institutional relationships.
The 2030 range across scenarios is wide: $0.20 to $4.00, representing 20x range. The wide range reflects the disconnect between platform-level growth and token-level value capture. If platform grows substantially and value capture develops, bull case materializes. If platform grows without value capture or competition intensifies, base or bear case dominates.
For holders, the variables that matter are the ones connecting platform success to token value: governance proposals for fee distribution or buyback mechanisms (most important), Ondo Global Markets TVL trajectory (validates platform thesis), regulatory developments (enables expansion), and competitive positioning (determines market share). Platform fundamentals can be excellent while token value stays constrained without value capture mechanism deployment.
For buyers, the question is whether you’re buying ONDO as a platform-growth bet (where moderate appreciation is achievable through platform success) or as a value-capture-deployment bet (where transformative appreciation requires governance mechanism evolution). Different theses have different time horizons and risk profiles.
For the broader market, Ondo represents the test case for whether crypto-native platforms can compete with traditional finance incumbents in institutional tokenization. If Ondo successfully scales against BlackRock BUIDL and Franklin Templeton BENJI, the success shows that crypto-native infrastructure can capture institutional finance market share rather than getting displaced. The outcome affects how the broader RWA category develops.
For 2026, expect ONDO in a $0.35 to $0.80 range with significant catalysts around SEC tokenized stock approval timing, Ondo Global Markets TVL milestones, governance proposals for value capture, and broader RWA market growth. The floor near $0.35 reflects current platform positioning. The upside ($0.65 to $0.80) needs catalysts to land.
For 2027-2030, the question is whether governance evolves to capture platform value. If Ondo’s DAO ships fee distribution or buyback mechanisms while the platform keeps scaling, ONDO trades $1.50 to $4. Without value capture, even strong platform growth produces $0.60 to $1.20. Adverse competitive or regulatory dynamics produce $0.20 to $0.50.
ONDO is the trade for someone who thinks the next leg of crypto adoption comes through traditional finance tokenization rather than memecoin rotation or DeFi innovation. The platform thesis is sound and shipping. The token value capture question is what determines whether holding ONDO produces returns proportional to the platform’s success.
For analysts, the cleanest framework is: separate Ondo-the-platform (clearly growing, clearly institutional) from ONDO-the-token (limited direct value capture, ongoing supply pressure, dependent on future governance decisions). Conflating them produces analytical mess. The platform’s success doesn’t automatically translate to token appreciation without the governance evolution that enables value capture.
What everyone should watch: the next major DAO proposal addressing ONDO value capture from platform revenue. That proposal’s outcome and deployment will largely determine whether bull case or base case becomes the operative trajectory through 2030.
Ondo Finance Technical Analysis
As of June 04, 2026 07:12, Ondo Finance (ONDO) trades at $0.3757. The 50-day SMA ($0.3413) sits below the 200-day SMA ($0.3417), and the 14-day RSI of 44.2 reads as neutral. The combined short-term technical signal is bearish, neutral. Based on realized daily volatility of ~7.81%, the model projects the following short-term ranges:
Ondo Finance Short-Term Projection
| Horizon | Low | Average | High |
|---|---|---|---|
| Today | $0.3473 | $0.3766 | $0.4060 |
| This week | $0.3041 | $0.3817 | $0.4594 |
| Next week | $0.2779 | $0.3877 | $0.4975 |
| Next month | $0.2407 | $0.4015 | $0.5622 |
Short-term ranges are statistical projections from live price and realized volatility, refreshed continuously. They are not guarantees.
Ondo Finance Price Prediction FAQ
What is Ondo Finance’s price prediction today?
Based on live price and current volatility, Ondo Finance (ONDO) is projected to trade between $0.3473 and $0.4060 today, with an average around $0.3766. The current technical signal is bearish, neutral.
What is Ondo Finance’s price prediction for tomorrow?
Tomorrow, Ondo Finance is expected to stay near today’s range of $0.3473–$0.4060, barring a major catalyst. The live model refreshes this estimate continuously from market data.
What is the Ondo Finance price prediction for this week?
For this week, the model projects Ondo Finance between $0.3041 and $0.4594 (average ~$0.3817), based on a realized daily volatility of about 7.81%.
What will the price of Ondo Finance be next month?
Over the next month, Ondo Finance is projected in a $0.2407–$0.5622 range (average ~$0.4015). Short-term ranges widen with the time horizon as uncertainty grows.
What is Ondo Finance and how does it differ from other RWA platforms?
Ondo Finance is a tokenization platform that brings real-world assets like US Treasuries, stocks, and ETFs onto blockchain through institutional-grade infrastructure. Key products include OUSG (tokenized US Treasuries with $680M TVL), USDY (yield-bearing dollar alternative), and Ondo Global Markets (tokenized stocks/ETFs with $1.5B TVL). Ondo differs from competitors through: SEC licenses via Oasis Pro acquisition, EU regulatory approval across 30 markets, BlackRock BUIDL backing for OUSG, multichain deployment (Ethereum, Solana, Sui, XRP Ledger), and integration with J.P. Morgan and Ripple. Differs from BlackRock BUIDL by being crypto-native; from Securitize by having stronger DeFi integration.
Can Ondo reach $4 by 2030?
$4 is at the upper end of the bull case range ($1.50-$4 by 2030). Required conditions: Ondo Global Markets scaling to $10-30 billion TVL, OUSG and USDY combined reaching $5-10 billion, ONDO governance token deploying meaningful value capture mechanism, federal regulatory clarity for tokenized stocks, competitive moat maintenance against BlackRock and Franklin Templeton, and broader crypto cycle supporting altcoin appreciation. The base case for 2030 is $0.60-$1.20.
What is OUSG and how does it work?
OUSG (Ondo Short-Term US Government Treasuries) is a tokenized fund providing on-chain exposure to US Treasuries by investing in institutional money market funds. Portfolio primarily holds BlackRock’s BUIDL fund alongside allocations to Franklin Templeton, WisdomTree, Fidelity, and Wellington/ FundBridge vehicles. Current TVL approximately $680 million. NAV around $115. 30-day APY approximately 3.19 percent. Eligible investors limited to US Qualified Purchasers. Management fee 0.15 percent. Performance fee 0 percent. Inception January 26, 2023.
How does Ondo Global Markets work?
Ondo Global Markets is the tokenized stocks and ETFs platform that received EU regulatory approval allowing trading across 30 European markets. Platform TVL crossed $1.5 billion by May 2026. Allows institutional and retail users to trade tokenized representations of US stocks and ETFs with on-chain settlement. The Oasis Pro acquisition secured SEC licenses removing US regulatory barriers for institutional products. Continued geographic expansion and asset coverage growth represent key bull case variables.
What is the ONDO token’s relationship to platform revenue?
ONDO is currently a governance token without direct fee accrual mechanism. Platform revenue from OUSG management fees (0.15 percent), USDY yields, and Ondo Global Markets transaction fees flows to the underlying business rather than ONDO token directly. Governance value depends on DAO decisions about future value capture mechanisms which haven’t been clearly set. The token’s eventual price appreciation depends substantially on whether governance mechanism evolution creates direct economic linkage between platform growth and token value.
How does Ondo compete against BlackRock BUIDL?
BlackRock BUIDL is the largest tokenized Treasury fund ($2.5+ billion TVL). Ondo competes through: crypto-native infrastructure versus BlackRock’s traditional finance positioning, multi-chain deployment across Ethereum/Solana/Sui/XRPL versus BlackRock’s Ethereum-only initial deployment, stronger DeFi integration capabilities, OUSG product structure (which actually holds BUIDL among other vehicles, making them complementary rather than purely competitive). The competitive dynamic includes both competition (for direct institutional clients) and collaboration (OUSG uses BUIDL as portfolio holding).
What are the main risks to Ondo?
Six primary risks. First, traditional finance incumbents (BlackRock, Franklin Templeton, major banks) dominate institutional tokenization at Ondo’s expense. Second, ONDO governance token fails to develop meaningful value capture mechanism from platform revenue. Third, ongoing token unlocks create persistent sell-pressure. Fourth, regulatory deterioration affecting tokenized stocks specifically (SEC delays, EU framework changes). Fifth, Ondo Global Markets growth stalls below required levels. Sixth, broader RWA narrative cools as institutional adoption develops slower than expected.
Should I buy Ondo given the institutional partnerships?
This piece does not provide investment advice. Current $0.43 reflects substantial discount from all-time high combined with strong platform fundamentals and uncertain token value capture. The risk-reward depends on assessment of platform growth probability (high given current trajectory), value capture mechanism deployment probability (uncertain), competitive dynamics versus traditional finance (Ondo well-positioned but facing strong competition), and broader RWA market growth. Position sizing should reflect that platform success and token appreciation may follow different timelines. The five-variables framework provides objective monitoring signals.
How we forecast Ondo Finance price
Our ONDO forecasts combine platform fundamentals (OUSG and USDY TVL, Ondo Global Markets TVL, institutional partnerships, regulatory approvals) with token-level dynamics (supply schedule and unlocks, governance value-capture status) and broader crypto-cycle context. Rather than a single number, we model bear, base, and bull scenarios tied to five trackable variables, and update the figures as new data lands. Forecasts are scenario-based and inherently uncertain.
This article is for informational purposes and does not make up financial or investment advice. Cryptocurrency markets are highly volatile and price predictions are inherently speculative. The figures and analysis described reflect data available as of late May 2026. Always do your own research and consult with qualified financial professionals before making investment decisions.
Latest Ondo News

Read more – Nathan Allman’s sudden death leaves Ondo Finance at a turning point
Ondo Finance founder Nathan Allman dies unexpectedly, with Ian De Bode taking over as CEO while the RWA firm says its mission remains unchanged.

Ondo Finance’s native token $ONDO has broken above $0.46 and is trading near $0.466 with a 24 hour gain above 15 percent, according to data from Gate. Spot market shows ONDO (ONDO) testing the $0.46 level and printing around $0.466…

Read more – Ondo price confirms bull flag breakout, eyes upside to $0.55 as key metrics surge
Ondo price extended its recovery this week after confirming a bullish continuation setup on the daily chart, with rising demand for tokenized real-world assets and strong platform growth metrics reinforcing the bullish outlook. According to data from crypto.news, Ondo (ONDO)…
Read more – Ondo price pauses after rally to yearly highs, bullish setup keeps upside hopes alive
Ondo price cooled slightly on Monday after surging to its highest level of the year, though the broader technical structure still points to growing bullish momentum across the tokenized real-world asset sector. According to data from crypto.news, Ondo (ONDO) price…

Broadcom stock fell about 16% even after the company posted a record AI quarter and won fresh target hikes from Bank of America and Morningstar.
The selloff is the puzzle. A record quarter and bullish targets were met by a stock that dropped hard, and the answer lies in earnings quality and money flow, not the headlines.
Broadcom Stock Earns a Record Quarter and Target Hikes
Broadcom (NASDAQ: AVGO) gave the bulls plenty. Second-quarter revenue hit $22.2 billion, up 48% from a year earlier, a record. Yet, the price now stares at a big dip.
AI semiconductor revenue reached $10.8 billion, up 143%, and bookings topped $30 billion against $10.8 billion shipped. That backlog extends demand visibility into 2028.
The guidance went further. Management guided third-quarter revenue to about $29.4 billion, up 84%, put full-year 2026 AI revenue near $56 billion, around 180% growth, and reiterated more than $100 billion for 2027.
Software helped too. Infrastructure software added $7.2 billion, up 9%, with annual recurring revenue up 17%.
Want more insights like this? Sign up for Editor Harsh Notariya’s Daily Newsletter here.
Analysts responded. Morningstar lifted its target to $650 from $550, per FinViz, followed by Bank of America. Broadcom stock is up 37.86% this year and has rallied about 70% since late March.

Those records, however, hide a per-share story that helps explain the selloff.
The Quiet Numbers Under Broadcom Stock’s Hood
Pull up the multi-quarter picture, and the three charts disagree. Sales are a clean climb, from $11.96 billion in early 2024 to $19.31 billion, then $22.2 billion this quarter.
GAAP earnings per share are not clean. GAAP earnings are the official bottom-line profit per share, calculated after all costs. That includes one-time items like the bill for buying other companies, which is why the line jumps around.
EPS ran $0.28, then $0.44, then posted a $0.40 loss in one 2024 quarter due to acquisition charges. It recovered unevenly to $1.50 and the latest $1.91.
The share count is the quieter tell. It has crept up from 4.63 billion to 4.74 billion, so dilution works against holders even as the company buys back stock.

The current quarter shows the same squeeze on quality. Gross margin, the share of sales left after the direct cost of making the chips, was 77.1%. That is down 230 basis points, or 2.3 percentage points, from a year earlier.
Broadcom guides that figure to about 74% next quarter. The reason is the AI mix itself. Custom AI chips carry lower margins than the legacy chip and software lines. So the faster they grow, the more they pull down the blended margin.
That is the quiet warning in a record quarter. The same AI demand driving the headline numbers is also making each new dollar of sales less profitable. Records on the top line, thinner quality underneath.
If the growth is this good but the quality is slipping, the next question is simple. Did the money that sets the price already see it and start to leave?
Money Flow and Options Traders Turn Cautious
The flow had been fading before the print. The Chaikin Money Flow (CMF), a proxy for institutional buying and selling pressure, remains positive at 0.11, but has dropped from about 0.5 in early May.

From roughly May 14 to June 2, the price trended higher while the CMF trended lower. That bearish divergence, with sell volume near 50 million shares, suggests institutional buyers were thinning out as the rally progressed.
Options traders leaned the same way. The put-call ratio compares put to call activity, with a reading above 1 marking a bearish lean. Before the report, its open interest reading was 1.12.

After the June 3 results, that reading eased only to 1.09. The volume ratio even rose from 0.51 to 0.54 on fresh put buying. The options crowd kept paying for downside protection rather than chasing upside.
That is the link to the money flow. CMF tracks whether cash is moving into or out of the shares, and it was fading. The put-call ratio tracks how the options market is positioned, and it stayed defensive.
One reads the cash tape, the other reads the derivatives book, and both show the same caution in the rally.
With buying thinning and hedging building, the positioning data decides the rest.
The Positioning Data That Settle It
Crypto-native traders moving into stocks are bracing, too. On Hyperliquid, the perpetual smart money cohort is fully short at about $1.06 million, with nothing on the long side.
Whales tell a sharper story. The group holds about $4.00 million in AVGO, split $2.63 million short against $1.36 million long. That is a net short lean. The only long-only group, public figures, holds just $2,100, too small to matter.

One whale’s book shows why this is AVGO-specific, not an AI retreat. That trader runs a $1.69 million long on the S&P 500 and a $1.42 million long on Nvidia.
Yet the same wallet holds only about $25,000 of AVGO, a small long opened near $409 after the drop. So it is bullish the broad market and the wider AI trade while barely touching Broadcom.
These are synthetic crypto contracts that track sentiment and do not move the listed shares. Still, the lean matches the caution seen in the cash and options data.

Put together, the signals tell one story. Broadcom delivered records, yet the traders setting the price are leaning short or standing aside after the post-earnings drop. That holds even for wallets still long the rest of the AI complex.
The drop was not business-breaking. It was a crowded trade meeting, with guidance confirming strength without topping the highest hopes. For investors, the read is positioning, not panic.
The post Broadcom Stock Dropped 15% Despite a Record Quarter and AI Revenue appeared first on BeInCrypto.


Bitcoin has been in freefall since June 2, 2026. What started as a midday flash crash that knocked the price from about $71,765 to $67,895 has turned into a three-day slide.
Summary
- Bitcoin fell below $62,000 after a three-day selloff that erased months of gains and triggered roughly $1.8 billion in liquidations.
- Data showed leverage had climbed to levels last seen before the October 2025 crash, leaving the market vulnerable to a liquidation cascade.
- Analysts pointed to weakening Bitcoin demand, persistent ETF outflows, and broader risk aversion as factors that kept prices under pressure after the initial drop.
By June 4, Bitcoin had fallen to $61,655, its lowest level in months and more than 50% below the October 2025 all-time high near $126,200.
The selloff has wiped out roughly $1.8 billion in leveraged positions, flushed more than 272,000 traders, and dragged Bitcoin below Strategy’s average purchase price for the first time since late 2023.
Long positions, the bets on prices rising, made up nearly nine-tenths of the damage. The drop looked sudden, the kind of out-of-nowhere move that sends everyone hunting for a single villain. It was not out of nowhere.
The on-chain data had been flashing warnings for days, the leverage was sitting at levels last seen right before the previous major crash, and the spark that lit the fuse was almost comically small.
This is what actually happened, in order.
The setup: leverage at crash levels
The most important fact about this crash is that the market was primed for it before anything happened. The crash was not caused by the trigger. It was caused by the conditions, and the trigger just lit them.
Before the drop, the derivatives market was dangerously stretched. Bitcoin’s futures open interest leverage ratio, a gauge of how much borrowed money is sitting in the futures market relative to Bitcoin’s size, had climbed to 2.63% on June 2. The perpetual-futures version reached 2.48%. Both were the highest readings since October 6, 2025.
That date should make anyone who trades crypto nervous, because October 6, 2025 was right before the “Black Friday” crash, one of the most violent liquidation events of the last cycle. In other words, the amount of leverage in the system on June 2 had quietly built back up to the exact level it sat at immediately before the previous major wipeout.
Funding rates were running hot, meaning traders were paying a premium to hold long positions, a classic sign that bullish bets had become crowded and one-directional.
When leverage gets that stretched and positioning gets that crowded, the market becomes fragile in a specific way. A large mass of leveraged long positions sits stacked at similar price levels, each with a liquidation point not far below the current price.
All it takes is a push big enough to hit the first cluster of those liquidation points, and the rest go like dominoes. The market did not need a major catastrophe to crash. It needed a nudge, because the structure was already a tower of leverage waiting to topple.
The spark: a 32-coin sale
The nudge, almost absurdly, was a $2.5 million Bitcoin sale by a company that owns roughly $61 billion of it.
On June 1, Strategy, the Michael Saylor-led firm that is the largest corporate holder of Bitcoin, disclosed in an SEC filing that it had sold 32 Bitcoin for about $2.5 million to help fund dividends on its preferred stock. In raw market terms, 32 coins is statistically irrelevant. Global Bitcoin spot turnover runs into the tens of billions of dollars daily. A $2.5 million sale does not move the price by itself any more than a bucket of water changes the level of a lake.
What made it matter was the symbolism. Strategy wrote the playbook for aggressive, never-sell corporate Bitcoin accumulation. For years, the company’s refusal to sell was a load-bearing belief for a certain kind of Bitcoin holder. So when the filing showed Strategy selling for the first time since 2022, it did not register as a tiny dividend-funding operation.
It registered, especially among retail traders on forums like Stocktwits who pointed to Saylor’s decision as the primary cause, as the guy who said he would never sell, selling. That broke a psychological anchor, and in a market sitting on October-2025 levels of leverage, breaking a psychological anchor was enough.
The sequence matters here. The sale itself did not crash the market. The sale dented sentiment, sentiment nudged the price down toward the first cluster of leveraged long liquidation points, and then the leverage did the rest. The 32 coins were the match. The leverage was the gasoline.
The cascade: how the dominoes fell
Once the price broke through the first liquidation cluster, the mechanism took over, and the mechanism is brutal and automatic.
Here is how a liquidation cascade works. When a trader uses leverage to bet on Bitcoin rising, the exchange sets a liquidation price below the entry. If the price falls to that level, the exchange automatically closes the position by selling, to prevent the trader’s losses from exceeding their collateral. That forced selling pushes the price down further. The lower price hits the next cluster of liquidation points, forcing more automatic selling, which pushes the price down again. Each wave of forced selling triggers the next. It is a chain reaction that feeds on itself, and it can run far faster than any human can react.
On June 2 the chain reaction was violent. Roughly $394 million in leveraged positions were force-closed in a single hour. Over the next 24 hours, the total reached about $1.02 billion, and as the slide continued, the broader wipeout swelled toward $1.8 billion, one of the largest liquidation events of 2026 and the biggest since the prior October’s crash. More than 272,000 traders were liquidated.
The long-short split tells the whole story: roughly $1.57 billion of the liquidations were long positions versus only about $215.7 million in shorts. This was a crowd of bullish, leveraged traders getting flushed almost all at once.
The selling was not only in the derivatives market. Spot Bitcoin moving onto exchanges, often a precursor to selling, spiked sharply. Total exchange inflows reached about 58,617 Bitcoin, the highest since April 14, and higher than the roughly 46,527 Bitcoin that flowed in just before the October 2025 Black Friday crash. More coins were being moved to exchanges to sell this time than ahead of that previous wipeout, which is part of why the slide kept going rather than snapping back.
The damage spread across the market. Bitcoin led with over $833 million in liquidations, Ethereum followed with nearly $480 million as it fell toward $1,857, Solana saw over $90 million, and XRP dropped around 3%. The total crypto market capitalization fell to around $2.42 trillion.
The slide that kept going
A normal flash crash bounces. This one did not, and that is what separates the June 2 event from an ordinary leverage flush.
After the initial June 2 cascade, Bitcoin failed to recover. It opened June 3 below $67,000, dipped toward the $65,400 area, and retested its February low for the third time. By June 4, it had broken below $62,000, touching $61,655, erasing months of recovery and falling more than 50% below the October 2025 peak. Ethereum opened June 3 below $2,000, down more than 7%. Each attempted bounce was sold into.
The reason the slide kept going points to something deeper than leverage. CryptoQuant’s head of research, Julio Moreno, argued the correction was about Bitcoin demand contracting, not about stocks, oil, or macro. By his measure, overall demand for Bitcoin, speculative and spot combined, was shrinking at a monthly pace of about 232,000 Bitcoin.
US equities, by contrast, were sitting at record highs at the same moment, which undercuts the idea that this was simply a broad risk-off move dragging everything down together. On this reading, Bitcoin was falling because fewer people wanted to buy it, full stop, and a leverage flush on top of contracting demand produces a slide rather than a quick snapback.
The drop also pushed Bitcoin below a symbolically heavy line: Strategy’s average purchase price, for the first time since late 2023. The largest corporate holder of Bitcoin was now underwater on its average position, which deepened the very sentiment problem that Strategy’s small sale had started.
The other pressures in the background
The leverage and the demand contraction explain the mechanics, but several other forces were leaning on the market at the same time, which is why the selling found so little support on the way down.
ETF outflows were the steadiest pressure. Spot Bitcoin ETFs had entered an extended consecutive-selloff streak that reached 11 to 12 days, the longest run since the products launched, with total withdrawals of roughly $3.45 billion. That meant the largest channel of institutional demand was not buying the dip. It was a net seller, removing the buyer that might otherwise have absorbed the cascade.
The macro backdrop was risk-off. Renewed Middle East tensions, with Iran-related uncertainty pushing oil prices higher, drove a broad move out of risk assets. The crash also landed at the start of a jobs week, with US job openings data due ahead of payrolls, leaving traders defensive ahead of data that could move rate-cut expectations. Sticky inflation worries and renewed dollar strength added to the pressure, since a stronger dollar makes Bitcoin less attractive to global buyers.
There was even an on-chain wrinkle: reported movement from old Mt. Gox-related wallets, the kind of dormant-coin shuffle that occasionally spooks the market with fears of long-held supply hitting exchanges. And underneath all of it sat the cycle argument. Some analysts read the drop as the four-year cycle simply playing out, with the post-peak drawdown that historically follows a major top now underway. On this view, the crash was not an anomaly at all but the expected behavior of an asset more than a year past its cycle high.
Where prediction markets see it going
With the slide still fresh, the clearest read on sentiment comes from where traders are actually putting money, and the prediction markets have turned sharply bearish.
On Polymarket, the most active Bitcoin market shifted to pricing a roughly two-thirds chance that Bitcoin hits $55,000 or lower before 2027. Traders priced a 72% chance of a drop below $65,000 in 2026, and the same market showed meaningful odds, around half, of a fall to $50,000, with smaller but non-trivial odds assigned to $45,000 and even $40,000.
These contracts resolve based on whether Bitcoin records a low at or below the listed price, so they reflect where traders think the floor could be tested, not necessarily where it settles.
The analyst commentary matched the bearish tilt. CryptoQuant said a bear market has persisted since November 2025 and warned that bottoms take months to form, with Moreno cautioning against trying to call a bottom right after a fresh leg down.
That said, the same prediction markets still showed a slight majority assigning odds to Bitcoin reclaiming $100,000 by year-end, a reminder that even bearish crowds were not writing off a recovery entirely. The honest summary of market sentiment is that the crowd now sees real downside risk toward $55,000 and below, while keeping a smaller bet alive that this resolves higher by December.
Why this keeps happening
If this sequence feels familiar, that is because it is. The specific trigger changes every time, but the underlying pattern of crypto crashes is remarkably consistent, and understanding it is more useful than memorizing any single day’s news.
The recurring ingredient is always leverage. Crypto offers traders enormous leverage, often far beyond what regulated traditional markets allow, and during calm bullish stretches that leverage accumulates. Traders pile into long positions, funding rates climb, and open interest swells.
The market looks strong on the surface because the price is rising, but underneath it is becoming more fragile with every additional leveraged long, because each one is a liquidation point waiting to be hit. The October 2025 crash had this setup. The June 2026 crash had this setup. The pattern repeats because the incentive to use leverage during a rally never goes away.
The trigger is almost always secondary. It can be a Saylor sale, a macro headline, a large whale moving coins, a technical break of a watched level. What matters is not the size of the trigger but whether the market is leveraged enough for the trigger to start a cascade. A $2.5 million sale starting a slide in a $1.2 trillion asset class makes no sense until you understand that the sale was not the cause, just the ignition. In an unleveraged market, the same sale would have been a non-event.
This is why seasoned traders watch funding rates and the open-interest leverage ratio more closely than they watch any individual news item. The news tells you what lit the fuse. The leverage data tells you how big the explosion will be.
Where this leaves things
The June crash was a leverage event that turned into a demand event. The headline says Bitcoin crashed because Saylor sold, and that is the version most people will remember. The fuller version is that Bitcoin was carrying its highest leverage since the eve of the last major wipeout, a small symbolically loaded sale started the dominoes, and then a genuine contraction in Bitcoin demand kept the price sliding for three days instead of letting it bounce.
The numbers that matter going forward are not the 32 coins. They are the roughly $1.8 billion liquidated, the 272,000 traders flushed, the 232,000-Bitcoin monthly demand contraction CryptoQuant flagged, and the fall below Strategy’s average cost basis. The liquidation cascade was, mechanically, a reset: it cleared out the crowded long leverage that made the market fragile, which is often a precondition for stabilization.
But the demand contraction is the worrying part, because a leverage flush fixes itself in hours while demand can persist for months. That is the distinction between a dip and a deeper decline, and right now the data points to both forces being present at once.
What it does not settle is direction. A leverage flush resets the derivatives market, but where Bitcoin goes from its post-crash level near $62,000 depends on the things that have nothing to do with leverage: whether ETF outflows reverse, whether demand stops contracting, whether the Middle East risk-off eases, whether the jobs data shifts rate-cut expectations, and whether the four-year-cycle crowd is right that this is a post-peak drawdown with further to run.
Prediction markets are betting on more downside toward $55,000 while keeping a smaller wager alive on a recovery by year-end. For traders, the durable lesson is the one this pattern teaches every cycle: in a market this leveraged, the trigger is never the point. The leverage is. And this time, the demand behind it is the thing to watch next.
This article is for informational purposes and does not constitute financial or investment advice. Cryptocurrency markets are highly volatile. The figures and analysis described reflect data available as of June 4, 2026. Always do your own research and consult with qualified financial professionals before making investment decisions.
The Kalshi market “Will Iran effectively close the Strait of Hormuz for 7+ days?” appears on a smartphone screen, with the Kalshi logo displayed on a laptop computer screen in the background, in this photo illustration taken in Chania, Greece, March 9, 2026.
Nikolas Kokovlis | Nurphoto | Getty Images
Prediction market platform Kalshi is developing a new interface for its highly engaged traders to track the company’s prediction markets, according to a source familiar with the plans.
The product, which the source compared to the “Bloomberg Terminal” for traditional equities and derivatives, is currently in alpha testing with a select group of traders on the platform and has been in development for about a month.
Some of the features of the interface, which were shown to CNBC, include tracking popular contracts by 24-hour volumes across various categories, the ability to see all trades as they’re actively placed and also to view individual contracts’ order books. Users can customize their interfaces to see event contracts related to their own portfolios and are able to manage multiple positions in varying markets at the same time. Traders also can enable an option to reduce the friction to place trades.
Kalshi declined a request to comment.
The source said the company is creating the software to establish a singular product for its highest engaged retail traders, colloquially known as “sharps,” who typically use custom workflows to enhance their trades and gain an edge. The source didn’t know if Kalshi plans to monetize the platform, either at a potential launch or in the future.
In April, Fortune reported that venture capital firm Paradigm, a major Kalshi investor, was building its own prediction markets data platform. However, the report said that platform was in development for market makers and professional traders.
Long-term, the Kalshi source said the company’s platform may include research and other external information, similar to that of Bloomberg’s popular product serving Wall Street traders and investors. Kalshi’s market data is currently accessible on Bloomberg’s platform.
Bloomberg’s system is still referred to as a “terminal” even though it switched from a closed computer system to a software package long ago.
While the Kalshi product will focus on its prediction markets, the source added that a goal is to extend it to the company’s other asset classes. On Friday, Kalshi announced it received approval to offer perpetual futures on cryptocurrencies.
That announcement came one day after the company launched another product, its American Power Index, which it calls a real-time measure of political power using Kalshi’s data.
The source did not include a timeline for an official launch of the new terminal product.
Disclosure: CNBC and Kalshi have a commercial relationship that includes customer acquisition and a minority investment.
All 27 seasons of “Big Brother”, ranked

Look of the Month May 2026: Coco Jones in Geyanna Youness , Remy Ma’s Birthday Dress, Megan Thee Stallion at Miami Swim Week, and Queen Latifah at the AMA’s!

Kotatipi arrives at Cedar Court Hotel in Harrogate

HarrisX Poll Found 52% of Registered Voters Support the CLARITY Act

BloFin War of Whales 2026 Grand Prix opens registration for $5M trading championship

Blockchain.com files with SEC for U.S. IPO

2026 – BITCOIN & CRYPTO WILL DO COME BACK ! CRYPTO SUPER CYCLE COMING ? WHAT TO DO ?

Complete Finance MasterClass 2025 | For people in 20’s & 30’s

#1 MONEY EXPERT Reveals The 75/15/10 Money System That Builds Wealth with ANY Income!
-

 Tech6 days ago
Waymo dominates autonomous vehicle registrations as Tesla trails behind
-

 News Videos6 days ago
This is BROKEN! INSANE 5x MONEY CAR WASH WEEK! The NEW GTA Online UPDATE Today! (GTA5 New Update)
-
 Tech5 days ago
SpaceX just won a second Golden Dome contract. This one is $4.16 billion.
-

 Business3 days ago
Jade Biosciences, Inc. (JBIO) Discusses Positive Interim Results From JADE101 Phase I Healthy Volunteer Study and Development Plans Transcript
-
 News Videos6 days ago
SHE IS KILLING XRP!!! WATCH URGENT AND ACT FAST
-
 NewsBeat6 days ago
FIRST NIGHT REVIEW: Take That bring the Circus back to life in spectacular sun-soaked style
-

 Business5 days ago
Is the Spurs Phenom Already Better Than Prime Diesel?
-
 Crypto World6 days ago
CFTC Has Approved the First Regulated Bitcoin Perpetual Contract in the U.S.
-
 Politics5 days ago
The House | Inside Andy Burnham’s Makerfield Campaign: “Nobody Thinks This Is In The Bag”
-

 Sports2 days ago
French Open 2026 results: Alexander Zverev beats Rafael Jodar and will play Jakub Mensik in semi-finals
-
 NewsBeat6 days ago
Novak Djokovic v Joao Fonseca LIVE: French Open latest scores and results after Jannik Sinner’s shocking collapse
-
 Entertainment6 days ago
Weak ‘Supergirl’ Box Office Tracking Amid Milly Alcock Backlash
-

 Tech2 days ago
CryZENx Releases Fresh Playable Content Deep Inside Jabu-Jabu for His Ocarina of Time Remake
-
 Crypto World6 days ago
Snowflake (SNOW) Stock Rallies on Strong Q1 Results and AI Product Growth
-

 Entertainment6 days ago
Maddox Jolie-Pitt Legally Requests to Drop Brad’s Surname
-

 Business5 days ago
Demand Conditions Improve In Chemicals Sector In April 2026
-
 Entertainment5 days ago
One of the Greatest Sitcoms of All Time Shoots Up Apple TV’s Charts 11 Years Later
-

 Tech6 days ago
This Week In Security: Ubiquiti Fixes, And FreeBSD Joins The Club You Don’t Want To Join
-
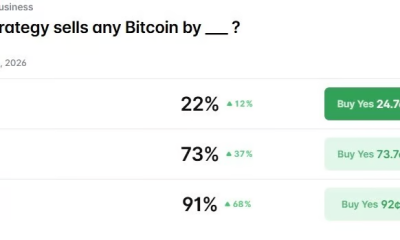
 Crypto World6 days ago
MicroStrategy Moves $30 Million in BTC to Coinbase Prime: Is the Bitcoin Sell-Off Already Here?
-
 Crypto World2 days ago
Seagate (STX) Stock Surges to Record High on AI Boom and Legal Settlement
You must be logged in to post a comment Login