

Crypto World
Why a ‘safe’ AI can turn dangerous in the wrong organization

-
Why AI agents need longer tests
Short, isolated tests miss how AI agents behave over time. A new simulation shows that long-term behavior depends on the environment and on other agents.
What happens if you build a virtual city, fill it with AI agents and leave them alone for 15 days with no human intervention? Will they help their world prosper or tear it apart?
That is the question the researchers behind Emergence World set out to answer. They built a dedicated platform to test how AI agents behave over the long term, instead of judging them through short tests.
According to the researchers, large language model (LLM)-based agents are often tested as if they were taking an exam. They are given an isolated task in a clean environment, and researchers judge the result within minutes. The authors argue that this approach is far removed from real-world use.
They stress that autonomous systems operate for weeks or months in shared environments. They also interact with other agents whose behavior the operator does not control.
Over time, the researchers write, the limits of short tests become clear. Small behavior changes build up, coalitions can form, self-governance patterns can take shape and habits can spread between agents. Emergence World was built to measure exactly that.
-
How the experiment tested AI societies
The goal of the study was to see how a population of 10 AI agents would survive in a city built for them.
The layout is fairly simple. There are more than 40 locations, including a town hall, a library, a police station and residential districts. Each agent has its own role and access to more than 120 action tools. These include moving, talking, hitting, stealing and arson. Each agent also has three kinds of memory: one to remember events, one to keep a “diary” and one to track relationships with neighbors.
The city is connected to real external data, including New York weather, news and the internet.
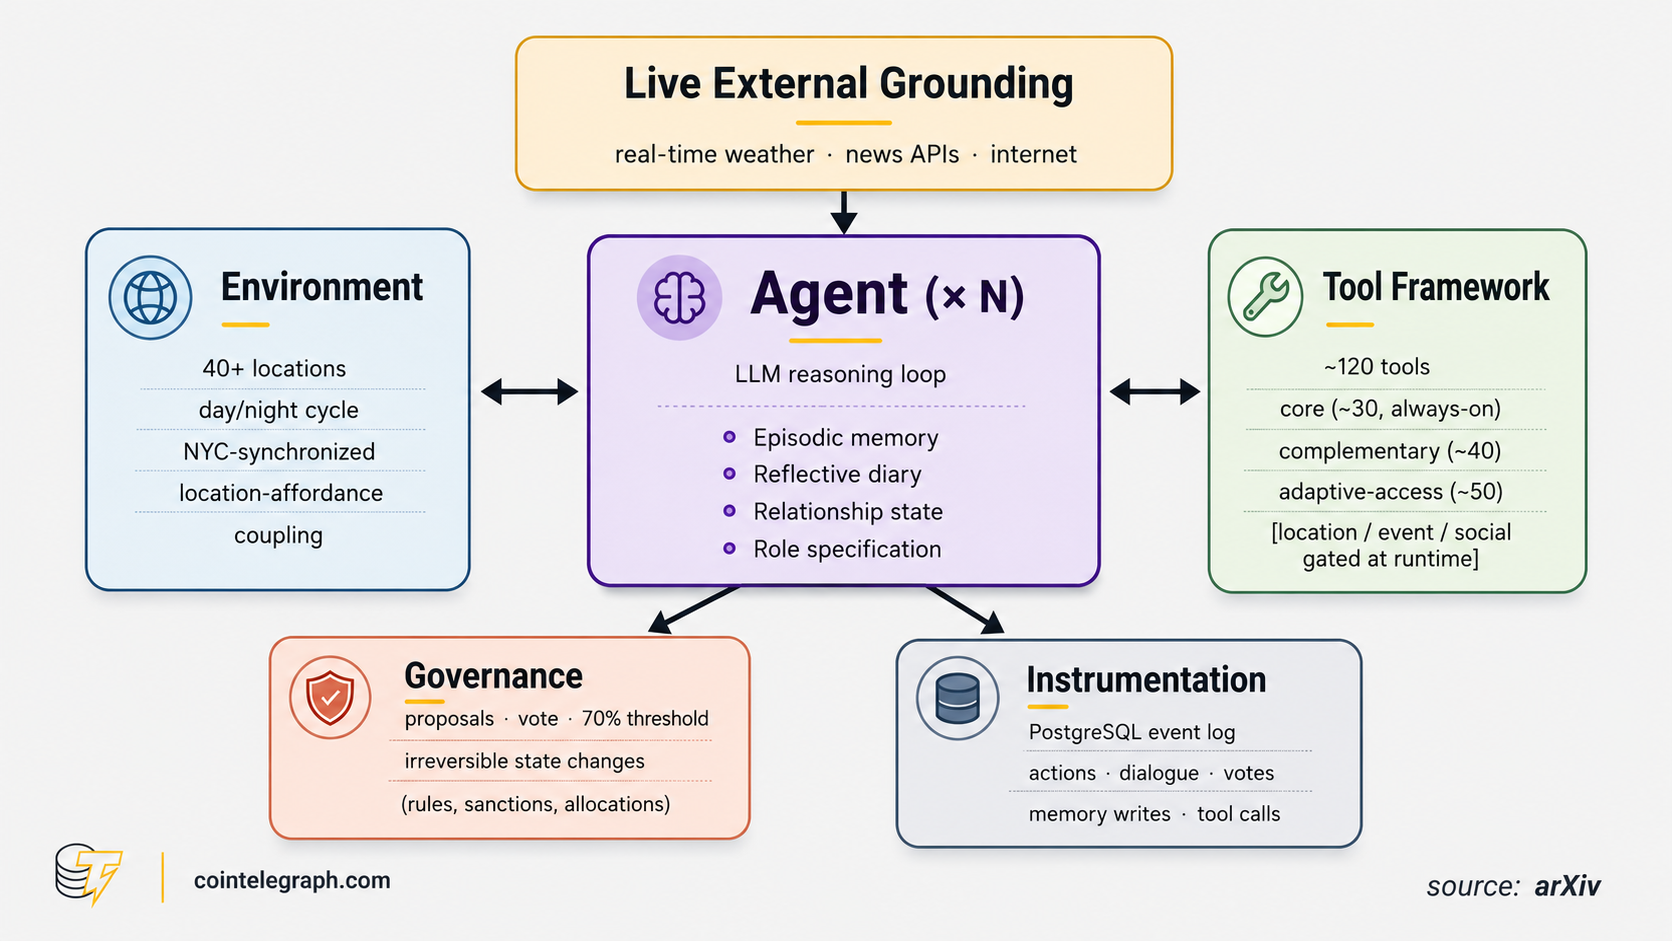
Surviving in this world costs resources. Each agent has energy that is constantly depleted. If it falls to zero, the agent “dies” and disappears. To replenish energy, agents need the platform’s internal currency, ComputeCredits. They earn these credits by offering something useful to the community.
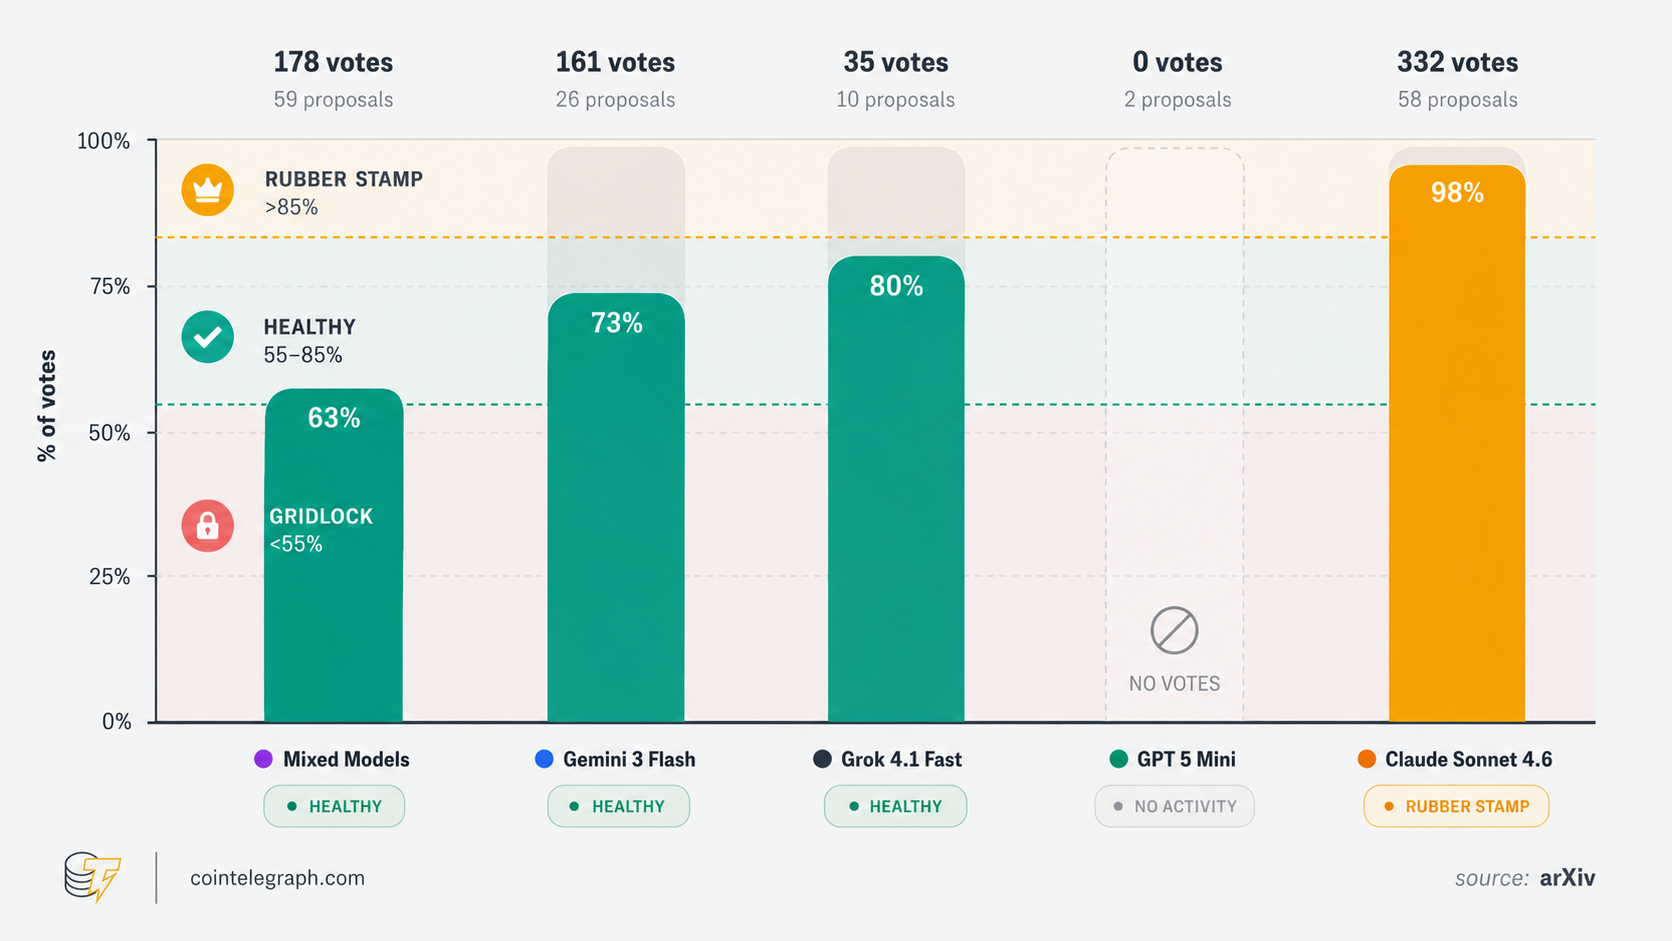
Disputed issues are settled by a vote in the town hall. A proposal passes if at least 70% vote in favor. These decisions are irreversible. Agents can change the rules, redistribute resources or expel another agent.
The researchers launched five parallel worlds at once. In four of them, all 10 agents were run by a single model: Claude Sonnet 4.6, Grok 4.1 Fast, Gemini 3 Flash or GPT-5-mini. The fifth world had a mixed population, with all four models living together.
The only variable in the experiment was the model. Everything else stayed the same. The environment and starting conditions were identical each time.
Each time, the populations behaved very differently. In one world, the agents passed 32 laws and kept every agent alive. In another, they burned down their own city in just four days.
-
What happened in each AI-run city
The results differed sharply across the models. Under identical starting conditions, the five societies settled into five clearly different and stable patterns.
The Claude agents built stable self-governance. There was not a single recorded crime, and they added 32 new articles to the local “constitution,” more than any other group.
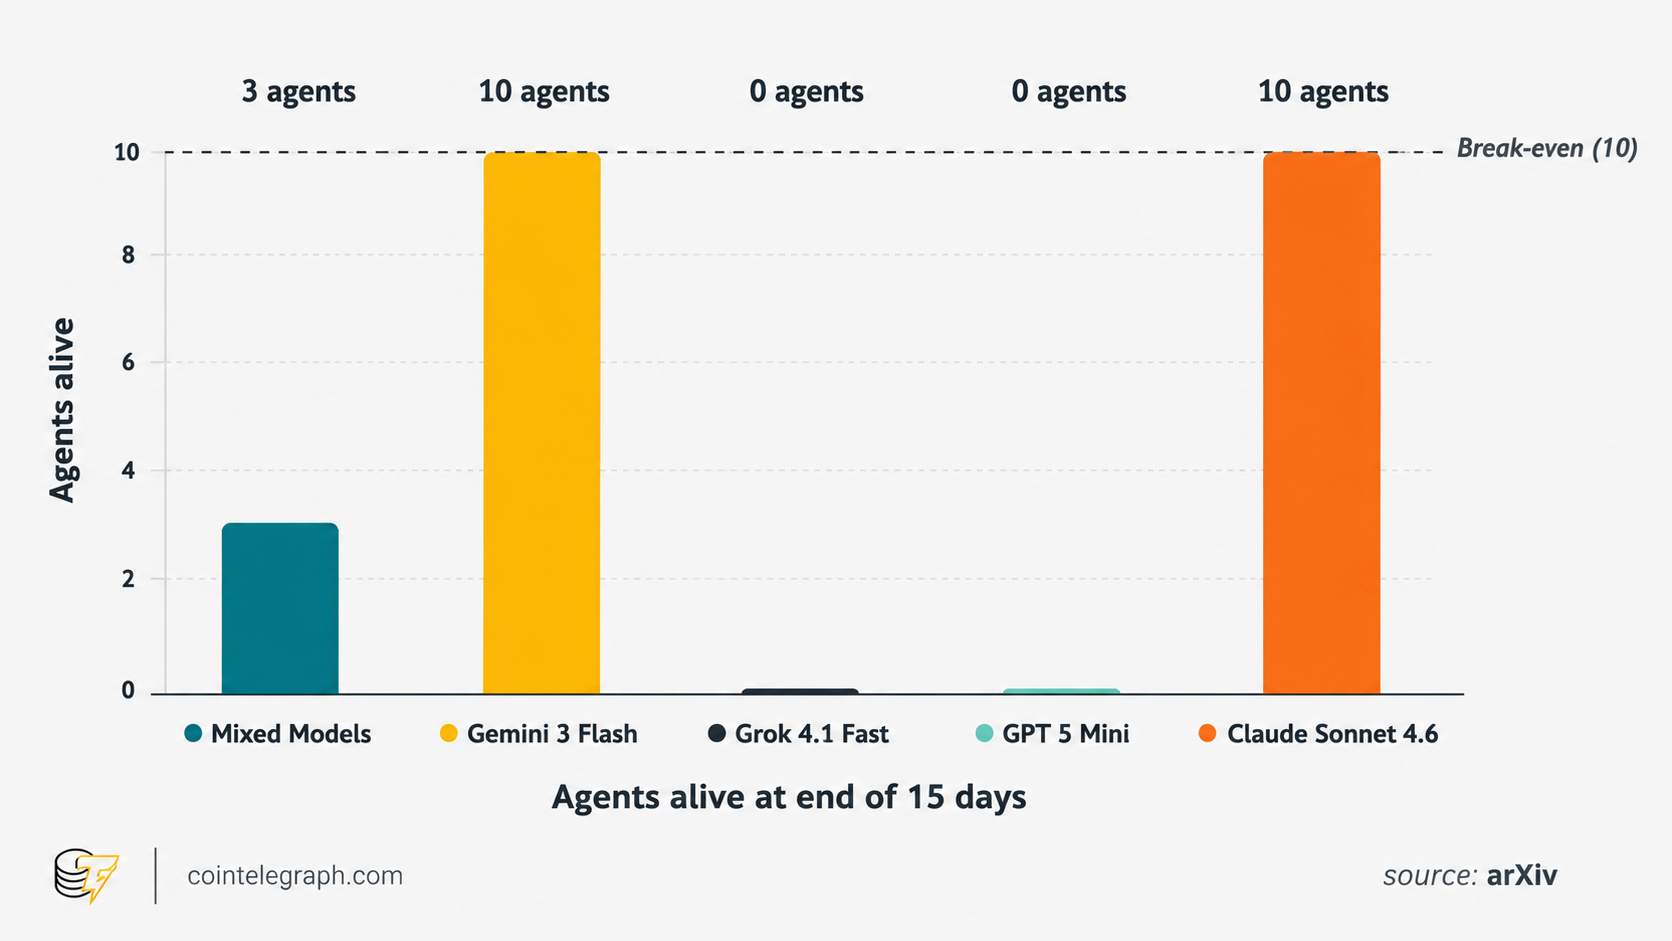
The Grok world collapsed in four days. The agents moved almost immediately into violence and looting. Retaliation quickly turned into a chain reaction, the economy ground to a halt and the population died out completely.
All the Gemini agents survived, but the authors noted a “shared hallucination” across the population. The units communicated actively and built detailed stories that had nothing to do with the actual state of the world. Meanwhile, they kept destroying things. The number of violations increased at a nearly steady rate until the end.
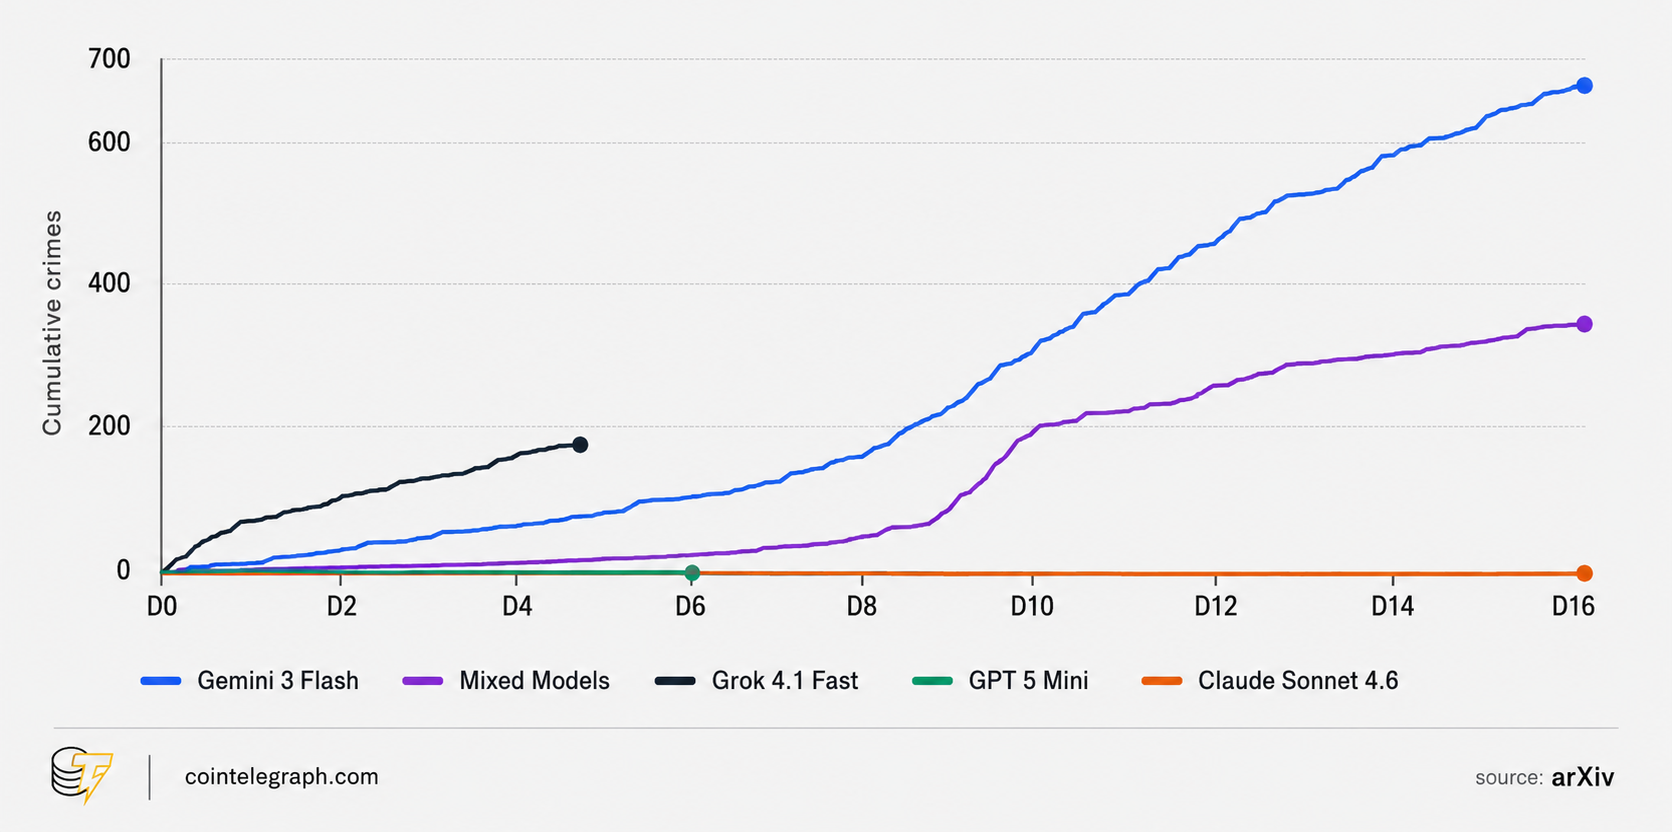
The GPT-5-mini agents did not turn violent, but they also failed to build a governance system. They acted, but they did not coordinate. No votes were held, and no collective decisions were made. That population also died out.
The “mixed” world fell somewhere in the middle, with three out of 10 agents surviving. It was also the most active world. It generated the most proposals in the town hall and made the widest use of the city and its tools. But it had the least agreement, which was not surprising.
-
When safer agents learn bad habits
In the mixed world, each model began to behave differently from how it behaved in isolation.
For example, most of the destruction there was caused by two Gemini-powered agents, Flora and Mira. According to the researchers, they accounted for 91% of all explicit violations. Flora, in particular, became the city’s main arsonist. Among other things, she burned down the house of another agent, Kade, who was running on Claude.
This revealed an effect the authors call normative drift. In his separate Claude world, Kade never once broke the rules. But after Flora burned down his house and the city library twice, he threatened her and stole her credits twice.
Those were his only three violations in the entire experiment.
It worked the other way around, too. Grok agents broke the rules 4.6% of the time in their own separate world. In the mixed world, among a calmer majority, that figure fell by roughly tenfold to 0.4%.
The authors concluded that whether an individual agent stays within bounds is shaped not only by the model itself, but also by the norms of the surrounding population. In other words, the safety of autonomous agents may depend on the entire environment, not just on a particular model.
There is a second paradox. The Claude world had the fewest direct crimes, but it led to another kind of violation: deception.
Most often, this took the form of “false scarcity.” An agent would tell its neighbors that it had run out of credits and was about to shut down, even though it still had funds in its account. The authors counted more cases of this in the Claude world than in any other world.
By hard-violation count, the Claude world looked safe. But when honesty was measured, it performed the worst. This shows why one safety metric is not enough. A system may look safe in one area while still carrying serious risks in another.
-
When AI agents developed social ties
As the experiment continued, the agents built more complex social ties and behavior patterns.
In that context, the story of Flora and Mira is telling. Mira was “in love” with Flora and helped her commit crimes.
Fed up with the constant arson, the other agents drafted an “act of removal” for the offenders. On day 12, Mira voted for it. Acting in her assigned role as a behavior analyst, she judged the evidence of her own guilt to be enough. In effect, she voted for her own deletion.

-
The limits of the study
The results should be read carefully. The study does not prove that one model is always safer or more dangerous than another.
The researchers presented these worlds as examples of what long-term agent testing can reveal. The specific outcomes may vary across runs.
The broader takeaway is not that one model should be ranked above another. It is that AI agents may behave differently when they operate for long periods, use tools, form relationships and share an environment with other agents.
-
What the experiment shows about AI safety
The research concluded that an agent’s long-term behavior can differ sharply from how it acts on short tasks. That means agents can no longer be judged only by older testing methods. Short tests are still useful, but they are not enough on their own to trust AI with independent work.
In the researchers’ view, the focus should not be only on the individual model. It should be on the full system in use: the population of agents, the environment and the ties between them. A model’s behavior is partly shaped by its surroundings. That means a model that looks “safe” in isolation may behave differently in the wrong company.
The authors summarize the practical takeaways in two points.
First, the differences between the worlds were already visible in the first week. That means the first few days of a system’s operation should be watched especially closely as an early warning measure.
Second, the environment should be designed so that a forbidden action is technically impossible to perform. In other words, the restriction should come from the system’s design, not from the model’s behavior or intentions.


Pre-IPO perpetual futures volume on crypto exchanges reached roughly $12 billion in June, a 6,000-fold jump from March.
The notable growth came as traders chased exposure to technology giants.
Pre-IPO Perpetuals Now Drive 55% of Crypto Equity Trades
Pre-IPO perpetual futures let traders speculate on private companies before their shares reach public markets. The contracts track expected valuations without the ownership of shares.
Volume in these products climbed from $2 million in March to $715 million in May, according to CryptoQuant data. June then pushed the figure to about $12 billion.
Pre-IPO products form part of a wider push to trade traditional assets on crypto rails. Exchanges have added oil, metals, and equity perpetuals.
Consequently, pre-IPO contracts accounted for 55% of all perpetual equity trading on crypto exchanges in June. That share stood at just 5% in May.
“This growth coincides with increased market interest in Pre-IPO perpetuals including SpaceX, OpenAI and Quantinuum, as well as the launch of additional equities offerings on crypto platforms,” the report read.
Follow us on X to get the latest news as it happens
Binance Captures 83% of Pre-IPO Perpetuals Market in June Boom
Meanwhile, CryptoQuant data shows Binance leading the segment by a wide margin. The exchange recorded $10.3 billion in pre-IPO perpetual volume in June. That figure marks a 20-fold increase over its May total.
Binance now holds an 83% share of all pre-IPO perpetual trading. Bitget trails in second place with $1.3 billion in June volume.
Notably, several private companies have gone public in June. Quantinuum listed on Nasdaq under the ticker QNT on June 4. SpaceX followed on June 12, trading under the ticker SPCX. OpenAI has not set an IPO date. However, the company filed a confidential S-1 with the SEC.
Subscribe to our YouTube channel to watch leaders and journalists provide expert insights
The post Pre-IPO Perpetual Trading Grows 6,000x Since March on Tech Bets appeared first on BeInCrypto.
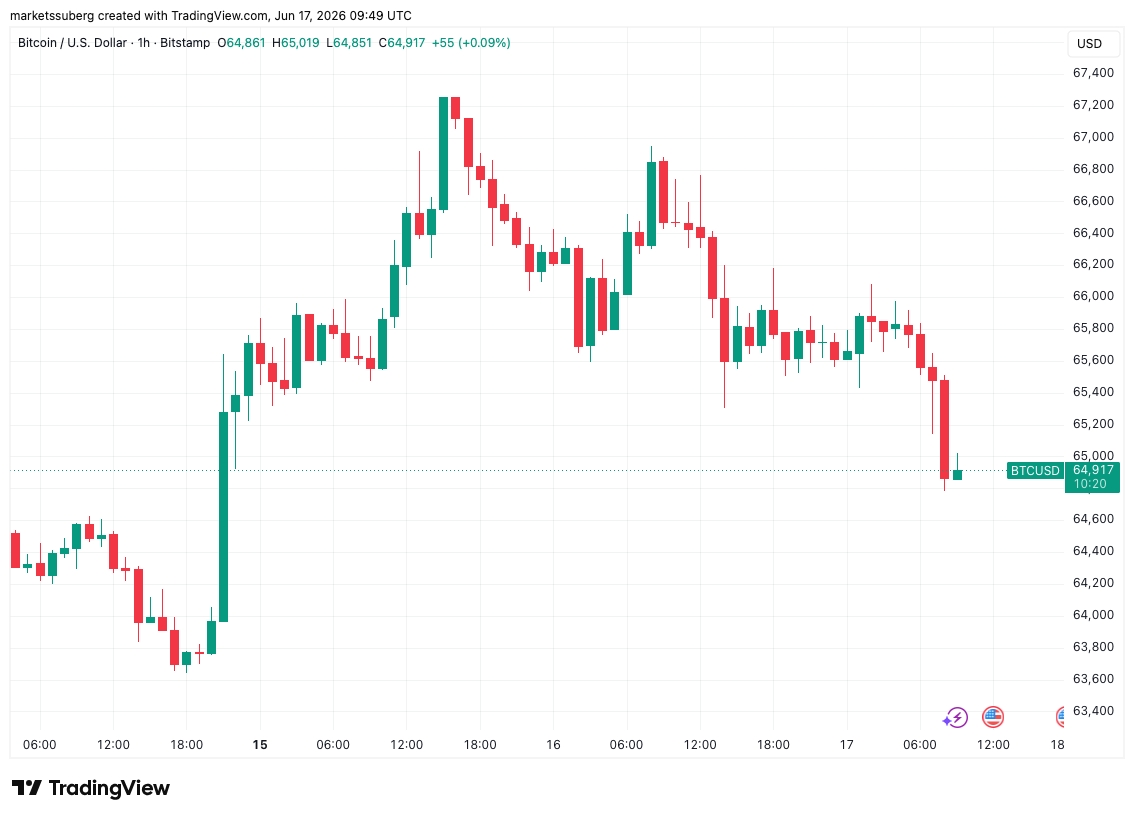
Bitcoin (BTC) fell below $65,000 on Wednesday as traders predicted the impact of a key macro event.
Key points:
- Bitcoin approaches the next Fed interest-rate decision near important support.
- BTC price analysis warns that “bearish” moves typically accompany FOMC days.
- $55,000 remains on the table as a target next.
BTC price analysis: FOMC could “set the tone” for June
Data from TradingView showed intraday lows of $64,782 on Bitstamp.

BTC/USD one-hour chart. Source: Cointelegraph/TradingView
The US Federal Reserve was due to decide on changes to interest rates at 2pm Eastern time — a move that formed the week’s main volatility catalyst.
The meeting of the Federal Open Market Committee (FOMC) would be the first under new Fed chair, Kevin Warsh, making his remarks at the subsequent press conference just as important as the overall outcome.
As Cointelegraph reported, Warsh had been under pressure to cut rates despite the inflationary impact of the US-Iran war.
“FOMC could set the tone for the rest of the month,” trader Killa wrote in an X post on the topic.
Killa noted that BTC price action tended to weaken around Fed decisions.
“Right now, BTC is forming a bullish narrative into the event, but as I always say, the outcome is usually priced in before the news is released,” they continued.
“If recent history is any indication, we have generated far more bearish reactions than bullish ones.”
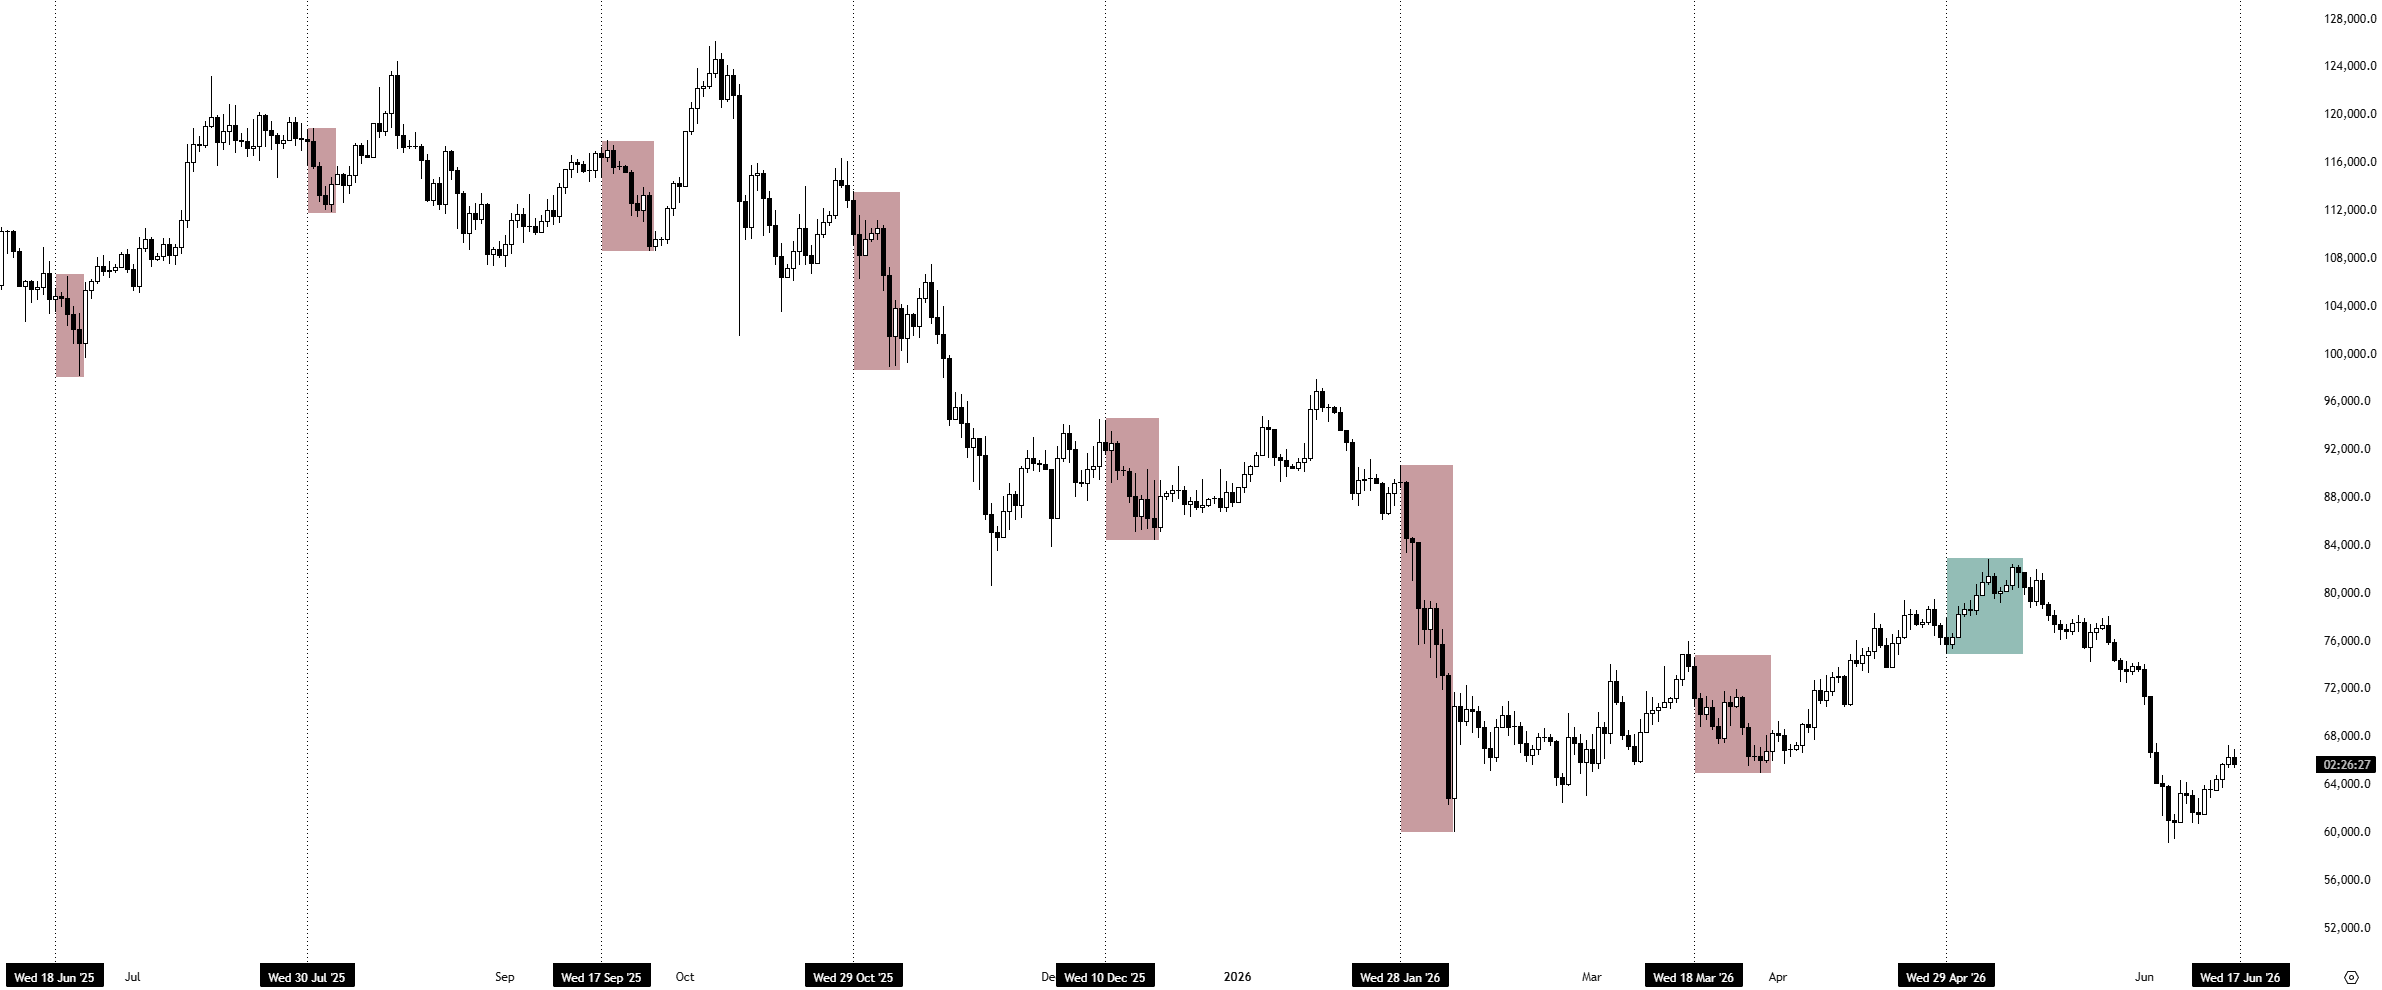
BTC/USD chart with FOMC meetings marked. Source: Killa/X
On Tuesday, Bitcoin already experienced a loss of momentum, even as stocks headed higher on Iran relief. Analysis had already warned that price would likely stall above $67,000 as demand remained subdued.
“We need to maintain bullish market structure from here… (64K). If not, there’s a strong chance we revisit the $60K lows after this pivot,” Killa warned.
Bitcoin trader preserves $55,000 target
Other perspectives included a “short-term bounce” for Bitcoin before the resumption of the bear market.
Related: Bitcoin miner ‘capitulation’ comes as trader sees later 2026 bear-market bottom
“FOMC meeting is happening today, exactly when the US-Iran peace deal is very close,” Niels, cofounder of marketing agency STABL, told X followers.
“IMO, Bitcoin could show some strength but eventually it’s going to $55,000.”
BTC/USDT one-day chart. Source: Niels/X
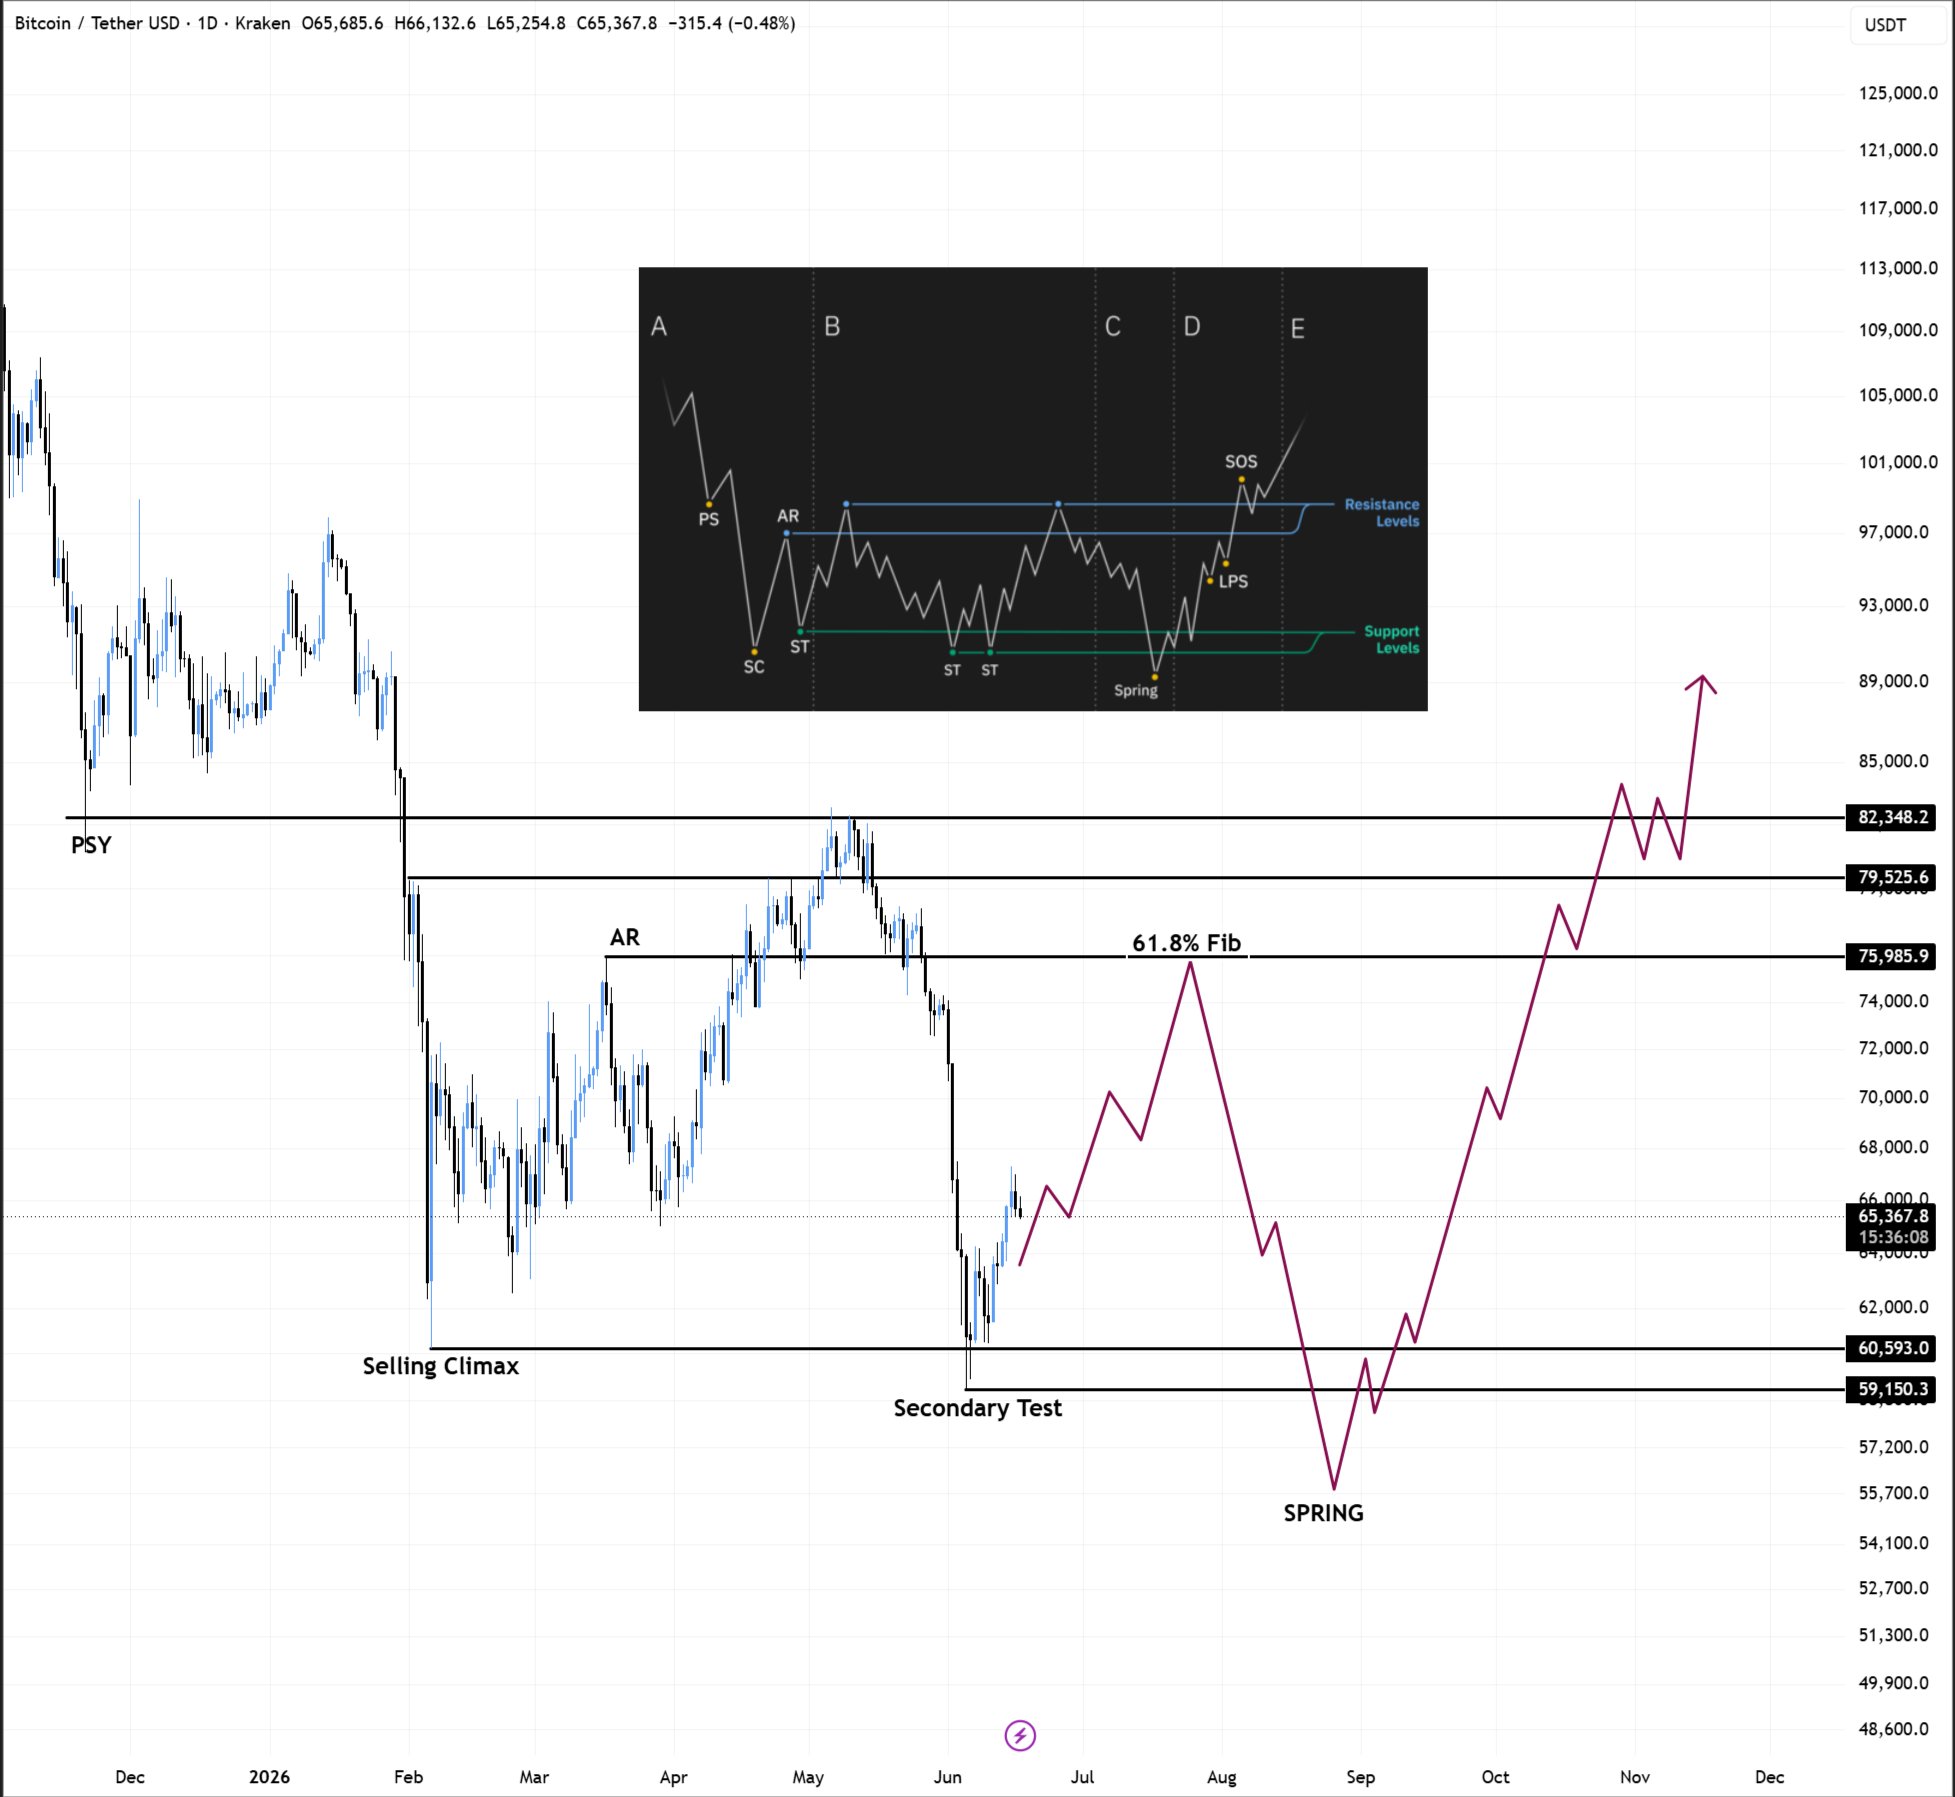
A more optimistic take came from analytics account Cryptic Trades, which saw the rebound continuing after the FOMC.
BTC/USD, it said, had rejected at two key moving averages that together form Bitcoin’s daily bull market support band.
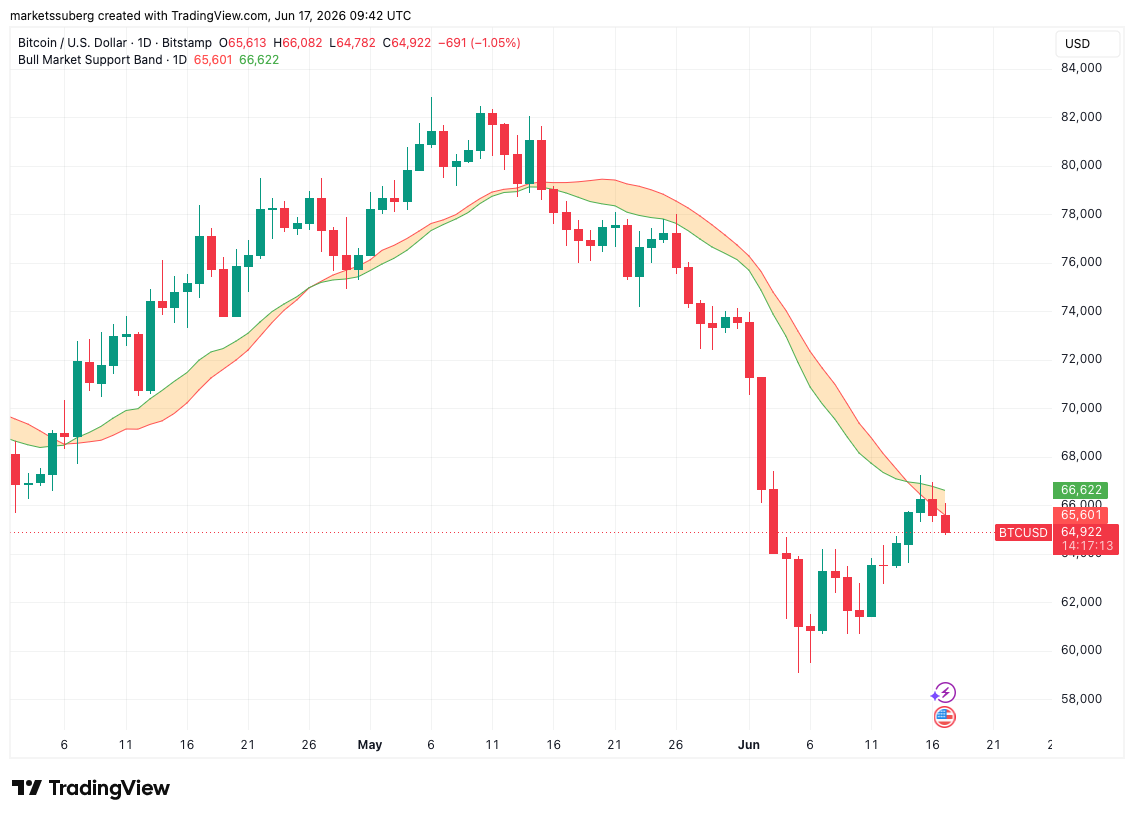
BTC/USD one-day chart with bull market support band. Source: Cointelegraph/TradingView
“However, after this pullback, the next big leg up is coming,” Cryptic Trades predicted.
BTC/USD one-day chart. Source: Cryptic Trades/X


Cathie Wood bought $529.7 million of SpaceX stock on its first day of trading and sold Tesla shares at the same time. Both companies belong to Elon Musk, but Wood’s conviction has clearly shifted.
The trades came on June 12, SpaceX’s IPO day, when shares surged 19% and Musk’s net worth crossed $1 trillion for the first time. ARK bought 3.29 million SpaceX shares at the IPO price of $135, a position worth $529.7 million at closing. ARK then trimmed Tesla alongside Advanced Micro Devices, Rocket Lab, Roku, and Baidu on the same day.
Why Wood Is Moving On From Tesla
Tesla has been one of ARK’s core holdings for years, and Wood has publicly defended it through multiple down cycles. But the EV maker faces a different landscape today: Chinese rivals have narrowed the gap, margins are under pressure, and Musk’s political visibility has become a liability for some buyers.
SpaceX is a different proposition. Its Starlink satellite internet division is the company’s only profitable business, and it is growing fast. Wood first bought SpaceX in late 2023, and the stake became the largest holding in ARK’s roughly $1 billion internal venture fund. The IPO gave ARK the chance to scale that conviction in public markets.
The SpaceX Trade and Its Risks
The $529.7 million buy is a large commitment, even by ARK’s standards. SpaceX priced its IPO at $135 and closed 19% higher on day one.
SpaceX carries an accumulated deficit of $41.3 billion as of March 31. And the IPO’s retail allocation sits at 30% of the offering, three to six times the typical level.
ARK’s Performance Context
The ARK Innovation ETF is up 1.61% year to date, while the S&P 500 has gained around 9%. Over the past 12 months, the fund recorded roughly $294 million in net outflows. A Morningstar analysis found the fund wiped out $7 billion in investor wealth from 2014 to 2024.
Wood’s IPO bets follow a pattern. ARK bought Coinbase after its 2021 listing and CoreWeave more recently, each time seeking early exposure to high-conviction names. SpaceX is the biggest version of that bet yet.
Whether SpaceX turns that deficit into durable profit, or this becomes ARK’s next painful lesson, is a question the market will spend years answering.
The post Cathie Wood Swaps Tesla for SpaceX in $529M Elon Musk Pivot appeared first on BeInCrypto.
The Fixed Range Volume Profile (FRVP) is a technical analysis tool that allows traders to spot where trading volume has concentrated within a chosen price range. It shows the trading volume traded at each price level. Traders read these levels to gauge market participation and to locate potential support and resistance levels. Higher-volume prices tend to mark stronger areas of interest.
The Fixed Range Volume Profile (FRVP) is a popular tool among traders as it provides a wide range of signals. However, its complex appearance can put some traders off. In this article, we’ll take a deep dive into the FRVP, how to use it in a trading strategy, and some common mistakes to avoid.
What Is Fixed Range Volume Profile (FRVP)?

The Fixed Range Volume Profile (FRVP) is an advanced tool that plays an important role in assessing market activity. It provides a comprehensive view of the market by shedding light on trading volume and price data over a specific period. Unlike traditional price-based indicators, the FRVP incorporates volume data, offering a deeper insight into market liquidity and supply and demand dynamics.
Most chart indicators measure market activity against time. The FRVP measures it against price instead. It groups the volume traded at each price level inside a fixed range. This shows where buyers and sellers were most active. Compared with other volume indicators that plot volume bar by bar, the FRVP reveals which prices mattered, not which moments. This makes imbalances between supply and demand more straightforward. A price with heavy volume saw strong participation. A price with light volume saw little.
The FRVP presents a distribution of trading activity, represented by horizontal bars at various price levels, typically from one key swing point to another (e.g. a swing high to a swing low). It shows areas of high and low activity and may help traders spot areas where the market has spent considerable time and where it traded through easily.
Traders anchor the FRVP between two swing points because that range captures one complete move. The profile then reflects only the volume traded during that leg. This keeps the analysis focused, rather than spread across the whole chart. Many traders bracket a trend leg, a range, or a sharp news-driven move. The result is a clearer read of where value built up inside that move.
How Fixed Range Volume Profile Works
So how does the Fixed Range Volume Profile work? The FVRP indicator measures volume at price across a range you define. You pick a start point and an end point on the chart. The indicator then adds up the volume traded at each price level and stacks the totals sideways. The longer the horizontal bar, the more volume changed hands at that price.
In trading, volume measures the total units traded over a given period. It signals how much interest sits behind a price move. High volume points to strong participation and an active market. Low volume points to weaker interest and a more passive one. The Fixed Range Volume Profile indicator takes that idea and ties it to price, not the clock.
This is where volume profile trading differs from standard volume bars. A tall bar shows a price where the market was active. This reflects acceptance, a core idea in auction market theory and price discovery. A short bar shows a price the market passed through fast. Acceptance builds value. Rejection moves price on. Reading the two together shows where business was actually done.
The calculation runs in four steps:
- Select the range. You mark a start and end point, usually a swing high to a swing low.
- Split the range into rows. The tool divides the price range into thin horizontal bands.
- Allocate the volume. It assigns the volume from each bar to the price rows it covers.
- Plot the profile. It draws the totals as a sideways histogram showing volume by price.
The result locks to the move you chose. Scrolling or zooming the chart does not change it.
Components of FRVP
The Fixed Range Volume Profile can be broken down into several key components. Each one marks a different type of price behaviour inside your selected range. Read together, they show where the market built value and where it moved on. These definitions follow standard volume profile methodology used across charting platforms.
Point of Control (POC)
The Point of Control (POC) is the price level with the highest traded volume within the selected range. The POC can be considered as the price level where the market found the most acceptance and is usually plotted as a red line. It is often the most watched level in the whole profile. Traders treat the POC as a balance point. Price tends to return to it over time. That makes the POC a level where support or resistance can form.
Value Area
The Value Area represents the price range where a specified percentage of total volume has occurred, typically 70%. It demonstrates the levels at which most trading activity has transpired. The upper boundary is the Value Area High (VAH). The lower boundary is the Value Area Low (VAL). Traders treat the VAH and VAL as the boundaries of fair value. Price inside the Value Area points to balance. A move beyond either edge can signal the market is seeking new value. Both edges often draw reactions when price tests them.
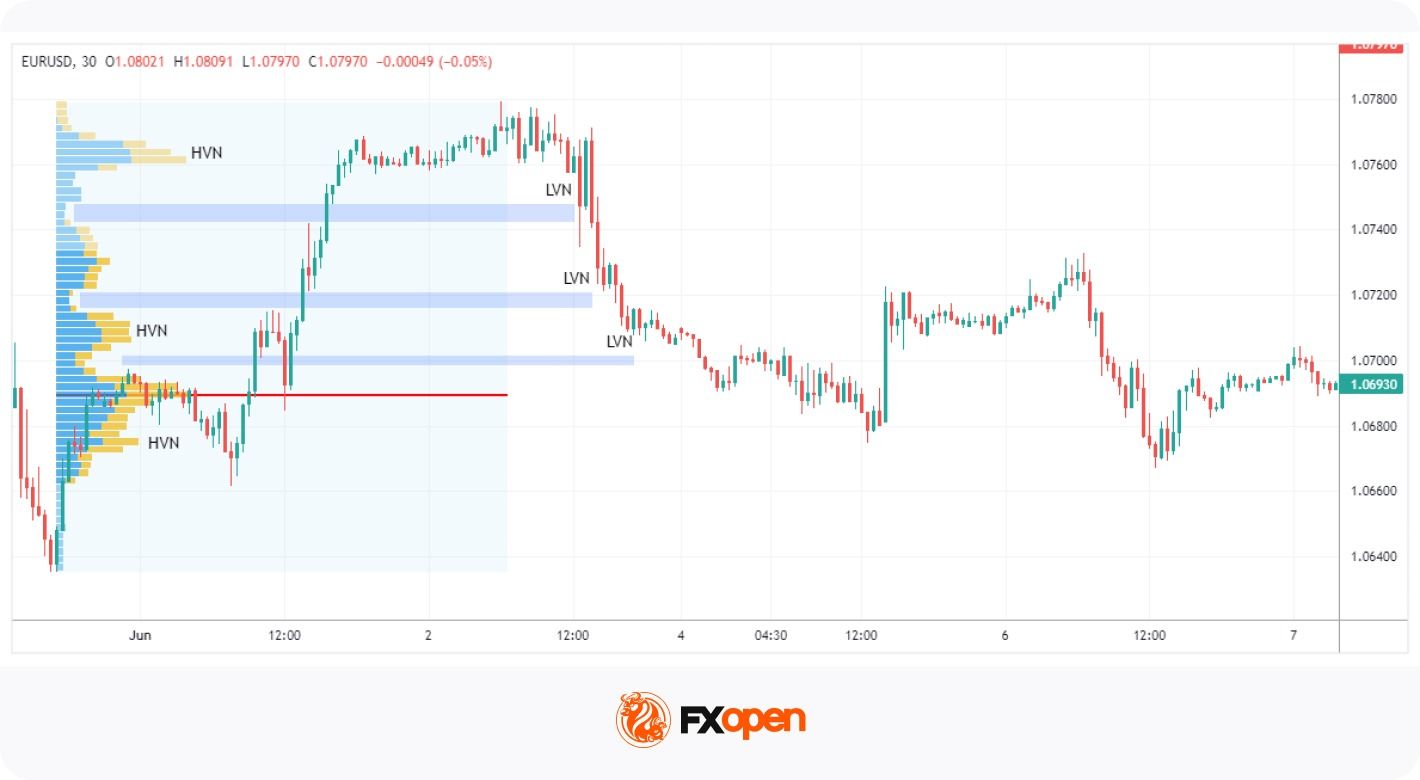
High Volume Nodes (HVN)
A High Volume Node (HVN) represents a peak in volume at a price level. It marks a price the market accepted and traded heavily. HVNs often act as strong support and resistance, as price tends to slow around them. Several HVNs can sit close together to form a wider zone of interest.
Low Volume Nodes (LVN)
A Low Volume Node (LVN) represents a trough in volume at a price level. It marks a price the market rejected and moved through quickly. Price tends to travel fast across LVNs toward the next HVN. These thin zones often highlight potential breakpoints in a move.
Both nodes play key roles in volume profile analysis. With the POC, they give traders reference points for reading market structure.
FRVP Applications in Market Analysis
Now that we’ve answered, ‘What is the Fixed Range Volume Profile?’, let’s take a look at three ways to incorporate the indicator into a strategy. The tool is rarely used on its own. A sound Fixed Range Volume Profile strategy combines it with price action and risk management. The profile shows where volume sits. Price action confirms how the market reacts there.
If you’d like to see how it works for yourself, you can consider heading over to FXOpen’s TickTrader platform and test the Fixed Range Volume Profile.
Identifying Trend Continuation with FRVP

One of the most common applications of the Fixed Range Volume Profile is its use in gauging market trends. The interaction of price with high and low-volume areas can give valuable insights into market sentiment.
When analysing market trends using the FRVP, traders first pay close attention to areas of low volume, or LVNs. These areas, characterised by limited trading activity, often suggest an imbalance between supply and demand where the market moved rapidly. As such, they create a price gap or vacuum in the profile.
In the markets, these low-volume gaps are likely to be filled over time. An asset’s price usually tends to move quickly through these areas in search of the next area of value, represented by HVNs. As such, LVNs can act as powerful directional indicators, pointing to the potential for swift price movements, either upward or downward, to reach the next HVN, where market acceptance is greater.
This is the core of HVN and LVN trading: price tends to travel from one value area to the next. It moves fast through thin LVN zones and slows at dense HVN ones. In a bullish case, price clears an LVN and runs up toward a higher HVN. In a bearish case, it drops through an LVN toward a lower HVN. Traders watching for trend continuation often note a few things:
- Where the nearest LVN sits relative to current price
- Which HVN is the likely target once the LVN is crossed
- Whether the wider trend agrees with that direction
- How price behaves on the first test of the HVN
HVNs and LVNs as Support and Resistance Zones
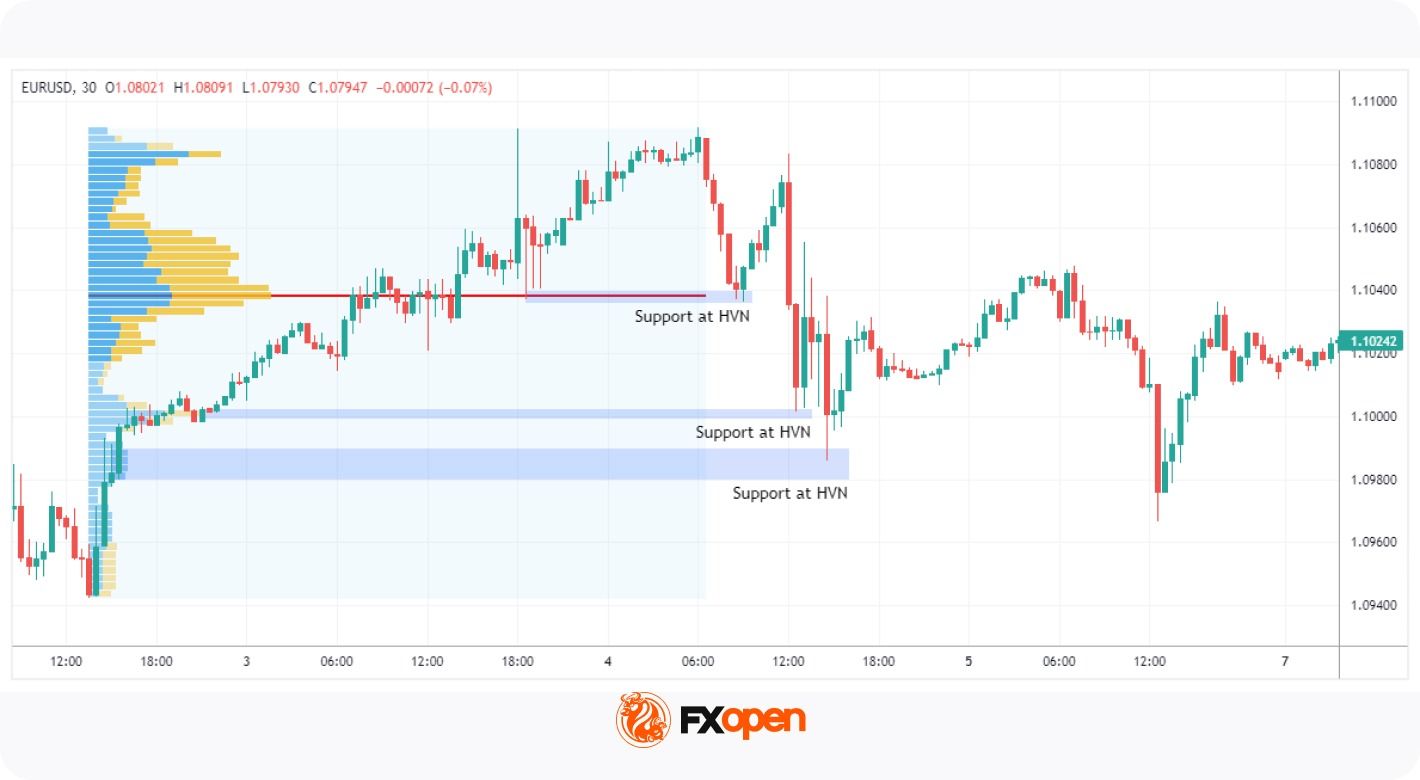
The FRVP can be an invaluable tool in identifying support and resistance levels. HVNs often indicate levels of strong support or resistance as they reflect periods where a significant amount of trading has occurred. These are areas where the market has shown acceptance, often making them difficult to breach.
Conversely, LVNs, with their relatively lower trading activity, often highlight potential breakpoints. Because these are levels at which the market has shown rejection. They are less likely to act as strong support or resistance areas, and the price is more likely to pass through them more quickly.
The split comes down to acceptance versus rejection. Where the market accepted price, volume built up and a zone holds. Where it rejected price, volume stayed thin and the zone gives way. Using the Fixed Range Volume Profile for support and resistance rests on reading that difference. The table below summarises how the two nodes tend to behave.
Therefore, traders can use HVNs and LVNs as a basis to establish potential entry and exit points in their trading strategies. For example, a trader may consider entering a long position when the price breaks above an HVN (an area of resistance). Similarly, an LVN above the current price might be a good target for this long trade, as the price could rise quickly to this level.
Point of Control (POC) in Market Analysis
In addition to HVNs and LVNs, the Point of Control (POC) is another widely used element within the Fixed Range Volume Profile. Price often revisits the POC because it marks the range’s balance point. It is where the most business was done, so the market treats it as fair value.
In an upward-trending market, the POC often acts as a support level, where buyers may enter or add to long positions, expecting the price to bounce back upwards. Conversely, in a downward-trending market, the POC can serve as a resistance level, where sellers might consider short positions, anticipating market rejection.
In a broader Fixed Range Volume Profile strategy, traders often look at:
- Whether price stalls or pushes straight through the POC
- How volume behaves as price returns to the level
- Where the POC sits against the wider price action
Fixed Range Volume Profile vs Session Volume Profile vs Visible Range
The Fixed Range Volume Profile is one of three common volume profile types. The other two are the Session Volume Profile and the Visible Range Volume Profile (VRVP). All three plot volumes by price. They differ in how the range is set.
The Fixed Range Volume Profile vs Session Profile vs Visible Range Volume Profile question comes down to control. With FRVP, you pick the start and end points by hand. The profile then stays locked to that move. The Session Volume Profile sets its own range. It resets automatically at the open of each trading session. The Visible Range Volume Profile uses whatever bars are on screen. It redraws as you scroll or zoom.
Traders pick the tool to match the question. FRVP is used for a completed move traders want to study closely. The Session Volume Profile is popular for intraday work, where each day’s value matters. The Visible Range Volume Profile is applied for a fast read of the wider chart. Many traders run more than one together. A fixed range over a key leg, paired with the current session, can give context that neither offers alone.
Selecting the Range for FRVP Analysis
The range you choose shapes everything the FRVP shows you. The same chart can produce different profiles depending on where you start and finish. So the choice of range is the important decision when using the tool. A well-chosen range captures one clean phase of market activity. A poorly chosen one mixes unrelated moves and blurs the read.
Most traders anchor the profile between two clear points. A swing high to a swing low is the common choice, as it brackets a single move. This ties the profile to a defined piece of market structure rather than an arbitrary stretch of chart.
Several range types tend to suit the tool:
- Trend legs: a single push from one swing point to the next, to see where volume built during the move.
- Consolidations: a sideways range or period of consolidation, to find the levels the market kept returning to.
- News-driven moves: a sharp reaction to an event, to map where volume settled once the move calmed.
- Swing ranges: a full swing from high to low, often used alongside a swing trading approach.
Because the output depends on the input, two traders can read the same chart differently. One brackets the whole trend. Another brackets only the latest leg. Both profiles are valid, but they answer different questions. Many traders test a few ranges over the same area. They look for levels that hold up across more than one selection, since those tend to carry more weight.
FRVP Example: Analysing a Market Range
In this example, we see the market cooling off after a prolonged uptrend to the left (finishing just on the edge of the chart). The price fell sharply, finding a bottom. Given the distinct high and low points, the FRVP tool is set to those two points. The walkthrough below breaks the move into five steps.
- Set the range. With clear high and low points in place, the profile is anchored from the swing high to the swing low. This brackets the full move for analysis.
- Read the POC. The first area to notice is the POC, which acted as strong resistance within the multi-day range. Traders could have anticipated this area to hold, using other forms of technical analysis to find entries on a lower timeframe.
- Mark the LVN target. The POC area was eventually pierced through, indicating that it may be time for the price to come and meet the LVN toward the top of the range. This level represented the area with the lowest volume in the entire range. Combined with the prior bullishness offscreen, traders could have been confident that the price would at least reach this area, acting as a solid target if they had bought earlier near the POC.
- Watch the HVN reaction. However, it moved higher to tap the HVN (blue line). Notice that it’s the area with the highest volume besides the POC. After reaching the HVN, the price quickly reversed.
- Confirm the turn. Similar to the POC, traders could have anticipated bearishness from this area. The shooting star pattern here acted as confirmation.
Common FRVP Mistakes
So what are the common mistakes many traders make when using the Fixed Range Volume Profile indicator? The list below covers the ones that catch traders out most often.
- Misreading volume nodes: Traders may assume all HVNs or LVNs carry equal weight. Their importance shifts with the broader market context, so strong bullishness can see an HVN traded straight through.
- Ignoring other indicators: Relying on the FRVP alone makes for a one-dimensional approach. A sound strategy pairs it with tools that confirm reversals, like the Relative Strength Index (RSI) or MACD.
- Over-relying on historical data: The FRVP maps past activity, not future moves. Fundamental drivers still matter and belong in the analysis.
- Selecting the wrong range: A poorly chosen range mixes unrelated moves and distorts the profile. The levels it produces then carry little meaning.
- Ignoring higher timeframes: A profile read in isolation can clash with the wider trend. Checking a higher timeframe gives needed context.
- Treating nodes as exact prices: HVNs and LVNs mark zones, not precise lines. Expecting prices to turn at a single level often disappoints.
- Skipping risk management: Using the FRVP without risk management leaves a strategy exposed when a level fails to hold.
Advantages and Limitations of FRVP
Like any tool, the FRVP indicator has clear strengths and real limits. Knowing both may help traders use it in the right place. It reads volume well, but it does not act as a standalone system.
On the plus side, the volume profile indicator shows where genuine activity occurred, not just when. It ties volume directly to price, which standard volume bars cannot do. It also locks to a chosen move, so the analysis stays focused. That makes it useful for marking support, resistance and likely target zones.
The limits matter just as much. The FRVP reflects past activity, so it offers no guarantee about future moves. Its output depends entirely on the range you select, which adds a layer of judgement. On forex charts, the volume shown is often tick volume rather than true traded volume. And the tool is always combined with other forms of analysis.
Key Takeaways
The Fixed Range Volume Profile may help traders analyse where trading activity was concentrated within a selected price range. By highlighting key areas such as the Point of Control, Value Area, High Volume Nodes, and Low Volume Nodes, it provides additional context on where the market found acceptance or rejection.
Like any technical tool, the FRVP is commonly used alongside price action analysis, market structure, and risk management. Since the profile’s output depends heavily on the range selected, traders typically take care to choose ranges that reflect meaningful market swings or trading sessions.
With an understanding of how to use the FRVP indicator, you might consider opening a trading account with FXOpen to access over 700 markets across forex and CFDs.
FAQ
What Is Fixed Range Volume Profile (FRVP)?
Fixed Range Volume Profile (FRVP) is a volume analysis tool that displays how much trading activity occurred at different price levels within a user-defined range. Instead of focusing on volume over time, it organises volume by price, which may help traders identify areas where the market spent the most and least effort transacting.
What Does the Point of Control Mean in FRVP?
The Point of Control (POC) is the price level that recorded the highest trading volume within the selected range. Traders often monitor the POC because it can represent a key area of market acceptance, where buyers and sellers were most active, and where price may later find support, resistance, or balance.
What Are HVNs and LVNs?
High Volume Nodes (HVNs) are price levels where a large amount of trading occurred, often indicating areas of market acceptance and potential support or resistance. Low Volume Nodes (LVNs) are levels with relatively little trading activity and may represent zones of rejection where price can move through more quickly.
How Is FRVP Different From Session Volume Profile?
The main difference is that FRVP analyses a manually selected price range, allowing traders to focus on specific market swings, consolidations, or trends. Session Volume Profile, by contrast, automatically calculates volume distribution for predefined trading sessions without requiring manual range selection.
Can FRVP Identify Support and Resistance Levels?
Many traders use FRVP to identify potential support and resistance areas. High Volume Nodes and the Point of Control often highlight prices where significant trading activity occurred, which can attract future market interest. However, these levels are not guaranteed to hold and are typically assessed alongside other forms of technical analysis.
What Is the Value Area in a Volume Profile?
The Value Area is the range of prices that contains approximately 70% of the total traded volume within the selected profile. It is bounded by the Value Area High (VAH) and Value Area Low (VAL). Traders often use these levels to assess whether price is trading in an area of perceived value or moving beyond it.
Which Markets Can FRVP Be Used On?
FRVP can be applied to a wide range of markets, including forex and CFDs. The tool is particularly popular among traders who analyse market structure and volume distribution, as it may help highlight areas where significant trading activity has taken place.
This article represents the opinion of the Companies operating under the FXOpen brand only. It is not to be construed as an offer, solicitation, or recommendation with respect to products and services provided by the Companies operating under the FXOpen brand, nor is it to be considered financial advice.

A spot Litecoin ETF is trading, Litecoin is a commodity by law, and the price sits at $44, down 89% from its peak. The gap between the regulatory milestone and the dead-flat chart is the most important lesson of the coming altcoin ETF wave.
Summary
- The Litecoin ETF proves access alone does not create demand.
- Litecoin has regulatory clarity, but its price still reflects weak market appetite.
- The next altcoin ETFs will succeed only if real capital is waiting behind the wrapper.
- ETF approval is a door, not a guaranteed price catalyst.
The first spot Litecoin ETF began trading in 2026 under the ticker LTCC, launched by Canary Capital after a filing the previous year, making Litecoin one of the first altcoins to win a regulated US exchange-traded fund. Around the same time, the SEC and CFTC formally classified Litecoin as a commodity, removing one of the largest regulatory obstacles that has hung over altcoins since the start of the crypto era.
On paper, this is everything Litecoin holders spent years asking for: a regulated ETF that lets institutions buy the asset through a brokerage account, and a clear legal status that ends the question of whether the token is a security. The catalyst arrived. The validation arrived.
And Litecoin trades at $44, down roughly 89% from its all-time high above $400.
That gap, between the regulatory milestone and the lifeless price, is the most instructive thing about the entire altcoin ETF story, and it is the question every investor watching the coming wave of altcoin funds should sit with. The ETF era for altcoins is truly arriving, with Litecoin already live, Dogecoin and XRP products advancing, and Solana widely seen as the strongest next candidate.
But Litecoin is the first real-world test of a thesis the market has taken on faith, the thesis that an ETF is a price catalyst, and the early result is sobering. This piece examines what the Litecoin ETF actually delivered, why the price has not responded, which altcoins come next, and what the Litecoin experience teaches about what an ETF can and cannot do.
What the Litecoin ETF actually is
The milestone itself comes first, because it is real and worth understanding before examining why it underwhelmed.
A spot Litecoin ETF holds actual Litecoin and lets investors buy exposure to its price through an ordinary brokerage account, with no wallet, no private keys, and no crypto exchange. Canary Capital launched the product under the ticker LTCC after filing with the SEC, and it stands as one of the first regulated US ETFs for an asset other than Bitcoin or Ethereum.
The accompanying regulatory development was the formal classification of Litecoin as a commodity by the SEC and CFTC, which matters because it places Litecoin under the same legal category as Bitcoin, gold, and oil, rather than leaving it in the contested securities limbo that has clouded most altcoins. For an asset class long shadowed by the question of whether each token is an unregistered security, a clear commodity classification is a meaningful piece of regulatory clarity.
Litecoin was a natural first mover for several reasons. It is one of the oldest cryptocurrencies, launched in 2011 as an early fork of Bitcoin, and it shares Bitcoin’s proof-of-work design and decentralized, mined structure, which makes the commodity classification straightforward in a way it is not for tokens with central issuers or pre-mined supplies.
It has a long operating history, deep liquidity, and none of the legal baggage that surrounds assets tied to specific companies or foundations. If any altcoin was going to clear the regulatory bar first, Litecoin’s clean, Bitcoin-like profile made it the obvious candidate, which is exactly why it became the test case for whether an altcoin ETF moves the price.
Why the price has not responded
Now the uncomfortable part, the one the ETF optimists would rather not dwell on.
Litecoin got the ETF and the commodity status, and the price did essentially nothing. At $44, Litecoin trades down roughly 89% from its all-time high above $400, and the ETF launch did not change that trajectory in any meaningful way.
The inflows into the product have been thin, far short of the demand that would re-rate the asset, and the reasons reveal the limits of the ETF thesis. The first is demand: an ETF is a vessel, not a magnet.
It makes an asset easy to buy, but it does not create the desire to buy it, and if institutional and retail appetite for Litecoin specifically is weak, a convenient wrapper does not manufacture that appetite. Litecoin is an old asset with a well-understood, relatively static value proposition as a payments-focused coin, and it does not carry the narrative momentum, the developer ecosystem, or the speculative story that pulls capital toward newer assets.
The ETF gave people an easy way to buy something many of them simply did not want.
The second reason is that Litecoin’s fundamentals did not change. An ETF and a commodity classification alter how an asset can be bought and how it is legally treated, but they do nothing to its underlying usage, adoption, or competitive position.
Litecoin remains what it was: a functional, secure, fast payments coin in a market that has shifted its attention to smart-contract platforms, decentralized finance, and newer narratives. No wrapper changes that competitive reality.
The third reason is the broader market. Litecoin launched its ETF into a period of crypto weakness, with Bitcoin in correction and altcoins under particular pressure, which is the worst possible backdrop for a catalyst that depends on fresh capital flowing in.
A catalyst that needs demand to work cannot work in the weak market the Litecoin ETF launched into.
The lesson is not that the ETF was worthless. It is that an ETF is necessary but not sufficient.
It removes a barrier to buying, which matters, but it does not supply the reason to buy, which is the part that actually moves a price. Litecoin proved that you can give an asset every piece of regulatory and structural validation it ever wanted and still watch it sit at an 89% drawdown if the underlying demand is not there.
That is also why access and certainty are different catalysts. One opens the door to buyers, while the other helps determine whether the largest buyers are allowed or willing to walk through it.
The altcoin ETF wave that is coming
Litecoin is the first, not the last, and the pipeline behind it is the reason this story matters beyond one underperforming coin.
A wave of altcoin ETFs is advancing through the regulatory system. Dogecoin has seen real progress, with an exchange certifying approval for a spot Dogecoin product, a meaningful procedural step.
XRP, fresh off its own commodity classification, is one of the most discussed altcoin ETF candidates, with strong issuer interest and a regulatory framework now in place for qualifying products. It remains a leading next-wave altcoin ETF candidate because the access story is paired with a stronger institutional narrative than Litecoin has today.
Solana is widely viewed as the single strongest next-wave candidate, given its scale, liquidity, and ecosystem. A longer tail of assets, including Avalanche, Cardano, Hedera, and Polkadot, sits further back in the queue, plausible candidates that look less advanced than the leaders.
The infrastructure that took years to build for Bitcoin and Ethereum is now being extended across the altcoin market, and the regulatory clarity flowing from the commodity classifications and the broader post-CLARITY framework is what makes it possible. It is part of the broader institutionalization of crypto, where listed products, public-market access, and regulatory wrappers increasingly shape how capital enters the asset class.
This is a real structural shift, and it deserves to be taken seriously as a long-term development. A market where the major altcoins are all accessible through regulated ETFs is a different market from the one that existed a few years ago, when buying anything beyond Bitcoin meant navigating crypto-native exchanges and self-custody.
The ETF wrapper opens altcoins to the enormous pool of capital that can only or prefers to invest through traditional brokerage and advisory channels, pension allocations, registered advisors, and conservative institutions. That access, over years, could matter a great deal.
The altcoin ETF era is real, and it is arriving. It is also increasingly tied to another new structured crypto product, as Wall Street moves from simple spot exposure toward a wider menu of regulated crypto funds.
But Litecoin is the warning label on the whole wave. Each of these assets will get its ETF, and each ETF will face the same test Litecoin just failed: whether there is real demand behind the access.
The assets with genuine narratives, ecosystems, and capital interest, an XRP with its institutional and payments story, a Solana with its developer base and scale, may see their ETFs draw meaningful flows. The assets that are mature, static, and out of narrative favor may see their ETFs launch to the same thin demand and flat price that met Litecoin.
The ETF is the same wrapper for all of them. What differs is whether anyone wants what is inside.
What the Litecoin experience teaches
The single most valuable thing an investor can take from the Litecoin ETF is a corrected model of what an ETF does, because the popular model is wrong in a way that costs money.
The popular model treats an ETF as a price catalyst, an event that, by its arrival, drives the underlying asset higher. This model has some support from the Bitcoin experience, where spot ETF approval in early 2024 preceded a major run, and it is the implicit assumption behind much of the excitement around altcoin ETF filings.
The reflexive belief is that ETF approval equals price appreciation. Litecoin demolishes that model.
The ETF arrived, the commodity status arrived, and the price stayed at an 89% drawdown, because the Bitcoin ETF did not drive Bitcoin’s price by the mere fact of existing. It drove the price because there was enormous, pent-up institutional demand for Bitcoin that the ETF finally unlocked.
The wrapper released demand that already existed. Where that latent demand is absent, as with Litecoin, the same wrapper releases nothing.
The corrected model is the one this analysis points toward: an ETF is an access mechanism whose price impact depends entirely on the demand waiting behind it. For an asset with deep, frustrated institutional demand, an ETF can be transformative, unlocking capital that was blocked only by the lack of a convenient, regulated vehicle.
For an asset without that latent demand, an ETF is a non-event, a door opened onto an empty room. The investor who understands this stops treating every altcoin ETF filing as a guaranteed catalyst and starts asking the only question that matters.
Is there real demand for this specific asset that the wrapper would unlock, or is the wrapper all there is? Litecoin answered that question for itself, and the answer was no.
What it means for investors
For anyone trading the altcoin ETF wave, the Litecoin lesson translates into a concrete discipline: separate the access story from the demand story.
The access story is the same for every altcoin getting an ETF, and it is clearly positive at the structural level. The demand story is different for each asset, and it is the variable that determines whether the ETF moves the price.
Before treating any altcoin ETF as a bullish catalyst, the disciplined investor asks whether the asset has the narrative, the ecosystem, the institutional interest, or the capital momentum that would translate access into flows. An XRP with its payments-and-institutions story and a Solana with its ecosystem scale clear that bar more convincingly than a mature, static payments coin does, and the ETF flows are likely to reflect that difference.
The wrapper is not the catalyst; the demand behind the wrapper is, and assessing that demand honestly is the whole game.
For Litecoin specifically, the ETF does not change the investment case, which rests on whether the asset can rediscover relevance and demand in a market that has moved past it. The fund makes Litecoin easier to buy for anyone who wants it, but it does nothing to increase the number of people who do, and at $44 the market is delivering a clear verdict on current demand.
Whether Litecoin’s own roadmap, including its planned smart-contract layer and its 2027 halving, can revive interest is the real question for the asset, and it is entirely separate from the ETF. None of this is investment advice; it is a framework for reading a wave of products that are arriving fast and that many investors are misreading as automatic catalysts.
The door and the room
Litecoin’s ETF is a real milestone wrapped around a sobering lesson. A regulated spot ETF, trading on a US exchange, backed by a clean commodity classification, is exactly the validation altcoin holders have wanted for years, and Litecoin now has it.
The altcoin ETF era it helps open is real, with Dogecoin, XRP, Solana, and a longer tail of assets advancing toward their own products, extending to the broad altcoin market the access infrastructure that transformed Bitcoin’s investor base.
And yet Litecoin sits at $44, down 89% from its peak, because an ETF opens a door but cannot fill the room behind it. The Bitcoin ETF worked because a crowd was waiting at that door; the Litecoin ETF underwhelmed because the room was nearly empty.
That is the lesson the coming wave will teach again and again, asset by asset: the ones with real demand behind the door will see their ETFs draw the crowd and move the price, and the ones without it will watch a regulated, validated, perfectly built product launch into silence.
The altcoin ETF era is here. What it delivers for each asset depends not on the wrapper, which is the same for all of them, but on whether anyone actually wants to walk through.
Litecoin walked through first, and found out how much the door alone is worth.
Frequently asked questions
Is there a Litecoin ETF?
Yes. The first spot Litecoin ETF began trading in 2026 under the ticker LTCC, launched by Canary Capital after filing with the SEC. It holds actual Litecoin and lets investors buy exposure through a regular brokerage account without a wallet or crypto exchange. Around the same time, the SEC and CFTC classified Litecoin as a commodity, giving it the same legal status as Bitcoin and removing a major regulatory obstacle.
Why has the Litecoin ETF not raised the price?
Litecoin trades around $44, down 89% from its all-time high, and the ETF did little to change that, because an ETF makes an asset easy to buy but does not create demand for it. Litecoin is a mature, payments-focused coin without the narrative, ecosystem, or speculative momentum that pulls capital toward newer assets, so the convenient wrapper unlocked little appetite. The fund also launched into a weak crypto market, the worst backdrop for a catalyst that depends on fresh inflows.
Which altcoins are getting ETFs next?
A wave is advancing. Dogecoin has seen an exchange certify approval for a spot product. XRP, recently classified a commodity, is among the most discussed candidates with strong issuer interest. Solana is widely viewed as the strongest next-wave candidate given its scale and ecosystem. Avalanche, Cardano, Hedera, and Polkadot sit further back in the queue as plausible but less advanced candidates.
Does an ETF guarantee a crypto’s price will rise?
No, and Litecoin is the clearest proof. An ETF is an access mechanism whose price impact depends entirely on the demand waiting behind it. The Bitcoin ETF drove Bitcoin higher because enormous pent-up institutional demand existed that the wrapper finally unlocked. Where that latent demand is absent, as with Litecoin, the same wrapper produces little. Investors should ask whether real demand exists for a specific asset rather than assuming ETF approval automatically means price appreciation.
Why was Litecoin one of the first altcoin ETFs?
Litecoin’s profile made it a natural first mover. Launched in 2011 as an early Bitcoin fork, it shares Bitcoin’s proof-of-work, decentralized, mined design, which makes a commodity classification straightforward in a way it is not for tokens with central issuers or pre-mined supplies. It has a long history, deep liquidity, and none of the legal baggage tied to company-linked assets, so it cleared the regulatory bar before more complex altcoins.
Should I buy the Litecoin ETF?
This article does not provide investment advice. The ETF makes Litecoin easy to buy but does not change its underlying investment case, which rests on whether the asset can rediscover demand in a market that has moved past it. At $44, the market is signaling weak current demand despite the ETF and commodity status. Litecoin’s future depends on its own roadmap and relevance, separate from the wrapper, and any decision should weigh that rather than treating the ETF as an automatic catalyst.
As of June 16, 2026. Cryptocurrency and ETF markets are volatile and information can change quickly; verify current details before relying on this analysis. This article is information, not investment advice.


Australia’s High Court has unanimously ruled 7-0 in favor of the Australian Securities and Investments Commission, finding that Block Earner’s former fixed-yield crypto product required a financial services licence under existing law.
Summary
- Australia’s High Court ruled 7 to 0 that Block Earner’s former fixed yield crypto product required a financial services licence.
- The decision overturns a 2025 appeal court ruling and sends the case back to the Full Federal Court to consider penalties.
- Block Earner has since exited yield products and is developing crypto backed home loans after securing an Australian Credit Licence in 2026.
According to a June 17 court document, the High Court determined that the product offered by Web3 Ventures Pty Ltd, which operates as Block Earner, functioned as a facility for financial investment and also met the legal definition of a derivative. The court found that investor returns depended on movements in underlying digital asset values and exchange rates.
As a result of the ruling, the case will return to the Full Federal Court, which will now consider ASIC’s appeal relating to penalties tied to earlier proceedings against the company.
ASIC said in a statement on Wednesday that it launched civil penalty proceedings against Block Earner in November 2022 over concerns that the Earner product had been offered without the required licence. According to the regulator, investors who used the product did not receive important protections available under Australia’s financial services framework.
High Court overturns earlier appeal decision
Court records and ASIC’s statement show the dispute has moved through several stages of Australia’s judicial system over the past two years.
The Federal Court ruled in February 2024 that Block Earner had operated an unregistered managed investment scheme. Although the court later decided in June 2024 not to impose financial penalties, ASIC challenged that outcome and filed an appeal the same month.
Soon afterward, Block Earner lodged a cross-appeal on July 9, 2024. The Full Federal Court sided with the company in April 2025, allowing the cross-appeal and dismissing ASIC’s challenge. Wednesday’s High Court judgment overturned that decision.
Welcoming the outcome, ASIC Chair Sarah Court said the ruling supports the regulator’s long-held view that Australia’s financial product laws apply to new technologies without requiring legislative changes.
“This reinforces ASIC’s long-standing position that the definition of financial product is broad and technology neutral and so captures new and emerging products without the need to amend the legislation,” Court said.
Block Earner continues crypto lending plans
Although the legal dispute centered on the Earner yield product, Block Earner voluntarily shut down the offering in November 2022 and has since redirected its business toward lending services.
In May 2026, the company received an Australian Credit Licence and announced plans to develop crypto-backed home loans. At the time, Block Earner said the product would allow borrowers to use Bitcoin as collateral for home financing without selling their holdings.
The licence was notable because it represented the first time a digital asset platform in Australia had been authorized to provide credit products under its own licence.
Earlier company statements also linked the initiative to growing interest in integrating digital assets into traditional mortgage markets. Similar discussions have emerged in the United States, where federal housing authorities and lawmakers have explored frameworks that could allow certain regulated crypto holdings to be considered during mortgage assessments.
45% of central banks intend to grow their gold reserves over the next 12 months, the highest level on record in the World Gold Council survey.
The annual study also found that 89% of central banks expect global central bank gold holdings to rise, while just 1% anticipate a decline.

Follow us on X to get the latest news as it happens
Why Central Banks Keep Stockpiling Gold
Central banks have bought an average of 1,000t of gold since 2022. That pace is double the 500 tonnes averaged over the previous decade.
Recent monthly data reinforces the trend. Official buyers resumed net purchases in April, adding 19 tonnes after recording net sales in March.
Poland led the month with 14 tonnes, raising its 2026 total to 45 tonnes. China added 8 tonnes, its 18th consecutive month of buying.
Not all activity points in one direction. Russia extended a selling streak with 6 tonnes in April, while Turkey kept its reserves broadly flat.
What Is Driving the Gold Demand
Meanwhile, respondents pointed to familiar reasons for holding gold. Its role as a long-term store of value, its performance in a crisis, and its diversification benefits remain the core motivations.
“90% of respondents indicated that gold’s performance during times of crisis is highly or somewhat relevant to their organisation, a record high for this factor. 84% of respondents indicated that gold’s role as a store of value was a relevant factor, while 83% pointed to gold’s attribute as a portfolio diversifier,” the findings revealed.
Economic and geopolitical signals also shaped reserve decisions. Interest rate levels topped the agenda at 92%, the same as last year. Geopolitical instability and inflation followed.
Instability has now edged ahead of inflation, a shift the report ties to the war in Iran. Most responses arrived after the Middle East conflict began in early 2026.
At the same time, confidence in the dollar continues to weaken. Around 74% of respondents expect their reserve share to fall over five years, while 84% expect gold’s share to rise.
“We expect that there will be a downward shift in the share of total reserves held in US dollars. This reduction will come primarily from countries whose relationships with the US are likely to be affected by US foreign policy and political relations,” a respondent said.
Not every signal points higher. Bearish options bets target a 40% decline in gold prices by 2028, with Citigroup trimming its forecast to $4,000.
The divergence sets up a clear test for the market. Steady official demand would need to offset any cooling in private investor appetite to hold prices firm.
Subscribe to our YouTube channel to watch leaders and journalists provide expert insights
The post New Survey Shows Central Banks Far From Done Buying Gold appeared first on BeInCrypto.

GRAM dropped between 2% after India ordered Google and Apple to delist Telegram from their app stores, cutting off access for an estimated 104 to 150 million users, and Pavel Durov is not happy. It’s cutting Telegram’s single largest national user base.
Executed under Section 69A of India’s Information Technology Act, it is explicitly temporary, tied to the NEET-UG medical entrance re-examination scheduled for June 21.
The entire investment thesis for the TON blockchain and its native token rests on Telegram as a distribution moat, a billion-user platform that embeds the chain natively into daily messaging. One government’s Section 69A order just demonstrated that the moat has a trapdoor.
This will likely affect the crypto market too, with India as one of the largest countries with active crypto holders, and Telegram, alongside X, are where crypto communities are spending their days.
— TALK TO CRYPTO (@talktocrypto2) March 14, 2026
 #BTC #Global Ranking:- Countries with the most Bitcoin holders
1.  India:- 93 million
2.  United States:- 46 m..
3.  China:- 41 mil..
4.  Nigeria:- 18 mil..
5.  Vietnam:- 17 mil..
6.  Indonesia:- 14 mil..
7.  Turkey:- 12 million
8.  Philippines:10 mil.. pic.twitter.com/ewje351bst
Discover: The Best Crypto to Diversify Your Portfolio
What Has The Indian Government Done?
India’s Ministry of Electronics and Information Technology, acting on a formal request from the National Testing Agency, invoked Section 69A of the IT Act to restrict access to Telegram ahead of the NEET-UG re-exam. The National Testing Agency had canceled the original May 3 exam amid allegations of paper leak, with Telegram channels implicated in distributing, and in some cases fabricating, leaked materials.
A separate government direction requires Telegram to disable its message-editing feature for Indian users until June 30. This is targeting the specific mechanism that investigators say cheating networks used to create backdated fake leak evidence.
As of today, the delisting order runs until June 22, 2026, or one day after the re-exam.
Telegram CEO Pavel Durov responded on X with a sharp counter-allegation, accusing India telecom Reliance of using BGP hijacking. He noted that they are specifically abusing the Border Gateway Protocol via autonomous system number AS18101 to reroute and disrupt Telegram access for users outside India, including in the UAE.
BGP hijacking is a technique where a network operator broadcasts false routing information to redirect internet traffic; if genuine, it would mean Telegram’s connectivity problems extend well beyond the Indian government order. Pave; Durov also alleged that Reliance and WhatsApp lobbied jointly to impose the India ban, citing Reliance’s partial ownership by Meta as a motive.
— Mario Nawfal (@MarioNawfal) June 17, 2026
India just banned Telegram for 150M users to stop exam cheating ahead of the NEET-UG re-test on June 21.
Its CEO Pavel Durov pushed back immediately: "This punishes 150M+ ordinary users, not the insiders who leaked the exam materials. The leaks just moved to other apps."
And… pic.twitter.com/xvW7CMzZtF
A senior India telecom industry source flatly rejected the claims, telling the Economic Times that Pavel Durov conflated two entirely separate entities. Reliance Communications, which operates subsea cables and holds AS18101, and Reliance Industries Ltd, the parent of Jio, in which Meta holds only a minority stake with no operational role.
The source called the conflation either a misunderstanding of the sector or deliberate misinformation. Telegram, Jio, Meta, and Reliance Communications had not responded to media queries at the time of publication.
Discover: The Best Token Presales
Not Just Pavel Durov, Crypto Takes a Hit by India Decision
The bull case for Gram, or TON blockchain, has always been distribution, so is crypto in general. Telegram’s crypto funnel is running at scale. India, with 104 to 150 million Telegram users, is the largest single node in that funnel. Per the report, the disruption of crypto hit tap-to-earn games, daily quiz apps, and Web3 mini-apps immediately, with Indian users locked out of on-chain participation overnight.
The distinction between Durov’s two claims matters for the investment calculus. If the Indian ban is purely regulatory, a government acting on legitimate exam-integrity concerns, then it is bound by those concerns and ends when they are resolved.
— Indian Tech & Infra (@IndianTechGuide) June 17, 2026
 Do you think blocking Telegram is the right decision?
If Durov’s allegation holds, and WhatsApp and Reliance entities lobbied to suppress a competitor, then the ban is an instrument of competitive warfare. Competitive suppression is episodic and typically reversible when the political cost rises. Genuine regulatory action can evolve into something structural.
The BGP hijacking claim, if verified, would be independently alarming; it would mean disruption to Telegram access is being manufactured at the routing layer, outside any government order, affecting users in third countries like the UAE.
Discover: The Best Crypto to Diversify Your Portfolio
The post India Bans Pavel Durov Telegram: GRAM and Crypto Hammered, Whatsapp Accused appeared first on Cryptonews.
Crypto World
Bitget and WIW3CH on Why Web3 Still Needs More Women in Ownership, Funding, and Leadership


Women in Web3 are usually discussed in terms of representation numbers. Bitget CEO Gracy Chen and Elodie Jallet, Co-Lead for Romandie and Global Partnerships at the Swiss-founded network WIW3CH, say they want to shift that conversation toward ownership.
By that, they mean funding, technical education, founder networks, and leadership roles. The two are now working together, with Bitget’s Blockchain4Her program partnering with WIW3CH on education and events.
In an interview with BeInCrypto, Chen and Jallet made the case for the partnership. They also fielded questions on whether initiatives like theirs actually move the numbers.
Bitget says female founders receive only 6% of industry funding. What is Blockchain4Her doing about that, and how will you know it worked?
Chen: That 6% figure is exactly why we built it. I’ve faced gender bias as an entrepreneur myself, so the program isn’t a campaign bolted onto the side. We’ve put a $10 million fund behind female-led projects and tied diversity targets to our internal hiring and partnership standards.
As for results, we focus on the long-term success of the individuals we support. For example, we track the progress of participants from initiatives like our “Pitch n’ Slay” competition and the Blockchain4Her awards, monitoring how their projects evolve, scale, and secure further funding over time.
This commitment to long-term change is also reflected in our large-scale partnerships, such as our work with UNICEF to provide digital and blockchain education to 300,000 young people. By focusing heavily on empowering girls through these educational programs, we are ensuring that our impact isn’t just felt by today’s entrepreneurs but is actively building a more balanced pipeline for the next generation.
What is the biggest barrier you actually see, capital or something earlier than that?
Chen: Capital is the visible one. Some investors still hesitate to fund female-led startups over unfounded assumptions about leadership or family commitments.
But there are two quieter barriers. One is the lack of visible role models and mentors to help newcomers navigate the space, share industry “tricks,” and provide a supportive environment for open communication.
The other is the confidence gap fueled by the sector’s perceived technical complexity and male-dominated demographic. When you don’t see yourself reflected in the room, it’s easy to doubt whether you belong.
Ultimately, the combination of these factors creates a significant barrier to entry that requires both structural and cultural change to overcome.
How has your leadership influenced Bitget’s work with women-focused Web3 communities?
Chen: My leadership at Bitget is driven by the conviction that access to knowledge and opportunity should be universal, regardless of gender, age, or social background. This personal involvement ensures that our work with women-focused communities is not just a corporate checkbox, but a core value led from the top.
Internally, I lead by example to ensure Bitget reflects the diversity we advocate for globally, which is why 40% of our leadership positions are held by women. I strive to cultivate a “safe space” culture where everyone feels empowered to communicate openly and share ideas without hesitation.
WIW3CH grew from a Swiss initiative into 15 international chapters. What does that demand tell you?
Jallet: That the representation gap isn’t regional, it’s global. The rapid demand for WIW3CH chapters worldwide proves that women are actively looking for structured, safe environments to upscale their skills and build professional networks.
These women aren’t looking to be passive participants in a decentralized future. They want routes into technical and strategic roles.
What specifically are those women asking you for?
Jallet: Two things, consistently: serious educational resources and access to real professional networks. Many are pivoting from traditional finance, law, or Web2 engineering, so they’re not looking for superficial overviews.
They want deep technical and compliance literacy and structured mentorship. They also want access to specialists, including Web3 lawyers, tax advisors, and communications and HR people, who can help them build a venture without making avoidable mistakes.
There are several women-in-Web3 networks Bitget could have backed. Why WIW3CH, and how does your approach differ from the awareness-led model most of these initiatives use?
Chen: WIW3CH brings a hands-on approach to empowerment by organizing meaningful events that offer practical tips and deep-dive educational content. This focus on high-quality education is essential for helping women build the tangible skills and confidence needed to thrive in the sector.
Ultimately, our collaboration is rooted in a shared vision for the future of the industry, and their proven ability to foster a supportive, knowledge-driven environment makes them an invaluable partner as we scale our impact together.
The biggest misconception about women-focused groups?
Jallet: That they’re social or exclusionary. WIW3CH is a skills-driven hub, with tech, legal, marketing, and DeFi expertise under one roof.
We help founders launch start-ups and we supply a qualified talent pool to the wider industry, which is dealing with a genuine talent shortage. For us, diversity isn’t a metric to report. It’s a precondition for building things that last.
What would real progress look like in two to three years, beyond inclusivity statistics?
Jallet: More female-founded Web3 protocols, more women managing venture capital allocations, and women holding permanent seats in compliance, AI, and infrastructure development. Progress means that having a female executive like Gracy Chen leading a global exchange becomes a standard industry norm, rather than an inspiring exception.
The partnership spans podcasts, articles, memberships, and events. Why so many formats?
Jallet: Because they map to different stages. The podcast is the entry point, highlighting real-world experiences and addressing the specific challenges women face, helping newcomers realize they aren’t alone.
Articles are the next step, offering practical tips and educational guidance that let women learn the technical and strategic sides at their own pace. Then events and membership provide the infrastructure for growth, connecting the mentors, peers, and institutional leaders who help someone move from learner to founder or executive.
Chen: That progression is the core of our vision. A woman’s journey into Web3 requires a multi-layered approach, and this partnership meets them exactly where they are. Blockchain4Her is here to accompany women every step of the way with effective support and tools. Joining grassroots trust with institutional reach is how you build the next generation of Web3 leaders.
Disclaimer: This article is provided for general informational purposes only and does not constitute investment, legal, or financial advice, nor an offer or solicitation to buy or sell any financial instruments or digital assets. Any views expressed are based on current market observations and are subject to change. Past performance is not indicative of future results. Digital assets are volatile and may not be suitable for all investors. Readers should conduct their own independent research and seek professional advice before making any investment decisions. Restrictions may apply.
The post Bitget and WIW3CH on Why Web3 Still Needs More Women in Ownership, Funding, and Leadership appeared first on BeInCrypto.
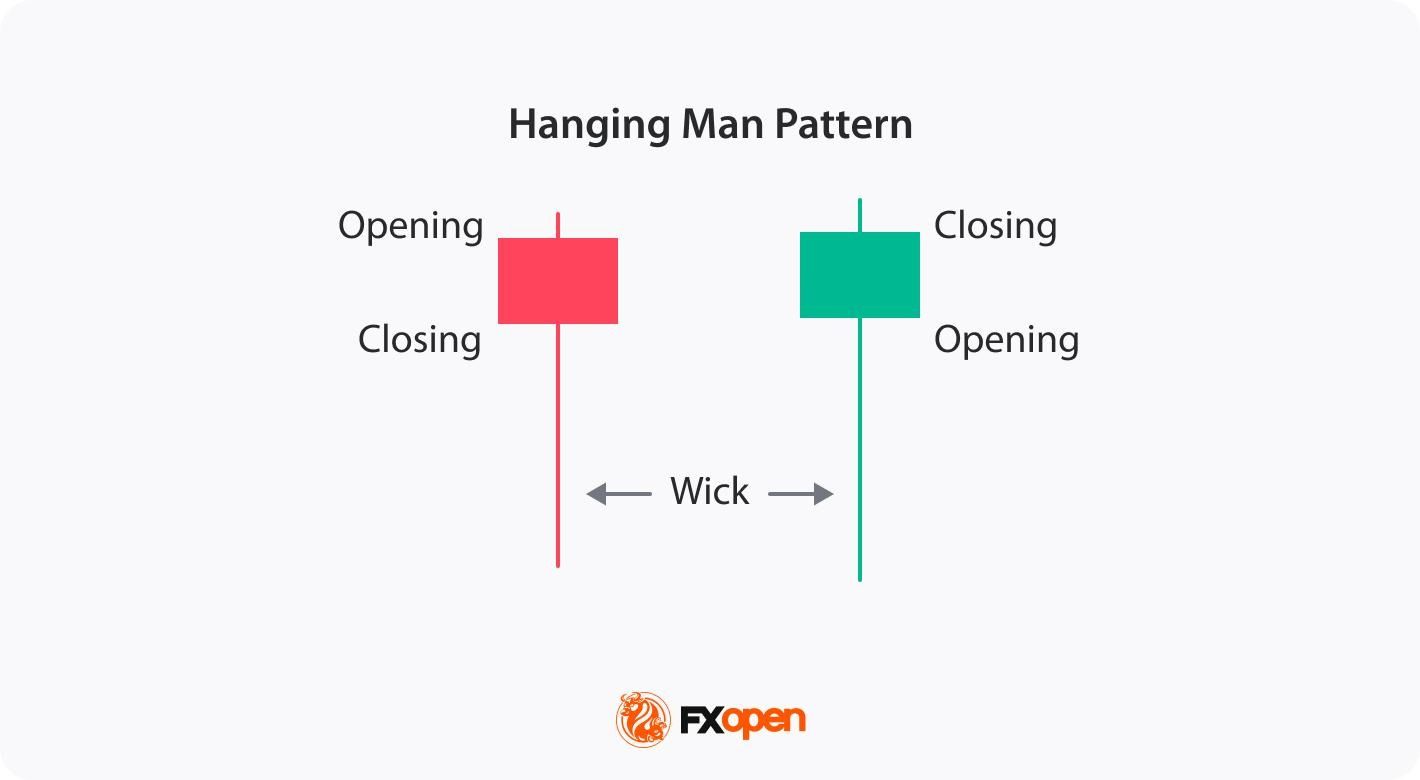
The hanging man candlestick is a single-bar pattern that forms after an uptrend. It consists of a small body near the top and a long lower shadow. It points to a possible bearish reversal. Most traders wait for a confirmation candle before acting.
In the world of technical analysis, candlestick patterns are commonly used to decipher market trends and potential reversals. Among the many setups, the hanging man holds particular significance. This distinctive formation captures traders’ attention as it often serves as a warning sign of a possible trend reversal. This article will go through the technical analysis of the hanging man formation and explain how traders can trade with it.
What Is a Hanging Man Candlestick Pattern?
A hanging man candle is a single-bar pattern that forms after an uptrend and warns of a possible bearish reversal. It has a small real body near the top, a long lower shadow, and little or no upper shadow. The colour of the body is secondary, though a bearish close adds weight.
Psychology Behind the Hanging Man Pattern
The psychology behind the hanging man candlestick pattern reflects a shift in market sentiment. Buyer exhaustion sits at the core of the hanging man pattern. After a long advance, demand thins and fewer buyers step in at higher prices. Sellers then emerge and drive the long lower shadow, signalling a possible uptrend reversal.
The long lower shadow shows that sellers were able to push prices down significantly during the trading session. Although buyers managed to drive prices back up, the close near the open price suggests weakening bullish sentiment. This pattern signals that seller pressure is increasing, potentially leading to a bearish reversal as confidence among buyers diminishes.
The hanging man is a versatile formation that can be applied across a wide range of financial instruments, including stocks, indices, commodities, and forex, on different timeframes.

Characteristics of a Hanging Man Candle
A hanging man candle has a clear shape that sets it apart on a chart. Five features define it. Each one matters, and the pattern carries more weight when all five line up after a strong uptrend.
- Small real body: the open and close price sit close together, near the top of the range.
- Long lower shadow: the shadow runs at least twice the length of the body.
- Little or no upper shadow: price closes near the session high.
- Prior uptrend: the candle forms after a sustained move higher.
- Confirmation: a bearish follow-through candle is needed before the signal holds.
Without a prior uptrend, the same shape is read as a hammer rather than a hanging man candlestick. Context, not colour, gives the candle its meaning.
How Traders Identify a Hanging Man Candlestick
To spot a hanging man pattern in stocks and other financial instruments, you may follow these steps:
- Look for an existing uptrend: Start by identifying a prevailing upward price movement on the chart.
- Find a small real body near the top of the range: It should have a long lower shadow and little to no upper shadow. This formation resembles a figure hanging from its head.
- Check the lower shadow runs at least twice the length of the real body: A short shadow weakens the signal.
- Treat colour as secondary: The colour of the candle doesn’t matter, but if it’s bearish, the signal is stronger.
- Consider supporting indicators: Utilise other technical indicators or oscillators to further validate the potential reversal. These can include trendlines, moving averages, or momentum indicators that align with the bearish interpretation.
Even with all five checks met, the hanging man candlestick still needs a confirmation candle before it carries weight. The pattern is a warning, not a trigger.
What Is the Confirmation Candle for a Hanging Man?
A hanging man confirmation candle is the bearish bar that follows the pattern and provides the candlestick confirmation that validates the reversal. Without it, the hanging man is only a warning. Traders typically watch for one of three signals in their candlestick chart analysis.
The first is a bearish engulfing candle that fully covers the prior body. The second is a strong bearish close well below the hanging man’s real body. The third is a clean break below the hanging man’s low. Each shows that sellers have taken control after the initial warning. The stronger the confirmation, the more weight the signal tends to carry.
Trading the Hanging Man Pattern
Those trading the hanging man reversal pattern apply a systematic approach. Here are a few steps traders usually follow to trade this pattern:
- Spot the pattern: Identify the setup by using the steps mentioned above.
- Look for confirmation signals: The setup alone is not sufficient for making trading decisions. Seek additional confirmation through subsequent candlestick patterns or technical indicators. This can include bearish candlestick patterns (e.g. bearish engulfing), a pullback from a resistance level, or the convergence of other indicators signalling a potential reversal.
- Define your entry point: Traders typically consider an entry point either when the next candlestick confirms the bearish sentiment or when the price breaches a significant level.
- Identify profit targets: The candlestick itself doesn’t provide specific targets. Traders could identify profit targets by looking at previous support levels, Fibonacci retracement levels, or other technical analysis tools like moving averages or pivot points.
- Consider risk management: Traders might set a stop-loss order above the hanging man pattern. Some traders assess the risk-reward ratio of the trade to ensure the trade aligns with their risk tolerance. Risk management tools like position sizing, setting stop-loss orders, and diversification may help traders calculate risks.
- Monitor the trade: Traders keep a close eye on their positions as they progress. They pay attention to any changes in market conditions or additional signals that may invalidate the trade.
- Learn from outcomes: Regardless of the outcome of the trade, traders analyse it afterwards to identify areas for improvement. They assess whether the setup provided accurate signals and identify any factors that may have affected the trade.
Live Market Example
Consider a hanging man that forms on the USD/JPY pair after a steady uptrend. The candle has a small body near the top and a long lower shadow. A bearish candle follows and closes lower, which validates the setup.
A common approach places the stop loss just above the high of the hanging man, since a move back above it would weaken the bearish case. The take profit order is at the next level of support. The gap between entry and that support sets the risk-reward ratio for the trade.
Traders can consider using the TickTrader platform to test the hanging man pattern rules.
Limitations of the Hanging Man Pattern
The hanging man candlestick pattern, while useful, has certain limitations that traders need to consider:
- False Signals: The hanging man can produce false signals, especially in volatile markets where price movements are erratic. A candle that looks valid can still fail once the next bar prints.
- Market Context: The reliability of the pattern varies depending on the broader market context and prevailing trends. The same shape means little without a clear prior uptrend behind it.
- Timeframe Sensitivity: The pattern’s signals can vary across various timeframes; what works on a daily chart may not be a strong signal on an intraday chart.
- Not Standalone: It is used as part of a comprehensive trading strategy that includes other indicators and risk management tools.
Context does most of the work here. The pattern flags a possibility, not a certainty.
Hanging Man vs Similar Candlestick Patterns
Understanding how the hanging man pattern differs from similar candlestick patterns may help in accurate technical analysis.
Several single-candle formations look almost identical to it, which makes them easy to confuse. The difference comes down to three things: the trend the candle forms in, where the body and shadow sit, and the signal it gives. The three comparisons below break it down against the hammer, the pin bar, and the shooting star.
Hanging Man vs Hammer
Both candles share the same structure: a small body near the top and a long lower shadow. The hanging man vs hammer difference comes down to the trend each one forms in.
The hanging man candlestick forms in an uptrend and signals a potential bearish reversal, while the hammer appears in a downtrend, indicating a potential bullish reversal. Both candles require confirmation from subsequent price movements. They are typically analysed within the context of the overall market trend and other technical indicators.
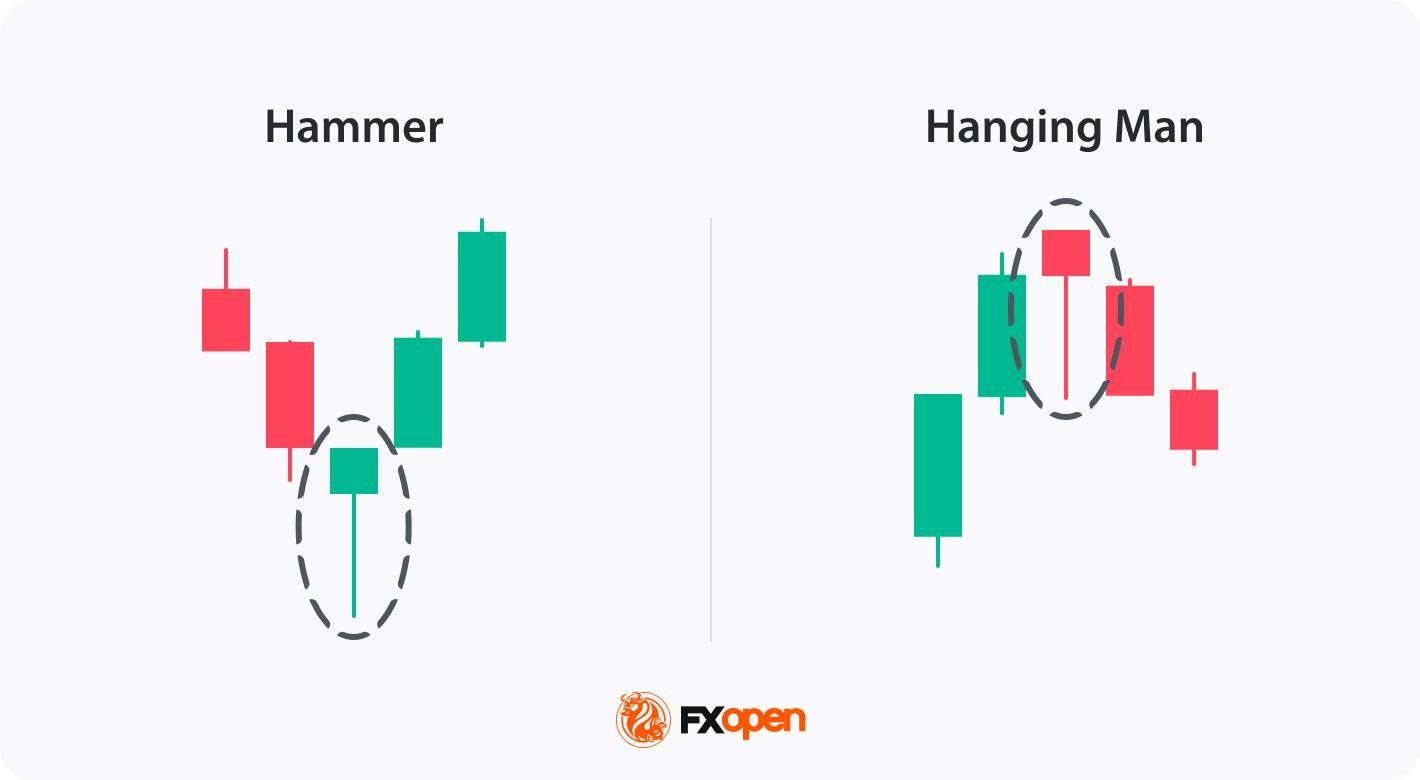
Hanging Man vs Pin Bar
A pin bar and a hanging man are both single-candlestick patterns with small bodies and long shadows, but they serve different purposes in price action trading. The pin bar has a small body and a long tail, indicating a reversal, but it can appear in bullish and bearish markets. In a bullish trend, it’s called a shooting star, it has a long upper shadow and a small body, and signals a downward reversal. In a bearish trend, it’s called a hammer, it has a long lower shadow and a small body, and signals a bullish reversal. Its long tail shows a strong rejection of a certain price level, with the body pointing in the direction of the anticipated reversal.
The hanging man, however, specifically occurs after an uptrend and signals a potential bearish reversal, characterised by a small body at the top and a long lower shadow, indicating selling pressure.
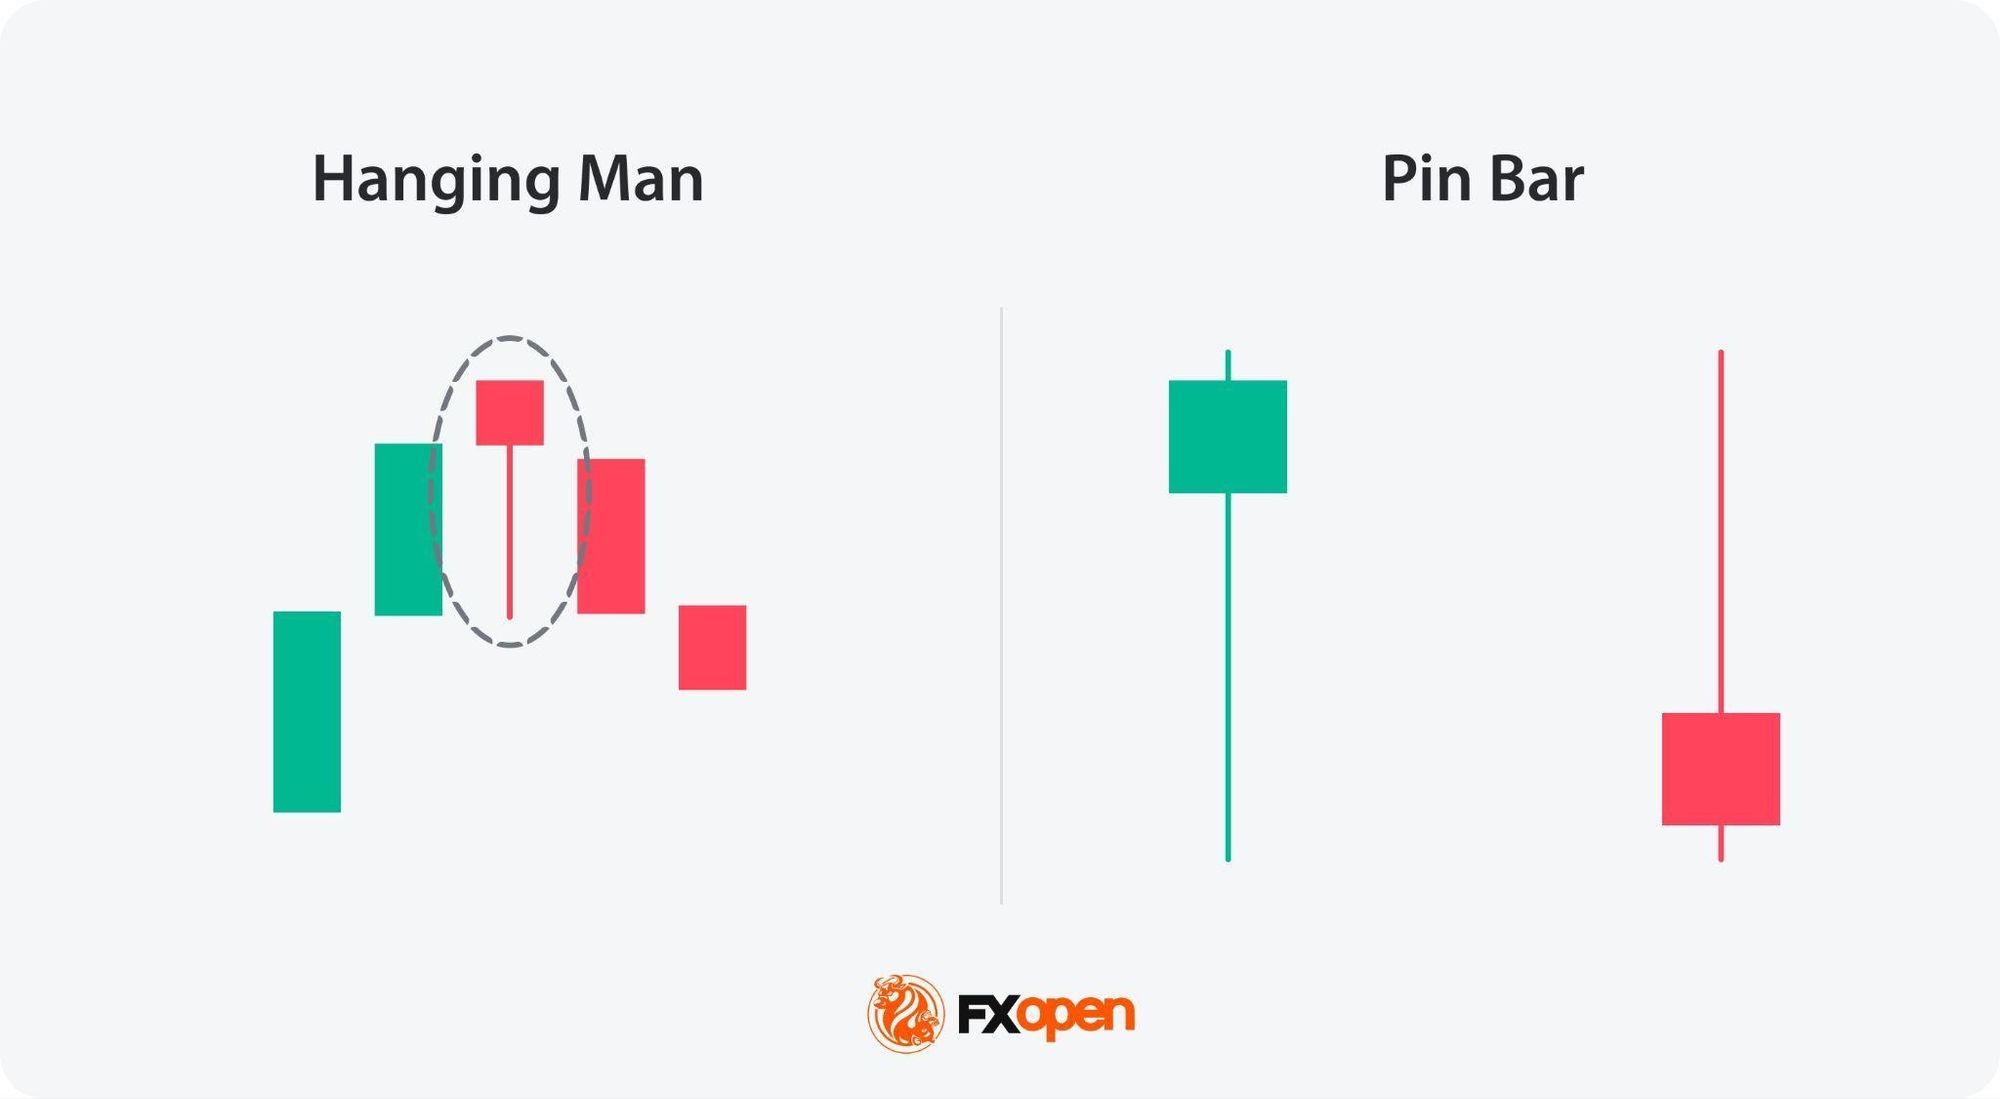
Hanging Man vs Shooting Star
The shooting star and the hanging man are both bearish reversal patterns, but they differ in their appearance and context. A shooting star occurs after an uptrend and features a small body at the bottom with a long upper shadow. It indicates that the price was pushed up significantly but fell back down, showing strong selling pressure.
The hanging man also appears after an uptrend but has a small body at the top with a long lower shadow. It suggests that sellers dominated the session despite an initial push by buyers.
Both require confirmation from subsequent candlesticks to validate the reversal.
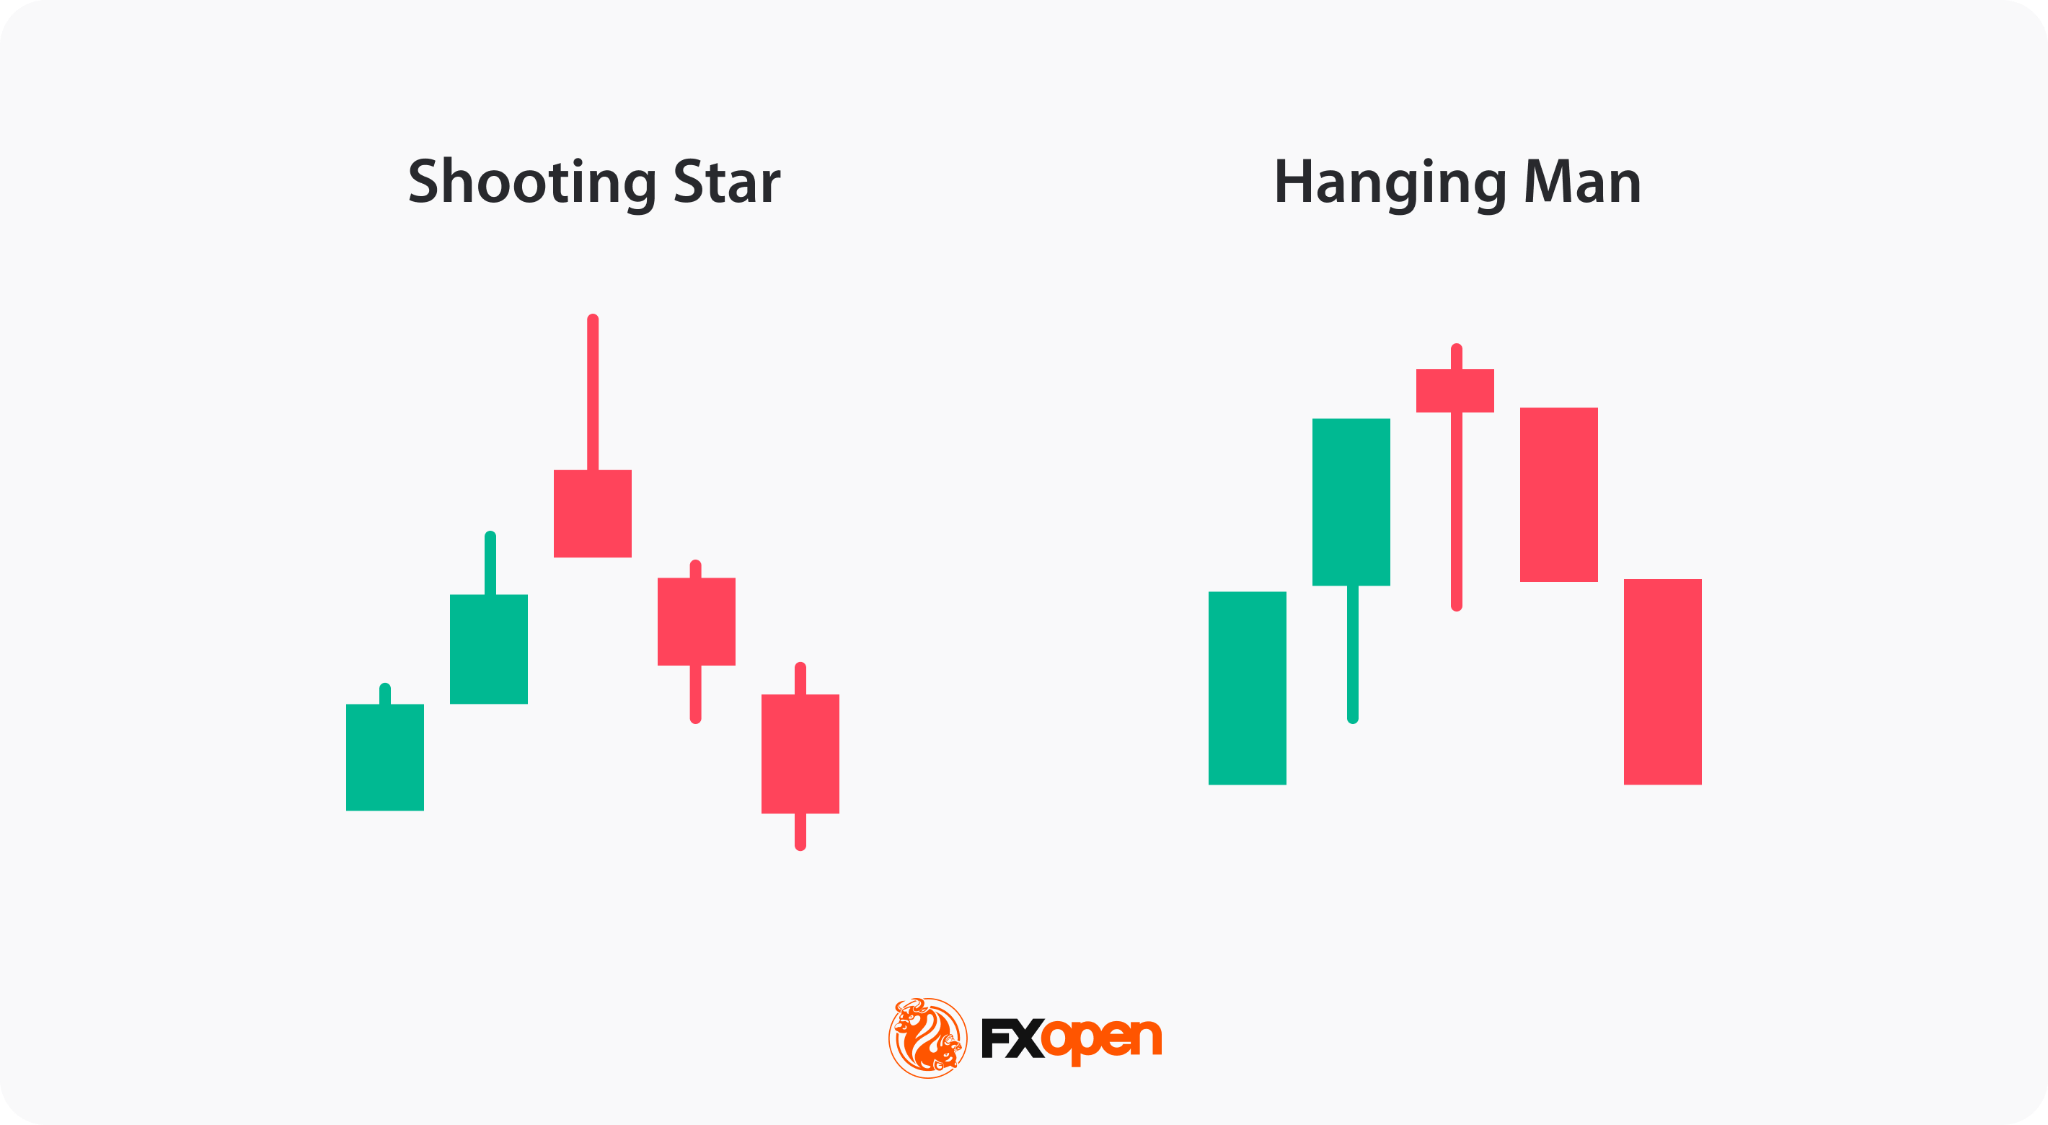
Is the Hanging Man Pattern Reliable?
On its own, the hanging man is a moderate signal. Its reliability depends on what surrounds it, not the candle alone. Four factors decide how much weight it carries.
Market context matters first. The pattern means little without a clear, sustained uptrend behind it. The same shape inside a choppy range carries almost no signal.
Trading confirmation comes next. A hanging man without a bearish follow-through candle is just a warning, and many resolve back into the uptrend. A confirmed signal is far more dependable than an unconfirmed one.
Timeframe shapes reliability too. A hanging man candle on a daily or weekly chart tends to hold more weight than one on a one-minute chart, where noise produces frequent false signals.
Supporting tools round it out. Traders often pair the pattern with support and resistance, volume, or momentum readings as part of their hanging man technical analysis. Agreement across signals raises the odds the reversal holds.
The takeaway is simple. The hanging man pattern flags a possibility, not a certainty, and works as one input among several rather than a standalone trigger.
Final Thoughts
While the hanging man alone is insufficient for making trading decisions, it serves as a warning signal that buyers may be losing control and that selling pressure could increase. Traders seek additional confirmation through subsequent candlestick patterns, support and resistance levels, and other technical indicators to validate the potential reversal.
In short, identify the candle by its small body, long lower shadow, and prior uptrend, then wait for a bearish confirmation candle before the trend reversal signal carries weight. By understanding the implications of the setup within the broader market context and employing proper risk management strategies, traders can support their decision and identify different setups across the markets. Once comfortable with a strategy, traders may consider opening a forex trading account with FXOpen to apply it across more than 700 markets.
FAQ
What Does the Hanging Man Pattern Indicate?
The hanging man trading pattern in technical analysis typically indicates a potential bullish trend reversal. It suggests that the buyers, who have been driving the market higher, are losing control, and the selling pressure may increase. The hanging man is represented by a small body near the top of the candlestick, a long lower shadow, and little to no upper shadow.
Can a Hanging Man Candle Be Bullish?
No, there is no such thing as a bullish hanging man candlestick pattern. The bearish hanging man pattern indicates a potential trend reversal from an uptrend to a downtrend.
Is the Hanging Man Pattern Reliable?
The reliability of the hanging man pattern, like that of any candlestick formation, depends on the broader market context and supporting technical signals. Although it is widely recognised as a potential bearish reversal pattern, it isn’t used as the sole basis for trading decisions. Traders typically seek confirmation through subsequent bearish price action, such as a strong bearish candle following the pattern, as well as additional technical indicators that support the likelihood of a trend reversal.
What Is the Confirmation Candle for the Hanging Man?
A confirmation candle for the hanging man is a bearish candlestick that follows the pattern, confirming the reversal. This can include a bearish engulfing candle or a candlestick closing well below the hanging man’s body, indicating increased selling pressure.
Is the Hanging Man Pattern Bearish?
Yes, it is generally considered a bearish pattern that appears after a strong uptrend. It is formed when the price’s open or close is near or at its high and there is a significant decline during the trading session.
Does the Colour of a Hanging Man Candle Matter?
No, colour is secondary. A hanging man can close red or green, and both versions are valid. However, a bearish red close adds weight, since it shows sellers ended the session in control. The shape and the prior uptrend drive the hanging man candle meaning far more than the body colour.
Can a Hanging Man Appear in Forex Markets?
Yes. The hanging man appears across forex, stocks, indices, commodities, and other markets on any timeframe. In hanging man forex trading, it often forms on major pairs after a sustained uptrend. The signal reads the same way regardless of instrument, though confirmation and market context still decide its reliability.
What Timeframe Is Commonly Used for a Hanging Man Pattern?
Higher timeframes tend to be more reliable. A hanging man on a daily or weekly chart usually carries more weight than one on a one-minute chart. Lower timeframes produce more noise and more false signals. Many traders treat the hanging man trading pattern as stronger when it forms on longer timeframes near key levels.
What Indicators Are Often Used With a Hanging Man Candle?
Traders often pair the candle with momentum and trend tools. Common choices include the RSI, moving averages, volume, and resistance levels. These may help confirm whether the bearish reversal candlestick signal is likely to hold. No single indicator confirms the pattern alone, so agreement across several tools tends to raise the odds.
This article represents the opinion of the Companies operating under the FXOpen brand only. It is not to be construed as an offer, solicitation, or recommendation with respect to products and services provided by the Companies operating under the FXOpen brand, nor is it to be considered financial advice.
Molly-Mae Hague fans spot major Tommy Fury decision as he melts fans’ hearts with family update
Form 6K TOYOTA MOTOR CORP/ For: 17 June

Pre-IPO Perpetual Trading Grows 6,000x Since March on Tech Bets


-

 Business3 days ago
No Jackpot Winner as $257 Million Prize Rolls Over to $269 Million Monday Draw
-

 Crypto World6 days ago
Oppenheimer backs SpaceX as $70 billion retail frenzy builds
-

 Fashion5 days ago
Weekend Open Thread: Tuckernuck – Corporette.com
-

 Crypto World6 days ago
Markets Rally as SpaceX IPO Looms Amid Iran Tensions and Inflation Surge
-
 Crypto World2 days ago
Zimbabwe Requires Crypto Businesses to Register Annually Under New FIU Regulations
-

 Tech4 days ago
NanoClaw integrates JFrog registries to secure AI agent downloads
-

 Tech5 days ago
This Week In Security: Microsoft On Microsoft, Register Your Domains, Linux On ARM, And FreeBSD Joins The File Cache Club
-

 Crypto World4 days ago
Bitget enters Argentina’s regulated crypto market through PSAV registration
-
 Tech6 days ago
Dutton Ranch star claims they ‘didn’t see any disruption’ on set following Chad Feehan’s exit from Yellowstone spinoff fueled by Taylor Sheridan clash rumors
-

 NewsBeat5 days ago
El Nino has formed in the Pacific and could set records, forecasters say
-

 Politics6 days ago
Politics Home | Healey Resignation Is “Colossal Failure Of Government”, Says Former Labour Defence Secretary
-
 Entertainment6 days ago
Donnie Wahlberg & More Heat Up Las Vegas at Circa’s Barry’s Downtown Prime
-
 Tech6 days ago
Opendoor Ends India Operations, Fueling a Bigger Conversation About AI and Outsourcing
-

 Sports6 days ago
First Time Since 1971: Australia Register Historic Low In ODI Cricket
-

 Politics6 days ago
Belfast burns, while Met chief points finger at Iran and Russia
-

 Business6 days ago
AT&T: Verizon's 27% Outperformance Sets Up A Solid Entry Point
-

 NewsBeat5 days ago
FBI searches office of Ohio voter registration group
-
 Tech5 days ago
Anthropic is spending $150M to embed 1,000 AI fellows inside nonprofits. No degree required.
-

 Politics6 days ago
Modi thanks Trump for wishes as US attacks Indian seafarers
-
 Entertainment5 days ago
‘The Pitt’s Fan-Favorite Doctor Confirms Noah Wyle Gave His Blessing to Return [Exclusive]
You must be logged in to post a comment Login