

Crypto World
Pre-IPO Perpetual Trading Grows 6,000x Since March on Tech Bets


Pre-IPO perpetual futures volume on crypto exchanges reached roughly $12 billion in June, a 6,000-fold jump from March.
The notable growth came as traders chased exposure to technology giants.
Pre-IPO Perpetuals Now Drive 55% of Crypto Equity Trades
Pre-IPO perpetual futures let traders speculate on private companies before their shares reach public markets. The contracts track expected valuations without the ownership of shares.
Volume in these products climbed from $2 million in March to $715 million in May, according to CryptoQuant data. June then pushed the figure to about $12 billion.
Pre-IPO products form part of a wider push to trade traditional assets on crypto rails. Exchanges have added oil, metals, and equity perpetuals.
Consequently, pre-IPO contracts accounted for 55% of all perpetual equity trading on crypto exchanges in June. That share stood at just 5% in May.
“This growth coincides with increased market interest in Pre-IPO perpetuals including SpaceX, OpenAI and Quantinuum, as well as the launch of additional equities offerings on crypto platforms,” the report read.
Follow us on X to get the latest news as it happens
Binance Captures 83% of Pre-IPO Perpetuals Market in June Boom
Meanwhile, CryptoQuant data shows Binance leading the segment by a wide margin. The exchange recorded $10.3 billion in pre-IPO perpetual volume in June. That figure marks a 20-fold increase over its May total.
Binance now holds an 83% share of all pre-IPO perpetual trading. Bitget trails in second place with $1.3 billion in June volume.
Notably, several private companies have gone public in June. Quantinuum listed on Nasdaq under the ticker QNT on June 4. SpaceX followed on June 12, trading under the ticker SPCX. OpenAI has not set an IPO date. However, the company filed a confidential S-1 with the SEC.
Subscribe to our YouTube channel to watch leaders and journalists provide expert insights
The post Pre-IPO Perpetual Trading Grows 6,000x Since March on Tech Bets appeared first on BeInCrypto.


The world’s third-largest economy is reclassifying crypto as a financial instrument and charting a path to slash punishing tax rates. The change reaches far beyond Japan, and most of the coverage is getting the details wrong.
Summary
- Japan has taken a major step toward treating crypto like a mainstream financial asset.
- The 20% crypto tax rate is a target for 2028, not a change taking effect now.
- Reclassification under FIEA could open the door to regulated crypto ETFs in Japan.
- The move matters globally because a major economy is shifting from punitive policy toward integration.
On June 11, 2026, the lower house of Japan’s parliament passed a bill that begins one of the most consequential regulatory shifts in the country’s crypto history. The legislation reclassifies cryptocurrency from its current home under the Payment Services Act into the Financial Instruments and Exchange Act, the statute that governs stocks and bonds, and it sits alongside a closely linked tax proposal that would cut the tax on crypto gains from a punishing rate near 55% toward a flat 20%.
For the world’s third-largest economy, long known for some of the harshest crypto tax treatment among major nations, this is a structural turn toward treating digital assets as a legitimate part of the financial system. It also opens a path toward regulated crypto ETFs that Japanese investors have never had.
The change matters well beyond Japan’s borders, which is why it has drawn global attention even as much of the coverage garbles the specifics. A major economy moving from punitive to competitive crypto policy is a signal other governments read, a data point in the global regulatory race, and a potential unlock for one of the largest pools of household savings in the world.
But the details are widely misreported, with headlines compressing a multi-stage, multi-year process into a single accomplished fact. This piece lays out what Japan actually did, what it did not yet do, why the reclassification matters as much as the tax cut, and what the move means for the global crypto landscape.
What Japan actually did, precisely
The single most important thing to get right: this is a process in motion, not a finished law, and the distinction matters for anyone trying to understand the timeline.
On June 11, 2026, Japan’s House of Representatives, the lower house, passed an amendment bill that moves crypto-asset regulation out of the Payment Services Act and into the Financial Instruments and Exchange Act, often abbreviated FIEA, the law governing securities markets. The bill now advances to the upper house, the House of Councillors, for deliberation.
It requires upper house passage, government promulgation, and follow-on rulemaking by the Financial Services Agency before it takes full legal effect, which is expected to happen next year, not immediately. The Cabinet approved the underlying measure back in April, so the June lower-house vote is a major step in a sequence that began earlier and has further to run.
That tax change is a separate but linked matter, and conflating the two is the most common error in the coverage. The headline 20% rate does not live inside the FIEA reclassification bill itself; it sits in a closely associated tax proposal, and the flat 20% rate is targeted for 2028, not arriving with the reclassification.
Today, crypto gains in Japan are taxed as miscellaneous income at progressive rates that climb toward roughly 55% for high earners, among the heaviest crypto tax burdens in the developed world. The policy path would shift that to a flat, separate 20% rate, aligning crypto with how gains on stocks are taxed.
The accurate summary is that Japan’s lower house has approved reclassifying crypto as a financial instrument, with a linked plan to cut the tax rate to 20% by 2028. Several legislative steps remain before either piece is law.
Why the reclassification matters as much as the tax cut
The tax cut gets the headlines, but the reclassification is the deeper change, and understanding why requires looking at what moving crypto into the securities statute actually does.
Placing crypto under the Financial Instruments and Exchange Act subjects it to securities-style market rules: issuer disclosure requirements, a crypto-specific insider-trading regime, anti-market-abuse enforcement, and tougher penalties for misconduct. This is a double-edged change.
On one side, it imposes tighter obligations on the industry, including more disclosure, more compliance, suitability checks on platforms, and possible eligibility screens that could cap certain unaudited issuer offerings for smaller investors. The Japanese crypto industry will carry a heavier regulatory load under FIEA than it did under the lighter-touch Payment Services Act.
On the other side, that heavier regulation is precisely what legitimizes the asset class in the eyes of conservative institutions. Most of all, it creates the legal foundation for regulated investment products.
Most important of all is the path to ETFs. Under the Payment Services Act, crypto sat in a category that did not support the kind of regulated investment vehicles that securities law enables.
By moving crypto into the FIEA, Japan creates the statutory basis on which spot crypto ETFs and other regulated products can be built and offered to Japanese investors, who have never had access to them. That is the ETF access the reclassification enables, and it may matter as much as the tax change itself.
For a nation with one of the largest pools of household savings in the world, much of it sitting in low-yielding cash and bonds, opening a regulated, tax-efficient route into crypto is potentially far more significant than the tax cut alone. The reclassification is the plumbing; the tax cut is the incentive; and together they could channel a meaningful share of Japanese savings toward digital assets in a way the old regime actively discouraged.
That ETF path also matters for specific assets. Japan is already being discussed as a market where XRP products could arrive before 2028, showing how reclassification can move from abstract legal reform into real product pipelines.
The tax cut and what it changes for investors
Moving from a 55% top rate toward a flat 20% is a dramatic shift in the economics of holding crypto in Japan, and it addresses a long-standing complaint that drove activity offshore.
Under the current system, a Japanese investor’s crypto gains are lumped into miscellaneous income and taxed at progressive rates that can reach around 55% for high earners, far above the roughly 20% flat rate applied to gains on stocks. This disparity has been one of the loudest grievances of Japan’s crypto community for years.
It both punished crypto investment relative to equities and pushed serious traders toward offshore venues and structures to escape the burden. A high-earning investor facing a 55% tax on crypto gains but a 20% tax on stock gains had every incentive to either avoid crypto or move their activity outside Japan’s tax net, and many did exactly that.
A flat 20% rate would erase that disparity, taxing crypto gains the same way stock gains are taxed and removing the penalty that has suppressed domestic crypto investment. The effect, should the tax proposal become law on its 2028 target, would be to make holding and trading crypto within Japan dramatically more attractive.
It would lower the absolute tax burden and end the perverse incentive to route activity offshore. Combined with the ETF access the reclassification enables, the tax cut could bring a wave of previously deterred domestic capital and activity back onshore and into regulated products.
The caveat, again, is timing. This is a 2028 target inside a proposal that still must advance, not a change taking effect now, and investors counting on it should track its progress instead of assuming it.
Why this matters globally
Japan’s move is a national policy change with international weight, and the global significance runs along several lines that make it worth attention far outside Japan.
The first is the signal to other governments. Japan is the world’s third-largest economy and a serious, conservative financial jurisdiction, not a small state competing for crypto business through permissiveness.
When a country of that stature moves deliberately from punitive to competitive crypto policy, reclassifying the asset class into its mainstream financial statute and cutting taxes to match equities, it tells other governments that crypto regulation is shifting from suppression toward integration among the major economies. This feeds the global regulatory race, in which jurisdictions increasingly compete to host crypto activity instead of driving it away.
Japan’s entry on the competitive side adds weight to that trend at the highest level. It also sits beside the parallel US regulatory shift, where classification, ETF access, and market-structure rules are reshaping how digital assets enter traditional finance.
The second is the demand unlock. Japan has enormous household savings and a long history of retail investor enthusiasm for new asset classes, and the combination of regulated ETF access and equity-equivalent taxation could mobilize a significant pool of capital that the old regime kept on the sidelines.
A large, wealthy, under-allocated investor base gaining a clean, tax-efficient route into crypto is the kind of structural demand expansion that matters for the asset class globally, not just locally. It also ties into the global institutionalization of crypto, where public-market access and regulated exposure are becoming central to the asset class.
Third is the institutional dimension. The move comes as major Japanese banks, including the country’s largest, prepare stablecoin projects and as regulators build a clearer framework, signaling that Japan’s financial establishment is engaging with digital assets instead of resisting them.
A major economy bringing its banks, its tax code, and its securities law into alignment around crypto is a meaningful validation that resonates well beyond its borders.
The risks and the caveats
A fair account has to weigh what could slow or complicate this, because the optimistic reading depends on several things going right.
The clearest caveat: none of it is final. The reclassification has passed only the lower house and must clear the upper house, promulgation, and FSA rulemaking before taking effect, expected next year.
The tax cut is a separate 2028 target inside a proposal that has its own path to travel. Legislative processes can slow, change, or stall, and the compressed headlines proclaiming that Japan has already cut crypto taxes to 20% are running ahead of the actual state of the law.
Anyone making decisions based on this should track the upper house deliberation and the tax proposal’s progress instead of treating either as accomplished. That is why how regulatory timing shapes markets matters: policy direction and legal reality often move on different clocks.
The heavier regulation is also a real tradeoff, not a pure positive. Moving crypto under securities law brings disclosure burdens, insider-trading rules, suitability checks, and possible investment caps on certain products for smaller investors, which constrain some of the openness that characterized the lighter-touch regime.
The industry gains legitimacy and ETF access but accepts a heavier compliance load, and how the FSA writes the secondary rules will determine whether the balance lands closer to enabling or constraining. There is also the question of whether the demand materializes as hoped.
Japan’s investors may embrace regulated crypto access, or cultural caution and the asset class’s volatility may temper the uptake. The savings-unlock thesis is a reasonable expectation, not a certainty.
The move is significant and directionally positive for crypto, but its full effect depends on execution across multiple stages that have not yet happened.
What it means for the global crypto landscape
For the crypto market broadly, Japan’s shift is a constructive data point in a year defined by regulatory realignment across major jurisdictions.
One pattern stands out: convergence. The United States has been working through its own market-structure legislation and has seen agency-level commodity classifications for major assets.
Japan is reclassifying crypto into its securities framework and charting a tax cut. Other jurisdictions are building stablecoin and ETF frameworks.
The major economies are, in their different ways and on their different timelines, moving crypto from the regulatory margins toward integration into mainstream financial law. Japan’s June vote is a clear instance of that broader direction.
For an asset class whose largest overhang has long been regulatory uncertainty, a steady accumulation of clarity across the major economies is the kind of slow, structural tailwind that matters more over years than any single headline. It also feeds into the broader market this policy feeds into, where regulation, liquidity, and institutional access increasingly decide which crypto narratives matter.
For investors and observers outside Japan, the practical takeaway is to read this as part of a trend, not an isolated event. The key question is whether the demand unlock the policy enables actually arrives, because that is the part that would feed back into global crypto demand.
A Japan that successfully brings a large share of its household savings into regulated crypto products would be a powerful proof of concept for the integration thesis, one other governments and markets would notice. The reclassification and the tax cut set the stage; what plays out on it over the next two years, through the remaining legislative steps and the response of Japanese investors, is the story worth following.
A major economy changes its mind
Japan spent years as a cautionary example of how punitive policy suppresses a domestic crypto market, taxing gains at rates that drove activity offshore and offering no regulated route into the asset class. The June 11 lower-house vote is the clearest sign yet that the country is changing its mind, reclassifying crypto as a financial instrument, charting a path to cut taxes from 55% toward 20%, and opening the door to the regulated ETFs its investors have never had.
This change is real, structurally important, and globally relevant, and it is also a multi-stage process whose biggest pieces, the tax cut targeted for 2028 and the full reclassification expected next year, have not yet taken final effect. Read accurately, Japan has not yet cut its crypto tax to 20%; it has taken a major step toward doing so, alongside a deeper reclassification that may matter even more by opening the ETF door.
For the world’s third-largest economy to move so deliberately from suppression toward integration is a meaningful marker in crypto’s long regulatory normalization, and a signal other governments will read. The details are more complicated than the headlines suggest, but the direction is unmistakable, and the direction is what makes it matter.
Frequently asked questions
Did Japan cut its crypto tax to 20%?
Not yet. On June 11, 2026, Japan’s lower house passed a bill reclassifying crypto as a financial instrument, and a closely linked tax proposal aims to cut the tax on crypto gains from progressive rates near 55% to a flat 20%. But the 20% rate is targeted for 2028 and sits in a separate proposal, and the reclassification still needs upper-house passage and regulatory rulemaking before taking effect, expected next year. Japan has taken a major step toward cutting the tax, not completed it.
What does reclassifying crypto under the FIEA mean?
It moves crypto regulation out of Japan’s Payment Services Act and into the Financial Instruments and Exchange Act, the statute governing stocks and bonds. This subjects crypto to securities-style rules, including issuer disclosure, an insider-trading regime, and tougher enforcement, while also creating the legal foundation for regulated crypto ETFs that Japanese investors have not had access to. The reclassification may be more significant than the tax cut because it enables regulated investment products.
Why is Japan’s crypto tax currently so high?
Under the current system, crypto gains are treated as miscellaneous income and taxed at progressive rates that can reach roughly 55% for high earners, far above the flat 20% rate on stock gains. This disparity has long been a major grievance of Japan’s crypto community, because it penalized crypto investment relative to equities and pushed traders toward offshore venues. The proposed flat 20% rate would align crypto with stock taxation.
When will the changes take effect?
The reclassification, having passed the lower house, needs upper-house passage, government promulgation, and Financial Services Agency rulemaking before taking full effect, expected next year. The flat 20% tax rate is a separate target for 2028. Both pieces still have legislative steps to complete, so the timeline spans the next two years instead of taking effect immediately, and progress should be tracked rather than assumed.
Why does Japan’s crypto policy matter globally?
Japan is the world’s third-largest economy and a serious, conservative financial jurisdiction. When a country of that stature moves from punitive to competitive crypto policy, it signals other governments that crypto regulation is shifting toward integration among major economies, feeding the global regulatory race. Japan also has enormous household savings, so opening regulated, tax-efficient crypto access could unlock a significant pool of capital, a structural demand expansion that matters for crypto worldwide.
Will this bring more money into crypto?
Potentially. The combination of regulated ETF access from the reclassification and equity-equivalent taxation from the tax cut could mobilize a large pool of Japanese household savings that the old regime kept out, and bring offshore activity back onshore. But this depends on the legislation completing its remaining steps and on Japanese investors actually embracing the access, which cultural caution and crypto’s volatility could temper. The demand unlock is a reasonable expectation, not a certainty.
As of June 16, 2026. Legislative and tax processes change over time; verify the current status before relying on this analysis. This article is information, not investment or tax advice.
Crypto World
Heir to 135-year Gulf dynasty is moving a $6 trillion trade market onto blockchain rails


For more than 135 years, the Kanoo family, one of Bahrain’s wealthiest families, has helped build the Gulf’s entire commercial infrastructure.
The family, with a net worth of up to $6 billion, owns businesses spanning shipping, logistics, travel and finance.
Abdulla Kanoo, one of the heirs to this 135-year-old dynasty, is now involved in crypto. While he refuses to reveal his family’s or his personal bitcoin investments, he says he’s invested in digital assets since 2015 and remains “faithful” to bitcoin .
Kanoo also believes the next generation of global commerce will not be built on ports or banks, but on digital rails or, more specifically, on the blockchain, where programmable money is king.
Kanoo is the co-founder of ARP Digital, a digital asset infrastructure project focused on allowing the movement of money between emerging economies faster, cheaper and with fewer intermediaries.
“The Gulf was where global capital was stored,” he told CoinDesk. “The next chapter is about movement.”
Kanoo is not launching another crypto exchange nor is he pitching a new token. He has his goals set on expanding the family legacy on a global scale.
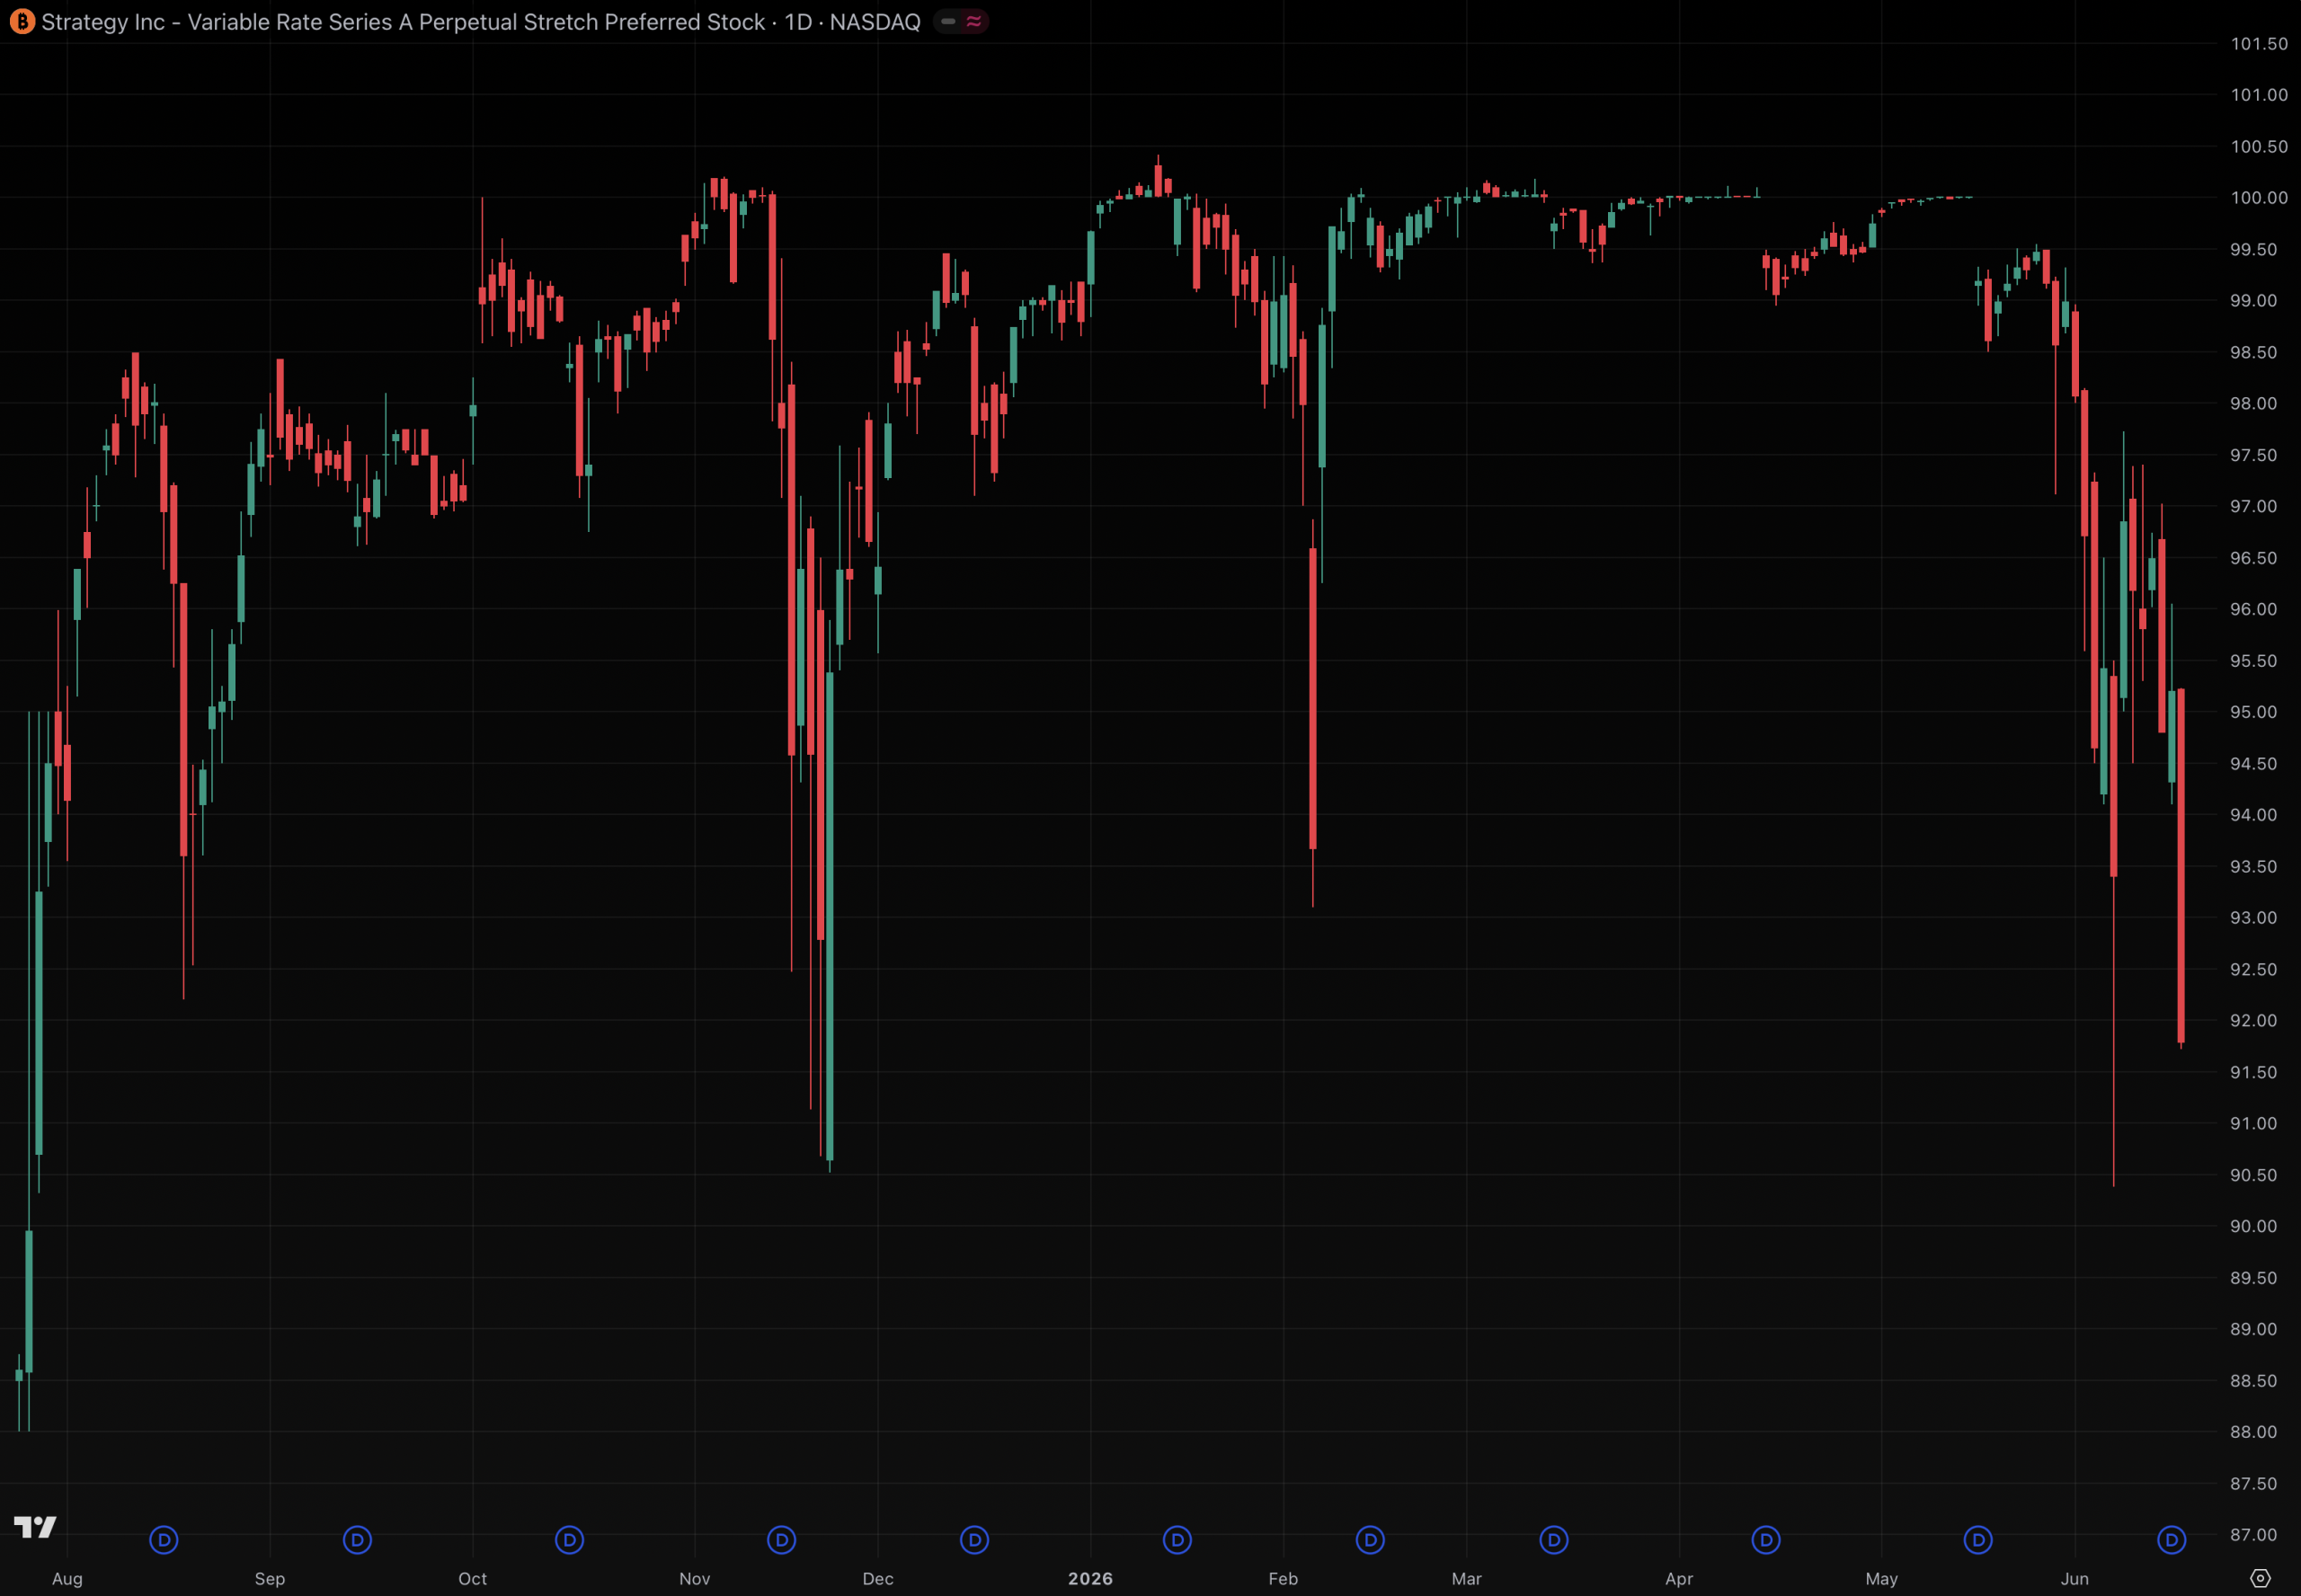
Most people holding Strategy’s 11.5% dividend-paying STRC, are making a strange bargain with the company; that on monthly snapshot days, the stock will trade near the company’s intended $100 share price.
In between those dates, however, STRC invariably wanders downhill. Indeed, it closed yesterday at $91.79, 8.2% below its target.
Strategy persuades buyers to take the bargain of downside possibility on their investment with an above-market yield of 11.5%.
Strategy, the bitcoin (BTC) treasury company built by Michael Saylor, markets STRC as a near-$100 instrument that strips away BTC’s volatility, providing ostensibly predictable payouts and a USD-stable target.
Anyone who holds STRC at the close of Nasdaq’s regular trading session on the dividend record “snapshot” date receives that payout.
Because Strategy pays a dividend on the full $100 par regardless of its price on Nasdaq, the company designed STRC to hold near $100 on its snapshot dates.
The actual chart of Nasdaq trades, unfortunately, says otherwise.
STRC had its IPO in July 2025 and didn’t even trade up to $100 until October. For over a trailing month as of publication time, STRC hasn’t traded at or above $100.
STRC crashes ex-dividend
The morning after its snapshot date, the stock trades “ex-dividend,” and holders earn nothing extra for maintaining their investment until another two weeks transpire and another snapshot occurs.
Predictably, the stock always rallies into these snapshot dates and immediately sells off afterward.
Historical prices bear this out across the security’s short life.
In August 2025, STRC dropped to $92.20 in-between its dividend snapshot dates.
In September, it drifted to $96.61. October was a similar $96.75. Then November frightened investors with a 9.5% drop from $100 to $90.52.
Although each month’s trading range is unique, this month is risking becoming on of its worst. Just yesterday, shares closed at $91.79.
Run-ups into the dividend snapshots are routine, but declines are just as routine.
Read more: Strategy shareholders approve twice-monthly STRC dividends
Semi-monthly dividends haven’t helped yet
Strategy’s talked shareholders into making the problem twice as frequent, albeit shorter in duration.
On June 8, holders approved a shift to semi-monthly dividends, with record dates on the 15th and the last day of each month. Its first semi-monthly dividend will occur next month.
Strategy CEO Phong Le said the change was designed to “stabilize price” for STRC, which definitely hasn’t happened so far.
Over its lifetime, STRC has traded as high as $100.42 and as low as $90.38. That is a band of more than $10 for a $100 stock that’s supposed to hug its par value.
With STRC trading 8.2% below its par as of yesterday’s close, Strategy has two obvious defenses available.
First, it could raise the dividend. STRC pays 11.50% a year now, a yield higher than most junk bonds, but there’s plenty of room to go higher if the company wants to burn cash faster.
Payouts started at 9% when the shares launched, and have climbed steadily to 11.5% today.
Second, Strategy could buyback shares. The company has never done this.
As Protos has documented, the cost of maintaining investor confidence in STRC keeps rising. For a security sold on the idea of stable income, STRC asks for a lot of faith between its semi-monthly record dates.
Got a tip? Send us an email securely via Protos Leaks. For more informed news and investigations, follow us on X, Bluesky, and Google News, or subscribe to our YouTube channel.
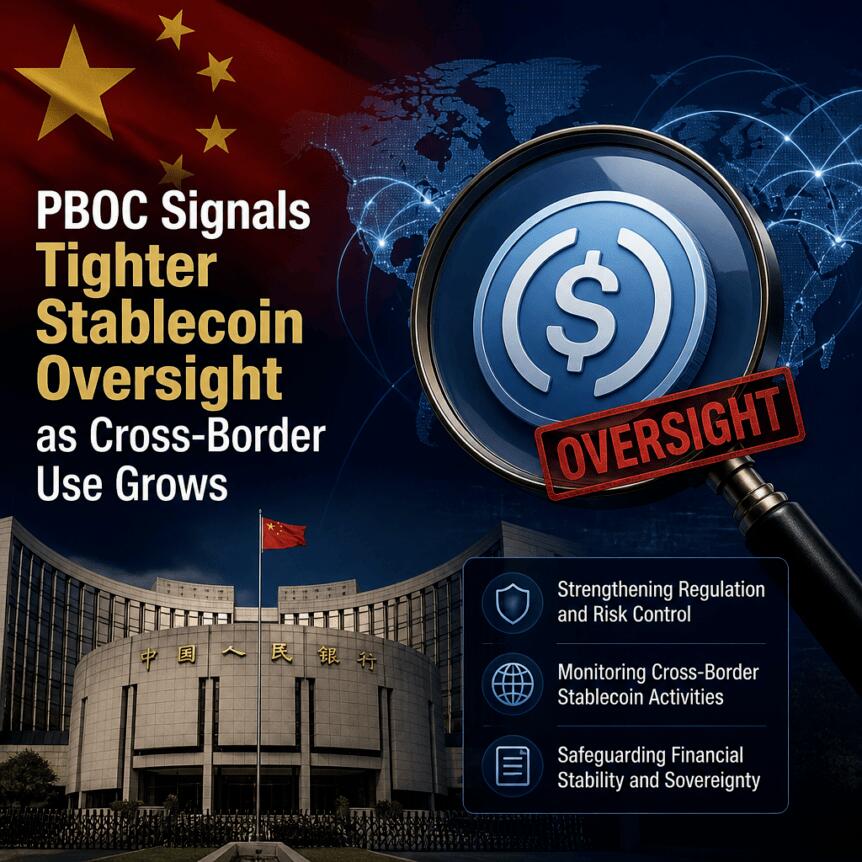
China’s central bank leadership has called for tighter attention to stablecoins as privately issued tokens increasingly intersect with cross-border payments and aspects of the international monetary system. In remarks reported by The Paper, Wang Xin, director general of the Research Bureau at the People’s Bank of China (PBOC), urged regulators to monitor stablecoin-driven developments while strengthening international coordination and regulatory cooperation.
The comments also pointed to broader risks regulators associate with payments infrastructure—namely growing uncertainty and the possibility that payment channels could be used in ways that disrupt cross-border transactions. While Wang did not announce new rules or endorse stablecoins, the message aligns with a more restrictive regulatory posture toward private digital money and highlights how compliance requirements could expand for firms operating across jurisdictions.
Key takeaways
- China’s PBOC leadership urged authorities to closely monitor stablecoins’ impact on cross-border payments and the international monetary system.
- Wang Xin warned about uncertainty and potential “weaponization” of payments that could disrupt normal cross-border activity.
- The remarks come after China and multiple agencies previously banned unauthorized renminbi-pegged stablecoins and tokenized real-world assets (RWA) without government approval.
- Wang also flagged central bank digital currencies (CBDCs), saying cross-border CBDC roles warrant similar scrutiny and improved policy coordination.
Stablecoins under PBOC scrutiny: focus on cross-border payment architecture
According to The Paper, Wang Xin said regulators should pay attention to whether stablecoins could assume a larger role in cross-border payments and consider how regulation and international coordination should proceed. The framing is notable because it treats stablecoins not only as a market asset class, but also as potential payment rails that can influence cross-border settlement behavior and, indirectly, monetary and financial stability concerns.
For institutional compliance and risk teams, this matters because cross-border payment use-cases can change a token’s regulatory treatment. Firms that interact with stablecoins—whether as counterparties, liquidity providers, or gateways—may face increased scrutiny around licensing, sanctions controls, and anti-money laundering (AML) and know-your-customer (KYC) obligations depending on the jurisdiction and the nature of the settlement flows.
Wang’s remarks also referenced risks linked to the governance and security of payment systems. In particular, he cautioned that uncertainty and potential weaponization of payments could interfere with ordinary cross-border transactions. While the statement did not specify mechanisms or actors, it reinforces the policy view that stablecoin-based payment networks could be exposed to geopolitical and operational disruptions.
Regulatory context: China’s earlier ban on unauthorized RMB-pegged stablecoins
Wang’s call for closer monitoring follows enforcement actions and rulemaking that have already restricted stablecoin issuance connected to the renminbi. Months earlier, the PBOC and seven other Chinese agencies banned unauthorized issuance of renminbi-pegged stablecoins and tokenized real-world assets on Feb. 6, according to reporting referenced in the underlying coverage.
As described in the broader record of that regulatory action, the rules were not limited to a single geography: they applied to both foreign and domestic entities and covered onshore and offshore versions of yuan-pegged tokens. The framework required issuers to obtain government approval, reflecting China’s preference for state-controlled digital money rather than privately issued digital currencies.
From a compliance perspective, the enforcement logic is significant. When regulators move from general warnings to binding restrictions tied to authorization, firms must assess where their activities sit in relation to “issuance,” “promotion,” “distribution,” and “use.” In cross-border operations, where marketing and technical access can be fragmented across countries, even indirect participation may raise questions about whether a firm is facilitating prohibited activity.
Broader implications for CBDCs and international coordination
Alongside stablecoins, Wang reportedly said central bank digital currencies (CBDCs) should also be observed more closely in relation to cross-border payments, with improved policy cooperation. This suggests China’s regulatory attention is not limited to private stablecoin markets; it also extends to how state digital currencies could influence international settlement.
The distinction is important for institutions evaluating future settlement models. If regulators view CBDCs as a more controllable alternative to private tokens for cross-border payment flows, then international coordination discussions could eventually translate into standards for interoperability, governance, or compliance expectations. Until those standards are defined, firms face uncertainty over how cross-border “digital money” will be regulated across legal regimes.
Additionally, China’s emphasis on international coordination underscores the inherently cross-border nature of stablecoin risk. Tokens can be transferred globally, but regulatory responsibility remains jurisdictional. This mismatch is a key reason why policy makers across regions increasingly tie stablecoin oversight to existing frameworks—such as AML/KYC expectations, licensing for payment or financial services, and controls aligned with sanctions and illicit finance prevention.
Stablecoin growth and compliance pressure from expanding usage
The PBOC’s renewed attention arrives as stablecoins continue to expand in market activity. The coverage referenced data points indicating that stablecoin supply increased and that stablecoins represented a substantial portion of overall crypto trading volume during the first quarter of 2026. It also noted that transaction volume can be heavily influenced by automated activity, with bots generating a large share of volume in that period.
While market statistics do not determine the legality of a token, they often influence supervisory priorities. Higher usage can increase the probability that compliance failures—such as inadequate customer screening, weak transfer controls, or unclear source-of-funds checks—are noticed by regulators and addressed through enforcement or additional requirements.
Institutional actors should also consider how major regulatory approaches are evolving elsewhere. In the European Union, for example, the Markets in Crypto-Assets (MiCA) framework provides a structured pathway for stablecoin-related obligations, including rules designed to mitigate risks from reserve management, disclosures, and operating conditions. Differences between regimes can create friction for cross-border service providers, particularly those offering custody, exchange, remittance, or settlement tooling connected to stablecoin flows.
Against this backdrop, China’s stance—requiring approval for renminbi-pegged stablecoins and tokenized RWA issuance—illustrates one end of the policy spectrum: a preference for tighter state oversight over private issuance. Even where stablecoins are used in ways not directly tied to issuance, the regulatory focus on cross-border payments signals that regulators may still scrutinize service layers around distribution and transfer.
Closing perspective: what to watch next
Wang Xin’s remarks do not announce immediate policy changes, but they reinforce an enforcement trajectory in which stablecoins and CBDCs are treated as strategic issues for payments governance and international coordination. For regulated firms, the near-term priority is to monitor how Chinese guidance develops and how cross-border compliance expectations evolve alongside international policy frameworks—especially regarding AML/KYC controls, authorization boundaries, and controls that address payment-system geopolitical and operational risks.

Order flow trading is the analysis of real-time buying and selling activity to understand how market participants interact and where prices may move next. It focuses on executed orders, resting orders, liquidity, volume, and market participation. This shows the activity behind price moves, not just the moves themselves. Its purpose is to help traders identify potential trades, assess market sentiment, and make trading decisions.
Traders apply order flow analysis across forex and CFD markets. This article explains how order flow works, its components, and three order flow trading strategies.
What Is Order Flow Trading?
Order flow trading is a method that uses the analysis of executed trades, pending orders, liquidity, and volume to understand market participation and anticipate potential price movements. Applying order flow in trading involves examining where buy and sell orders might rest in the market.
To implement order flow analysis, traders focus on three components: liquidity, supply and demand zones, and trade execution.
Liquidity is the pool of resting orders waiting to trade at each level. These orders form supply and demand zones, where buying or selling has concentrated. Trade execution occurs when incoming orders meet that liquidity, and the balance between the two drives price discovery.
Much of the trading volume comes from banks and funds, so reading institutional trading activity adds context that price alone cannot give.
Order Flow vs Volume Analysis vs Price Action
Order flow, volume and price action describe market activity at different depths.
Price action reflects the shape of past price on a chart. Volume shows how much traded. Order flow shows the orders behind that trade. Order flow gives the most detail of the three.
Price action shows what happened. Volume tells you the size of activity but not its direction or intent. Order flow adds that missing layer. It shows whether buyers or sellers were the aggressors and where liquidity zones build up.
Tools such as volume profile, Volume-Weighted Average Price, Volume-Weighted Moving Average sit between volume and order flow analysis, mapping volume across price to hint at order concentration. The practical trade-off is depth of insight against complexity. Order book analysis is the most detailed but also the hardest to read.
Core Components of Order Flow Analysis
In the realm of trading, dissecting the order flow is akin to peering into the heart of the market, revealing the intentions of traders through the movement of buy and sell orders.
The sections below cover the main chart components in order: order blocks, market structure and trends, imbalances, and volume. The commonly used order flow tools then follow, namely footprint charts, depth of market (DOM), also called market depth, and cumulative delta, alongside the volume profile.
Understanding these components allows traders to interpret order flow directly from the chart, providing insights into where the market might head next based on past and present trader actions.
Order Blocks (Supply and Demand Zones)
In analysing order flow on a chart, order blocks, or supply and demand zones, appear as areas where price action has shown significant movement away from a particular level, indicating a concentration of buy (demand) or sell (supply) orders.
These zones are typically highlighted by a sudden surge or drop in price, leaving behind a footprint where future price often reacts. For example, a demand zone might be identified by a rapid price increase from a specific area, suggesting buyers overpowered sellers significantly.
An order block marks where unfilled orders cluster, forming dense liquidity zones before a sharp move. When price revisits these supply and demand zones, those resting orders can absorb or repel it, which is why the area often produces a reaction. Blocks left by institutional trading activity tend to be the clearest.
Market Structure/Trends
The market structure, or trend, is visible through the series of highs and lows on a chart. An uptrend is recognised by ascending peaks and troughs, while a downtrend is marked by descending peaks and troughs. These structures show order flow traders the prevailing direction of market sentiment.
Trend continuation is central to market structure trading. In an uptrend, buyers repeatedly absorb supply at higher levels, and each higher low marks a fresh trading imbalance in their favour. In a downtrend, sellers repeatedly absorb demand and push prices lower, while each lower low signals a fresh supply–demand imbalance in their favour.
That imbalance has to persist for the trend to hold. When opposing flow takes over, the run of higher highs or lower lows breaks, which often signals a shift in market structure rather than a pause.
Imbalances
Imbalances manifest as large, directional candles that break away from a consolidation area, signifying a sudden imbalance between buyers and sellers. These are often accompanied by increased volume, which may suggest a strong commitment from traders to move the price in a specific direction.
In ICT and order flow terminology, this kind of gap usually appears in the form of a fair value gap. It forms when price moves so fast that one side barely trades, leaving a three-candle gap where little business was done. Traders mark these gaps because price often returns to fill them, rebalancing the orders that were skipped. A trading imbalance that stays unfilled can act as a magnet for future price, while one that fills cleanly tends to confirm the move that created it.
Volume
Volume is directly observable on a chart, usually depicted as bars beneath the price action. High volume bars accompanying significant price moves validate the strength of that move, implying a robust interest from the market in that price level. Conversely, low volume may indicate a lack of conviction, suggesting that the price move may not be sustainable.
Volume confirmation and order flow confirmation differ. Volume shows how much traded, confirming a move had participation behind it, but not who was in control. Order flow confirmation goes further, showing whether buyers or sellers were the aggressors at each level. A volume profile bridges the two by mapping where volume built up across price, though only footprint and delta data confirm the direction of that activity.
Footprint Charts and Cumulative Delta
A footprint chart shows the volume traded at the bid and at the ask inside each price bar. It reveals who was aggressive at every level, not just where price closed. Cumulative delta then tracks the running net of that buying against selling, turning the detail into a single trend line.
Bid and ask volume sit at the centre of this. Volume traded at the ask comes from aggressive buyers lifting offers. Volume traded at the bid comes from aggressive sellers hitting bids. Delta is the difference between the two within a bar, a positive figure when buyers dominate and a negative figure when sellers do.
Cumulative delta adds each bar’s delta to a running total. A rising line shows net buying building over time, while a falling line shows net selling. The most watched signal is divergence. If price makes a new high but cumulative delta does not, the buying behind the move may be weakening. Footprint and delta data are standard in centralised futures markets, where every trade is recorded at the exchange, which is why they appear so often in order flow study.
Depth of Market (DOM)
The depth of market, or DOM, is a live ladder of buy and sell orders waiting at each price. It is also called the order book, or market depth. The bid side lists resting orders to buy below the current price. The ask side lists resting orders to sell above it. The size at each level shows where liquidity is stacked.
Reading this ladder, sometimes called DOM trading, is a form of order book analysis that aids short-term price discovery. A centralised exchange shows the full depth of the market. OTC forex does not, because there is no central book and each broker sees only its own flow. This is the main limit on order flow trading in forex, which pushes traders toward liquidity and supply-demand methods, or toward futures data as a proxy. Even on exchanges, book depth alone can read liquidity incompletely.
Interested readers can learn more about these components and how they interact with each other in our comprehensive article on order flow analysis.
Order Flow Trading Strategy Examples
Let’s now take a look at how these components can be used in three order flow trading strategies.
The three examples below are educational illustrations of how order flow concepts fit together. They are not trading recommendations, and no setup works every time. Each one shows how tools such as order blocks, liquidity and moving averages might combine in an order flow trading strategy. Any approach can be tested on a demo account.
If you are ready to try these approaches on live markets, you can consider trading with them on FXOpen’s TickTrader platform.
Liquidity Sweep at Order Block/Supply or Demand Zone
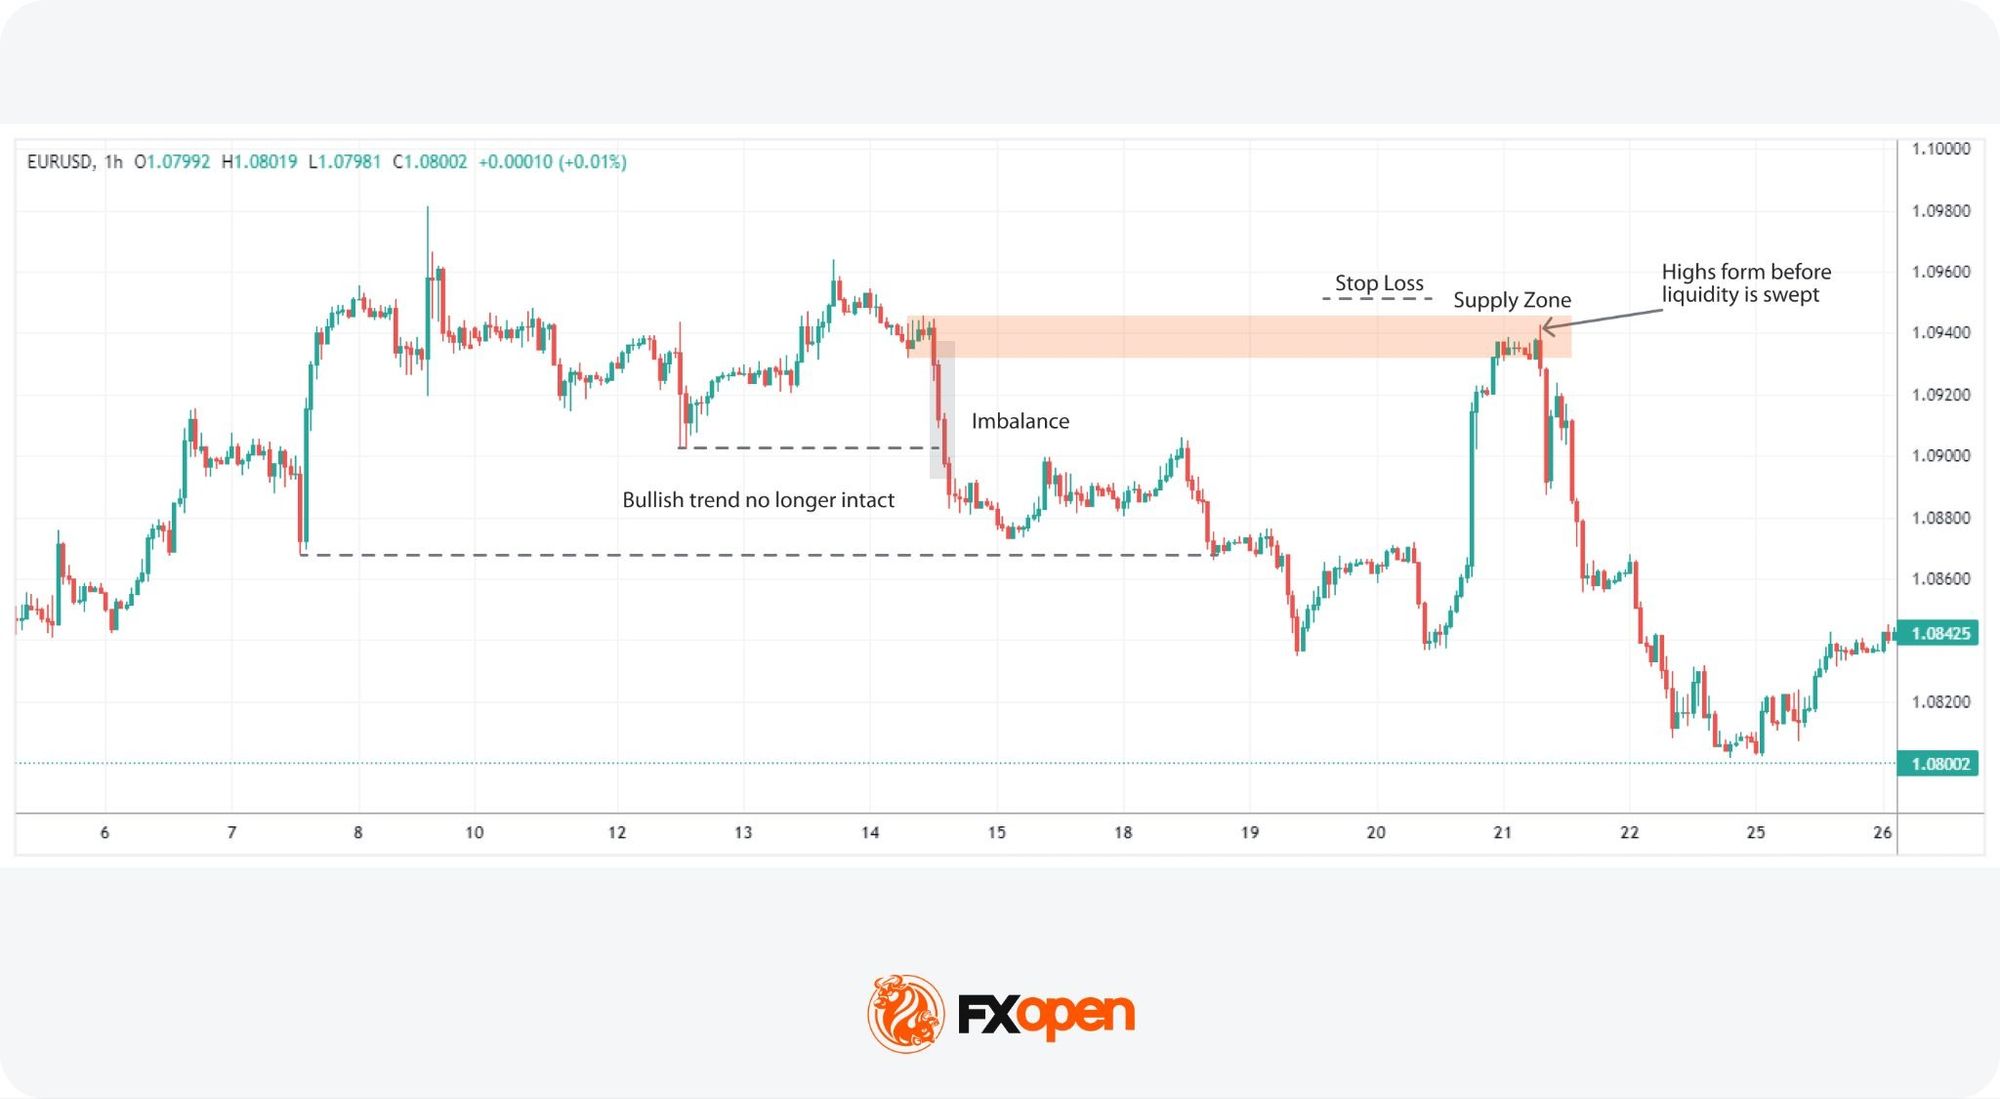
A liquidity sweep is a quick push past an obvious high or low, where stop orders and breakout orders rest, followed by a sharp reversal. The move taps that pooled liquidity, fills large orders against the crowd, then turns. Spotting the sweep and the snap-back is what separates this setup from a plain breakout.
The concept of a liquidity sweep within an order block stands out for its nuanced approach to capitalising on market reversals. This strategy hinges on the premise that price movements in these critical zones often preclude a significant direction change, making them ripe for reversal entries.
However, while leaving a simple limit order at these areas may be tempting, unforeseen news or a strong trend can cause the price to trade beyond it. Therefore, the theory states that looking for confirmation is important. Using the idea of a liquidity sweep or a bull/bear trap, traders can identify higher probability setups in these areas.
Entry
- Traders typically identify an order block, marking zones that prompted a significant imbalance and strong directional price move.
- Watching for the price to approach these zones is important, with a keen eye on the price action within the zone for signals of a potential reversal.
- The formation of new highs in a supply zone or lows in a demand zone accompanied by a liquidity sweep (a brief breach of these highs/lows followed by a quick return) might serve as a trigger for entry.
- The appearance of reversal patterns, like a shooting star, hammer, or engulfing candlestick, may indicate the market’s rejection of prices beyond the zone.
Stop Loss
- Traders could place a stop loss just beyond the boundary of the supply or demand zone.
Take Profit
- Profit targets might be set at the nearest opposing supply or demand zone, usually where another significant imbalance lies.
Moving Average Crossover at Order Block/Supply or Demand Zone
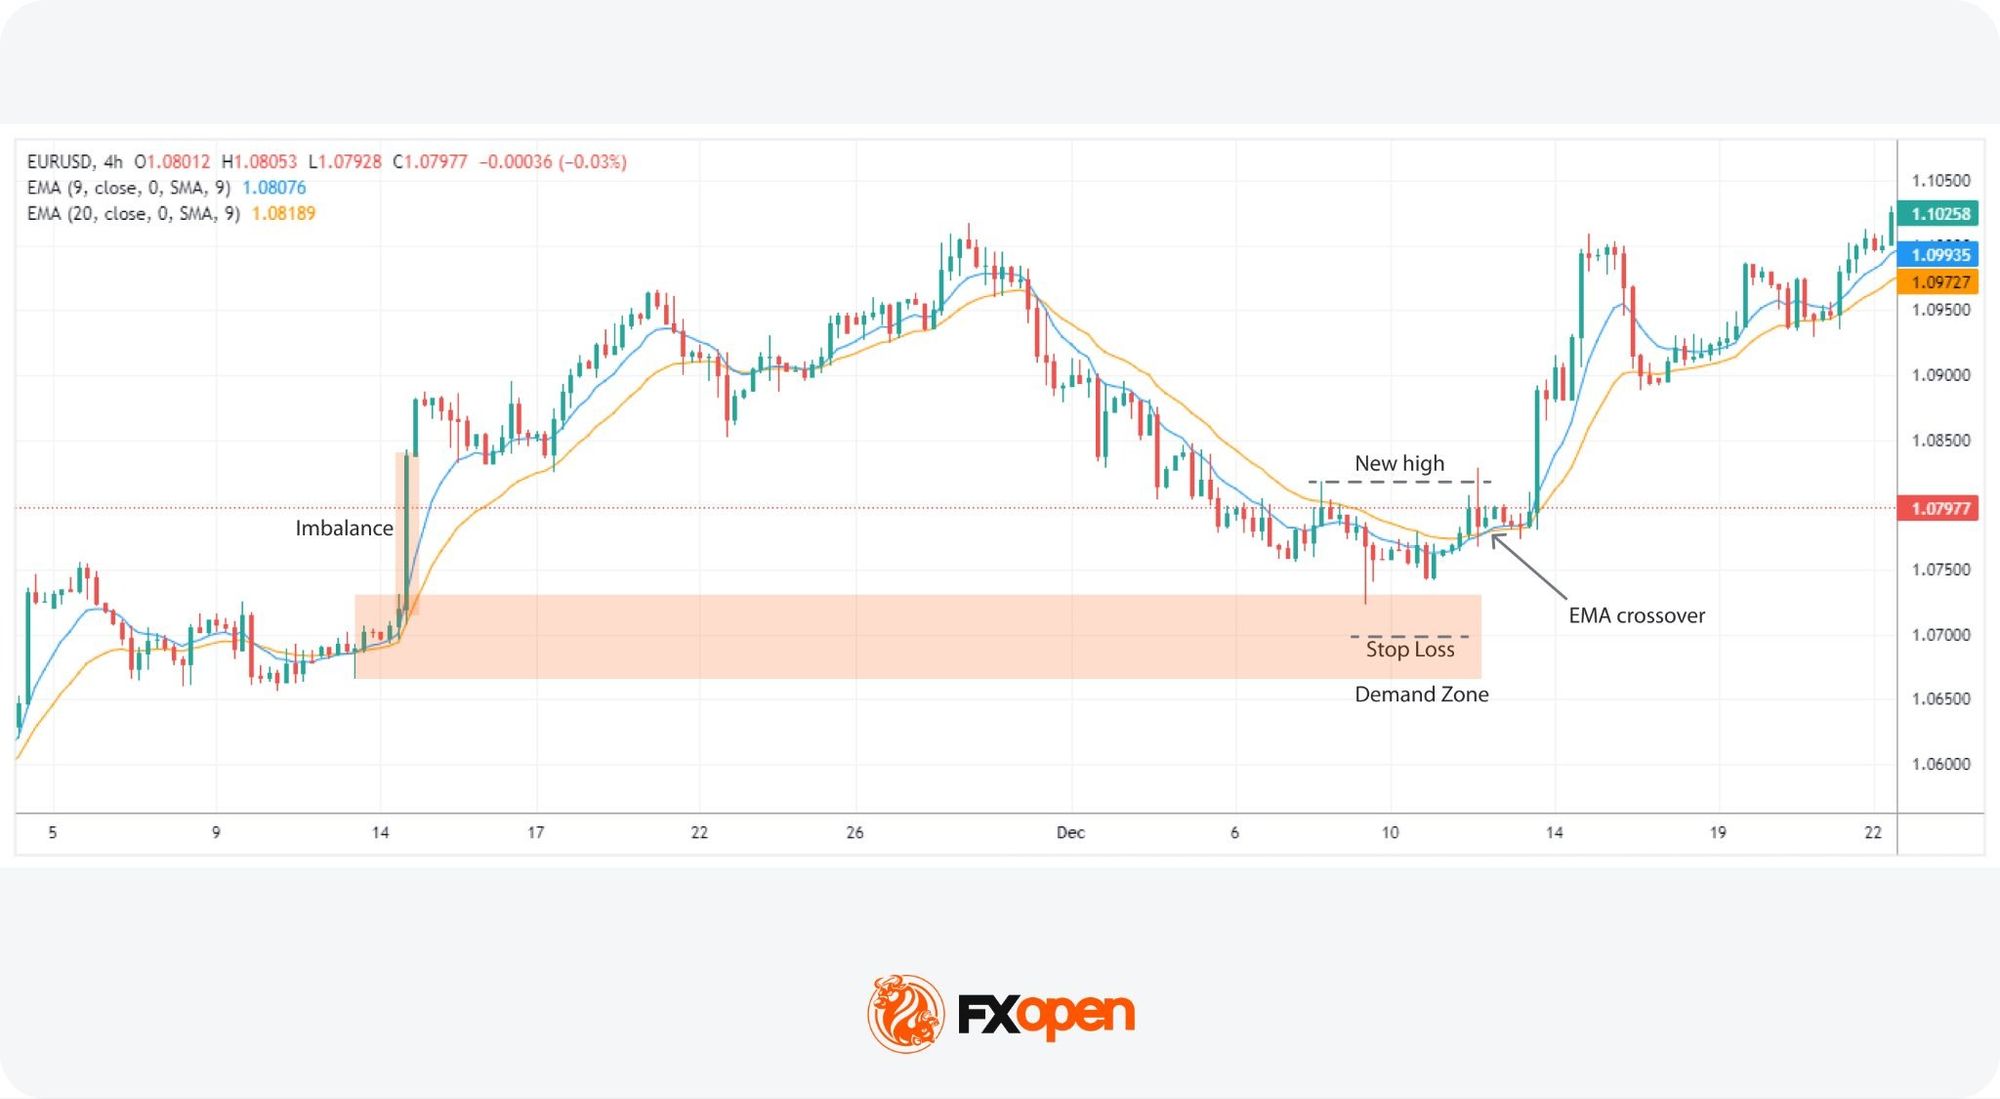
Integrating moving averages into the analysis of order blocks or supply/demand zones offers traders a quantitative lens through which market sentiment can be gauged more precisely. This strategy particularly revolves around the utilisation of two moving averages.
We’ve used Exponential Moving Averages (EMAs) with periods of 9 and 20, leveraging their sensitivity to price movements to identify potential reversal points within these critical market zones. However, traders can use whichever type or length they prefer, though a balance should be struck between responsiveness and mitigating false signals.
Note that moving averages are confirmation tools here, not order flow indicators. They read prices, not orders, so they confirm an order flow signal at the zone rather than generate one.
Entry
- The trader identifies an order block where a substantial move has previously occurred, leaving behind a noticeable imbalance in the price chart.
- As the price revisits this zone, attention is directed towards the EMAs’ behaviour. For instance, a crossover of the 9-period EMA above the 20-period EMA signals bullish momentum, whereas its crossover below the 20-period EMA reflects bearish momentum.
- Entry might be considered once the moving average crossover aligns with the anticipated direction of the reversal, indicating a strengthening trend.
- This signal might be further validated if accompanied by a liquidity sweep or specific candlestick patterns within the zone.
Stop Loss
- A stop loss could be placed beyond the zone’s extremes.
- Given the added confidence from the moving average crossover, the stop loss could also be positioned just beyond the most extreme high or low when the price entered the zone.
Take Profit
- The take-profit target might be set at an opposing supply or demand zone. Such zones are anticipated to act as natural barriers where the next significant price reaction could occur.
Impulse and Correction Stop Order
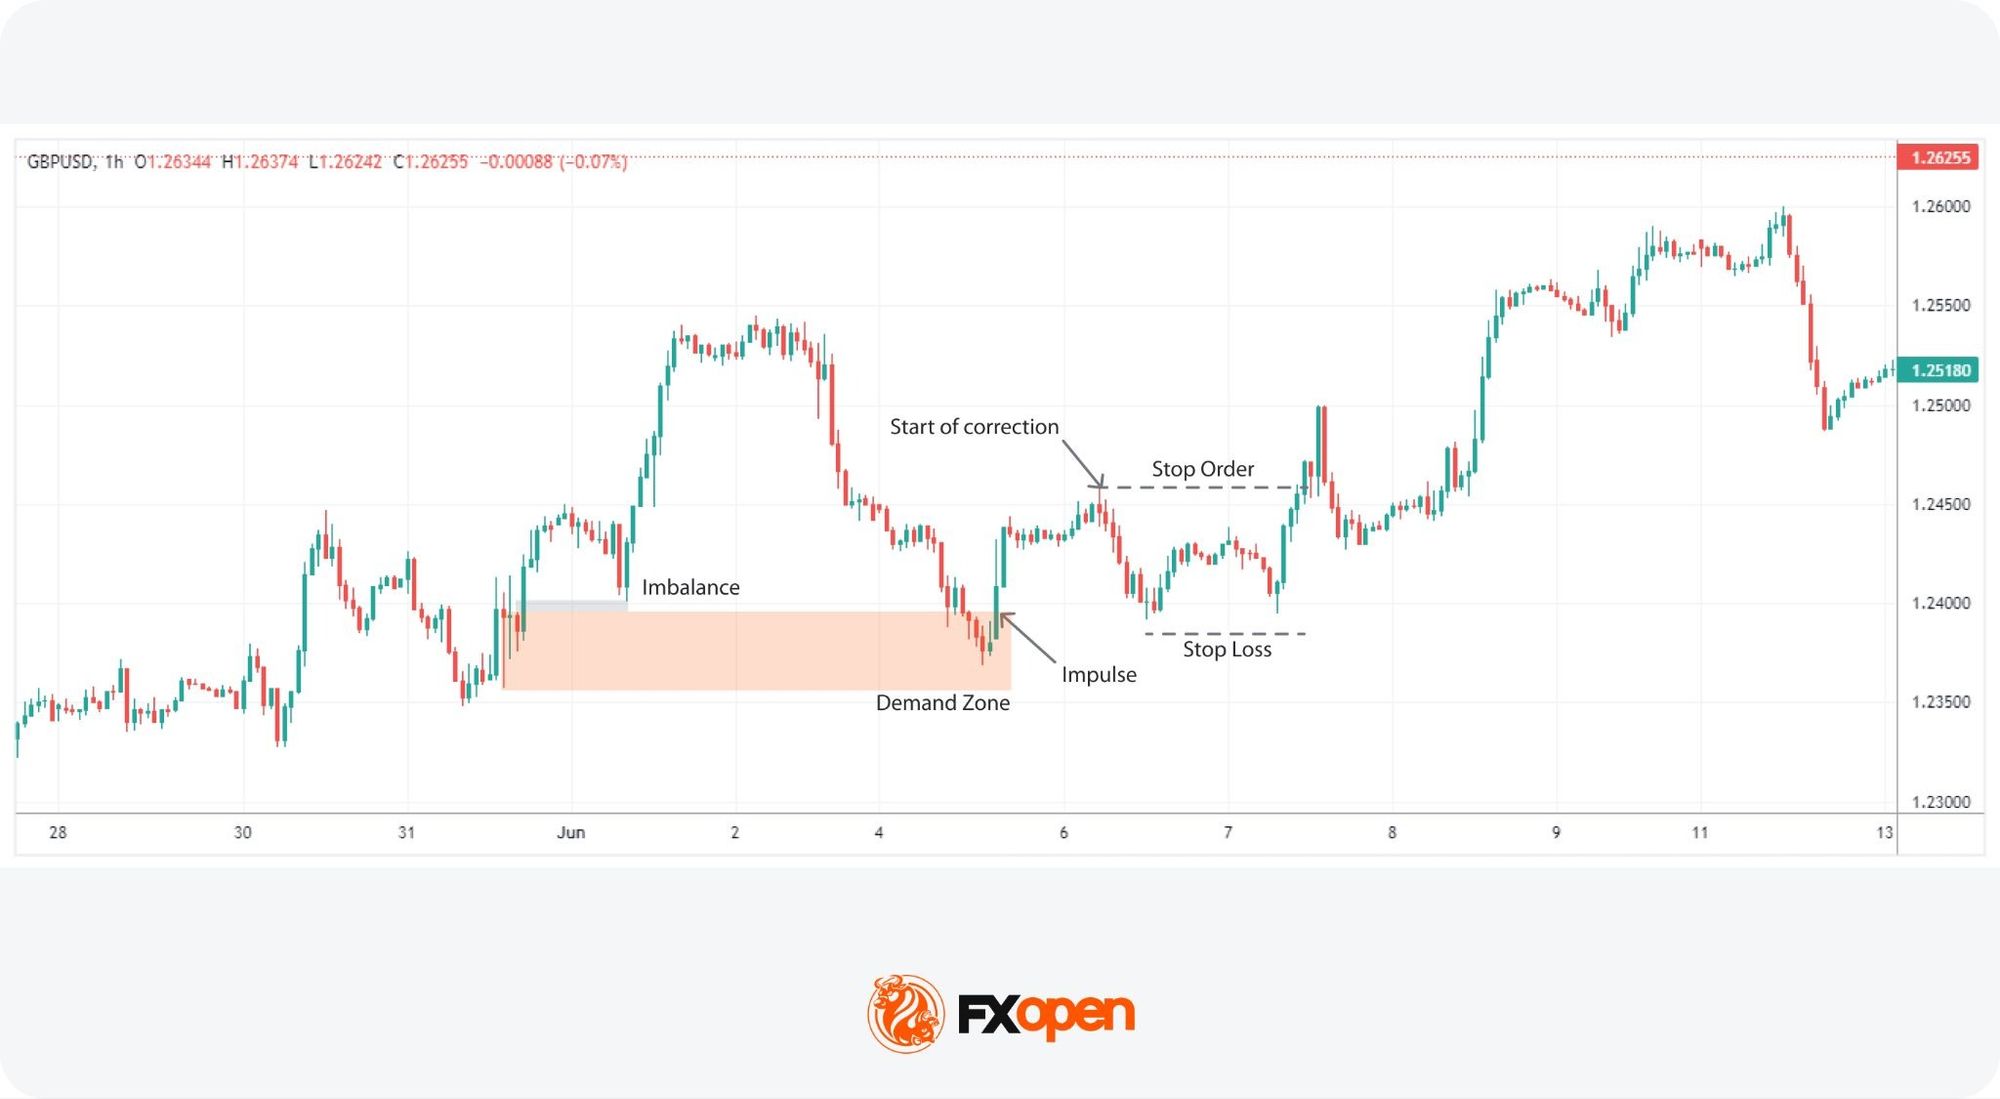
The Impulse and Correction Stop Order strategy leverages the dynamic reaction of prices at supply or demand zones, focusing on the price action that follows these pivotal areas.
Recognising that initial reactions from these zones can be sharp, signalling strong market rejection, this approach waits for a pullback or correction as a secondary entry point. This method is popular among traders looking to capitalise on the momentum shift or those who may have missed the primary reversal within the zone.
An impulse is the first sharp move out of a zone, where one side overwhelms the other. The correction is the slower pullback that follows, as price drifts back toward the zone. Often it refills the trading imbalance left by the impulse, trading through the gap the fast move skipped. That refill is what offers the second entry.
Entry
- Traders monitor for a pronounced impulse move away from a supply or demand zone, indicating strong market rejection of these levels.
- A subsequent pullback or correction phase is observed, ideally filling the imbalance left by the initial impulse. This correction signals the market’s natural attempt to retest the zone before a potential markup or markdown begins.
- A stop order might be set at the low (for bearish setups) or high (for bullish setups) that initiated the correction. This positioning aims to capture the breakout moment that confirms the market’s commitment to the new direction.
Stop Loss
- The stop loss might be placed beyond the correction. This placement is strategic, potentially minimising loss if the anticipated breakout does not materialise and the correction reverses direction.
Take Profit
- The take-profit point might be chosen within a suitable opposing zone, considering the optimal risk/reward ratio or strong support/resistance levels.
Key Takeaways
Order flow trading in forex and CFDs provides a deeper understanding of market behaviour by revealing how buyers and sellers interact through executed trades, resting orders, liquidity, and volume. By combining key concepts with tools such as the order book, footprint charts, and volume profile, traders can gain valuable insight into market sentiment and potential price direction.
While no method guarantees favourable outcomes, understanding order flow may support traders’ decisions across financial markets.
To study any order flow trading strategy on live charts, you can consider opening a trading account with FXOpen and use the TickTrader platform.
FAQs
What Is Order Flow in Trading?
Order flow represents the myriad of buy and sell orders executed in the market. It acts as a snapshot of market sentiment, showing where and how traders are placing their orders, which in turn influences price movements.
How Do Traders Read an Order Flow?
Reading order flow involves analysing the data on the volume of trades, the price levels at which they are executed, and the type of orders (buy or sell). Traders often use specialised software that visualises these data points, though they can be identified on charts through the use of order blocks and imbalances.
How Do Traders Trade an Order Flow?
Trading order flow typically involves looking for signs of imbalance between buy and sell orders and trading from order blocks. Traders often enter positions based on the anticipation that price will fill these imbalances and reverse from order blocks.
Why Is Order Flow Important in Trading?
Order flow is important because it provides insights into the immediate direction of the market, revealing the underlying demand and supply dynamics, which can be important for decision-making.
What Is the Difference Between Order Flow and Volume?
While closely related, order flow technically refers to the detailed list of transactions (buy and sell), whereas volume measures the quantity of an asset traded over a period. Order flow gives insight into the specifics of market transactions, while volume indicates the level of activity.
What Is the Difference Between Order Flow and Price Action Trading?
Order flow trading focuses on the underlying transactions that drive market movements, whereas price action trading relies on analysing the price movements themselves. Price action traders study charts for patterns and trends without necessarily considering the specific buy and sell orders that cause those movements.
What Tools Are Commonly Used for Order Flow Analysis?
The most common order flow analysis tools are footprint charts, depth of market, cumulative delta and the volume profile. Footprint charts show bid and ask volume per bar, DOM lists resting orders, cumulative delta tracks net buying against selling, and volume profile maps volume across price levels.
Can Order Flow Be Used in Forex Trading?
Yes, but with limits. Order flow trading in forex cannot draw on a full central order book, because forex trading is decentralised and each broker sees order flows of a particular broker. Traders instead read liquidity, supply and demand zones, and footprint or delta data from correlated futures as a proxy.
What Is a Cumulative Delta in Trading?
Cumulative delta is the running total of delta, where delta is ask volume minus bid volume in each bar. It shows whether net buying or selling is building over time. When price rises but cumulative delta falls, the move may lack support, a divergence traders watch for.
This article represents the opinion of the Companies operating under the FXOpen brand only. It is not to be construed as an offer, solicitation, or recommendation with respect to products and services provided by the Companies operating under the FXOpen brand, nor is it to be considered financial advice.

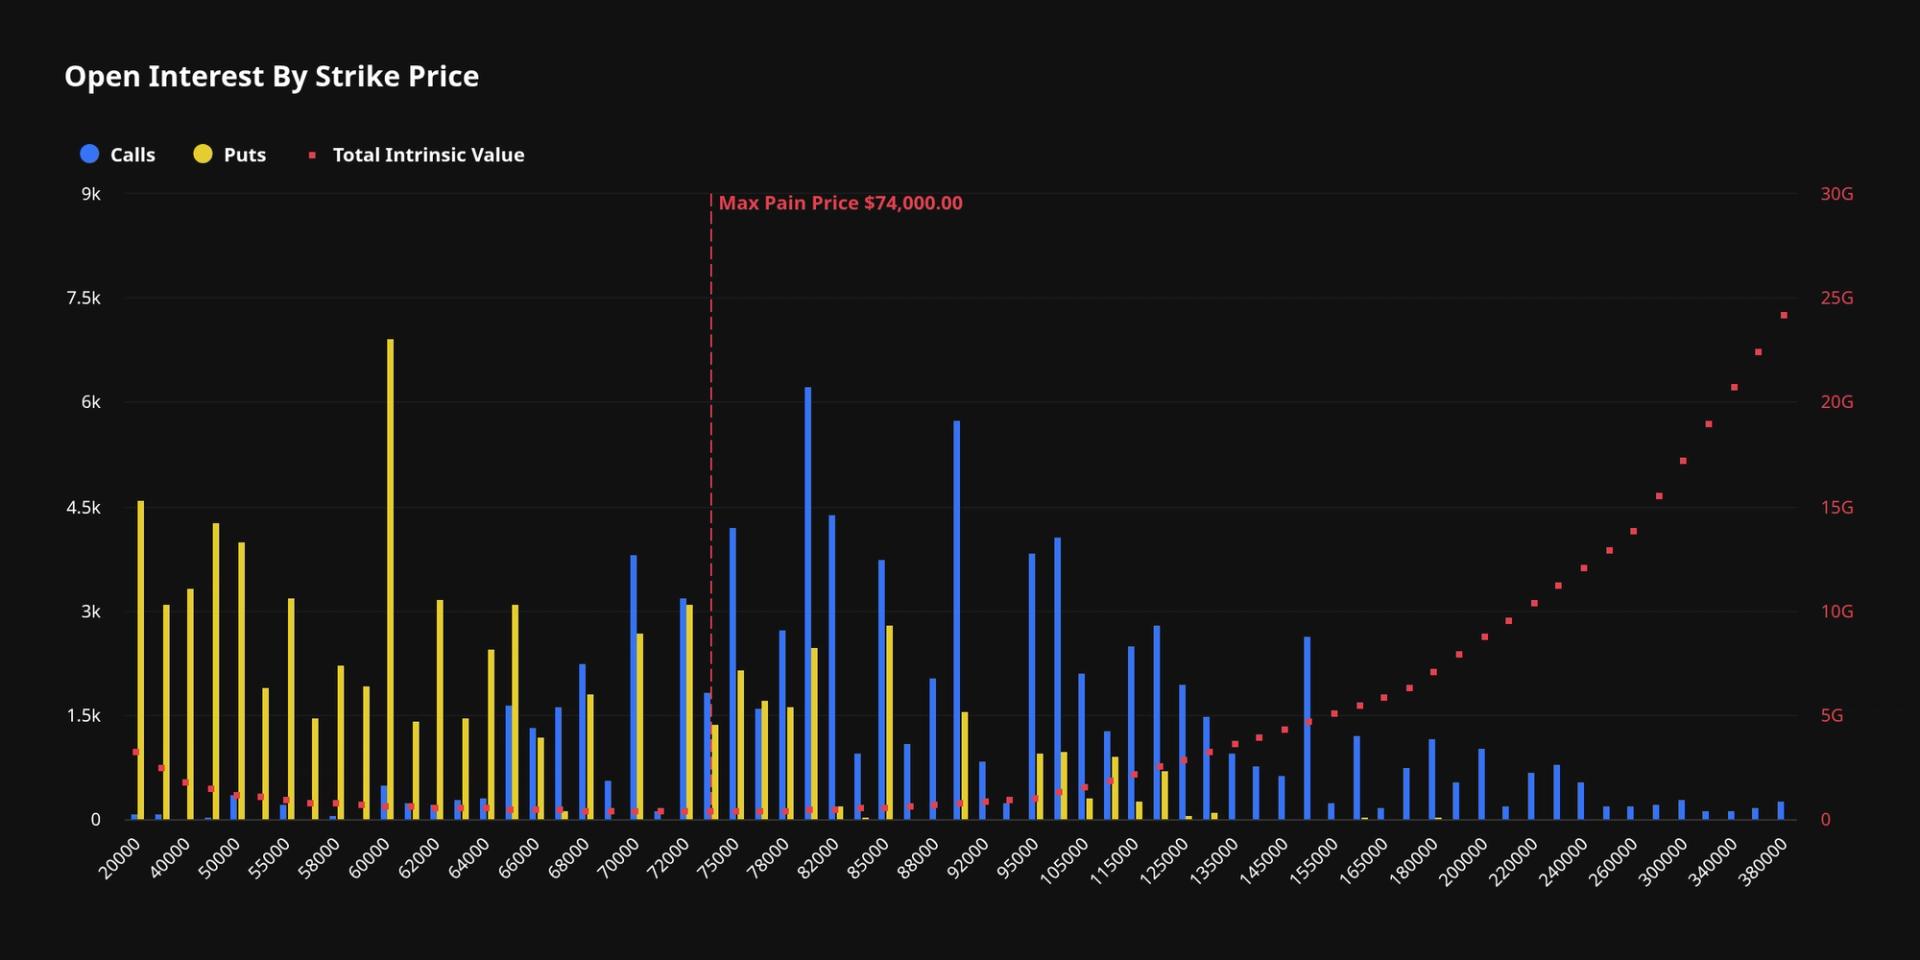
With only about 20% of the $10.6 billion in open interest sitting in-the-money (ITM) and the remaining 80% out-of-the-money (OTM), the market has a strong imbalance that could fuel sharp price swings as participants scramble to adjust their positions.
The story doesn’t end there.
Max pain and put-call ratio
Another factor pointing to potential volatility is the max pain price for the June 26 expiry, which currently sits at $74,000, about 14% above bitcoin’s current spot price near $65,000.
Max pain is the price level at which the largest number of options contracts would expire completely worthless. The theory suggests that as expiry approaches, the underlying asset (in this case bitcoin) tends to gravitate toward that max pain level, as market makers and traders adjust their positions.
While this “max pain” effect is widely watched in traditional markets, its reliability in crypto is often debated. Still, if the theory holds, bitcoin could see a strong bounce toward $74,000 in the coming days.
Meanwhile, the put-to-call ratio stands at 0.87, reflecting 87,156 call contracts versus 76,241 put contracts across more than $10.6 billion in notional open interest. Although call options still slightly outnumber puts, the relatively balanced positioning highlights growing uncertainty among traders.
Open interest is heavily concentrated around two key strikes. The $60,000 put holds roughly $450 million in exposure, making it an important support level, which bitcoin tested at the start of June. Meanwhile, the $80,000 call, with about $406 million in open interest, remains a significant upside hurdle.
Crypto World
Bitcoin Price Prediction: Andrew Tate Liquidated for 108 Times, Now He Doubles Down With 40x BTC Long
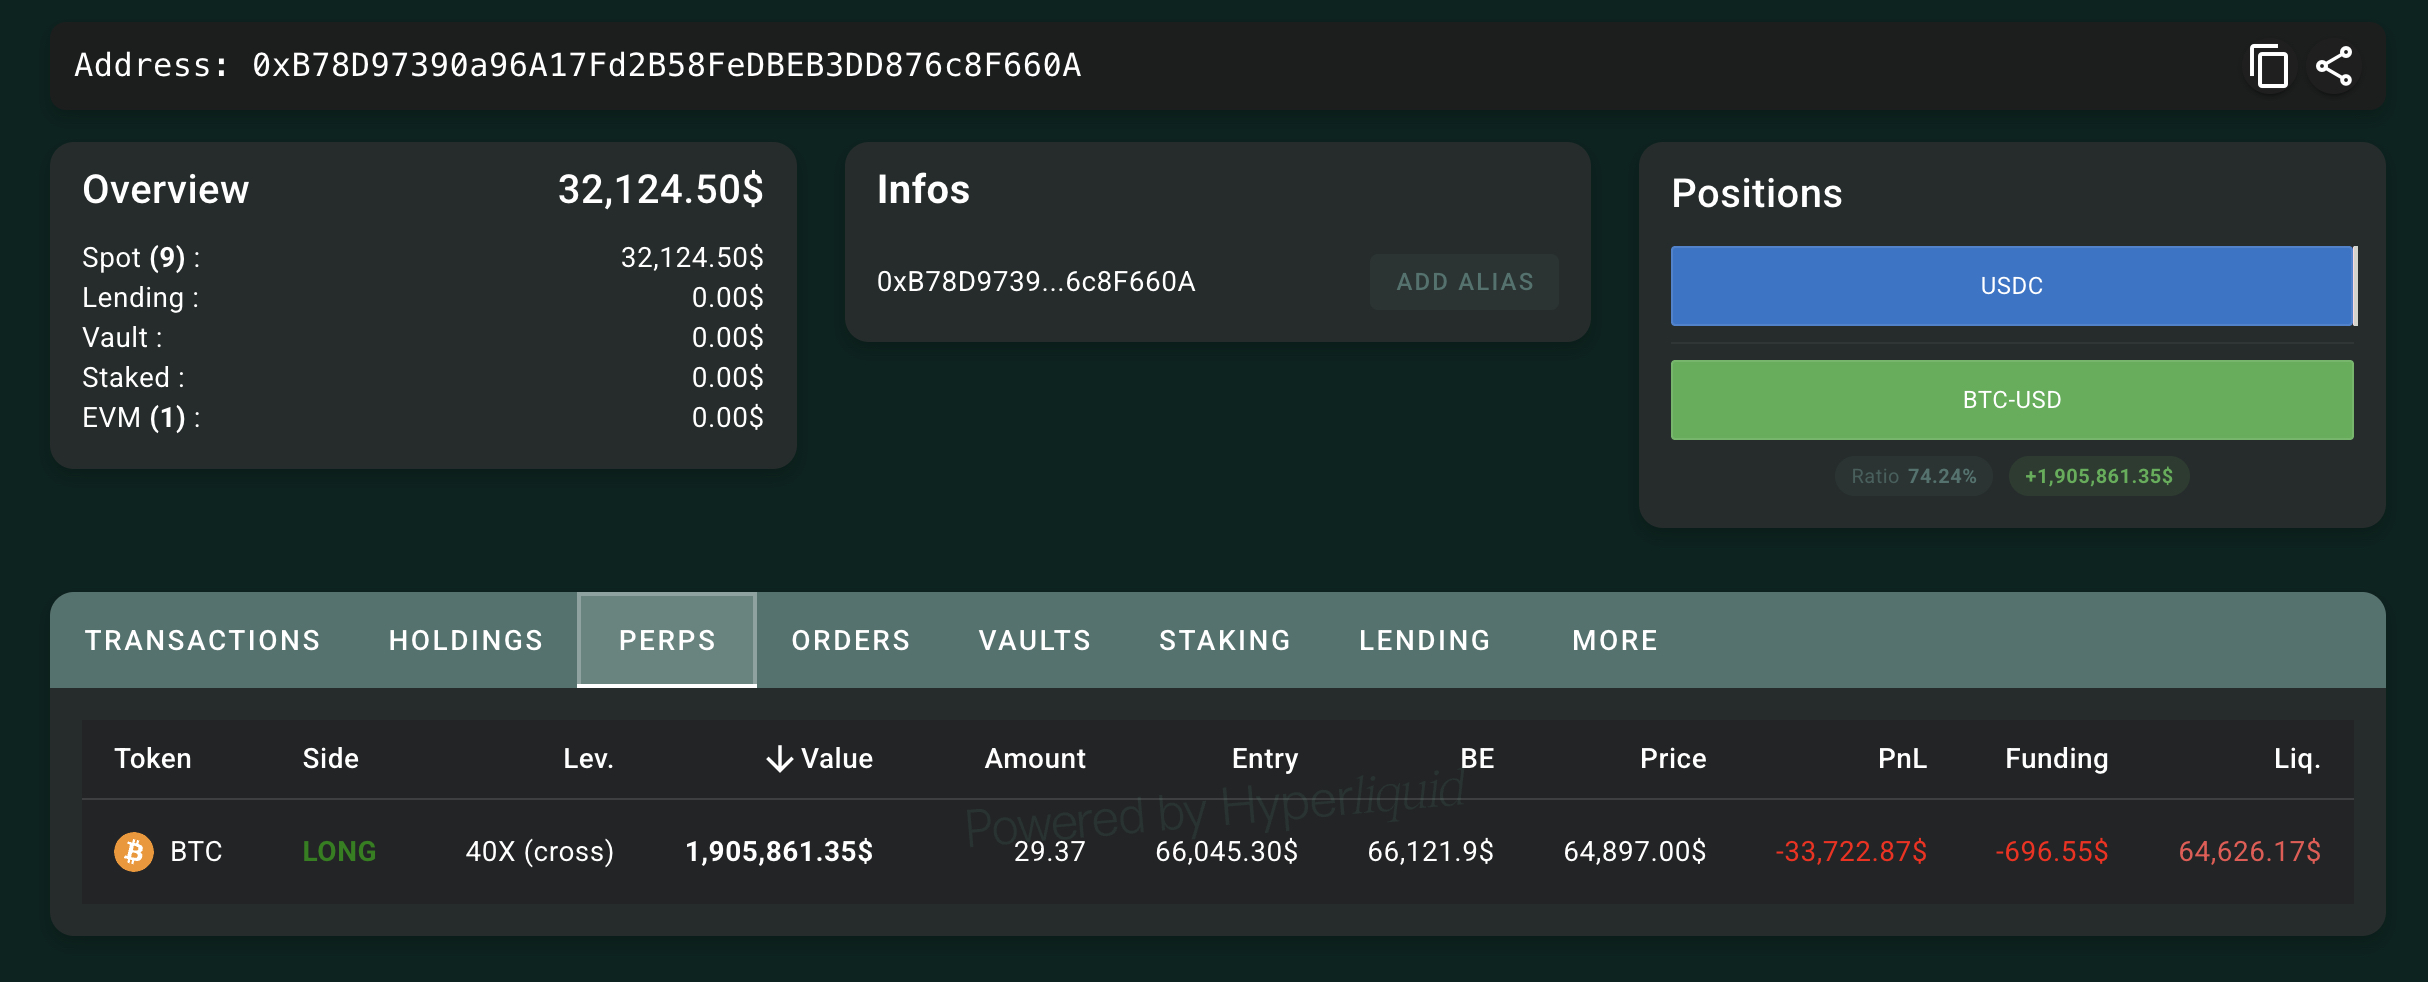
Bitcoin is holding a precarious perch at $65K, price prediction is turning slightly bearish, and the margin for error right now is razor-thin. Into that environment, Andrew Tate has opened a 40x leveraged long on BTC, his 108th attempt at a trade that has ended in liquidation every previous time.
Onchain analytics firm Lookonchain flagged the position: Tate is long 57.36 BTC ($3.76 million), with a liquidation price sitting at $65,216. Spot BTC was trading around $65,500 at the time of the report, a gap of roughly $300 between live price and the wipe-out level.
At 40x leverage, even a brief wick through that level ends the trade. The position is either a bold macro bet or a very public margin call waiting to happen.
Wait, actually, he has been liquidated while this is being written, and he has now reopened another long(changed the headline). Smaller amount now, still at 40X leverage. Anyway, data shows he has been liquidated 108 times now, with 90% being Bitcoin long positions.

Bitcoin has been struggling to push cleanly through the $67k–$69k band, and this stall is the context framing Tate’s outsized risk here.
Discover: The Best Token Presales
Bitcoin Price Prediction: Reclaim $69k Before Bears Take Control? Or Tate Cooked?
Bitcoin’s technical picture is consolidating. The nearest support sits at approximately $65,000 has been breached. Now, deeper demand zones are clustered between $63,000 and $62,500. On the resistance side, $67,000–$69,000 is the ceiling, followed by a heavier band from $71,500 to $73,000.
The 4-hour chart shows BTC still respecting an ascending trendline, with intraday momentum described as effectively neutral over the past eight hours. Although the price has been slightly sliding, we see small oscillations with no directional commitment.
Since the $65K suuport broke, BTC needs to hold $63,000 and reclaim $65,000, and eventually closes above $71,500, at which point a structural uptrend becomes defensible and short-term targets extend toward $73k.

The most likely scenario would see price continue chopping between $63,500 and $67,000, grinding out consolidation while macro catalysts like Fed data and regulatory headlines remain absent or ambiguous.
Or Tate would be really cooked if the daily close is below $63,000 as it opens a move toward the $62,00 zone. Bearish analysts are already flagging downside Fibonacci targets as low as $52k–$45k if the structure breaks, a scenario that would, incidentally, liquidate Tate before the market even gets interesting on the downside.
Institutional forecasters remain split, with some bullish targets contingent entirely on that $71.5k–$73k zone giving way. Until it does, high-leverage directional bets are trading against the range.
Discover: The Best Crypto to Diversify Your Portfolio
Bitcoin Hyper Targets Early Mover Upside as Bitcoin Tests Key Levels
Here’s the uncomfortable truth for spot BTC holders at current levels: even a clean breakout to $73k represents roughly 11% upside from here. That is not a bad trade, but it is not a life-changing one at this market cap.
The asymmetry that made Bitcoin at $3k or $10k so compelling simply does not exist at $65k. Which is exactly where early-stage Bitcoin infrastructure plays enter the picture.
Bitcoin Hyper ($HYPER) is positioning as the first Bitcoin Layer 2 with SVM (Solana Virtual Machine) integration, bringing Solana-speed smart contract execution directly into the Bitcoin ecosystem without sacrificing BTC’s security layer.
The architecture addresses Bitcoin’s three core limitations in one stack: slow throughput, high fees, and the absence of native programmability. The presale has pulled in $32 million at a current token price of $0.01368, with staking live for early participants. That is real capital allocation, not speculative noise.
For those watching BTC grind in a $4k range while Tate bets $3.76 million at 40x leverage, the calculus on where asymmetric upside actually lives right now is worth running.
Research Bitcoin Hyper here before the current presale stage closes.
The post Bitcoin Price Prediction: Andrew Tate Liquidated for 108 Times, Now He Doubles Down With 40x BTC Long appeared first on Cryptonews.
Citing people familiar with the matter, Reuters reported that the world’s largest cryptocurrency exchange could be forced to stop service to European Union customers as early as next month after its application for a key regulatory license is set to be rejected.
The threat comes from the EU’s Markets in Crypto-Assets (MiCA) framework, which requires digital asset firms operating within its borders to obtain authorization from a national regulator.
Binance to Drop Out of EU?
The report claimed that the exchange’s application through Greece’s Hellenic Capital Market Commission (HCMC) is expected to be denied, which would leave it without the authorization needed to continue serving clients from the bloc after the June 30 deadline.
If the situation escalates, this potential setback could become Binance’s largest regulatory hurdle in Europe since the implementation of MiCA a few years ago. The framework is designed to bring crypto firms under a unified regulatory regime, and even Hungary has turned the tide after the change in administration earlier this year.
As with essentially all reports from legacy media that might be harmful to Binance in any way, the company has taken a strong stance against those claims. A spokesperson pushed back against the coverage from Reuters, indicating that the exchange has worked with regulators for approximately 18 months and understands that the Green watchdog completed its review, with the application considered compliant.
Binance further said it has not received any formal indication from the HCMC that its application might be rejected.
“Binance remains fully committed to securing our MiCA license and operating under a unified European framework.
With 1,500+ compliance professionals globally, we continue to work closely with regulators while keeping users at the center of every decision,” reads a company statement on X.
Teng Concurs
Binance CEO Richard Teng also weighed in on the matter, saying the company is “dedicated to Europe.” He added that Binance and the team are “dedicated to securing our MiCA license and remain ready to operate under a fair, predictable, and genuinely harmonized European framework.”
In a follow-up post, he reassured the company’s user base of millions that their assets “remain secure.”
Please rest assured that your assets remain secure, are and will remain accessible at all times. Our intention is to support an orderly process and minimise disruption to our users. We will provide a further update prior to June 30 2026.
— Richard Teng (@_RichardTeng) June 16, 2026
The post Pushing Back at Reuters: Inside Binance’s Fight for Its European Future appeared first on CryptoPotato.


The day’s main event is Fed Chair Kevin Warsh’s first interest-rate decision. No change in rates is expected, which means markets will be scanning the policy statement, economic projections and the post-meeting press conference for cues.
Here is what could elicit a risk-on, positive reaction from bitcoin
The dot plot: This is a graphical representation of where individual Fed members see interest rates heading. Fed funds futures currently price in an 80% chance of a 25 basis-point increase by December. That’s the reference point for reading the plot: If it shows fewer than 80% of members projecting a hike by December, the BTC price could react positively.
Warsh’s take on rates and inflation: Will the Trump nominee break from market expectations and strike a dovish tone, citing recent oil prices and AI-driven disinflation to lay the groundwork for the rate cuts the administration wants? Or will he fall in line with current market pricing? In the former case, BTC could once again react positively.

Key Takeaways
-
Australia’s High Court delivers unanimous verdict requiring licence for Block Earner’s product
-
ASIC secures significant victory in cryptocurrency product regulation battle
-
Full Federal Court to reconsider penalty determinations following High Court ruling
-
Judges confirm crypto yield offering satisfied financial product criteria
-
Company pivots business model to Bitcoin-collateralized mortgage products
In a landmark decision, Australia’s highest judicial authority has sided with the financial regulator in a critical cryptocurrency licensing battle against Block Earner. The court determined that the company’s discontinued fixed-yield digital currency product required proper financial services authorization. The matter of penalties will now be reconsidered by the Full Federal Court.
Supreme judicial body reverses lower court decision
The seven justices delivered a unanimous verdict that overturned a previous Full Federal Court judgment favorable to Block Earner. The company, managed by Web3 Ventures Pty Ltd, previously provided the Earner yield service. ASIC maintained that the offering was subject to established financial product regulations.
The highest court determined that Earner functioned as an investment facility under Australian law. Additionally, judges concluded the product qualified as a derivative instrument. The judgment noted that yields fluctuated based on digital currency valuations and foreign exchange variations.
This determination bolstered ASIC’s argument that Block Earner required proper Australian financial services authorization. The watchdog emphasized that operating without appropriate licensing deprived customers of essential safeguards under financial services legislation. The penalty phase now proceeds to the Full Federal Court for fresh consideration.
Legal proceedings clarify Australian cryptocurrency framework
ASIC initiated civil penalty action against Block Earner during November 2022. The enforcement targeted the Earner service due to the company marketing it without necessary authorization. Block Earner discontinued the offering that same month.
The Federal Court determined in February 2024 that Block Earner operated an unlicensed managed investment structure. Nevertheless, the court subsequently granted the firm relief from monetary sanctions in June 2024. ASIC contested that relief decision, while Block Earner submitted its counter-appeal during July 2024.
The Full Federal Court granted Block Earner’s counter-appeal in April 2025. It simultaneously rejected ASIC’s penalty appeal at that juncture. The High Court has now overturned those findings and reinstated the regulator’s pursuit of penalties.
Company transitions to cryptocurrency-collateralized financing
Block Earner has subsequently pivoted away from fixed-return cryptocurrency offerings. The firm obtained an Australian Credit Licence during May 2026. It subsequently unveiled intentions to launch cryptocurrency-backed mortgage solutions.
The planned service would enable borrowers to pledge Bitcoin as security for residential financing. This structure would permit customers to obtain credit while maintaining their Bitcoin positions. The licensing approval represented a significant milestone for digital asset lending services in Australia.
Nevertheless, the High Court verdict strengthens ASIC’s regulatory authority over cryptocurrency products. The ruling establishes that existing legislation applies to digital asset offerings when they satisfy financial product criteria. Consequently, cryptocurrency businesses confront increased licensing obligations under Australia’s current regulatory structure.


Hull City could face points deduction in Premier League

Yum! Brands set to sell Pizza Hut business

Japan moves to cut crypto tax to 20%: why it matters


-

 Business3 days ago
No Jackpot Winner as $257 Million Prize Rolls Over to $269 Million Monday Draw
-

 Crypto World6 days ago
Oppenheimer backs SpaceX as $70 billion retail frenzy builds
-

 Fashion5 days ago
Weekend Open Thread: Tuckernuck – Corporette.com
-

 Crypto World6 days ago
Markets Rally as SpaceX IPO Looms Amid Iran Tensions and Inflation Surge
-
Crypto World3 days ago
Zimbabwe Requires Crypto Businesses to Register Annually Under New FIU Regulations
-

 Tech4 days ago
NanoClaw integrates JFrog registries to secure AI agent downloads
-

 Tech5 days ago
This Week In Security: Microsoft On Microsoft, Register Your Domains, Linux On ARM, And FreeBSD Joins The File Cache Club
-

 Crypto World4 days ago
Bitget enters Argentina’s regulated crypto market through PSAV registration
-
 Tech6 days ago
Dutton Ranch star claims they ‘didn’t see any disruption’ on set following Chad Feehan’s exit from Yellowstone spinoff fueled by Taylor Sheridan clash rumors
-

 NewsBeat6 days ago
El Nino has formed in the Pacific and could set records, forecasters say
-

 Politics6 days ago
Politics Home | Healey Resignation Is “Colossal Failure Of Government”, Says Former Labour Defence Secretary
-
 Entertainment6 days ago
Donnie Wahlberg & More Heat Up Las Vegas at Circa’s Barry’s Downtown Prime
-
 Tech6 days ago
Opendoor Ends India Operations, Fueling a Bigger Conversation About AI and Outsourcing
-

 Politics6 days ago
Belfast burns, while Met chief points finger at Iran and Russia
-

 Sports6 days ago
First Time Since 1971: Australia Register Historic Low In ODI Cricket
-

 Business6 days ago
AT&T: Verizon's 27% Outperformance Sets Up A Solid Entry Point
-

 NewsBeat5 days ago
FBI searches office of Ohio voter registration group
-
 Tech5 days ago
Anthropic is spending $150M to embed 1,000 AI fellows inside nonprofits. No degree required.
-

 Politics6 days ago
Modi thanks Trump for wishes as US attacks Indian seafarers
-
 Entertainment5 days ago
‘The Pitt’s Fan-Favorite Doctor Confirms Noah Wyle Gave His Blessing to Return [Exclusive]
You must be logged in to post a comment Login