

Crypto World
Fixed Range Volume Profile (FRVP) Explained
The Fixed Range Volume Profile (FRVP) is a technical analysis tool that allows traders to spot where trading volume has concentrated within a chosen price range. It shows the trading volume traded at each price level. Traders read these levels to gauge market participation and to locate potential support and resistance levels. Higher-volume prices tend to mark stronger areas of interest.
The Fixed Range Volume Profile (FRVP) is a popular tool among traders as it provides a wide range of signals. However, its complex appearance can put some traders off. In this article, we’ll take a deep dive into the FRVP, how to use it in a trading strategy, and some common mistakes to avoid.
What Is Fixed Range Volume Profile (FRVP)?

The Fixed Range Volume Profile (FRVP) is an advanced tool that plays an important role in assessing market activity. It provides a comprehensive view of the market by shedding light on trading volume and price data over a specific period. Unlike traditional price-based indicators, the FRVP incorporates volume data, offering a deeper insight into market liquidity and supply and demand dynamics.
Most chart indicators measure market activity against time. The FRVP measures it against price instead. It groups the volume traded at each price level inside a fixed range. This shows where buyers and sellers were most active. Compared with other volume indicators that plot volume bar by bar, the FRVP reveals which prices mattered, not which moments. This makes imbalances between supply and demand more straightforward. A price with heavy volume saw strong participation. A price with light volume saw little.
The FRVP presents a distribution of trading activity, represented by horizontal bars at various price levels, typically from one key swing point to another (e.g. a swing high to a swing low). It shows areas of high and low activity and may help traders spot areas where the market has spent considerable time and where it traded through easily.
Traders anchor the FRVP between two swing points because that range captures one complete move. The profile then reflects only the volume traded during that leg. This keeps the analysis focused, rather than spread across the whole chart. Many traders bracket a trend leg, a range, or a sharp news-driven move. The result is a clearer read of where value built up inside that move.
How Fixed Range Volume Profile Works
So how does the Fixed Range Volume Profile work? The FVRP indicator measures volume at price across a range you define. You pick a start point and an end point on the chart. The indicator then adds up the volume traded at each price level and stacks the totals sideways. The longer the horizontal bar, the more volume changed hands at that price.
In trading, volume measures the total units traded over a given period. It signals how much interest sits behind a price move. High volume points to strong participation and an active market. Low volume points to weaker interest and a more passive one. The Fixed Range Volume Profile indicator takes that idea and ties it to price, not the clock.
This is where volume profile trading differs from standard volume bars. A tall bar shows a price where the market was active. This reflects acceptance, a core idea in auction market theory and price discovery. A short bar shows a price the market passed through fast. Acceptance builds value. Rejection moves price on. Reading the two together shows where business was actually done.
The calculation runs in four steps:
- Select the range. You mark a start and end point, usually a swing high to a swing low.
- Split the range into rows. The tool divides the price range into thin horizontal bands.
- Allocate the volume. It assigns the volume from each bar to the price rows it covers.
- Plot the profile. It draws the totals as a sideways histogram showing volume by price.
The result locks to the move you chose. Scrolling or zooming the chart does not change it.
Components of FRVP
The Fixed Range Volume Profile can be broken down into several key components. Each one marks a different type of price behaviour inside your selected range. Read together, they show where the market built value and where it moved on. These definitions follow standard volume profile methodology used across charting platforms.
Point of Control (POC)
The Point of Control (POC) is the price level with the highest traded volume within the selected range. The POC can be considered as the price level where the market found the most acceptance and is usually plotted as a red line. It is often the most watched level in the whole profile. Traders treat the POC as a balance point. Price tends to return to it over time. That makes the POC a level where support or resistance can form.
Value Area
The Value Area represents the price range where a specified percentage of total volume has occurred, typically 70%. It demonstrates the levels at which most trading activity has transpired. The upper boundary is the Value Area High (VAH). The lower boundary is the Value Area Low (VAL). Traders treat the VAH and VAL as the boundaries of fair value. Price inside the Value Area points to balance. A move beyond either edge can signal the market is seeking new value. Both edges often draw reactions when price tests them.
High Volume Nodes (HVN)
A High Volume Node (HVN) represents a peak in volume at a price level. It marks a price the market accepted and traded heavily. HVNs often act as strong support and resistance, as price tends to slow around them. Several HVNs can sit close together to form a wider zone of interest.
Low Volume Nodes (LVN)
A Low Volume Node (LVN) represents a trough in volume at a price level. It marks a price the market rejected and moved through quickly. Price tends to travel fast across LVNs toward the next HVN. These thin zones often highlight potential breakpoints in a move.
Both nodes play key roles in volume profile analysis. With the POC, they give traders reference points for reading market structure.
FRVP Applications in Market Analysis
Now that we’ve answered, ‘What is the Fixed Range Volume Profile?’, let’s take a look at three ways to incorporate the indicator into a strategy. The tool is rarely used on its own. A sound Fixed Range Volume Profile strategy combines it with price action and risk management. The profile shows where volume sits. Price action confirms how the market reacts there.
If you’d like to see how it works for yourself, you can consider heading over to FXOpen’s TickTrader platform and test the Fixed Range Volume Profile.
Identifying Trend Continuation with FRVP

One of the most common applications of the Fixed Range Volume Profile is its use in gauging market trends. The interaction of price with high and low-volume areas can give valuable insights into market sentiment.
When analysing market trends using the FRVP, traders first pay close attention to areas of low volume, or LVNs. These areas, characterised by limited trading activity, often suggest an imbalance between supply and demand where the market moved rapidly. As such, they create a price gap or vacuum in the profile.
In the markets, these low-volume gaps are likely to be filled over time. An asset’s price usually tends to move quickly through these areas in search of the next area of value, represented by HVNs. As such, LVNs can act as powerful directional indicators, pointing to the potential for swift price movements, either upward or downward, to reach the next HVN, where market acceptance is greater.
This is the core of HVN and LVN trading: price tends to travel from one value area to the next. It moves fast through thin LVN zones and slows at dense HVN ones. In a bullish case, price clears an LVN and runs up toward a higher HVN. In a bearish case, it drops through an LVN toward a lower HVN. Traders watching for trend continuation often note a few things:
- Where the nearest LVN sits relative to current price
- Which HVN is the likely target once the LVN is crossed
- Whether the wider trend agrees with that direction
- How price behaves on the first test of the HVN
HVNs and LVNs as Support and Resistance Zones
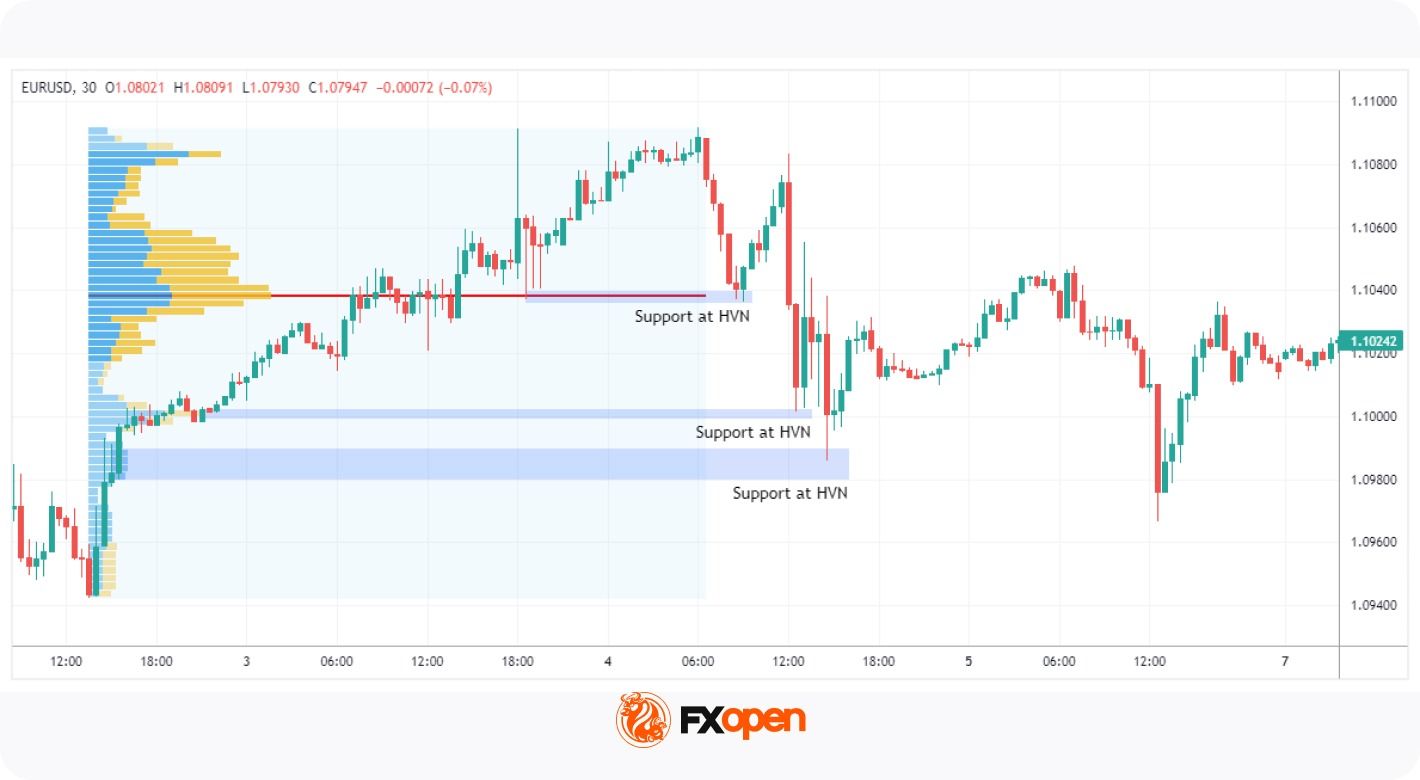
The FRVP can be an invaluable tool in identifying support and resistance levels. HVNs often indicate levels of strong support or resistance as they reflect periods where a significant amount of trading has occurred. These are areas where the market has shown acceptance, often making them difficult to breach.
Conversely, LVNs, with their relatively lower trading activity, often highlight potential breakpoints. Because these are levels at which the market has shown rejection. They are less likely to act as strong support or resistance areas, and the price is more likely to pass through them more quickly.
The split comes down to acceptance versus rejection. Where the market accepted price, volume built up and a zone holds. Where it rejected price, volume stayed thin and the zone gives way. Using the Fixed Range Volume Profile for support and resistance rests on reading that difference. The table below summarises how the two nodes tend to behave.
Therefore, traders can use HVNs and LVNs as a basis to establish potential entry and exit points in their trading strategies. For example, a trader may consider entering a long position when the price breaks above an HVN (an area of resistance). Similarly, an LVN above the current price might be a good target for this long trade, as the price could rise quickly to this level.
Point of Control (POC) in Market Analysis
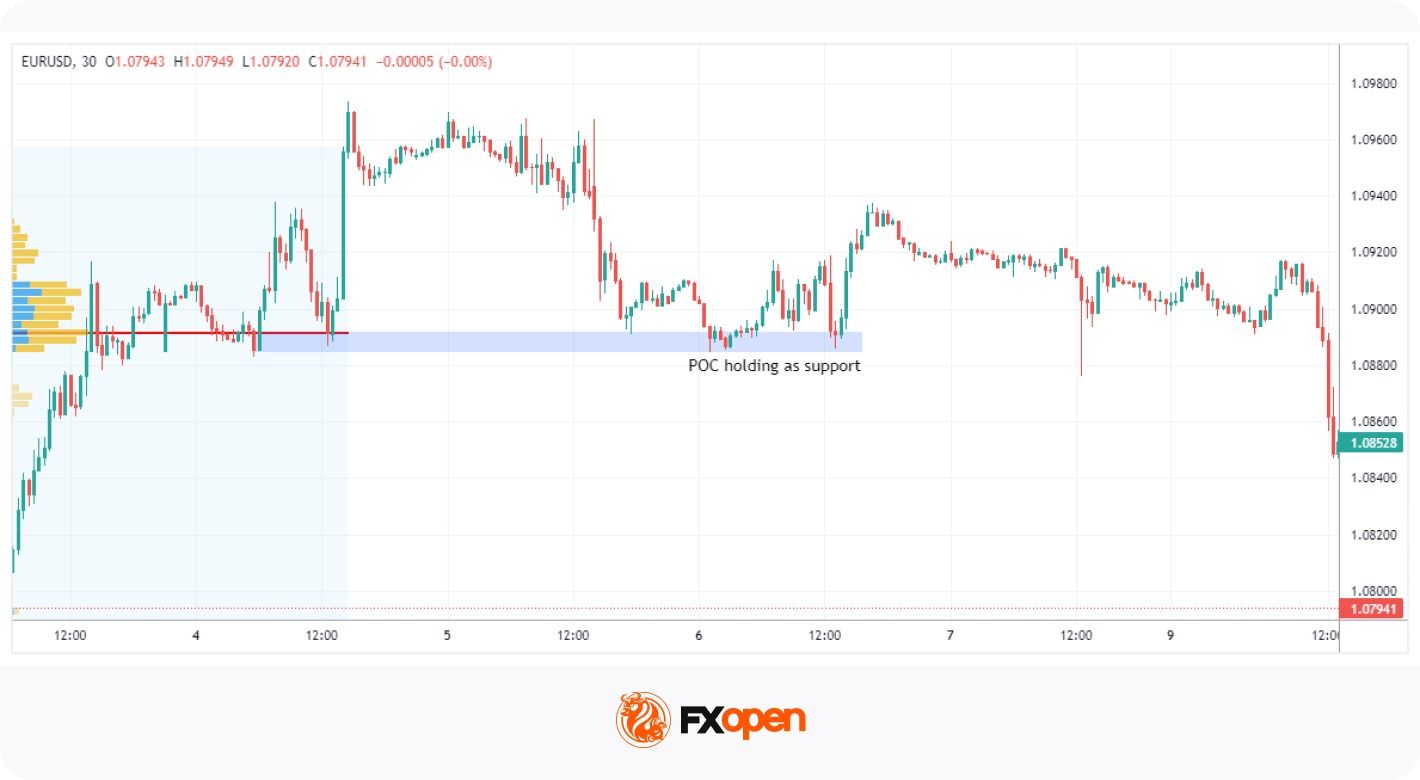
In addition to HVNs and LVNs, the Point of Control (POC) is another widely used element within the Fixed Range Volume Profile. Price often revisits the POC because it marks the range’s balance point. It is where the most business was done, so the market treats it as fair value.
In an upward-trending market, the POC often acts as a support level, where buyers may enter or add to long positions, expecting the price to bounce back upwards. Conversely, in a downward-trending market, the POC can serve as a resistance level, where sellers might consider short positions, anticipating market rejection.
In a broader Fixed Range Volume Profile strategy, traders often look at:
- Whether price stalls or pushes straight through the POC
- How volume behaves as price returns to the level
- Where the POC sits against the wider price action
Fixed Range Volume Profile vs Session Volume Profile vs Visible Range
The Fixed Range Volume Profile is one of three common volume profile types. The other two are the Session Volume Profile and the Visible Range Volume Profile (VRVP). All three plot volumes by price. They differ in how the range is set.
The Fixed Range Volume Profile vs Session Profile vs Visible Range Volume Profile question comes down to control. With FRVP, you pick the start and end points by hand. The profile then stays locked to that move. The Session Volume Profile sets its own range. It resets automatically at the open of each trading session. The Visible Range Volume Profile uses whatever bars are on screen. It redraws as you scroll or zoom.
Traders pick the tool to match the question. FRVP is used for a completed move traders want to study closely. The Session Volume Profile is popular for intraday work, where each day’s value matters. The Visible Range Volume Profile is applied for a fast read of the wider chart. Many traders run more than one together. A fixed range over a key leg, paired with the current session, can give context that neither offers alone.
Selecting the Range for FRVP Analysis
The range you choose shapes everything the FRVP shows you. The same chart can produce different profiles depending on where you start and finish. So the choice of range is the important decision when using the tool. A well-chosen range captures one clean phase of market activity. A poorly chosen one mixes unrelated moves and blurs the read.
Most traders anchor the profile between two clear points. A swing high to a swing low is the common choice, as it brackets a single move. This ties the profile to a defined piece of market structure rather than an arbitrary stretch of chart.
Several range types tend to suit the tool:
- Trend legs: a single push from one swing point to the next, to see where volume built during the move.
- Consolidations: a sideways range or period of consolidation, to find the levels the market kept returning to.
- News-driven moves: a sharp reaction to an event, to map where volume settled once the move calmed.
- Swing ranges: a full swing from high to low, often used alongside a swing trading approach.
Because the output depends on the input, two traders can read the same chart differently. One brackets the whole trend. Another brackets only the latest leg. Both profiles are valid, but they answer different questions. Many traders test a few ranges over the same area. They look for levels that hold up across more than one selection, since those tend to carry more weight.
FRVP Example: Analysing a Market Range
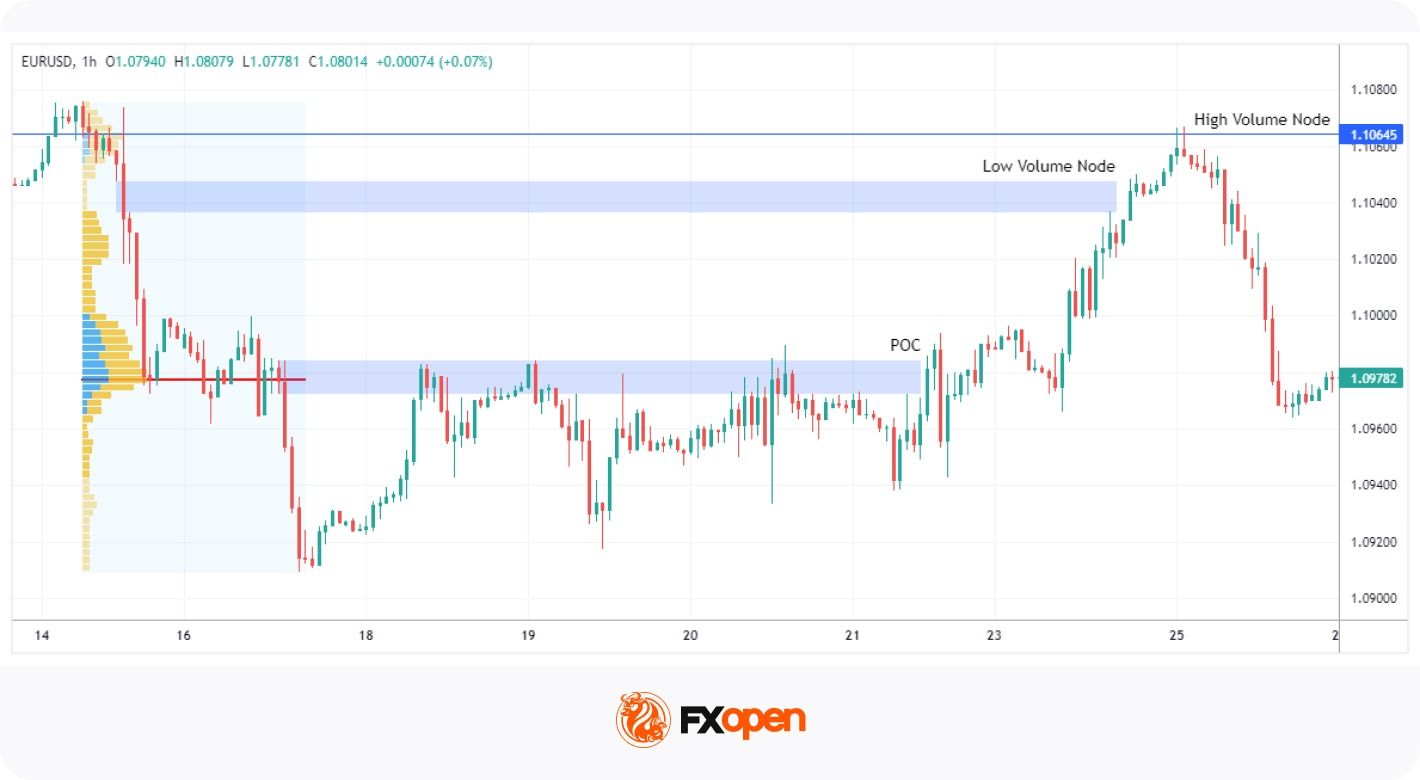
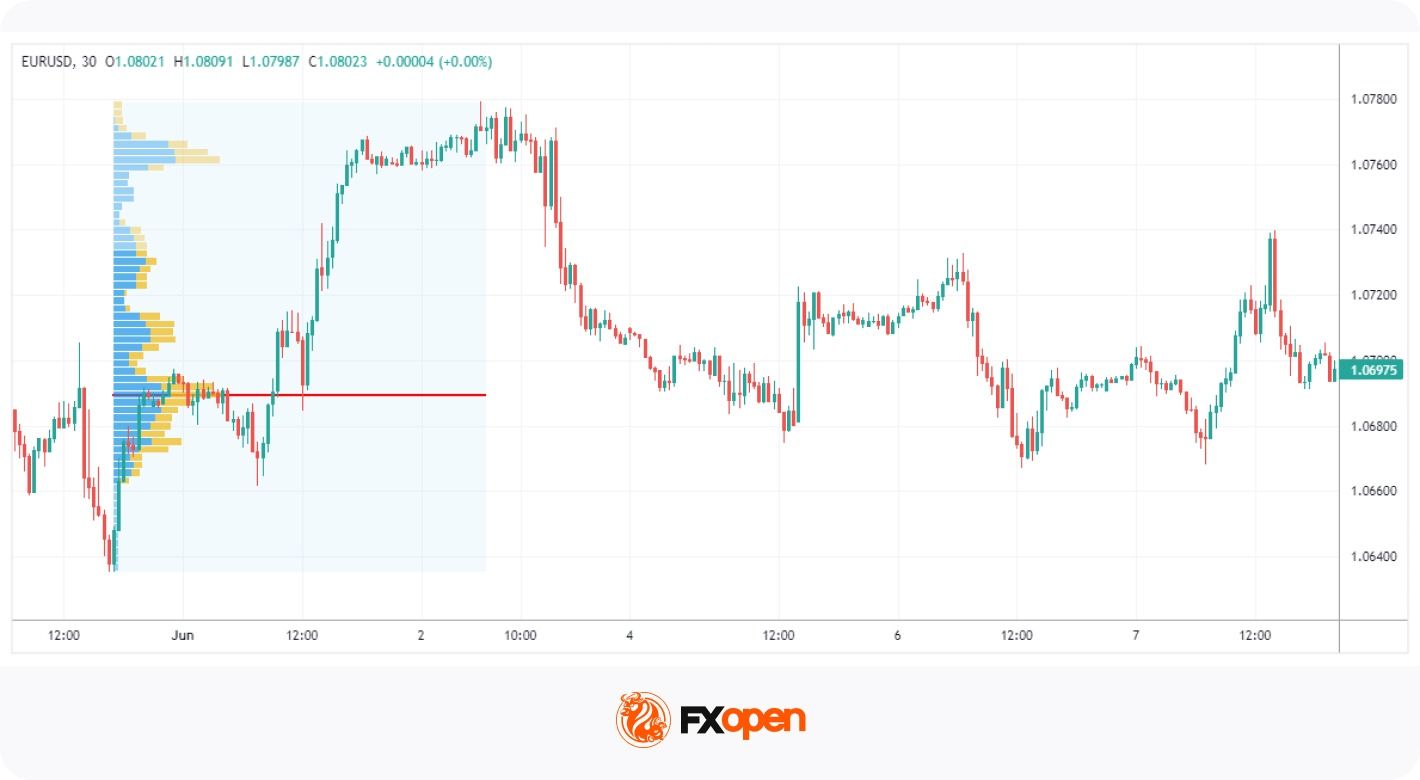
In this example, we see the market cooling off after a prolonged uptrend to the left (finishing just on the edge of the chart). The price fell sharply, finding a bottom. Given the distinct high and low points, the FRVP tool is set to those two points. The walkthrough below breaks the move into five steps.
- Set the range. With clear high and low points in place, the profile is anchored from the swing high to the swing low. This brackets the full move for analysis.
- Read the POC. The first area to notice is the POC, which acted as strong resistance within the multi-day range. Traders could have anticipated this area to hold, using other forms of technical analysis to find entries on a lower timeframe.
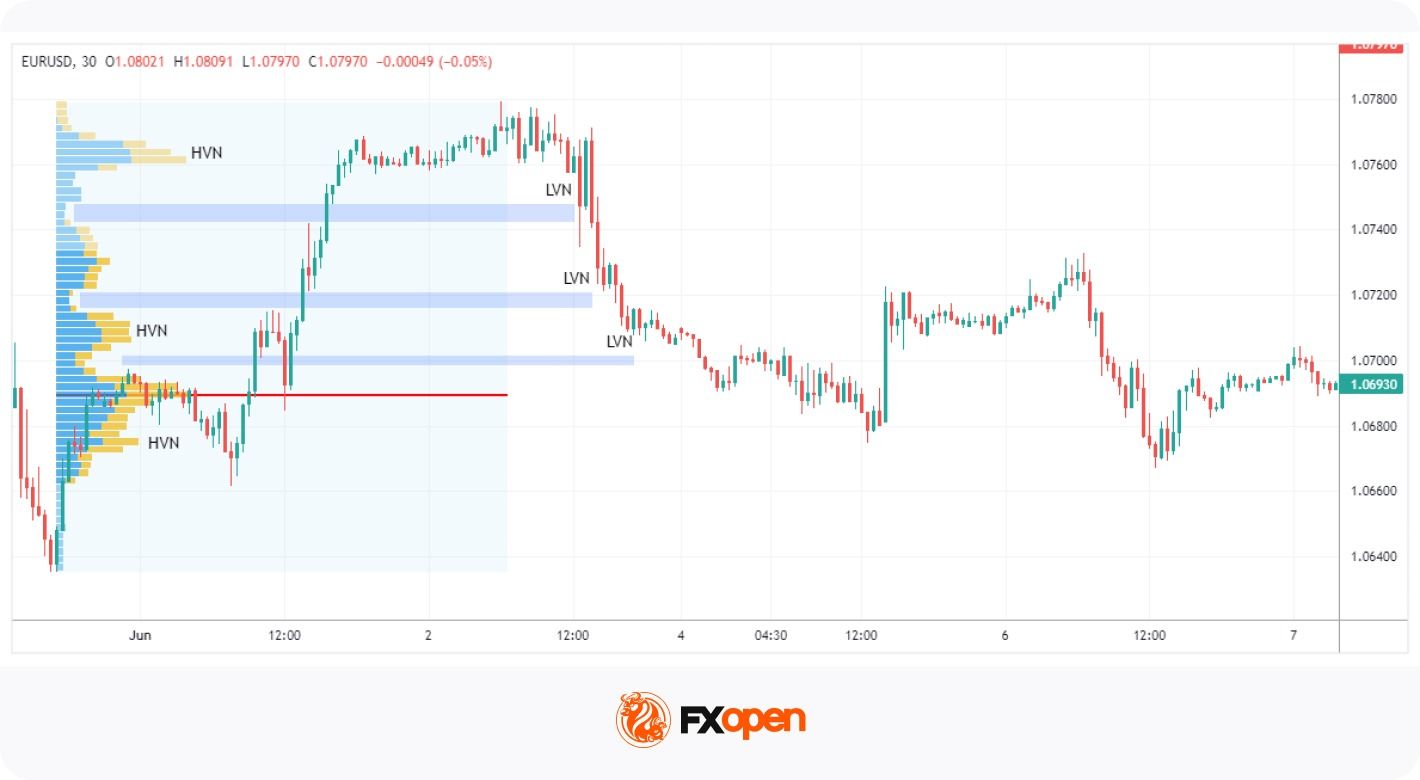
- Mark the LVN target. The POC area was eventually pierced through, indicating that it may be time for the price to come and meet the LVN toward the top of the range. This level represented the area with the lowest volume in the entire range. Combined with the prior bullishness offscreen, traders could have been confident that the price would at least reach this area, acting as a solid target if they had bought earlier near the POC.
- Watch the HVN reaction. However, it moved higher to tap the HVN (blue line). Notice that it’s the area with the highest volume besides the POC. After reaching the HVN, the price quickly reversed.
- Confirm the turn. Similar to the POC, traders could have anticipated bearishness from this area. The shooting star pattern here acted as confirmation.
Common FRVP Mistakes
So what are the common mistakes many traders make when using the Fixed Range Volume Profile indicator? The list below covers the ones that catch traders out most often.
- Misreading volume nodes: Traders may assume all HVNs or LVNs carry equal weight. Their importance shifts with the broader market context, so strong bullishness can see an HVN traded straight through.
- Ignoring other indicators: Relying on the FRVP alone makes for a one-dimensional approach. A sound strategy pairs it with tools that confirm reversals, like the Relative Strength Index (RSI) or MACD.
- Over-relying on historical data: The FRVP maps past activity, not future moves. Fundamental drivers still matter and belong in the analysis.
- Selecting the wrong range: A poorly chosen range mixes unrelated moves and distorts the profile. The levels it produces then carry little meaning.
- Ignoring higher timeframes: A profile read in isolation can clash with the wider trend. Checking a higher timeframe gives needed context.
- Treating nodes as exact prices: HVNs and LVNs mark zones, not precise lines. Expecting prices to turn at a single level often disappoints.
- Skipping risk management: Using the FRVP without risk management leaves a strategy exposed when a level fails to hold.
Advantages and Limitations of FRVP
Like any tool, the FRVP indicator has clear strengths and real limits. Knowing both may help traders use it in the right place. It reads volume well, but it does not act as a standalone system.
On the plus side, the volume profile indicator shows where genuine activity occurred, not just when. It ties volume directly to price, which standard volume bars cannot do. It also locks to a chosen move, so the analysis stays focused. That makes it useful for marking support, resistance and likely target zones.
The limits matter just as much. The FRVP reflects past activity, so it offers no guarantee about future moves. Its output depends entirely on the range you select, which adds a layer of judgement. On forex charts, the volume shown is often tick volume rather than true traded volume. And the tool is always combined with other forms of analysis.
Key Takeaways
The Fixed Range Volume Profile may help traders analyse where trading activity was concentrated within a selected price range. By highlighting key areas such as the Point of Control, Value Area, High Volume Nodes, and Low Volume Nodes, it provides additional context on where the market found acceptance or rejection.
Like any technical tool, the FRVP is commonly used alongside price action analysis, market structure, and risk management. Since the profile’s output depends heavily on the range selected, traders typically take care to choose ranges that reflect meaningful market swings or trading sessions.
With an understanding of how to use the FRVP indicator, you might consider opening a trading account with FXOpen to access over 700 markets across forex and CFDs.
FAQ
What Is Fixed Range Volume Profile (FRVP)?
Fixed Range Volume Profile (FRVP) is a volume analysis tool that displays how much trading activity occurred at different price levels within a user-defined range. Instead of focusing on volume over time, it organises volume by price, which may help traders identify areas where the market spent the most and least effort transacting.
What Does the Point of Control Mean in FRVP?
The Point of Control (POC) is the price level that recorded the highest trading volume within the selected range. Traders often monitor the POC because it can represent a key area of market acceptance, where buyers and sellers were most active, and where price may later find support, resistance, or balance.
What Are HVNs and LVNs?
High Volume Nodes (HVNs) are price levels where a large amount of trading occurred, often indicating areas of market acceptance and potential support or resistance. Low Volume Nodes (LVNs) are levels with relatively little trading activity and may represent zones of rejection where price can move through more quickly.
How Is FRVP Different From Session Volume Profile?
The main difference is that FRVP analyses a manually selected price range, allowing traders to focus on specific market swings, consolidations, or trends. Session Volume Profile, by contrast, automatically calculates volume distribution for predefined trading sessions without requiring manual range selection.
Can FRVP Identify Support and Resistance Levels?
Many traders use FRVP to identify potential support and resistance areas. High Volume Nodes and the Point of Control often highlight prices where significant trading activity occurred, which can attract future market interest. However, these levels are not guaranteed to hold and are typically assessed alongside other forms of technical analysis.
What Is the Value Area in a Volume Profile?
The Value Area is the range of prices that contains approximately 70% of the total traded volume within the selected profile. It is bounded by the Value Area High (VAH) and Value Area Low (VAL). Traders often use these levels to assess whether price is trading in an area of perceived value or moving beyond it.
Which Markets Can FRVP Be Used On?
FRVP can be applied to a wide range of markets, including forex and CFDs. The tool is particularly popular among traders who analyse market structure and volume distribution, as it may help highlight areas where significant trading activity has taken place.
This article represents the opinion of the Companies operating under the FXOpen brand only. It is not to be construed as an offer, solicitation, or recommendation with respect to products and services provided by the Companies operating under the FXOpen brand, nor is it to be considered financial advice.

Inveniam Capital Partners has announced plans to acquire layer-1 blockchain Mantra and affiliated entities, signaling a deeper move into infrastructure tied to tokenized real-world assets (RWAs). The deal builds on Inveniam’s prior commitment to the network, after the firm made a $20 million strategic investment in Mantra in August 2025, according to the company’s Tuesday announcement.
The acquisition also follows Inveniam’s rollout of NVNM Chain, a Mantra-based layer-2 network launched on May 13. NVNM Chain is positioned to help verify assets while avoiding exposure of confidential information—an approach that aligns with the broader push to make RWA workflows more audit-friendly without compromising privacy.
Key takeaways
- Inveniam Capital Partners will acquire Mantra and affiliated entities, deepening its involvement in RWA-focused blockchain infrastructure.
- The transaction follows Inveniam’s $20 million strategic investment in Mantra in August 2025.
- Inveniam earlier launched NVNM Chain (May 13), a layer-2 designed for asset verification while preserving confidentiality.
- The deal reflects an effort to connect tokenized real-world asset rails with AI-ready, regulated private-market data.
- Mantra has recently faced severe market turbulence around its OM token, including a sharp drawdown in April 2025.
Why the Mantra acquisition matters to RWA infrastructure
Mantra’s pitch has centered on enabling RWAs to move with blockchain-based verification while addressing one of the biggest practical constraints in tokenization: how to prove claims about real-world assets without disclosing sensitive information. NVNM Chain, launched on May 13, is framed specifically around that tradeoff, supporting asset verification without revealing confidential data.
For Inveniam, acquiring the layer-1 and associated entities suggests it wants more direct control over the technical and operational foundations behind that privacy-preserving verification model. The company says this is part of an effort to accelerate delivery of “digital private markets” capabilities to broader market participants—particularly those operating in institutional and regulated contexts where compliance requirements tend to be strict.
Strategic investment precedes NVNM Chain rollout
Inveniam’s latest move did not arrive out of nowhere. In August 2025, the firm made a $20 million strategic investment in Mantra, and it later launched NVNM Chain on May 13. In its announcement, Inveniam’s leadership tied these steps together, describing the initial investment as a bet that regulated blockchain infrastructure and AI-ready private market data would need to be integrated.
According to chairman and CEO Patrick O’Meara, the acquisition is intended to expand Inveniam’s role in private-market ecosystems. “This acquisition positions us to be value-additive to the global private markets ecosystem faster,” O’Meara said. He added that the aim is to enable market operators, asset owners, and institutional private-market investors to access “digital private markets” alongside DeFi-oriented markets.
From an investor and developer standpoint, that linkage between private-market data readiness and blockchain rails is a key part of the narrative. It also highlights what Inveniam appears to be targeting: not just token issuance, but end-to-end infrastructure that can support verification workflows while remaining compatible with institutional expectations.
A turbulent stretch for Mantra and its OM token
While the acquisition represents a push deeper into infrastructure, Mantra’s recent history includes notable volatility. Earlier in the year, the company announced layoffs and restructuring after what CEO John Patrick Mullin described as the most challenging year in its history, following the collapse of the OM token and continued market pressure.
On April 13, 2025, the Mantra (OM) token suffered a steep decline. According to CoinMarketCap data, OM fell by about 90% within hours, wiping out more than $5 billion in market capitalization, the platform reported.
In a post on X, Mullin argued that the drop was driven by centralized exchange behavior rather than internal selling. He blamed “reckless forced closures initiated by centralized exchanges on OM account holders.” He also clarified that the dislocation was not caused by the team, the MANTRA Chain Association, core advisors, or investors selling tokens, adding that tokens “remain locked and subject to the published vesting periods.”
That backdrop matters for readers because it frames the risk environment surrounding Mantra—even if the company’s longer-term infrastructure goals are now moving forward under new ownership. It also suggests that any future progress will likely be judged not only by technical milestones like NVNM Chain, but by how stakeholders regain confidence after periods of disruption.
Cointelegraph asked Mantra for deal details
Cointelegraph reached out to Mantra for additional details about the acquisition, but had not received a response by publication. As a result, readers should watch for further clarification on the structure and timeline of the transaction, along with any changes to governance, development priorities, or how Inveniam plans to integrate NVNM Chain and the underlying Mantra infrastructure.
More broadly, the move reflects a continuing trend in crypto infrastructure: firms looking beyond trading networks toward the data and verification layers needed for RWAs, and increasingly tying those efforts to privacy and AI-readiness. With Inveniam now seeking full ownership of the ecosystem it previously funded, the next signals to monitor will be whether technical verification advances translate into sustained adoption and whether market confidence stabilizes after earlier volatility.
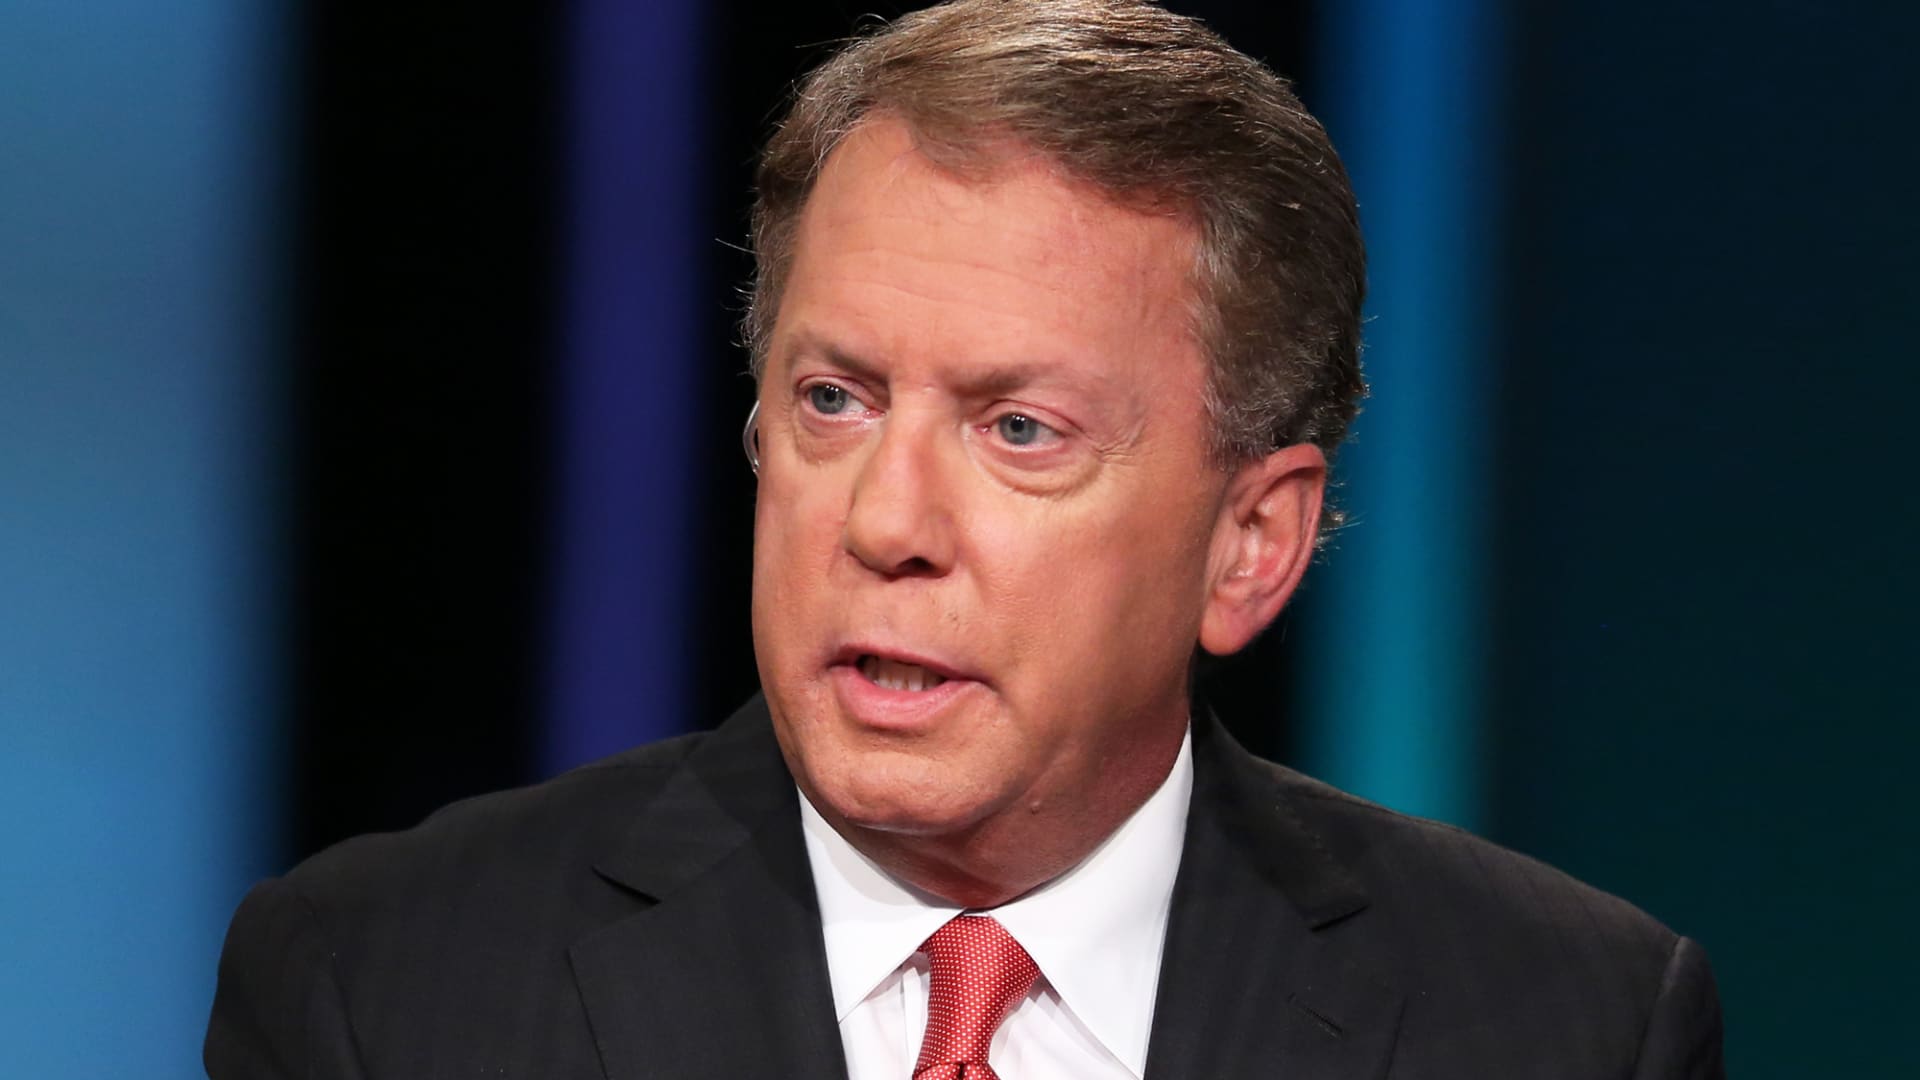
Terry Duffy, CME Group
Scott Mlyn | CNBC
CME Group‘s longtime leader Terry Duffy will step down as chief executive officer next year, succeeded by President and Chief Financial Officer Lynne Fitzpatrick.
Duffy, 67, will transition to executive chairman effective March 1, 2027, the company said Wednesday. It marks a more than two-decade run that transformed the Chicago-based exchange operator into one of the world’s largest derivatives marketplaces.
“Leading CME Group through more than 25 years of transformative growth has been among the highest honors of my life,” said Duffy in a statement.
Since becoming chairman in 2002, Duffy has overseen CME’s transformation from a floor-based exchange into a global derivatives powerhouse. He led the company’s IPO, its shift to electronic trading and industry-defining acquisitions, including the 2007 merger with the Chicago Board of Trade and the 2008 purchase of the New York Mercantile Exchange.
Duffy also guided CME through the financial crisis, the collapse of broker-dealer MF Global and sweeping changes in market structure. More recently, the company expanded through its acquisition of NEX Group, a partnership with Google Cloud and a venture with FanDuel aimed at reaching a broader retail audience.
Fitzpatrick, a 20-year veteran of CME, has served as president and chief financial officer since 2022 and has played a key role in the company’s strategy, capital allocation and investor relations efforts.
“I appreciate the confidence that he and the Board have placed in me, and I look forward to working with our investors, clients and employees around the world as we grow our core business and create value for our shareholders,” Fitzpatrick said in a statement.
Correction: CME Group made the announcement Wednesday. An earlier version misstated the day of the week.
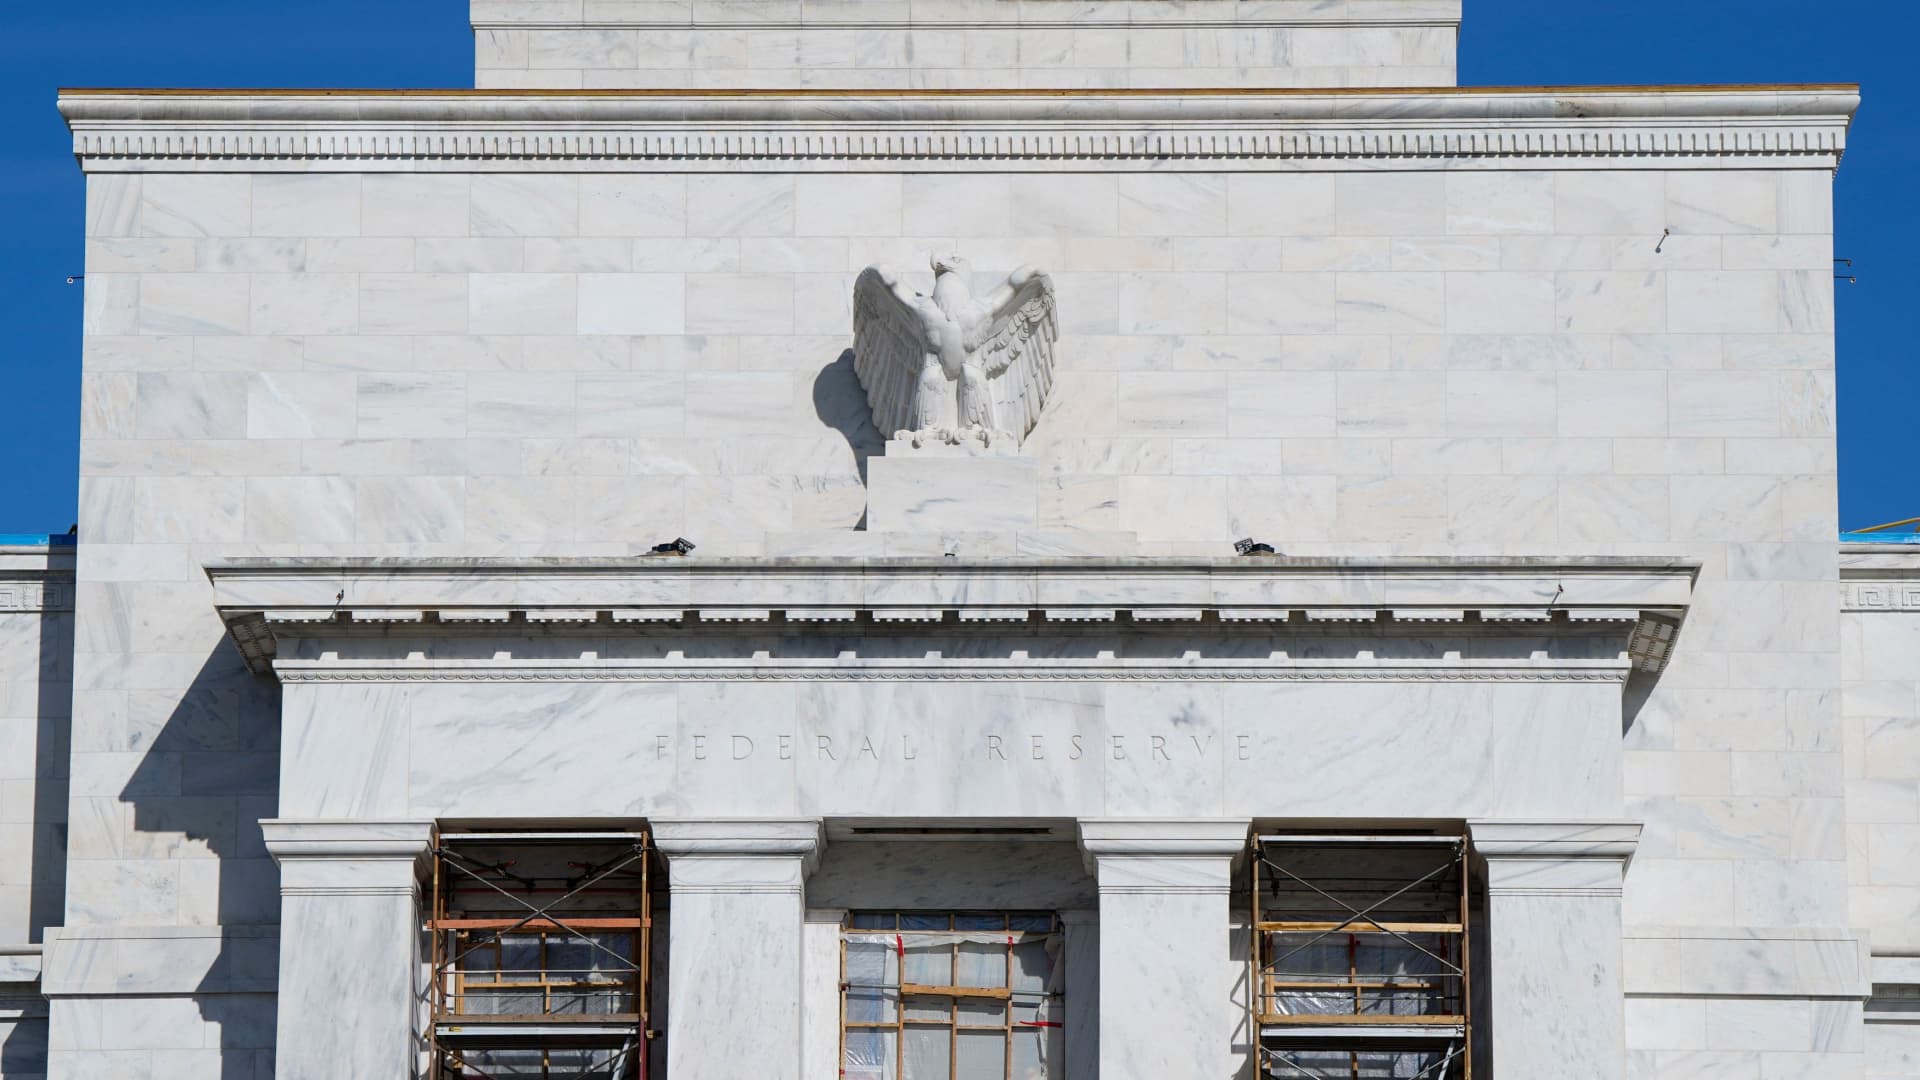
Renovations continue at the Federal Reserve Board building in Washington, D.C., U.S., November 14, 2025.
Elizabeth Frantz | Reuters
Prediction market traders think consensus will return to the Federal Reserve’s policy-setting board when new chairman Kevin Warsh presides over its June interest rate decision later Wednesday. At April’s meeting, the last under former Fed chair Jerome Powell, four members voted to dissent from policy, the most in more than 30 years.
Traders on prediction market platform Kalshi place 70% odds on zero dissents in the June vote on the 12-member Federal Open Market Committee. Odds that four members will dissents, as in April, are at just 3%.
The Fed is widely expected to hold interest rates steady on Wednesday at their current 3.50% to 3.75%, as policymakers continue to assess the extent of rising inflation due to higher oil prices stemming from the U.S.-Iran war.
At the April meeting, the Fed also held rates steady, and only one dissent disagreed with that decision. That vote was cast by now former Fed governor Stephen Miran, who consistently argued for lower interest rates.
The other three dissenters — Fed regional presidents Beth Hammack of Cleveland, Neil Kashkari of Minneapolis and Lorie Logan of Dallas — were opposed to language that hinted the central bank may cut interest rates in the future. That showed some members were worried the committee was too dovish in its outlook, and objected to signaling lower rates were coming.
More than half, or 55% of respondents in Bank of America’s June Global Fund Manager Survey said the Fed will deliver a “hawkish hold” on Wednesday.
When Warsh holds his first press conference as chairman, traders think there’s a 73% chance he’ll discuss “uncertainty,” a 43% chance he’ll mention “quantitative tightening,” and just a 20% chance he refers to President Donald Trump by name.
Correction: This story has been revised to accurately reflect the titles of Beth Hammack, Neil Kashkari and Lorie Logan. A previous version of this story misstated that they were Fed governors.
Crypto World
Startup drops first universal AI agent payment plug into Asia’s $28.9 trillion ecommerce market


Many experts share Bilotta’s AI agent outlook, including Charles Hoskinson, founder and CEO of Cardano’s Input Output, who said that by 2035 they will become more relevant than humans.
The macro numbers support his stance. Data from the U.S. International Trade Administration via Trade.gov shows that business-to-business (B2B) e-commerce across the broader Asia-Pacific region is expanding at a 15% annual clip, with market values projected to climb past $28.9 trillion by the end of this year.
Yet, despite that explosive growth, the plumbing underneath remains broken. The problem is fundamentally an issue of legacy infrastructure and compliance, Bilotta noted.
Global financial regulations, banking protocols and identity verification checks were built strictly for humans. An autonomous AI software agent cannot pass a standard compliance check, he said or execute a payment loop unless a human manually intervenes to clear the transaction.
To bridge this structural gap, the industry requires a compliant backend middleware that acts as a universal interpreter. Bilotta explained that by dropping an Anthropic-standard Model Context Protocol (MCP) server directly into the payment infrastructure, software agents can programmatically navigate compliance, pull real-time FX quotes, and settle transactions natively across borders without human steps.
While institutional gatekeepers like Stripe and Mastercard have spent billions acquiring fiat-to-crypto APIs to secure traditional corporate treasuries, the automated machine-to-machine economy across emerging corridors remains heavily underserved.


Bitcoin is facing selling pressure ahead of today’s Federal Open Market Committee (FOMC) interest-rate decision at the first meeting under new Fed Chair Kevin Warsh.
The largest cryptocurrency pulled back below $65,000 after trading near $67,000 just a day earlier, CoinDesk data show. The broader market CoinDesk 20 Index (CD200) has lost 1.2% since midnight UTC, with all but four tokens declining.
“The main focus for the week is the FOMC meeting under new leadership, with market expectations of interest rate hikes already priced in through 2027,” Laser Digital said in its weekly note.
The market is pricing in no change in the fed funds rate at this meeting. Instead, the focus will be on Warsh’s post-meeting press conference for signals on his views on inflation. Warsh has criticized the Fed’s frequent press conferences and detailed forecasting and may face questions on his stance.
Among stand-out gainers, Uniswap’s UNI token surged another 20% over 24 hours, buoyed by Standard Chartered’s bullish forecast of $100 by 2030. Meanwhile, NEAR, INJ and several stablecoin-related assets dropped as much as 8%.
Derivatives positioning
- The market remains calm ahead of the Fed decision. Activity has slowed, with crypto futures volume falling 20% in 24 hours to $165 billion and open interest dropping 2.3% to $110 billion. Liquidations fell to roughly $310 million, down 44%.
- The calm is also evident in BVIV, bitcoin’s 30-day implied volatility index, which was hovering near an annualized 39% at the time of writing — a level not seen since June 2, just before it spiked to nearly 59% a few days later. Ether’s volatility index is showing similar stability.
- Cardano’s ADA stands out among altcoins. Open interest has climbed to 2.26 billion tokens, nearing the record 2.32 billion set on June 6 and recovering from the June 13 low of 2 billion.
- The rebound points to renewed capital deployment in leveraged ADA markets, though the move isn’t necessarily bullish. The token’s price has slipped from over 18 cents to under 17 cents in two days alongside a negative 24-hour cumulative volume delta. The combination leans bearish, pointing to aggressive trading at market orders rather than passive limit orders.
- ZEC and SUI are the other notable open interest gainers over the past 24 hours, while NEAR and BCH led the losers.
- NEAR has dropped over 9%, and the decline in open interest suggests traders are unwinding leverage during the selloff rather than piling into fresh shorts.
- Most major tokens, with the exception of TRX and CC, are showing negative 24-hour CVD, pointing to broad bearish dominance in trade flows.
- In options markets, BTC puts continue to dominate 24-hour volume rankings, though the $80,000 call expiring March 26 next year also saw notable activity. In ether’s case, calls are leading volume rankings.
Token talk
- UNI has risen for a seventh straight day, its longest winning streak since August 2023, when it ran eight. The token trades near $2.75, erasing its June losses after jumping by more than 10% earlier in the week.
- The accelerant was a Standard Chartered note. The bank’s digital assets head, Geoff Kendrick, initiated coverage on June 15 with a $100 price target for 2030, roughly 40 times the current level, arguing that tokenized real-world assets, meaning stocks and bonds issued onchain, will flood into DeFi and Uniswap will capture the flow as core market infrastructure. He predicts a path through $6.50 by year-end.
- Two fundamentals sit underneath the call. Uniswap’s fee switch, live since late 2025, routes a share of trading fees into buying back and burning UNI, and has removed about 106 million tokens, more than 10% of supply, turning a pure governance token into a deflationary one.
- Separately, tokenized stocks that launched on the protocol earlier this month have already seen more than $9.1 billion swapped through its real-world-asset pools.


The entire bitcoin market is worth about $1.2 trillion as of Wednesday. SpaceX, at $2.5 trillion, is worth nearly twice that, and it is drawing from the same risk budget that flows to crypto – the point ARK made earlier this week when it funded its SpaceX buying by selling other holdings.
The caution is that expectations now leave little room for error, with some analysts warning that a SpaceX stumble would hit the broader market and the AI winners with it.
“With the expectations already sky high, there is little room for error,” Lukman Otunuga, head of markets at FXTM, told CoinDesk in an email. “Should SpaceX disappoint down the line, the fallout will hit the broader stock market, as well as the beneficiaries of the AI boom.”
The numbers support that worry. SpaceX posted a $4.94 billion net loss in 2025 on $18.67 billion of revenue, and at $2.5 trillion, it trades at more than 130 times sales, a multiple some call meme-stock territory.
As such, SpaceX announced Tuesday that it has formally agreed to take over Cursor in a deal that values the AI coding startup at $60 billion. Cursor investors will have the right to receive SpaceX stock based on the implied equity value of Cursor, according to a company filing.
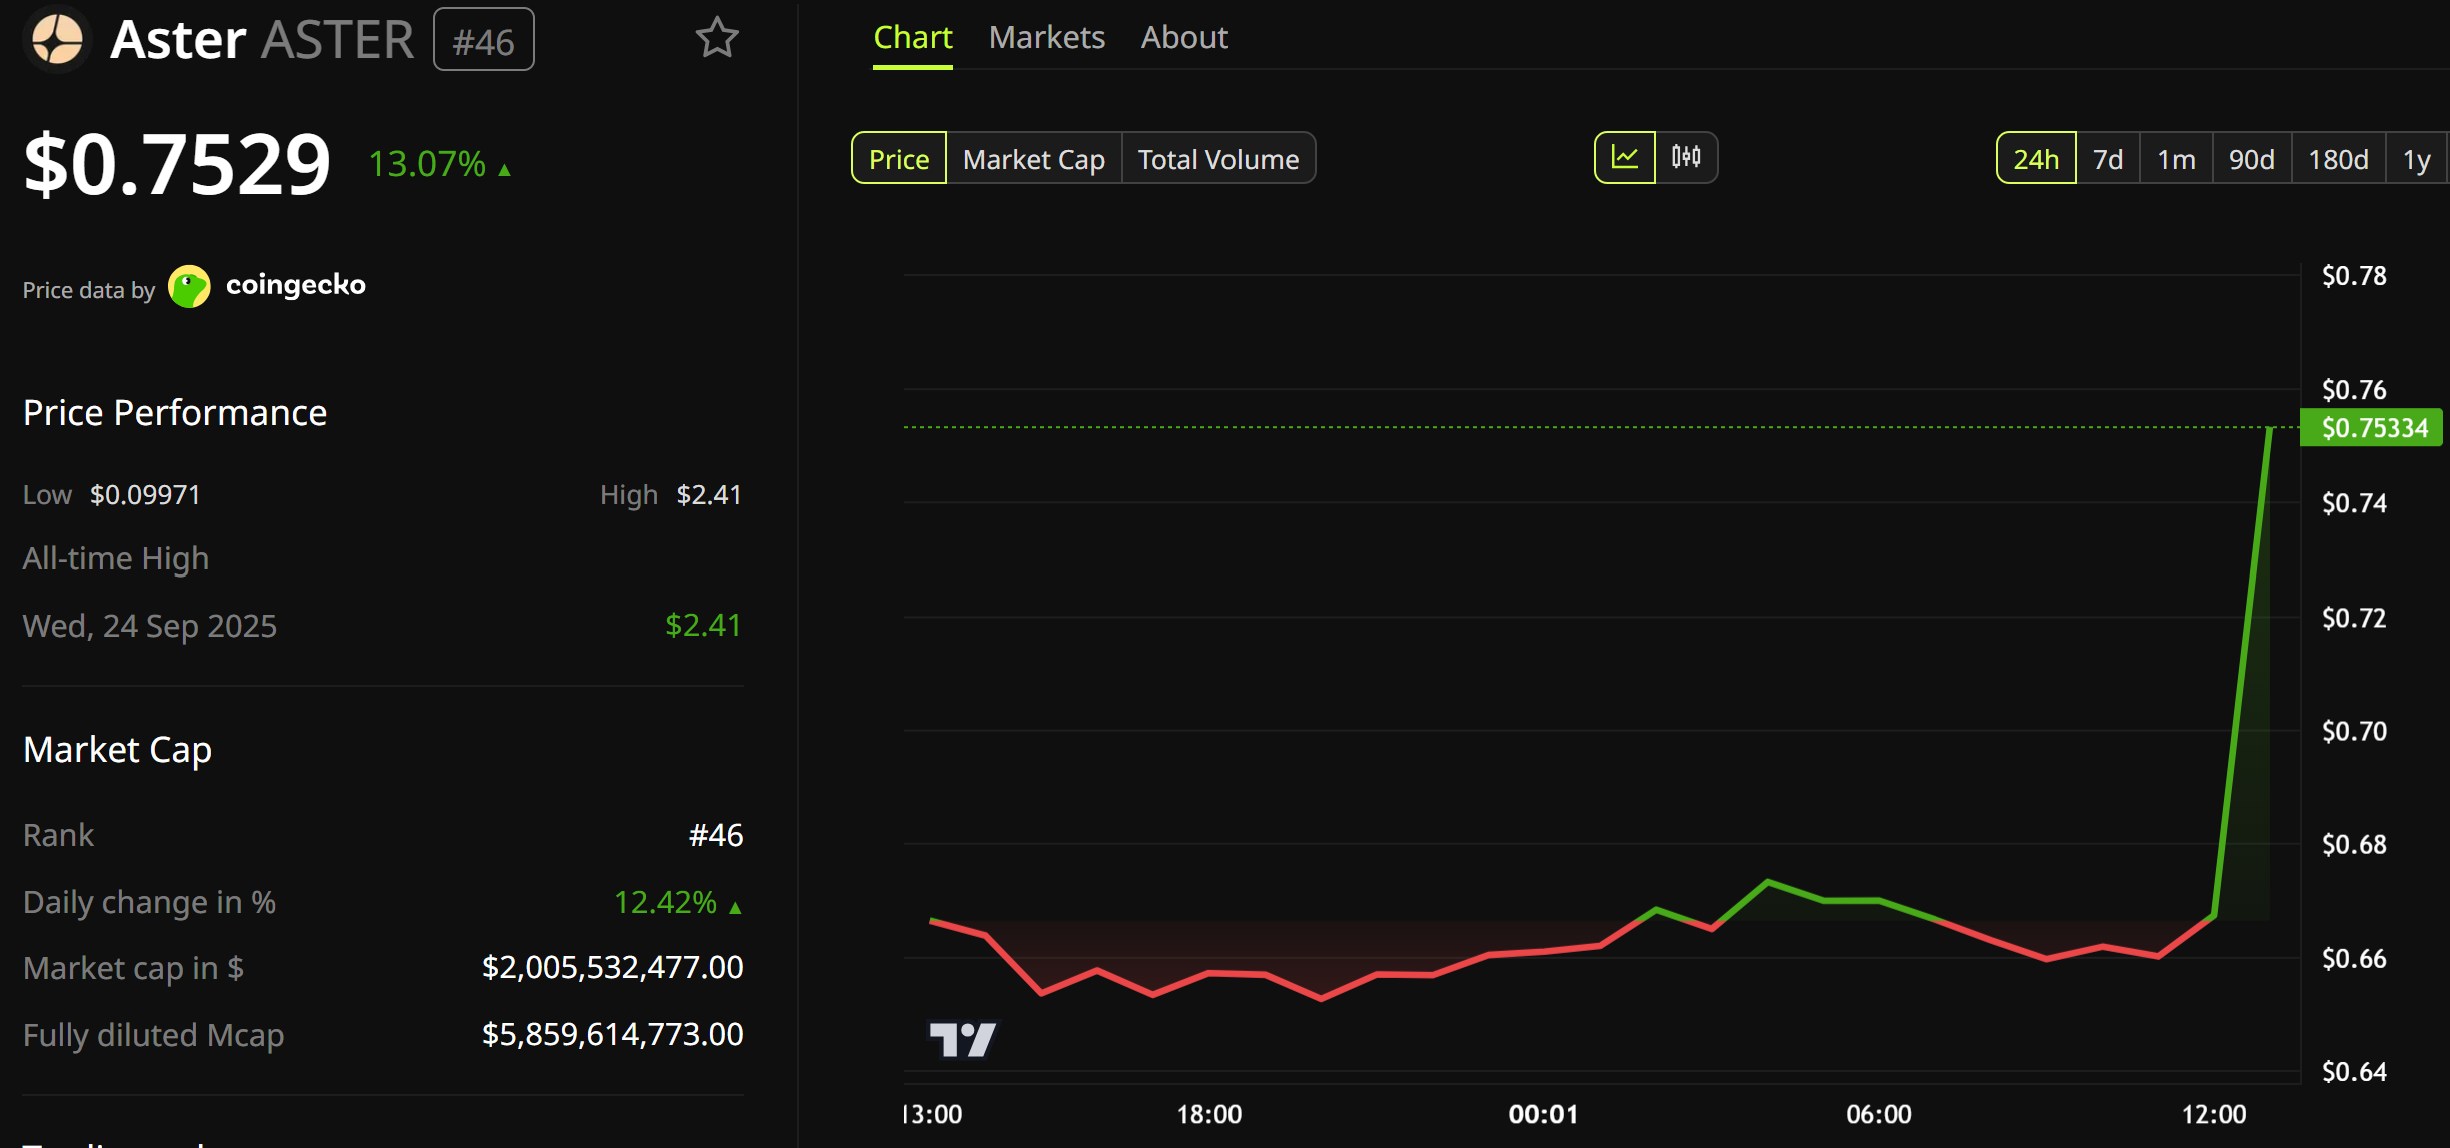
Aster DEX announced a sweeping tokenomics upgrade on June 17, 2026, directing 99% of daily platform fees into automatic $ASTER buybacks for veASTER stakers while triggering matching burns to slash total supply toward 3 billion.
The move intensifies an existing revenue-recycling strategy, tying token value directly to trading activity on one of the fastest-growing perpetual DEXes. ASTER token jumped by over 10% on this news.

Aggressive Fee-to-Buyback Mechanism
Under the new structure, 99% of Aster’s daily fees execute via TWAP across each day and settle on-chain to a public wallet (0xa0edBaBcb48034e368de286b49F9603C7AfA1b60).
All repurchased tokens flow straight into Loyalty Rewards, added atop the existing 300,000 $ASTER base pool and distributed proportionally to veASTER lock weight.
Follow us on X to get the latest news as it happens
For every token bought back, an equal amount is permanently burned from reserves—starting with team allocations.
Burns occur bi-weekly and continue until total supply hits the 3 billion target.
Permissionless Spot listings add further fuel: each incurs a 50,000 USDT fee routed into the same buyback system.
Current Supply Snapshot
Aster launched with an 8 billion total supply. As of June 17, 2026:
- Total Supply: ~7.82 billion
- Circulating Supply: ~2.68–2.70 billion
- Prior buybacks and burns have already removed tens of millions of tokens, with cumulative fee-generated buybacks previously exceeding hundreds of millions of dollars. coingecko.com
This upgrade escalates earlier phases that allocated 70–80% of fees, now pushing near-total revenue capture for holders.
Market Context and Investor Relevance
Perp DEX trading volumes remain robust amid broader crypto market recovery.
Aster has processed billions in cumulative volume and competes directly with leaders like Hyperliquid.
The 198% mechanism (99% buyback + 99% equivalent burn) creates a self-reinforcing loop: higher platform usage drives stronger buy pressure and accelerated deflation.
For investors, the update strengthens real-yield potential for stakers while capping long-term dilution.
Transparent, on-chain execution via verifiable wallets enhances credibility in a sector often criticized for opaque tokenomics.
The program runs continuously with bi-weekly burns. Sustained or growing trading volumes will determine the pace of supply reduction and reward boosts.
Aster continues expanding features, including potential L1 developments and governance enhancements, which could further amplify fee generation.
This upgrade positions $ASTER as one of the most aggressively aligned tokens in DeFi perp trading, directly rewarding usage and long-term holders as the platform scales.
The post Aster Expands its Token Buyback Program, Price Jumps 10% appeared first on BeInCrypto.

Key Takeaways
- Over 100 Chinese technology companies, including DeepSeek and CXMT, have avoided U.S. trade restrictions despite receiving security clearance for blacklisting.
- An interagency committee greenlit these companies for Entity List designation, but the Commerce Department hasn’t published the updates.
- The Entity List has seen no new additions since October—marking an unprecedented pause spanning more than ten years of enforcement history.
- Security officials identified DeepSeek as aiding Chinese military objectives and attempting to illegally obtain advanced American semiconductors.
- National security analysts caution that this administrative freeze could enable critical U.S. technology to fall into hostile hands.
The current administration has postponed the blacklisting of more than 100 Chinese corporations through the U.S. Commerce Department’s Entity List, Reuters has revealed. Among the companies awaiting designation are artificial intelligence developer DeepSeek and semiconductor manufacturer ChangXin Memory Technologies, both of which received interagency approval for restrictions but remain unlisted.
Inclusion on the Entity List triggers severe export limitations. American companies are prohibited from transferring products, software applications, or proprietary technology to designated entities without obtaining special government authorization, which authorities routinely reject.
This postponement appears connected to diplomatic strategies aimed at preventing escalation with China. Reports indicate that Jeffrey Kessler, the under secretary of commerce overseeing industry and security matters, has worked to suspend Chinese entity designations since the closing months of 2025.
DeepSeek captured international attention in January 2025 after launching an affordable AI system that sent shockwaves through the tech industry. According to a high-ranking State Department representative, the company has provided assistance to Chinese military and intelligence agencies while orchestrating efforts to procure cutting-edge American processors through intermediary corporations in Southeast Asia.
Anthropic disclosed earlier this year that it uncovered coordinated efforts by DeepSeek alongside two additional Chinese AI developers attempting to extract proprietary capabilities from its Claude AI system. OpenAI similarly alerted congressional members that DeepSeek was conducting operations against its technology platforms.
ChangXin Memory Technologies, representing China’s leading memory chip producer, received designation as a Chinese military-linked corporation by Pentagon officials during the previous Biden administration.
Record-Breaking Pause in Enforcement Actions
No fresh Entity List designations have appeared since October. According to Philip Luck from the Center for Strategic and International Studies, this represents an unprecedented enforcement gap exceeding anything witnessed in the past decade.
“The Entity List functions like whack-a-mole and you need to maintain constant vigilance,” Luck explained.
Kevin Kurland, previously with the Commerce Department, characterized the suspension as evidence that commercial considerations are eclipsing national security imperatives. “The absence of any Entity List additions since October clearly demonstrates that trade policy considerations are taking precedence over a vital national security instrument,” he stated.
No fewer than 75 Chinese organizations operating in semiconductor manufacturing, chip production equipment, and artificial intelligence development received approval for listing but await official publication.
Additional flagged entities include suppliers of components discovered in Russian unmanned aerial vehicles recovered in Poland last September, plus companies accused of distributing restricted Nvidia processors to Chinese educational institutions.
Commerce Bureau Remains Tight-Lipped on Publication Delays
The Bureau of Industry and Security has not provided substantive responses regarding the publication freeze, declining to address questions about DeepSeek and CXMT specifically.
The agency stated it employs “numerous policy and enforcement mechanisms, including the Entity List, throughout regular operations.”
Additionally, the bureau has failed to issue a successor regulation to the AI chip export controls established under President Biden, creating a potential regulatory void that may have permitted advanced processors to reach Chinese entities operating beyond China’s borders.


The world’s third-largest economy is reclassifying crypto as a financial instrument and charting a path to slash punishing tax rates. The change reaches far beyond Japan, and most of the coverage is getting the details wrong.
Summary
- Japan has taken a major step toward treating crypto like a mainstream financial asset.
- The 20% crypto tax rate is a target for 2028, not a change taking effect now.
- Reclassification under FIEA could open the door to regulated crypto ETFs in Japan.
- The move matters globally because a major economy is shifting from punitive policy toward integration.
On June 11, 2026, the lower house of Japan’s parliament passed a bill that begins one of the most consequential regulatory shifts in the country’s crypto history. The legislation reclassifies cryptocurrency from its current home under the Payment Services Act into the Financial Instruments and Exchange Act, the statute that governs stocks and bonds, and it sits alongside a closely linked tax proposal that would cut the tax on crypto gains from a punishing rate near 55% toward a flat 20%.
For the world’s third-largest economy, long known for some of the harshest crypto tax treatment among major nations, this is a structural turn toward treating digital assets as a legitimate part of the financial system. It also opens a path toward regulated crypto ETFs that Japanese investors have never had.
The change matters well beyond Japan’s borders, which is why it has drawn global attention even as much of the coverage garbles the specifics. A major economy moving from punitive to competitive crypto policy is a signal other governments read, a data point in the global regulatory race, and a potential unlock for one of the largest pools of household savings in the world.
But the details are widely misreported, with headlines compressing a multi-stage, multi-year process into a single accomplished fact. This piece lays out what Japan actually did, what it did not yet do, why the reclassification matters as much as the tax cut, and what the move means for the global crypto landscape.
What Japan actually did, precisely
The single most important thing to get right: this is a process in motion, not a finished law, and the distinction matters for anyone trying to understand the timeline.
On June 11, 2026, Japan’s House of Representatives, the lower house, passed an amendment bill that moves crypto-asset regulation out of the Payment Services Act and into the Financial Instruments and Exchange Act, often abbreviated FIEA, the law governing securities markets. The bill now advances to the upper house, the House of Councillors, for deliberation.
It requires upper house passage, government promulgation, and follow-on rulemaking by the Financial Services Agency before it takes full legal effect, which is expected to happen next year, not immediately. The Cabinet approved the underlying measure back in April, so the June lower-house vote is a major step in a sequence that began earlier and has further to run.
That tax change is a separate but linked matter, and conflating the two is the most common error in the coverage. The headline 20% rate does not live inside the FIEA reclassification bill itself; it sits in a closely associated tax proposal, and the flat 20% rate is targeted for 2028, not arriving with the reclassification.
Today, crypto gains in Japan are taxed as miscellaneous income at progressive rates that climb toward roughly 55% for high earners, among the heaviest crypto tax burdens in the developed world. The policy path would shift that to a flat, separate 20% rate, aligning crypto with how gains on stocks are taxed.
The accurate summary is that Japan’s lower house has approved reclassifying crypto as a financial instrument, with a linked plan to cut the tax rate to 20% by 2028. Several legislative steps remain before either piece is law.
Why the reclassification matters as much as the tax cut
The tax cut gets the headlines, but the reclassification is the deeper change, and understanding why requires looking at what moving crypto into the securities statute actually does.
Placing crypto under the Financial Instruments and Exchange Act subjects it to securities-style market rules: issuer disclosure requirements, a crypto-specific insider-trading regime, anti-market-abuse enforcement, and tougher penalties for misconduct. This is a double-edged change.
On one side, it imposes tighter obligations on the industry, including more disclosure, more compliance, suitability checks on platforms, and possible eligibility screens that could cap certain unaudited issuer offerings for smaller investors. The Japanese crypto industry will carry a heavier regulatory load under FIEA than it did under the lighter-touch Payment Services Act.
On the other side, that heavier regulation is precisely what legitimizes the asset class in the eyes of conservative institutions. Most of all, it creates the legal foundation for regulated investment products.
Most important of all is the path to ETFs. Under the Payment Services Act, crypto sat in a category that did not support the kind of regulated investment vehicles that securities law enables.
By moving crypto into the FIEA, Japan creates the statutory basis on which spot crypto ETFs and other regulated products can be built and offered to Japanese investors, who have never had access to them. That is the ETF access the reclassification enables, and it may matter as much as the tax change itself.
For a nation with one of the largest pools of household savings in the world, much of it sitting in low-yielding cash and bonds, opening a regulated, tax-efficient route into crypto is potentially far more significant than the tax cut alone. The reclassification is the plumbing; the tax cut is the incentive; and together they could channel a meaningful share of Japanese savings toward digital assets in a way the old regime actively discouraged.
That ETF path also matters for specific assets. Japan is already being discussed as a market where XRP products could arrive before 2028, showing how reclassification can move from abstract legal reform into real product pipelines.
The tax cut and what it changes for investors
Moving from a 55% top rate toward a flat 20% is a dramatic shift in the economics of holding crypto in Japan, and it addresses a long-standing complaint that drove activity offshore.
Under the current system, a Japanese investor’s crypto gains are lumped into miscellaneous income and taxed at progressive rates that can reach around 55% for high earners, far above the roughly 20% flat rate applied to gains on stocks. This disparity has been one of the loudest grievances of Japan’s crypto community for years.
It both punished crypto investment relative to equities and pushed serious traders toward offshore venues and structures to escape the burden. A high-earning investor facing a 55% tax on crypto gains but a 20% tax on stock gains had every incentive to either avoid crypto or move their activity outside Japan’s tax net, and many did exactly that.
A flat 20% rate would erase that disparity, taxing crypto gains the same way stock gains are taxed and removing the penalty that has suppressed domestic crypto investment. The effect, should the tax proposal become law on its 2028 target, would be to make holding and trading crypto within Japan dramatically more attractive.
It would lower the absolute tax burden and end the perverse incentive to route activity offshore. Combined with the ETF access the reclassification enables, the tax cut could bring a wave of previously deterred domestic capital and activity back onshore and into regulated products.
The caveat, again, is timing. This is a 2028 target inside a proposal that still must advance, not a change taking effect now, and investors counting on it should track its progress instead of assuming it.
Why this matters globally
Japan’s move is a national policy change with international weight, and the global significance runs along several lines that make it worth attention far outside Japan.
The first is the signal to other governments. Japan is the world’s third-largest economy and a serious, conservative financial jurisdiction, not a small state competing for crypto business through permissiveness.
When a country of that stature moves deliberately from punitive to competitive crypto policy, reclassifying the asset class into its mainstream financial statute and cutting taxes to match equities, it tells other governments that crypto regulation is shifting from suppression toward integration among the major economies. This feeds the global regulatory race, in which jurisdictions increasingly compete to host crypto activity instead of driving it away.
Japan’s entry on the competitive side adds weight to that trend at the highest level. It also sits beside the parallel US regulatory shift, where classification, ETF access, and market-structure rules are reshaping how digital assets enter traditional finance.
The second is the demand unlock. Japan has enormous household savings and a long history of retail investor enthusiasm for new asset classes, and the combination of regulated ETF access and equity-equivalent taxation could mobilize a significant pool of capital that the old regime kept on the sidelines.
A large, wealthy, under-allocated investor base gaining a clean, tax-efficient route into crypto is the kind of structural demand expansion that matters for the asset class globally, not just locally. It also ties into the global institutionalization of crypto, where public-market access and regulated exposure are becoming central to the asset class.
Third is the institutional dimension. The move comes as major Japanese banks, including the country’s largest, prepare stablecoin projects and as regulators build a clearer framework, signaling that Japan’s financial establishment is engaging with digital assets instead of resisting them.
A major economy bringing its banks, its tax code, and its securities law into alignment around crypto is a meaningful validation that resonates well beyond its borders.
The risks and the caveats
A fair account has to weigh what could slow or complicate this, because the optimistic reading depends on several things going right.
The clearest caveat: none of it is final. The reclassification has passed only the lower house and must clear the upper house, promulgation, and FSA rulemaking before taking effect, expected next year.
The tax cut is a separate 2028 target inside a proposal that has its own path to travel. Legislative processes can slow, change, or stall, and the compressed headlines proclaiming that Japan has already cut crypto taxes to 20% are running ahead of the actual state of the law.
Anyone making decisions based on this should track the upper house deliberation and the tax proposal’s progress instead of treating either as accomplished. That is why how regulatory timing shapes markets matters: policy direction and legal reality often move on different clocks.
The heavier regulation is also a real tradeoff, not a pure positive. Moving crypto under securities law brings disclosure burdens, insider-trading rules, suitability checks, and possible investment caps on certain products for smaller investors, which constrain some of the openness that characterized the lighter-touch regime.
The industry gains legitimacy and ETF access but accepts a heavier compliance load, and how the FSA writes the secondary rules will determine whether the balance lands closer to enabling or constraining. There is also the question of whether the demand materializes as hoped.
Japan’s investors may embrace regulated crypto access, or cultural caution and the asset class’s volatility may temper the uptake. The savings-unlock thesis is a reasonable expectation, not a certainty.
The move is significant and directionally positive for crypto, but its full effect depends on execution across multiple stages that have not yet happened.
What it means for the global crypto landscape
For the crypto market broadly, Japan’s shift is a constructive data point in a year defined by regulatory realignment across major jurisdictions.
One pattern stands out: convergence. The United States has been working through its own market-structure legislation and has seen agency-level commodity classifications for major assets.
Japan is reclassifying crypto into its securities framework and charting a tax cut. Other jurisdictions are building stablecoin and ETF frameworks.
The major economies are, in their different ways and on their different timelines, moving crypto from the regulatory margins toward integration into mainstream financial law. Japan’s June vote is a clear instance of that broader direction.
For an asset class whose largest overhang has long been regulatory uncertainty, a steady accumulation of clarity across the major economies is the kind of slow, structural tailwind that matters more over years than any single headline. It also feeds into the broader market this policy feeds into, where regulation, liquidity, and institutional access increasingly decide which crypto narratives matter.
For investors and observers outside Japan, the practical takeaway is to read this as part of a trend, not an isolated event. The key question is whether the demand unlock the policy enables actually arrives, because that is the part that would feed back into global crypto demand.
A Japan that successfully brings a large share of its household savings into regulated crypto products would be a powerful proof of concept for the integration thesis, one other governments and markets would notice. The reclassification and the tax cut set the stage; what plays out on it over the next two years, through the remaining legislative steps and the response of Japanese investors, is the story worth following.
A major economy changes its mind
Japan spent years as a cautionary example of how punitive policy suppresses a domestic crypto market, taxing gains at rates that drove activity offshore and offering no regulated route into the asset class. The June 11 lower-house vote is the clearest sign yet that the country is changing its mind, reclassifying crypto as a financial instrument, charting a path to cut taxes from 55% toward 20%, and opening the door to the regulated ETFs its investors have never had.
This change is real, structurally important, and globally relevant, and it is also a multi-stage process whose biggest pieces, the tax cut targeted for 2028 and the full reclassification expected next year, have not yet taken final effect. Read accurately, Japan has not yet cut its crypto tax to 20%; it has taken a major step toward doing so, alongside a deeper reclassification that may matter even more by opening the ETF door.
For the world’s third-largest economy to move so deliberately from suppression toward integration is a meaningful marker in crypto’s long regulatory normalization, and a signal other governments will read. The details are more complicated than the headlines suggest, but the direction is unmistakable, and the direction is what makes it matter.
Frequently asked questions
Did Japan cut its crypto tax to 20%?
Not yet. On June 11, 2026, Japan’s lower house passed a bill reclassifying crypto as a financial instrument, and a closely linked tax proposal aims to cut the tax on crypto gains from progressive rates near 55% to a flat 20%. But the 20% rate is targeted for 2028 and sits in a separate proposal, and the reclassification still needs upper-house passage and regulatory rulemaking before taking effect, expected next year. Japan has taken a major step toward cutting the tax, not completed it.
What does reclassifying crypto under the FIEA mean?
It moves crypto regulation out of Japan’s Payment Services Act and into the Financial Instruments and Exchange Act, the statute governing stocks and bonds. This subjects crypto to securities-style rules, including issuer disclosure, an insider-trading regime, and tougher enforcement, while also creating the legal foundation for regulated crypto ETFs that Japanese investors have not had access to. The reclassification may be more significant than the tax cut because it enables regulated investment products.
Why is Japan’s crypto tax currently so high?
Under the current system, crypto gains are treated as miscellaneous income and taxed at progressive rates that can reach roughly 55% for high earners, far above the flat 20% rate on stock gains. This disparity has long been a major grievance of Japan’s crypto community, because it penalized crypto investment relative to equities and pushed traders toward offshore venues. The proposed flat 20% rate would align crypto with stock taxation.
When will the changes take effect?
The reclassification, having passed the lower house, needs upper-house passage, government promulgation, and Financial Services Agency rulemaking before taking full effect, expected next year. The flat 20% tax rate is a separate target for 2028. Both pieces still have legislative steps to complete, so the timeline spans the next two years instead of taking effect immediately, and progress should be tracked rather than assumed.
Why does Japan’s crypto policy matter globally?
Japan is the world’s third-largest economy and a serious, conservative financial jurisdiction. When a country of that stature moves from punitive to competitive crypto policy, it signals other governments that crypto regulation is shifting toward integration among major economies, feeding the global regulatory race. Japan also has enormous household savings, so opening regulated, tax-efficient crypto access could unlock a significant pool of capital, a structural demand expansion that matters for crypto worldwide.
Will this bring more money into crypto?
Potentially. The combination of regulated ETF access from the reclassification and equity-equivalent taxation from the tax cut could mobilize a large pool of Japanese household savings that the old regime kept out, and bring offshore activity back onshore. But this depends on the legislation completing its remaining steps and on Japanese investors actually embracing the access, which cultural caution and crypto’s volatility could temper. The demand unlock is a reasonable expectation, not a certainty.
As of June 16, 2026. Legislative and tax processes change over time; verify the current status before relying on this analysis. This article is information, not investment or tax advice.
Crypto World
Heir to 135-year Gulf dynasty is moving a $6 trillion trade market onto blockchain rails


For more than 135 years, the Kanoo family, one of Bahrain’s wealthiest families, has helped build the Gulf’s entire commercial infrastructure.
The family, with a net worth of up to $6 billion, owns businesses spanning shipping, logistics, travel and finance.
Abdulla Kanoo, one of the heirs to this 135-year-old dynasty, is now involved in crypto. While he refuses to reveal his family’s or his personal bitcoin investments, he says he’s invested in digital assets since 2015 and remains “faithful” to bitcoin .
Kanoo also believes the next generation of global commerce will not be built on ports or banks, but on digital rails or, more specifically, on the blockchain, where programmable money is king.
Kanoo is the co-founder of ARP Digital, a digital asset infrastructure project focused on allowing the movement of money between emerging economies faster, cheaper and with fewer intermediaries.
“The Gulf was where global capital was stored,” he told CoinDesk. “The next chapter is about movement.”
Kanoo is not launching another crypto exchange nor is he pitching a new token. He has his goals set on expanding the family legacy on a global scale.
Woman rushed to hospital from Manchester Ship Canal

Betting Tips, Odds and Predictions for 2026 World Cup Opener
All 6 Christopher Nolan Epic Movies, Ranked

Blockchain.com files with SEC for U.S. IPO

Israel says it has killed new Hamas military leader in Gaza City airstrikes

NYT Strands Answers May 24 2026 Revealed for Puzzle No. 812 Theme Summer Essentials

FINANCIAL BREAKTHROUGH: No More Debts | Miracles Aglow

#StockMarket #ShareMarket #Investing #Trading #StockMarketTelugu #Money #Finance #BeginnerInvestor #

That is certainly one way to handle a problem #funny #money #shopping #budget #shorts
-

 Business3 days ago
No Jackpot Winner as $257 Million Prize Rolls Over to $269 Million Monday Draw
-

 Crypto World6 days ago
Oppenheimer backs SpaceX as $70 billion retail frenzy builds
-

 Fashion5 days ago
Weekend Open Thread: Tuckernuck – Corporette.com
-

 Crypto World6 days ago
Markets Rally as SpaceX IPO Looms Amid Iran Tensions and Inflation Surge
-
Crypto World3 days ago
Zimbabwe Requires Crypto Businesses to Register Annually Under New FIU Regulations
-

 Tech4 days ago
NanoClaw integrates JFrog registries to secure AI agent downloads
-

 Tech5 days ago
This Week In Security: Microsoft On Microsoft, Register Your Domains, Linux On ARM, And FreeBSD Joins The File Cache Club
-

 Crypto World4 days ago
Bitget enters Argentina’s regulated crypto market through PSAV registration
-
 Tech6 days ago
Dutton Ranch star claims they ‘didn’t see any disruption’ on set following Chad Feehan’s exit from Yellowstone spinoff fueled by Taylor Sheridan clash rumors
-

 NewsBeat6 days ago
El Nino has formed in the Pacific and could set records, forecasters say
-

 Politics6 days ago
Politics Home | Healey Resignation Is “Colossal Failure Of Government”, Says Former Labour Defence Secretary
-
 Entertainment6 days ago
Donnie Wahlberg & More Heat Up Las Vegas at Circa’s Barry’s Downtown Prime
-
 Tech6 days ago
Opendoor Ends India Operations, Fueling a Bigger Conversation About AI and Outsourcing
-

 Politics6 days ago
Belfast burns, while Met chief points finger at Iran and Russia
-

 Sports6 days ago
First Time Since 1971: Australia Register Historic Low In ODI Cricket
-

 Business6 days ago
AT&T: Verizon's 27% Outperformance Sets Up A Solid Entry Point
-

 NewsBeat5 days ago
FBI searches office of Ohio voter registration group
-
 Tech6 days ago
Anthropic is spending $150M to embed 1,000 AI fellows inside nonprofits. No degree required.
-

 Politics6 days ago
Modi thanks Trump for wishes as US attacks Indian seafarers
-
 Entertainment5 days ago
‘The Pitt’s Fan-Favorite Doctor Confirms Noah Wyle Gave His Blessing to Return [Exclusive]
You must be logged in to post a comment Login