

Crypto World
Franklin Templeton’s Bitcoin DRIP ETFs explained


A $1.5 trillion asset manager just filed to take the most boring mechanism in investing, the dividend reinvestment plan, and quietly point it at Bitcoin. The filing made no headlines. It may be one of the most structurally interesting crypto products yet proposed.
Summary
- Franklin Templeton filed two ETFs that would reinvest stock dividends into Bitcoin.
- The structure turns a traditional DRIP into an automatic Bitcoin accumulation engine.
- These are equity funds with a Bitcoin feature, not pure Bitcoin funds.
- The idea matters more as product design than as an immediate source of Bitcoin demand.
On June 18, 2026, Franklin Templeton, a roughly $1.5 trillion asset manager that has been in business since 1947, filed paperwork with the Securities and Exchange Commission for two new exchange-traded funds. There were no press conferences, no celebrity fund-manager threads, no countdown clocks on financial television.
The firm simply submitted two registration statements and went about its day. But what those filings describe is one of the more structurally interesting financial products proposed in years, because they take the single most boring, set-it-and-forget-it mechanism in all of investing, the dividend reinvestment plan, and quietly repurpose it to accumulate Bitcoin.
Franklin Templeton is calling them “Bitcoin DRIP” funds, and the idea is strange enough, and clever enough, to be worth understanding in full.
This piece explains what Franklin Templeton actually filed and how the Bitcoin DRIP structure works, why taking the familiar dividend-reinvestment mechanism and pointing it at Bitcoin is a truly novel idea, how this fits into the broader explosion of crypto ETF innovation happening in 2026, what it would mean for ordinary investors and for Bitcoin itself, and the real risks and open questions the filing leaves unanswered.
The funds are not approved yet, tickers and fees are still blank, and they may never launch in their proposed form. But the design points at something larger than two funds: a shift in how Wall Street is packaging Bitcoin, from simple price exposure to structured products that engineer crypto into the machinery of conventional investing.
Understanding the Bitcoin DRIP idea is understanding where the ETF wave is heading next.
What Franklin Templeton actually filed
The mechanics are the heart of the story, so it is worth laying them out precisely, because the cleverness is in exactly how the structure works.
Franklin Templeton filed for two funds, the Franklin US Equity Bitcoin DRIP Index ETF and the Franklin US Innovation Bitcoin DRIP Index ETF, both tracking proprietary indexes built by an index provider called VettaFi. The first tracks a broad large-cap US equity index, and the second a US innovation-and-growth index, so the two differ mainly in which basket of American stocks they hold.
Each fund begins with the same allocation: 95% in US equities and 5% in Bitcoin exposure. That starting point alone is unremarkable, a stock portfolio with a small Bitcoin sleeve.
The novel part is what happens to the dividends. The stocks in the equity portion pay dividends, as dividend-paying stocks do, and instead of reinvesting those dividends back into the same stocks, as a normal dividend reinvestment plan would, the fund automatically routes every dividend into buying more Bitcoin.
Those mechanics are specific. All regular and special dividends from the equity holdings are reinvested into Bitcoin at the market open on the day after each dividend’s ex-date, which steadily increases the fund’s Bitcoin exposure over time.
It gains its Bitcoin exposure through Bitcoin-related instruments, including Bitcoin exchange-traded products, futures, and similar vehicles, and it can hold some of that exposure through a subsidiary structured for the purpose. That is where the three ETF types this builds on matter: spot products, futures products, and income or structured ETF designs are now being recombined into new wrappers.
To keep Bitcoin as a secondary allocation instead of letting it grow without limit, the underlying index caps overall Bitcoin exposure at 20% and applies a smaller cap at each quarterly rebalance. So the design is a stock portfolio that quietly converts its entire dividend stream into a programmatic Bitcoin accumulation engine, starting at a 5% Bitcoin weight and compounding that weight upward over time as dividends flow in, capped at 20%.
The preliminary prospectus is dated June 18, tickers and fees are still blank, the funds cannot be sold until the registration becomes effective, and the earliest possible launch is around September 1, 2026.
Why this is a truly novel idea
The structure is worth pausing on, because it is not just another way to package Bitcoin exposure; it repurposes a mechanism so familiar that its application to Bitcoin is quietly radical.
A dividend reinvestment plan, or DRIP, is one of the oldest and most boringly reliable tools in investing. For decades, ordinary investors have used DRIPs to automatically plow the dividends from their stocks back into buying more of those same stocks.
That compounds their positions over time without lifting a finger, the very picture of patient, conventional, set-it-and-forget-it wealth-building. A DRIP is the opposite of speculative; it is the slow, automatic compounding that has built retirement accounts since the 1960s.
What Franklin Templeton’s filing does is take that exact mechanism, the automatic, disciplined reinvestment of dividends, and redirect its output away from more stock and into Bitcoin. That dividend stream, historically one of the most conservative and predictable components of equity investing, becomes a programmatic Bitcoin-buying machine running on autopilot inside a regulated fund.
What makes this clever is the behavior it creates, not the exposure it provides. A spot Bitcoin ETF gives you a lump of Bitcoin price exposure that rises and falls with the market; you buy in once and your exposure is set.
The Bitcoin DRIP structure instead manufactures a recurring, automatic stream of Bitcoin accumulation funded entirely by equity dividends. Simply holding the fund means you are steadily, mechanically buying Bitcoin every quarter without making any decision to do so.
It is dollar-cost averaging into Bitcoin, except the dollars come from your stock dividends, not from your wallet, and the averaging happens automatically inside the wrapper. For an investor who wants Bitcoin exposure but distrusts their own ability to buy it consistently, or who likes the idea of keeping a core equity portfolio while siphoning its income into Bitcoin, the structure does something a plain spot ETF cannot.
It builds the accumulation discipline into the product itself. That is a fundamentally different idea from one-time price exposure, and it is what makes two quietly filed funds more interesting than their lack of fanfare suggested.
The bigger picture: the ETF innovation wave
The funds did not appear in isolation; they are part of a wave of crypto ETF innovation that defines 2026, and seeing that context explains why this filing matters beyond its own mechanics.
For most of Bitcoin’s ETF history, the story was simple: spot exposure. When the SEC approved spot Bitcoin ETFs in early 2024 after a decade of rejections, the funds attracted tens of billions of dollars, but they all did essentially the same thing: hold Bitcoin and track its price.
Competition was about fees and scale, with the largest funds dominating on size. That has changed.
After the SEC published generic listing standards for crypto-linked funds in late 2025, the floodgates opened, with industry analysts predicting more than 100 crypto ETFs could launch in 2026 and well over 100 filings already in the pipeline. Competition shifted from access to structure.
Issuers can no longer win simply by offering Bitcoin exposure, because everyone offers that. So they compete instead on how they engineer the exposure, on yield, on portfolio design, and on novel mechanisms.
This filing is one expression of this shift, and it sits alongside others that show the same pattern. A recent launch of covered-call Bitcoin income ETFs, which sell options against Bitcoin holdings to generate yield while capping upside, was another, taking Bitcoin’s volatility and engineering it into an income stream.
That is another structured Bitcoin product, and it shows the same direction of travel. Bitcoin is no longer just being listed; it is being sliced, capped, reinvested, hedged, and turned into portfolio machinery.
Franklin Templeton’s own broader push includes tokenizing traditional investment products and partnering with a major crypto exchange to offer a tokenized money-market fund as institutional collateral. The common thread: Bitcoin is being absorbed into the machinery of conventional finance, packaged and re-packaged into structured products that blend it with equities, with income strategies, and with the familiar tools of Wall Street.
The Bitcoin DRIP funds are not a one-off curiosity; they are a data point in a larger story about an industry that has moved past the question of whether Bitcoin belongs in a portfolio and on to the question of how cleverly it can be wrapped, structured, and sold. That is the context that makes a quietly filed pair of funds genuinely significant.
What it would mean for investors
For an ordinary investor, the Bitcoin DRIP structure offers a specific proposition, and understanding who it suits and who it does not is the practical question.
These funds target a particular kind of investor: someone who wants Bitcoin exposure but prefers to keep a conventional equity portfolio as their core, and who likes the idea of accumulating Bitcoin gradually and automatically instead of buying a lump of it directly. For that investor, the Bitcoin DRIP structure is appealing because it does not ask them to choose between stocks and Bitcoin or to time a Bitcoin purchase.
It lets them hold a familiar US equity portfolio while the dividends quietly build a growing Bitcoin position in the background. It is Bitcoin exposure for the equity investor who wants it on autopilot and as a secondary allocation, delivered through the same brokerage account and ETF wrapper they already use for everything else, which removes the wallet, the keys, and the crypto exchange entirely.
For someone intimidated by buying Bitcoin directly but comfortable owning an ETF, the structure is a familiar door into gradual Bitcoin accumulation. It is also another wrapper for crypto exposure, showing how crypto is increasingly delivered through forms investors already understand.
It also has clear limits on who it suits. An investor who wants full, direct exposure to Bitcoin’s price will find the Bitcoin DRIP funds a poor fit, because Bitcoin starts as only 5% of the fund and is capped at 20%.
That means the great majority of the fund’s performance comes from its stock holdings, not from Bitcoin. If your goal is to own Bitcoin’s price movement, a spot Bitcoin ETF or direct ownership gives you that cleanly, while a Bitcoin DRIP fund gives you mostly an equity portfolio with a slowly growing Bitcoin tilt.
These are equity funds with a Bitcoin accumulation feature, not Bitcoin funds. Confusing the two would lead to disappointment in either direction: an equity investor surprised by Bitcoin volatility, or a Bitcoin bull frustrated by muted Bitcoin exposure.
The structure suits the investor who wants the blend, a stock core with an automatic, capped, compounding Bitcoin sleeve. It is precisely wrong for anyone wanting concentrated Bitcoin exposure.
Knowing which you are is the whole decision.
What it would mean for Bitcoin
Beyond individual investors, the Bitcoin DRIP structure, if it succeeds and is copied, has an interesting implication for Bitcoin itself, and it is worth thinking through carefully without overstating it.
This structure creates a different kind of Bitcoin demand than a spot ETF does. A spot ETF generates demand through inflows and outflows: money comes in and the fund buys Bitcoin, money leaves and it sells, so the demand is lumpy and sentiment-driven.
The DRIP structure instead generates a recurring, mechanical stream of Bitcoin buying funded by equity dividends, which arrive on a regular schedule regardless of Bitcoin sentiment. As long as investors hold the funds and the underlying stocks pay dividends, the funds keep buying Bitcoin quarter after quarter.
This is a steadier, more automatic source of demand than sentiment-driven inflows, a programmatic bid that does not depend on anyone feeling bullish about Bitcoin in a given quarter. If such structures grow popular and proliferate, they could create a persistent, dividend-funded layer of Bitcoin demand that behaves differently from the volatile flows of spot products.
The honest caveat: this should not be overstated, because the scale is what matters and it is unproven. Two newly filed funds, starting at a 5% Bitcoin allocation, do not move Bitcoin’s price, and the demand they would generate is small relative to the market unless the structure is widely adopted and the assets grow large.
The significance lies in the model and its potential, not in the immediate impact. If dividend-funded Bitcoin accumulation becomes a popular structure across many large funds, the cumulative recurring demand could become meaningful, but that is a speculative if, not a present reality.
What the filing shows is a new mechanism for generating Bitcoin demand, one that is steadier and more automatic than existing products, and that mechanism is interesting for what it could become. But anyone tempted to read two quietly filed funds as a major new source of Bitcoin buying today is getting ahead of the facts.
The idea is the story; the impact is a question for the future and for adoption.
The risks and open questions
A clear-eyed look requires naming what the filing does not resolve, because the Bitcoin DRIP structure carries real risks and leaves important questions open.
One set of risks is structural and inherent to the design. Because the funds hold Bitcoin, they carry Bitcoin’s volatility, and although Bitcoin is a secondary allocation, a sharp Bitcoin decline still drags on the fund and exposes equity-focused investors to crypto risk they might not fully appreciate.
That matters especially given the Bitcoin backdrop, where Bitcoin has been under pressure even as other major assets have climbed. A product that quietly builds Bitcoin exposure can help disciplined accumulation, but it also quietly imports Bitcoin’s drawdowns.
Routing dividends into Bitcoin also raises tax questions. Routing dividends into Bitcoin purchases inside the fund structure has tax implications that the filing flags as potentially requiring adjustments, and the treatment of these reinvestments is not fully settled.
There is also the complexity of holding Bitcoin exposure through Bitcoin ETPs, futures, and a subsidiary, each layer adding cost and potential tracking imperfection between the fund and Bitcoin’s actual price. These are not fatal flaws, but they are real frictions that a simple spot ETF avoids, and they mean the Bitcoin DRIP structure is more complicated than its elegant concept suggests.
The larger open questions concern approval and adoption. These funds are not approved; tickers, fees, and listing details are still blank, and the SEC has not signed off, so the entire structure remains a proposal that could be changed or rejected.
Even if approved, the funds must attract assets to matter, and whether investors actually want a stock portfolio that converts dividends to Bitcoin is unproven, an untested proposition in the market. Fees, still undisclosed, will shape the funds’ appeal, since a structured product with high fees competes poorly against simply holding a cheap equity ETF and a cheap Bitcoin ETF separately.
And the broader question hangs over the whole crypto-ETF wave: with more than 100 funds potentially launching, many novel structures will fail to gain traction, and the Bitcoin DRIP funds could be a clever idea that simply does not find an audience. That is what makes the leveraged-Bitcoin product under stress relevant: clever Bitcoin-linked structures can still face real market pressure once investors test them.
Realistically, this is an interesting and original proposal whose success depends on approval, fees, and whether investors embrace the blend, none of which is settled. The cleverness of the design is real; its fate is entirely open.
A boring mechanism, pointed at Bitcoin
Franklin Templeton’s two Bitcoin DRIP funds arrived without fanfare, but they describe something more interesting than their quiet filing suggested: the repurposing of the dividend reinvestment plan, the most conventional, set-it-and-forget-it mechanism in investing, into an automatic engine for accumulating Bitcoin.
By holding a portfolio of US stocks and routing every dividend into Bitcoin purchases, the funds turn a conservative income stream into programmatic crypto accumulation, building a growing Bitcoin position on autopilot inside a familiar ETF wrapper. The idea is strange precisely because it weds the most boring tool in finance to the most volatile asset, and clever because it manufactures accumulation discipline that a plain spot ETF cannot.
This filing matters most as a sign of where the crypto ETF wave is heading. An era of simple spot exposure is giving way to one of structured products: covered-call income funds, dividend-to-Bitcoin engines, tokenized blends, as issuers compete on engineering rather than access, with more than 100 crypto ETFs potentially launching in 2026.
The DRIP structure is one expression of that shift, offering equity investors an automatic, capped, compounding Bitcoin sleeve and, if widely adopted, potentially creating a steadier, dividend-funded layer of Bitcoin demand that behaves differently from volatile spot flows.
None of that is settled: the funds are unapproved, their fees blank, their adoption unproven, and their real impact on Bitcoin speculative. But the idea is a genuine innovation, and it captures the moment crypto has reached, no longer fighting to be included in portfolios, but being quietly engineered into their machinery.
Wall Street took its most patient, conventional habit and pointed it at Bitcoin, and whatever becomes of these two funds, that gesture says a great deal about where things are going.
Frequently asked questions
What are Franklin Templeton’s Bitcoin DRIP ETFs?
They are two proposed exchange-traded funds, the Franklin US Equity Bitcoin DRIP Index ETF and the Franklin US Innovation Bitcoin DRIP Index ETF, filed with the SEC on June 18, 2026. Each holds a portfolio of US stocks starting at 95% equities and 5% Bitcoin exposure, and automatically reinvests all dividends from the stocks into buying more Bitcoin, increasing the Bitcoin allocation over time up to a 20% cap. “DRIP” refers to a dividend reinvestment plan, repurposed to accumulate Bitcoin rather than more stock.
How does the Bitcoin DRIP structure actually work?
The funds hold US equities that pay dividends. Instead of reinvesting those dividends back into the same stocks, as a traditional dividend reinvestment plan would, the funds route every regular and special dividend into Bitcoin purchases at the market open the day after each dividend’s ex-date. This steadily increases Bitcoin exposure over time, starting at 5% and compounding upward, capped at 20% of the fund, with a smaller cap applied at each quarterly rebalance. Bitcoin exposure comes through Bitcoin ETPs, futures, and a subsidiary.
Why is this considered a novel idea?
Because it repurposes the dividend reinvestment plan, one of the oldest, most conservative tools in investing, normally used to compound stock positions, and points its output at Bitcoin instead. Rather than giving a one-time lump of Bitcoin exposure like a spot ETF, it manufactures a recurring, automatic stream of Bitcoin accumulation funded by equity dividends. It is effectively dollar-cost averaging into Bitcoin, where the dollars come from your stock dividends and the buying happens automatically inside the fund, building accumulation discipline into the product.
Who are these funds for?
They suit investors who want a conventional US equity portfolio as their core but like the idea of accumulating Bitcoin gradually and automatically as a secondary allocation, delivered through a familiar ETF wrapper with no wallet or crypto exchange needed. They are a poor fit for anyone wanting full, direct Bitcoin price exposure, because Bitcoin starts at just 5% and is capped at 20%, so most of the fund’s performance comes from stocks. They are equity funds with a Bitcoin accumulation feature, not Bitcoin funds.
Could this affect Bitcoin’s price?
Potentially, if the structure is widely adopted, but not in its current small form. Unlike spot ETFs, whose demand is lumpy and sentiment-driven, the DRIP structure generates a recurring, mechanical stream of Bitcoin buying funded by dividends that arrive on schedule regardless of sentiment. If such funds proliferate and grow large, they could create a steadier, dividend-funded layer of persistent Bitcoin demand. But two newly filed funds at a 5% allocation do not move the market; the significance is in the model’s potential, not its immediate impact.
When could these funds launch?
The preliminary prospectus is dated June 18, 2026, with an effective date as early as September 1, 2026, but the funds cannot be sold until the SEC registration becomes effective, and approval is not guaranteed. Tickers, fees, and listing details were still blank in the filing. Even if approved, the funds’ success depends on their undisclosed fees and on whether investors actually embrace a stock portfolio that converts dividends to Bitcoin, both of which remain unproven.
As of June 21, 2026. This concerns an unapproved regulatory filing that may change or be rejected; verify the current status before relying on it. This article is information, not investment advice.

Bitcoin (BTC) returned to $64,000 on Sunday amid concerns over unreliable BTC price strength.
Key points:
- Bitcoin brushes off US-Iran tensions despite the Strait of Hormuz being closed.
- A trader calls BTC price behavior “suspicious” as a result, while targets see maximum upside reaching $66,000.
- Binance sell-side pressure remains substantial.
BTC price ignores new Hormuz closure, Iran strike threats
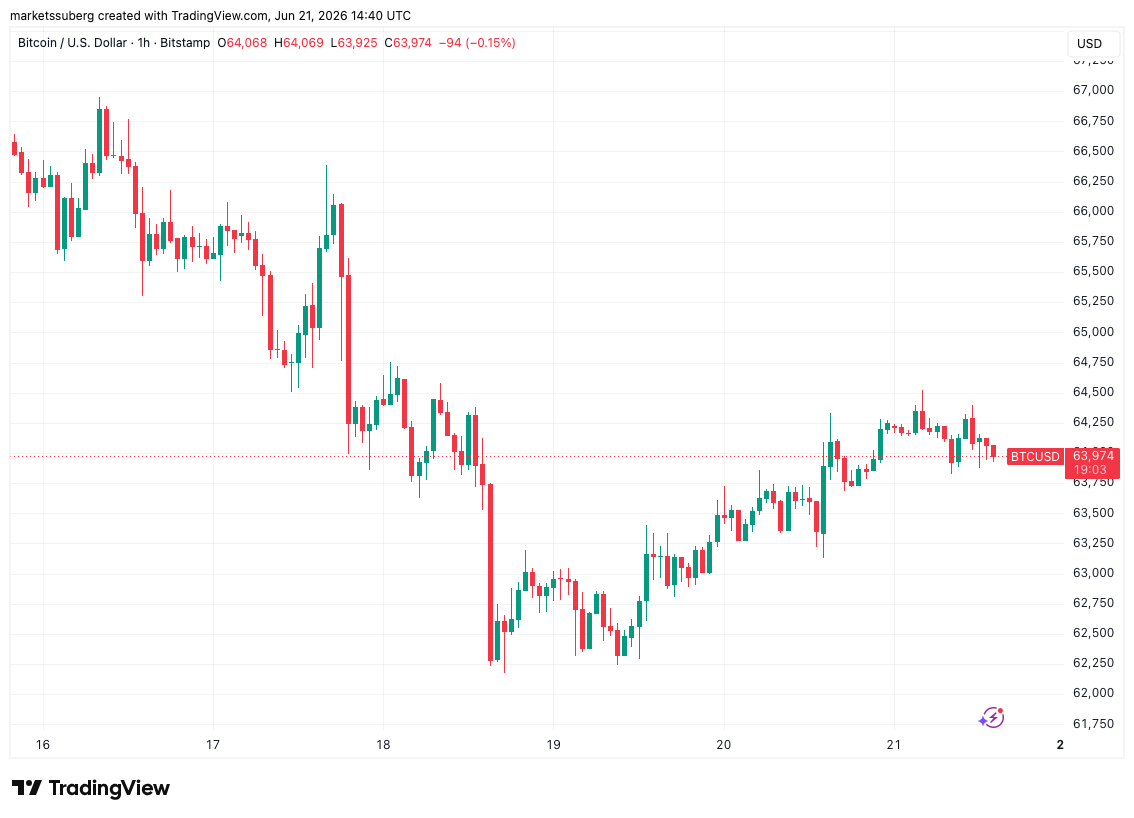
Data from TradingView showed BTC/USD hitting local highs of $64,522 on Bitstamp before reversing to trade 0.5% lower on the day.

BTC/USD one-hour chart. Source: Cointelegraph/TradingView
The pair maintained most of its gains despite fresh instability in the US-Iran war, with Tehran once again closing the Strait of Hormuz oil route and placing the current peace deal in doubt.
Israeli strikes on Lebanon lay at the heart of the stand-off, with Iran warning that last week’s ceasefire could unravel entirely as a result. US President Donald Trump responded with defiant rhetoric.
“Iran must immediately stop their highly paid PROXIES in Lebanon from causing trouble,” he wrote in a post on Truth Social, threatening “harder” strikes on Iran.
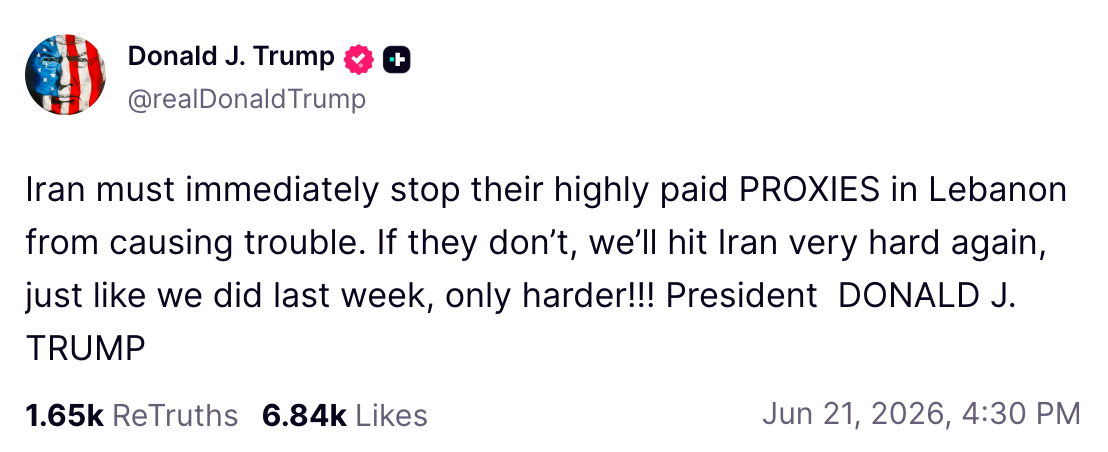
Source: Truth Social
Hours before US futures markets were due to open, crypto traders were predictably cautious.
“$BTC is pumping with rising geopolitical tensions, very suspicious,” trader Lennaert Snyder commented on X.
Snyder nonetheless saw a potential move to $66,000 as part of the current uptick, predicting an “interesting week” for Bitcoin.
Fellow trader Killa, meanwhile, warned that history favored the week’s high coming sooner rather than later.
“Monday hasn’t been kind to $BTC lately,” they told X followers.
“Over the past six weeks, 6 out of 6 Mondays have marked a local pivot high before price moved lower.”
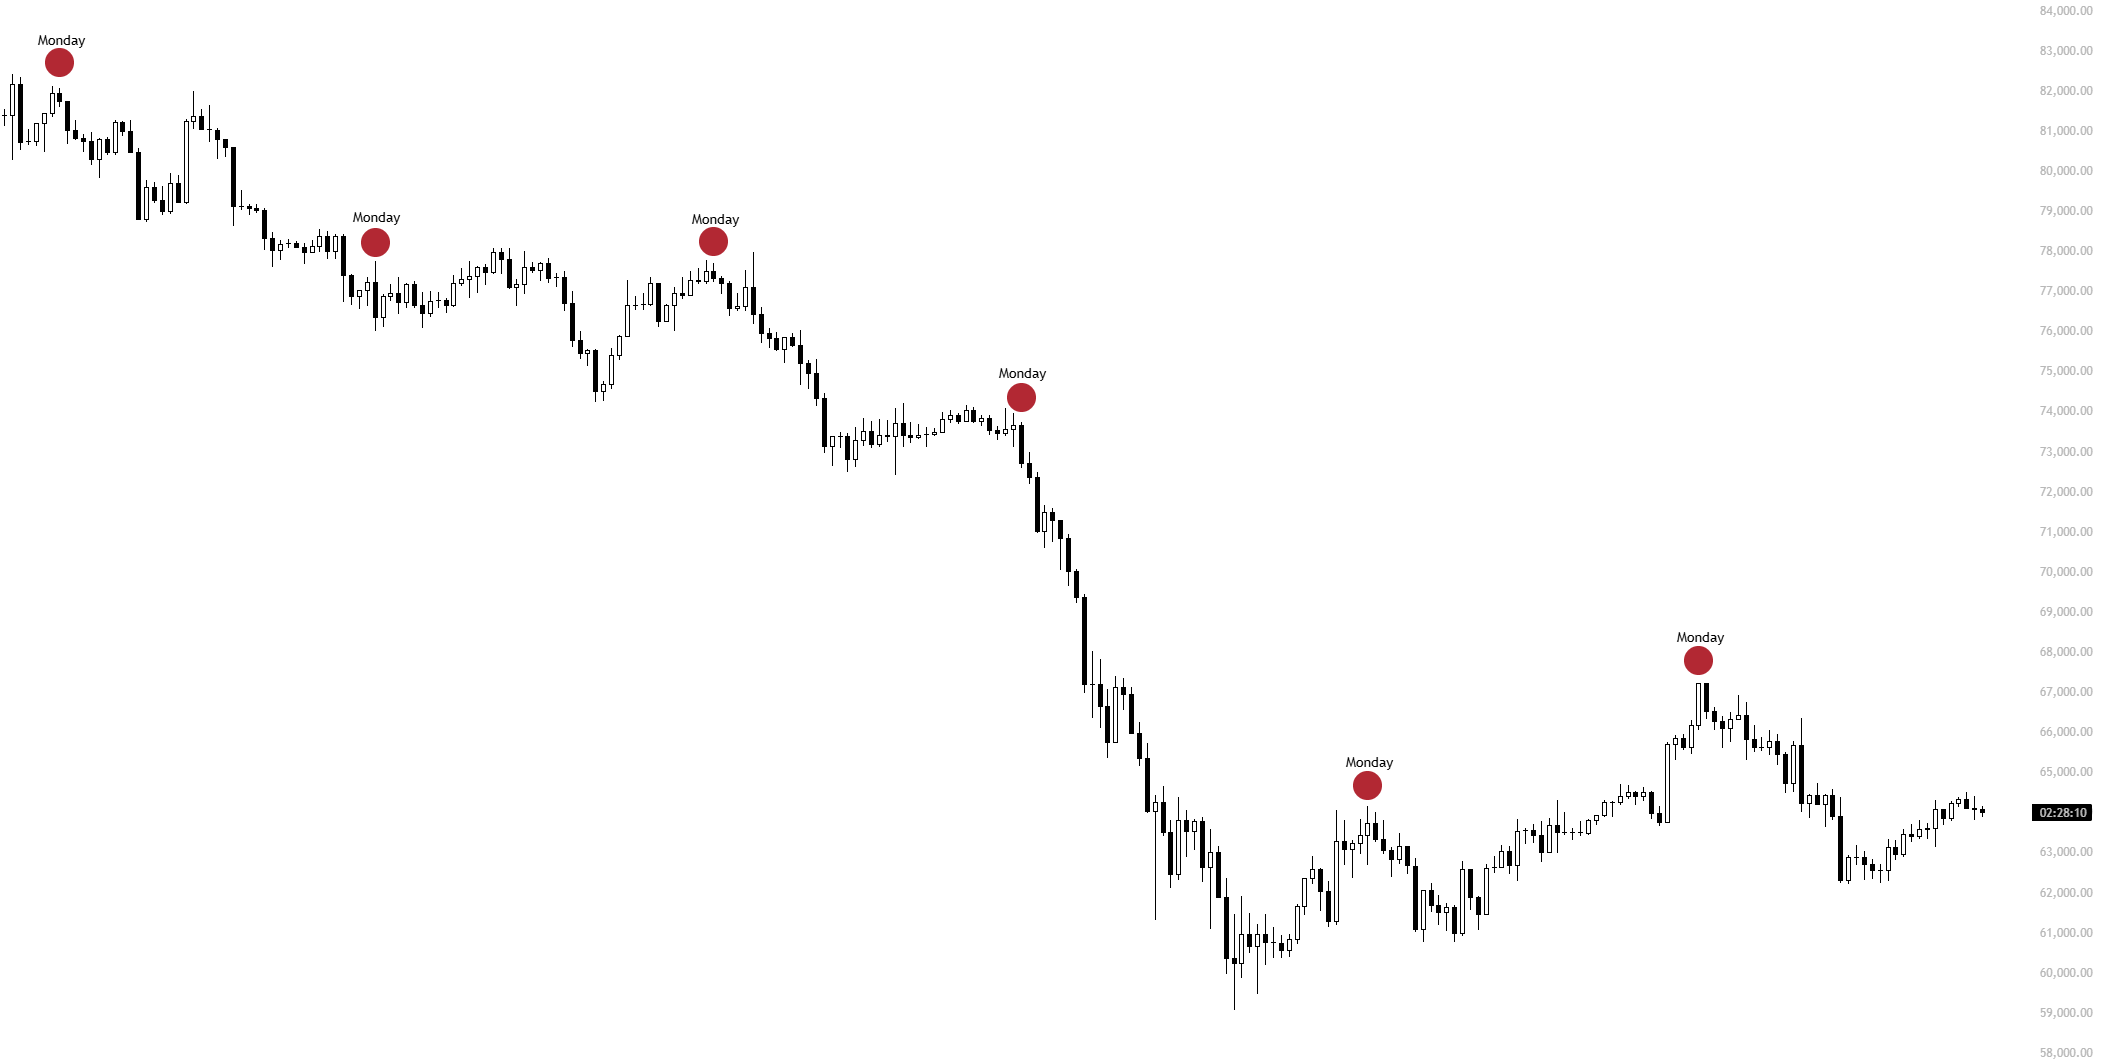
BTC/USD chart with Monday peaks marked. Source: Killa/X
Binance spot market sellers keep up pressure
Analysis of exchange order books produced further misgivings.
Related: Bitcoin tipped for Q3 ‘macro bottom’ near $50K as major liquidity grab looms
Commentator Exitpump said that short interest on Binance meant that it was the derivatives markets behind the latest price rise.
“Despite price slowly grinding higher, Binance spot continues to sell into the move. Mostly perps driven move up,” they wrote on Saturday.
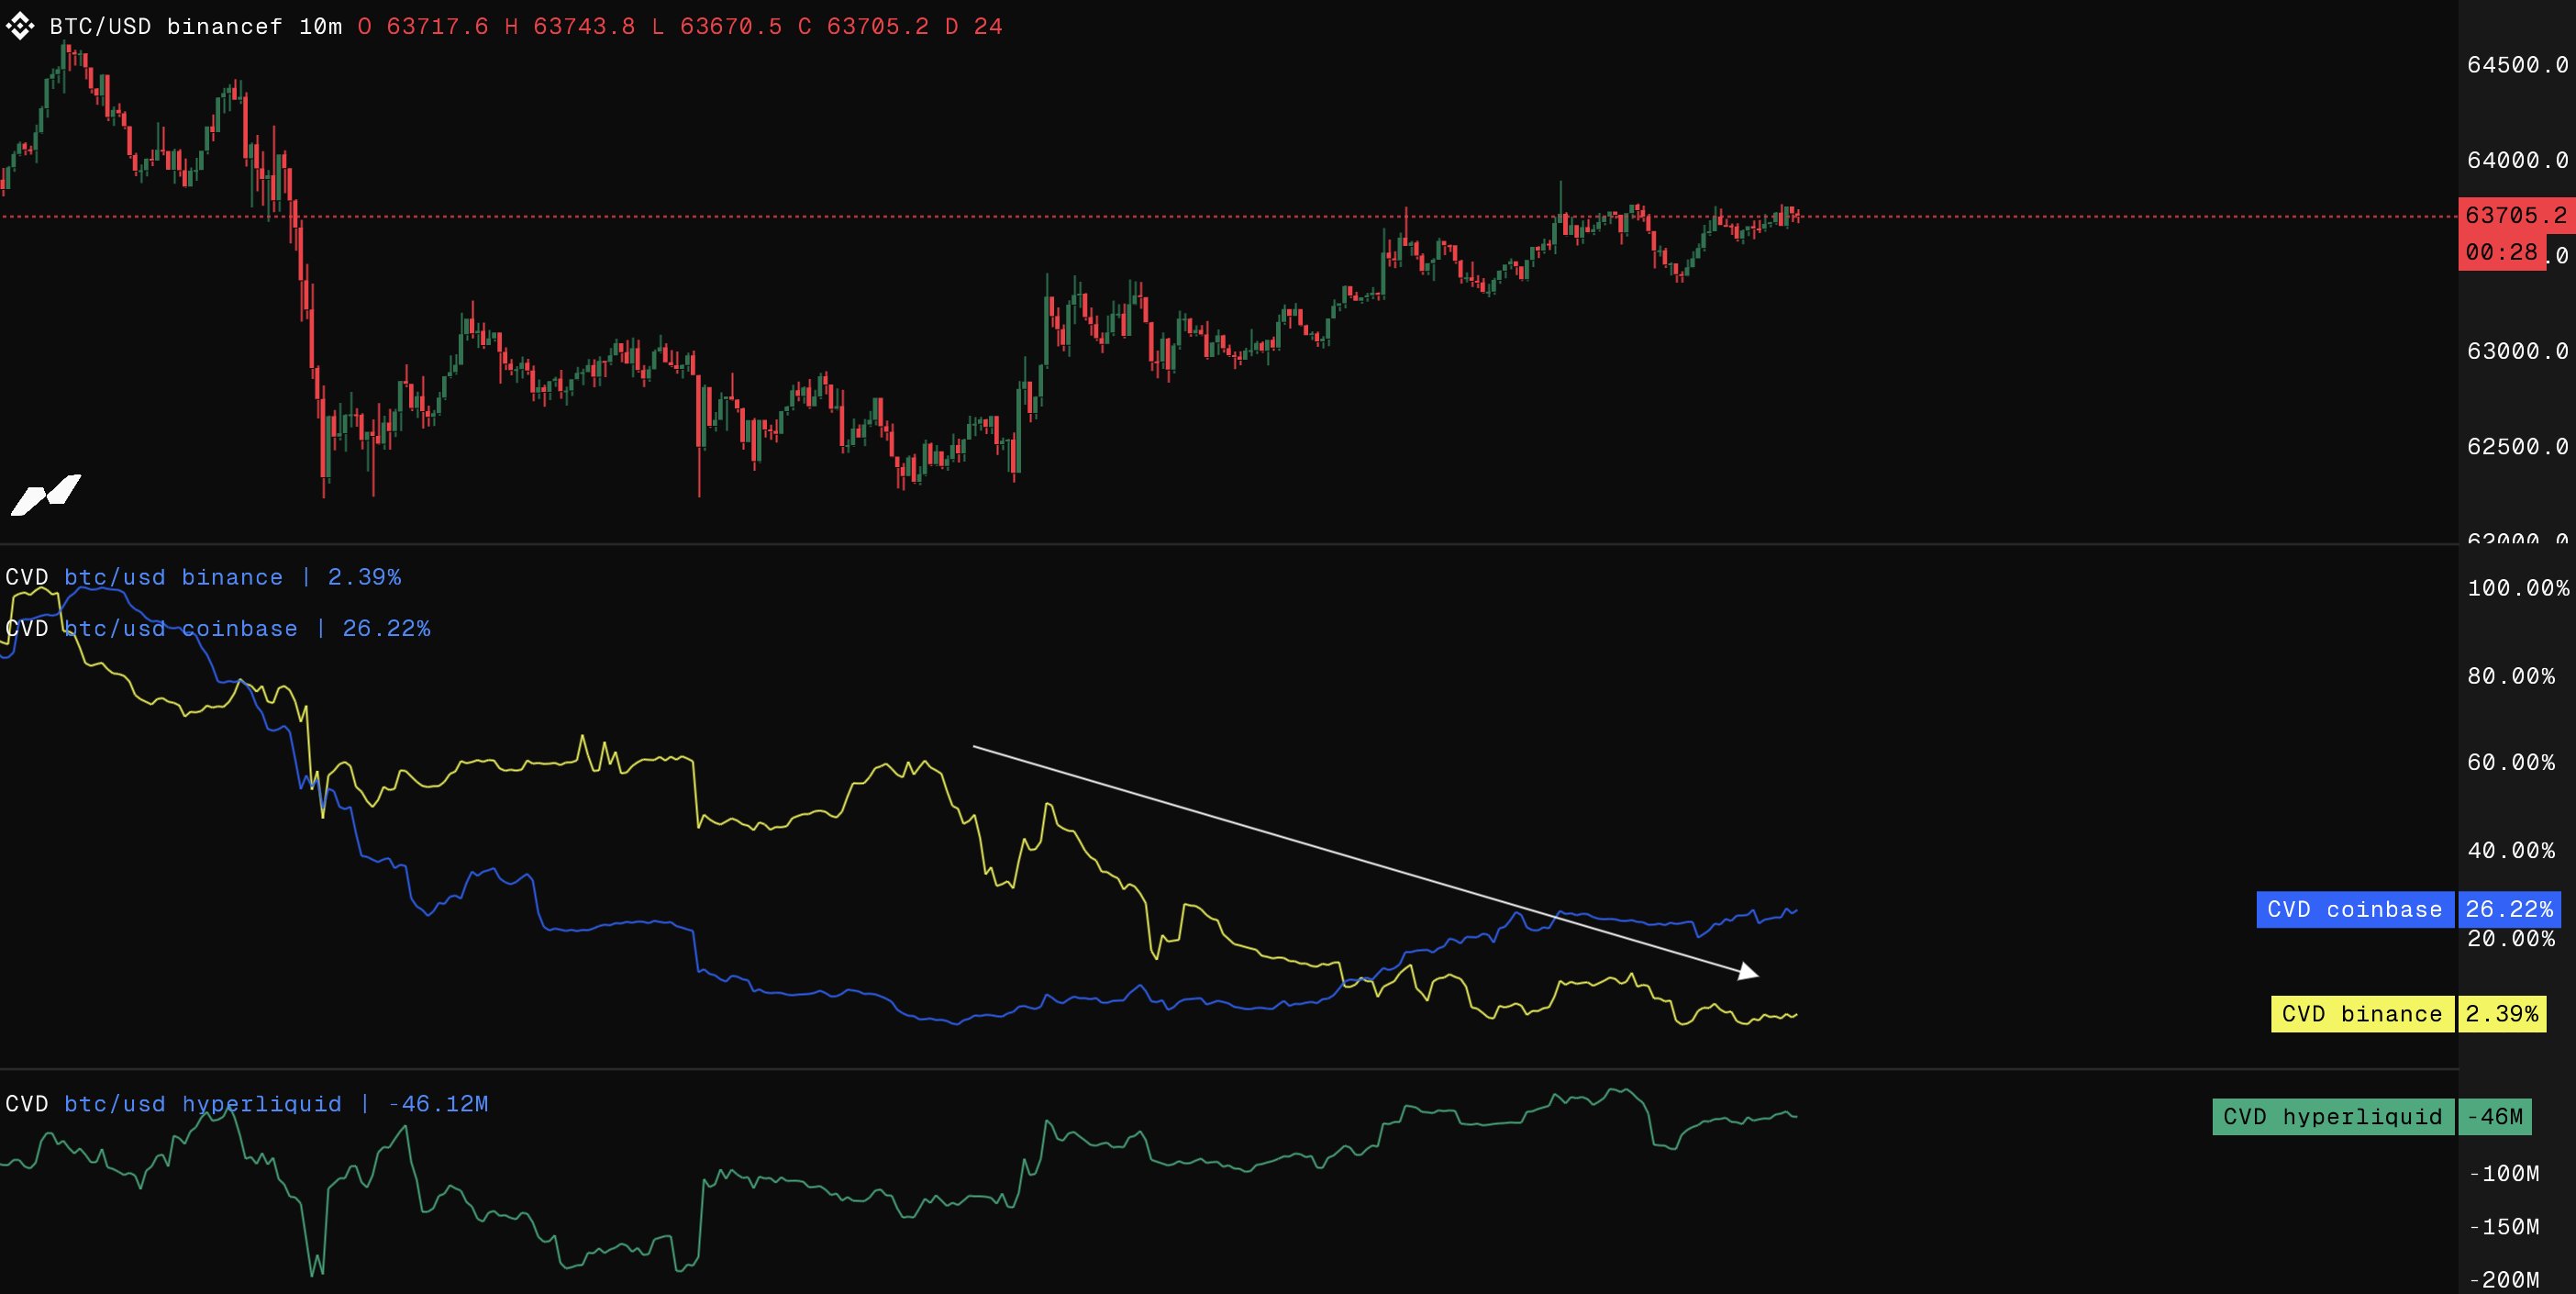
BTC/USD 10-minute chart with order-book data (Binance). Source: Exitpump/X
Earlier, Cointelegraph reported on persistent “aggressive” sell pressure from Binance keeping bulls in check.


Michael Saylor has again raised speculation that Strategy may be preparing another Bitcoin purchase after posting a short message on X tied to the company’s familiar accumulation chart.
The Strategy chairman wrote, “Looks better with more dots,” alongside a Strategy post.
Michael Saylor’s dot post revives buy speculation
Strategy’s acquisition chart has become a closely watched signal for Bitcoin traders. The dots mark past purchases, and Saylor has used similar posts before official updates on the company’s holdings.
The latest post came after Strategy had already resumed buying following a small Bitcoin sale earlier this month. That sale drew attention because it broke a long run of uninterrupted accumulation, but the company later said the move was small and did not change its Bitcoin plan.
Meanwhile, the company’s buying activity often matters to Bitcoin sentiment because it shows whether large treasury buyers remain active during weak price periods. Bitcoin has recently traded near the $64,000 area after a broader pullback.
Strategy’s Bitcoin position remains under watch
As crypto.news previously reported, Strategy bought 1,587 Bitcoin for about $100 million, lifting total reserves to 846,842 BTC. That purchase followed an earlier 32 BTC sale that Strategy described as a process test.
The 32 BTC sale had sparked debate because Strategy built its public image around long-term Bitcoin accumulation. Some market watchers questioned whether preferred stock dividends could force more sales later.
Blockstream CEO Adam Back pushed back on that concern in a Bloomberg interview. Earlier today, crypto.news reported that Back said Strategy’s small sale was not bearish and instead showed the company could use Bitcoin as part of treasury management.
JPMorgan has also warned that Strategy may need to keep building dollar reserves to lower concerns about future Bitcoin sales tied to dividend needs. As crypto.news reported, the bank still expected Strategy’s Bitcoin purchases to reach about $32 billion in 2026.
Saylor urges Bitcoiners to focus on the bigger goal
In a separate X post, Saylor called for unity across the Bitcoin community. He wrote, “Bitcoiners agree on the 99% that matters,” adding that users should not let the remaining 1% divide them while global capital has barely entered Bitcoin’s network.
His comment arrived as Bitcoin users continue to debate technical risks, long-term adoption, and possible quantum-computing threats. Some developers have proposed migration paths for exposed public keys, while others argue the risk timeline remains uncertain.
Saylor framed the wider opportunity as larger than internal disputes.
“The opportunity is bigger than the argument,” he wrote.
The message fits his long-running view that Bitcoin still has a small share of global wealth. It also gives context to the dot-chart post. Saylor appears to be pushing the same core message: Strategy is still focused on Bitcoin accumulation, while he wants the community to keep its attention on adoption rather than division.

Dash is evaluating the Philippines as a potential market for crypto payments, with the project pointing to persistent pressure on consumers to use lower-cost transaction options. During Philippine Blockchain Week 2026, Dash Blockchain’s global adoption lead, Daria Chernozub, said the team is focused on regions where high fees and friction can make everyday payments difficult and where users may be more willing to adopt new digital tools.
Chernozub told Cointelegraph that Dash’s approach is geared toward “people who are suffering from high commissions” and need payment solutions that are simple to use. She also said Dash is conducting an assessment of local demand and market readiness, while prioritizing legal compliance before any launch.
Key takeaways
- Dash is exploring the Philippines for crypto payments, emphasizing lower transaction costs and easier user experience in markets with high fees.
- Dash says it is still assessing the local market and is prioritizing regulatory compliance, including preparation of a legal opinion letter for discussions with relevant bodies.
- The Philippine SEC says foreign companies can register a corporation online in about 20–30 minutes, but operating a crypto business may still require additional approvals.
- Industry participants argue that crypto-specific regulation is considerably more demanding than standard corporate registration, citing multi-year compliance work for exchange partnerships.
Dash’s Philippines push: payments built for fee-sensitive users
Dash’s stated rationale for looking at the Philippines centers on everyday payment costs and usability. In an interview at Philippine Blockchain Week 2026, Chernozub framed the project’s target demographic as users facing expensive commissions and looking for a straightforward alternative. She said the Philippines is a fit because consumers are generally open to learning about new technologies.
Even with that fit, Chernozub emphasized that Dash is not yet in a launch phase. She said the team is working through its market assessment and is placing compliance at the top of its priorities. According to her remarks, Dash has started engaging with major market participants and prepared a legal opinion letter intended to support talks with regulatory and financial industry stakeholders.
Why the compliance gap matters: registration can be fast, crypto operations may not be
A major point raised at the same event was the difference between setting up a corporate presence and meeting crypto-related regulatory obligations. Philippine Securities and Exchange Commission (SEC) Commissioner Rogelio Quevedo told Cointelegraph that foreign investors can register a corporation online from anywhere in the world in roughly 20 to 30 minutes. He described the SEC’s online registration process as part of a broader digitization and innovation push.
Quevedo’s comments suggest that the administrative step of forming a local entity has become much easier for foreign firms. However, the ability to register quickly does not automatically translate into permission to operate a crypto business. Crypto companies may still need additional licensing and must satisfy compliance requirements tied specifically to digital assets and payments.
This tension—between streamlined corporate setup and more complex crypto oversight—was echoed by other speakers at the event. Marie Antonette Quiogue, BlockShoals’ head of legal and CEO of Arden Consult, said the Philippines offers a regulated pathway for foreign crypto exchanges, but that path carries significant obligations. She pointed to the roughly two years BlockShoals spent developing its arrangement with Binance, underscoring how long compliance processes can take even when a framework exists.
Regulatory framework exists, but effort is still front-loaded
Quiogue’s account highlights a practical reality for investors and operators: the “ease” of registering a company is only the beginning of the work. According to her, while the SEC has created a framework for foreign crypto exchanges seeking entry into a regulated environment, meeting the requirements can demand substantial time and coordination.
For market participants, this matters because early compliance decisions can affect timelines, budgeting, and product scope. A project evaluating the Philippines—such as Dash—may need to plan not just for consumer-facing deployment, but also for legal assessments, documentation, and stakeholder engagement well before any rollout of payment services.
In that context, Chernozub’s mention of preparing a legal opinion letter for discussions with regulatory and financial industry bodies signals a similar approach: aligning technical plans with compliance expectations early, rather than treating it as a late-stage hurdle.
Market attractiveness: demand signals and a tech-forward consumer base
Beyond regulations, speakers also pointed to structural factors that could make the Philippines appealing for crypto-related services. Quiogue said the country’s young population, high mobile usage, and widespread English proficiency could help attract overseas crypto firms. Chernozub, meanwhile, connected Dash’s interest to the behavior of local consumers—especially their openness to learning about new technologies—alongside the economic reality that fee-sensitive users often seek more cost-effective options.
Taken together, the discussions suggest that the Philippines may be attractive not because compliance is minimal, but because the demand for accessible financial tools and the ability to reach users via mobile platforms could support adoption—provided firms can successfully navigate the regulatory requirements for crypto activity.
For readers watching this story, the key question is what “compliance-first” assessment ultimately enables. Dash’s current status is exploratory, with legal positioning and market engagement underway. The next signals to monitor are whether Dash moves from evaluation into concrete regulatory discussions and whether it identifies a practical pathway for payment deployment within the local framework.

Franklin Templeton just filed for two ETFs that reroute corporate stock dividends directly into Bitcoin. This just sends Bitcoin price prediction into bullish territory, even as BTC trades in a bearish band.
The structure is genuinely novel, and it could move Bitcoin’s price, especially given that macro conditions and institutional positioning point to a bullish setup heading into the US-Iran-Israel peace deal.
The two funds, the Franklin U.S. Equity Bitcoin DRIP Index ETF and the Franklin U.S. Innovation Bitcoin DRIP Index ETF, each hold a basket of U.S. equities and systematically redirect dividend payments into Bitcoin exposure rather than back into shares.
— NewsTongue (@NewsTongueX) June 19, 2026
 Franklin Templeton Files for ETFs That Reinvest Stock Dividends Into Bitcoin
Franklin Templeton filed with the SEC Thursday for two ETFs—the Franklin U.S. Equity Bitcoin DRIP Index ETF and Franklin U.S. Innovation Bitcoin DRIP Index ETF—that hold U.S. stocks and… pic.twitter.com/1rLnQpMNMB
Both indices start with a 5% Bitcoin weighting, with exposure capped at 20% and trimmed at quarterly rebalances. The filing is preliminary, and no fees are listed yet, but it will potentially have an effective date as early as September 1, 2026, 75 days out under the rule Franklin used.
Franklin’s existing spot Bitcoin ETF, EZBC, already holds $358.9 million in net assets with $329.6 million in cumulative net inflows, signaling the firm’s ability to attract meaningful crypto capital.
This lands inside a broader stampede: Bloomberg Intelligence’s James Seyffart counted well over 100 ETF filings in the pipeline at the end of last year, with Bitwise predicting more than 100 crypto ETFs could launch in 2026.
Discover: The Best Token Presales
Bitcoin Price Prediction: Needs to Hold $61,500, or a Deeper Flush Could Come?
BTC is trading in a wide $62,500-$64,000 range, still down 50% from its all-time high, and the technical picture is not clean. Analyst identified $61,500 as the key breakdown level, a confirmed settlement below that opens the door to the $59,000–$60,000 major support zone.
Liquidity conditions are a real factor: the Juneteenth U.S. market holiday thins order books and historically amplifies intraday swings on low-conviction days. That’s not a reason to panic, but it’s a reason to size carefully.

If BTC reclaims $65,000 on above-average volume, it would confirm the DRIP filing news as a demand signal. Institutional follow-through could push toward prior swing highs.
However, a daily close below $61,500 shifts the structure bearish in the near term, with $59,000–$60,000 the next meaningful demand zone. Franklin Templeton executive Tony Pecore thinks that BTC should surpass its prior all-time high in 2026 on institutional adoption, but it does not change the short-term technical risk.
Longer-horizon price models remain bullish on BTC through year-end, but the near-term setup is a support retest, not a confirmed breakout. Watch the $61,500 level with discipline.
Discover: The Best Crypto to Diversify Your Portfolio
Bitcoin Hyper Positions for Upside as BTC Tests Its Range Floor
Spot BTC at current levels offers asymmetric upside if institutional flows compound, but the risk/reward is a different conversation than it was at $10,000.
Traders who already hold BTC exposure are essentially waiting on macro resolution and ETF approval timelines. Those looking for earlier-stage leverage on the Bitcoin ecosystem are eyeing infrastructure plays that aren’t yet priced by the market.
Bitcoin Hyper ($HYPER) is positioning itself as the first Bitcoin Layer 2 with SVM (Solana Virtual Machine) integration. It offers a combination that targets Bitcoin’s core bottlenecks: slow throughput, high fees, and limited programmability.
The pitch is sub-second finality and low-cost smart contract execution built on Bitcoin’s security layer, something the base chain structurally cannot offer on its own. The presale has raised more than $32 million at a current price of $0.0136, with staking available for early participants. A decentralized canonical bridge for BTC transfers rounds out the infrastructure stack.
Franklin Templeton’s move is a signal of institutional appetite for Bitcoin-adjacent infrastructure.
Research Bitcoin Hyper here before the presale window closes.
The post Bitcoin Price Prediction: BTC Eyes Upside as Franklin Templeton Pushes Stock Dividends appeared first on Cryptonews.
Quick Summary
- May’s PCE inflation reading arrives Thursday and may exceed April’s 3.8% annual increase
- Micron Technology delivers quarterly results Wednesday, with its valuation reaching $1 trillion and stock surging 800%-plus year-to-date
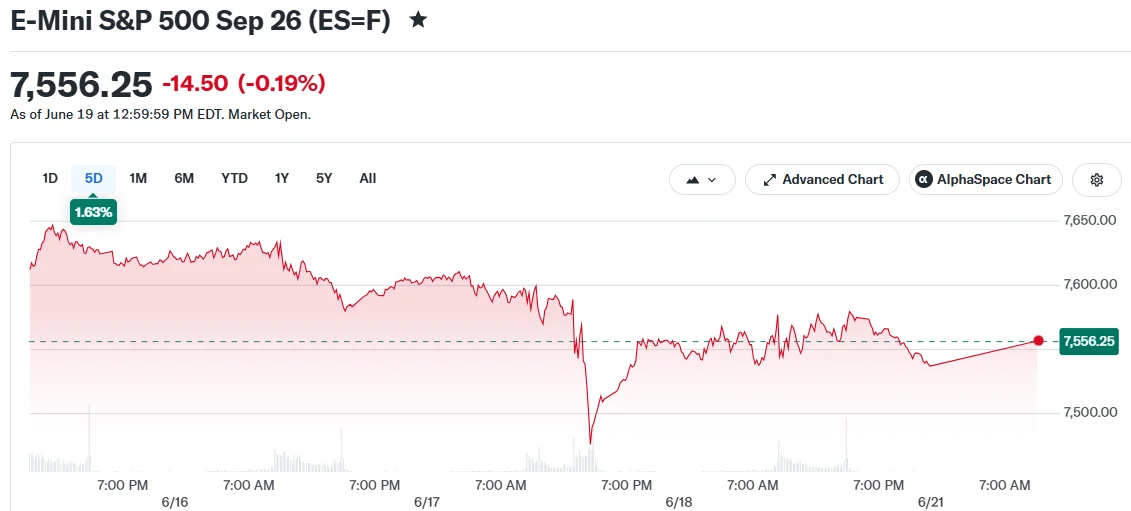
- Weekly gains: S&P 500 up 1.08%, Nasdaq jumped 2.48%, Dow edged higher by 0.14%
- SpaceX completed the biggest IPO ever recorded, securing $85.7 billion at a valuation exceeding $2 trillion
- Bitcoin advanced 0.46% to $64,139, underperforming the technology-driven equity surge
Equity markets pushed higher through the previous week, propelled by significant technology sector developments, a landmark public offering, and renewed optimism regarding international trade relations. Here’s a breakdown of recent action and critical events approaching in the days ahead.
Major Indexes Close With Solid Gains
All three primary U.S. benchmarks finished in positive territory. The S&P 500 advanced 1.08% to settle at 7,500.58. The Nasdaq posted a 2.48% gain, reaching 30,406.19, buoyed by robust appetite for technology and growth-oriented equities. The Dow Jones Industrial Average rose 0.14%, finishing at 51,564.70.

A preliminary U.S.-Iran peace agreement boosted investor confidence. The potential for resumed commerce through the Strait of Hormuz contributed to declining crude prices and encouraged risk-on positioning.
The 10-year U.S. Treasury yield finished the week at 4.455%. This level remains significant for growth-focused companies, which typically face pressure when financing costs climb.
The Federal Reserve, now led by recently appointed Chair Kevin Warsh, maintained its current interest rate stance. However, policymakers indicated additional tightening remains possible should inflationary pressures persist. The central bank has kept rates unchanged since December.
Bitcoin edged up 0.46% to finish at $64,139.86. Gold dropped 1.72% to $4,172.90. Digital assets lagged the wider market advance, which was predominantly powered by technology and mega-cap growth stocks.
SpaceX Delivers Unprecedented Public Market Debut
The week’s headline event was SpaceX’s public market entrance. Elon Musk’s aerospace and satellite enterprise secured $85.7 billion through its IPO, establishing a new record. The offering valued SpaceX at more than $2 trillion.
The landmark listing redirected investor focus toward major technology and innovation-focused enterprises.
SpaceX also purportedly reached an agreement to purchase AI company Cursor for $60 billion, a strategic step toward bolstering its artificial intelligence operations.
Nvidia revealed intentions to issue at minimum $20 billion in investment-grade debt for general corporate applications. This represents one of the chipmaker’s most substantial financing initiatives since the artificial intelligence expansion commenced.
Fox Corporation disclosed a $22 billion transaction to purchase Roku, the connected TV platform. This acquisition extends Fox’s digital footprint as legacy media organizations pursue stronger streaming and advertising infrastructure.
Yum! Brands divested Pizza Hut to LongRange Capital and Yum China Holdings for $2.7 billion. Management stated the transaction enables concentration on its other primary brands.
Critical Events on the Horizon
Micron Technology unveils fiscal third-quarter financial performance on Wednesday. The memory chipmaker’s valuation has reached $1 trillion while shares have skyrocketed more than 800% year-to-date. The firm posted gross margins exceeding 68% in its latest disclosure, prompting speculation about whether the memory semiconductor cycle approaches a top.
The PCE price index for May releases Thursday. April’s figure registered 3.8% on an annual basis, marking the highest level in three years. May’s reading could climb even further based on additional recent inflation indicators. The Federal Reserve monitors the PCE as its primary inflation gauge.
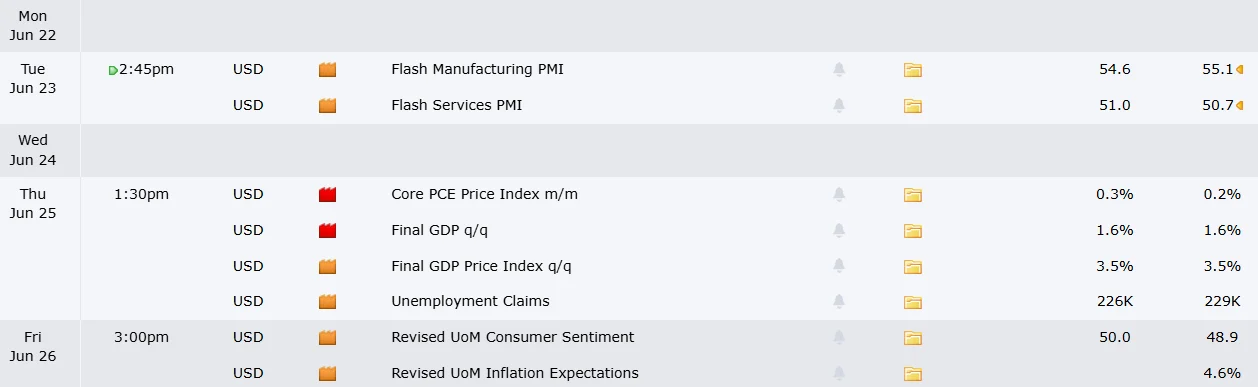
Additional corporate reports this week feature Carnival Corp., FedEx, BlackBerry, and Darden Restaurants. BlackBerry shares have more than doubled during 2026 driven by its expanding Nvidia collaboration and increasing demand for its QNX operating system deployed in advanced driver assistance technologies.


Key Takeaways
- Micron’s transformation from cyclical memory producer to critical AI infrastructure provider is fueled by surging high-bandwidth memory (HBM) requirements
- The semiconductor giant secured a position as an HBM4 supplier for Nvidia’s upcoming AI platforms
- Analyst sentiment remains overwhelmingly positive: 35 Buy/Strong Buy recommendations, 4 Hold ratings, and no Sell recommendations
- Conservative projections estimate MU shares could reach approximately $840 by 2031, while optimistic scenarios suggest $1,750
- Industry experts predict this memory demand cycle may prove more durable than historical patterns due to AI’s infrastructure requirements
For years, Micron existed in the shadows as just another cyclical semiconductor stock. Today, that narrative is undergoing a dramatic transformation.
The catalyst is straightforward: artificial intelligence workloads demand enormous amounts of specialized memory. Advanced AI servers rely heavily on high-bandwidth memory solutions, and Micron stands among the select few manufacturers capable of delivering at enterprise scale.
This dynamic has fundamentally altered Micron’s investment thesis.
Shares have experienced substantial appreciation throughout the ongoing AI infrastructure buildout as HBM and datacenter memory demand continues outpacing available supply. Financial analysts have progressively increased their valuation targets as the AI memory narrative demonstrates remarkable staying power.
The company’s recent inclusion in Nvidia’s HBM4 supply chain represents a strategic win, positioning Micron at the center of next-generation AI computing infrastructure.
Industry observers highlight that Micron’s manufacturing capacity is essentially operating at full allocation. Hyperscale cloud operators and AI infrastructure builders are absorbing production output immediately upon availability.
In response to relentless demand, Micron has expanded its capital expenditure commitments. Executive leadership clearly anticipates sustained market strength.
Projected Valuation Scenarios Through 2031
Analyst modeling presents three distinct trajectories for MU shares over the coming six-year period.
Under a pessimistic scenario, AI infrastructure investment moderates and memory pricing returns to traditional cyclical behavior. Annual revenue approaches $60 billion by 2031, with earnings per share near $10, resulting in a stock price around $200.
The moderate case assumes continued AI demand momentum. HBM contributes an expanding portion of total revenue, profit margins expand, and annual sales reach approximately $110 billion. This pathway suggests earnings per share near $28 and a share price around $840.
An aggressive scenario envisions Micron achieving HBM market leadership with enhanced pricing leverage and revenue climbing toward $180 billion. Under these conditions, shares could potentially reach $1,750.
Weighting these scenarios by probability generates a blended 2031 price target of approximately $947.
Analyst Community Shows Strong Conviction
Wall Street’s endorsement of Micron reaches levels rarely observed across the semiconductor sector.
MarketBeat data reveals the stock currently carries 5 Strong Buy ratings, 30 Buy ratings, and 4 Hold ratings. Notably, zero analysts recommend selling.
Multiple research firms have argued the present memory expansion cycle may exhibit greater longevity than previous upturns, attributing this to AI creating fundamental structural demand rather than temporary purchasing spikes.
Micron’s latest quarterly results and forward guidance support this thesis. Both revenue performance and margin profiles have shown positive trends as HBM represents a growing percentage of the company’s sales composition.

Quick Overview
- Micron’s Wednesday earnings release will test the strength of AI memory chip demand
- Nvidia sentiment hinges on Micron’s performance despite not reporting earnings
- Carnival’s quarterly report reveals the state of consumer travel and leisure spending
- FedEx quarterly results provide crucial insights into trade volumes and e-commerce trends
- Darden’s earnings offer visibility into discretionary dining expenditures
Investors face a critical week ahead, with earnings releases from five major corporations and an inflation reading that could trigger significant market movement.
The Personal Consumption Expenditures index for May — which serves as the Federal Reserve’s primary inflation gauge — arrives simultaneously with quarterly reports from Micron, Carnival, FedEx, and Darden Restaurants. Though Nvidia isn’t scheduled to report, the chipmaker remains under close scrutiny.
Micron Technology
Wednesday marks Micron Technology’s fiscal Q3 earnings announcement, positioning it as the week’s most anticipated corporate disclosure.
The semiconductor manufacturer specializing in memory chips has emerged as a primary winner from the AI infrastructure boom. High-bandwidth memory requirements have skyrocketed as technology giants expand their artificial intelligence computing capabilities.
Tightening supply conditions have pushed memory chip prices upward, providing a tailwind for Micron’s profit margins. Market participants will scrutinize profitability metrics, pricing dynamics, and forward-looking statements.
Given the stock’s impressive appreciation, investor expectations have elevated substantially. Guidance that falls short or margin compression could trigger sharp price swings.
Nvidia
While Nvidia won’t be releasing quarterly results next week, it deserves investor attention nonetheless.
Micron’s financial performance serves as a proxy for the entire AI semiconductor ecosystem. Robust memory chip demand would confirm sustained spending on AI infrastructure — a positive indicator for Nvidia’s business.
Nvidia maintains its dominant position in AI accelerator chips, propelled by purchases from cloud computing platforms and corporate clients. However, the stock’s elevated valuation multiple leaves it vulnerable to shifts in interest rate expectations.
Should the PCE inflation data exceed forecasts, growth-oriented equities like Nvidia might experience selling pressure.
Carnival Corporation
Carnival’s Q2 financial results arrive next week, providing transparency into consumer appetite for travel experiences.
The cruise line operator has enjoyed robust reservation volumes, premium pricing power, and a sustained preference for experiential consumption following the pandemic. Key metrics include reservation patterns, fuel expense management, profit margins, and annual projections.
Declining oil prices may improve the company’s expense profile. Conversely, global political instability has introduced challenges throughout the travel industry.
Carnival’s performance will indicate whether households continue prioritizing vacation spending amid elevated interest rates.
FedEx
FedEx delivers its fiscal Q4 earnings next week, serving as one of Wall Street’s most reliable economic indicators.
The logistics giant’s operations touch retail commerce, online shopping, industrial production, and international shipping. Its financial results provide comprehensive perspective on business activity levels and consumer purchasing power.
FedEx exceeded analyst projections in the previous quarter while upgrading its outlook. Market watchers will assess whether this positive trajectory continued through the final quarter.
The company’s recent divestiture of its freight business, which reports separately later in the week, adds another dimension as investors evaluate FedEx’s strategic transformation and growth prospects.
Darden Restaurants
Darden Restaurants concludes the important earnings stretch with updates from its Olive Garden and LongHorn Steakhouse chains.
The restaurant operator provides direct insight into dining expenditures among middle-class and affluent American consumers. Analysts will examine menu price changes, comparable store sales performance, and customer traffic patterns.
Restaurant industry spending has demonstrated relative resilience compared to other consumer sectors, though inflation pressures and borrowing costs have influenced household spending decisions.
Strong Darden results would indicate continued discretionary spending capacity. Disappointing numbers might suggest consumers are becoming more cautious.
PCE Inflation Data Takes Center Stage
Beyond corporate earnings, the May PCE inflation release represents the week’s potentially most consequential market event.
Persistent inflation would likely keep the Federal Reserve in a holding pattern longer than markets currently anticipate. Such an outcome would weigh on interest-rate-sensitive securities and richly valued growth stocks.
Conversely, cooling inflation could provide momentum for growth equities as investors position for the latter half of 2026.
Market participants will analyze all five companies alongside the inflation figures for clarity on current market conditions and future direction.
Bitcoin’s price has been quietly regaining some momentum, slowly increasing to just over $64,000 over the weekend, but that stable progress could be halted in the following hours.
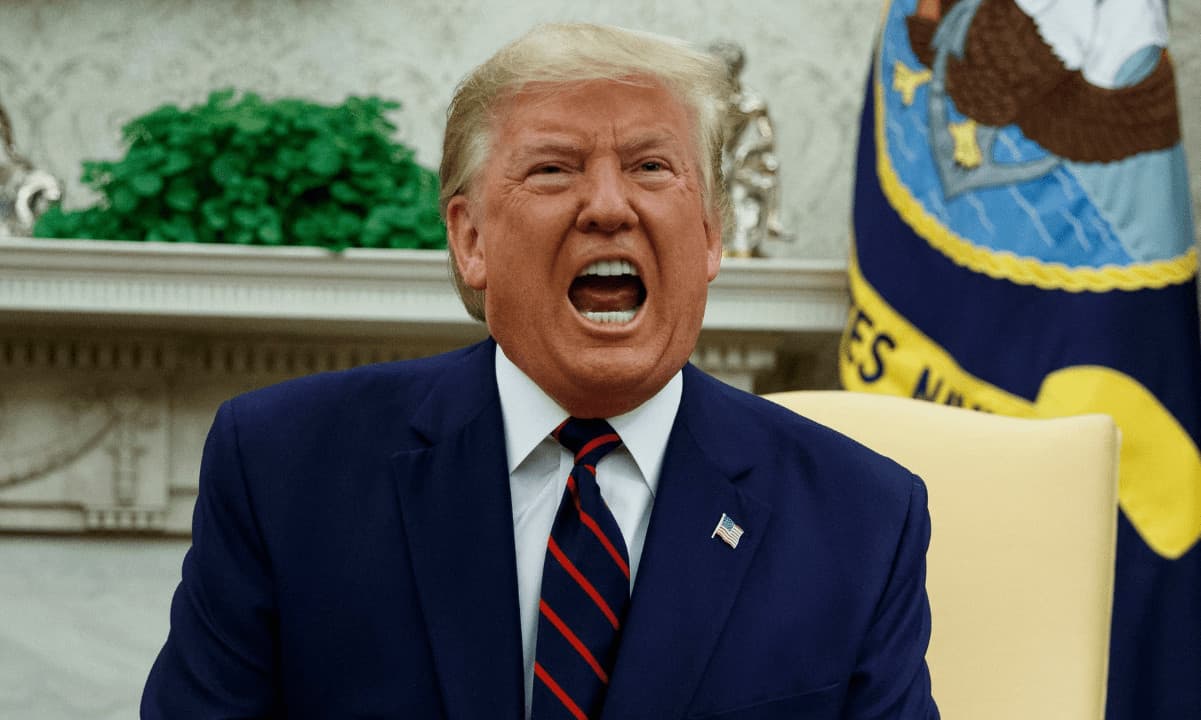
The promised peace deal between the US and Iran is in question once again, as Trump just threatened the Middle Eastern country with new strikes on his Truth Social platform.
“Iran must immediately stop their highly paid PROXIES in Lebanon from causing trouble. If they don’t, we’ll hit Iran very hard again, just like we did last week, only harder!!! President DONALD J. TRUMP”
Recall that the POTUS announced that both parties had agreed to a deal last Sunday, which was supposed to be signed by June 19. However, that deadline has passed with no official signatures, and Iran even closed (again) the Strait of Hormuz after citing a breach of its agreement with the US to end the war as a reason.
The only positive development on the matter came as Israel and Lebanon announced a ceasefire, which is also in doubt now.
Live updates from the ongoing meeting between the US and Iran in Switzerland informed minutes ago that JD Vance and other negotiators from the Trump administration are in the same room as Iranian officials in a rare face-to-face meeting.
According to CBS News, officials have added an emergency session on the fighting in Lebanon to the Swiss talks, as more than a dozen people were killed in Lebanon by new Israeli strikes on Saturday, hours after the ceasefire agreement had become official.
Consequently, the promise for a more permanent peace deal is far from being certain now. In fact, the situation appeared a lot more promising last Sunday when Trump announced the upcoming deal.
Bitcoin’s price reacted with a notable pump from $64,000 to over $67,000 at the time, but it was stopped and driven south to under $62,500 as the uncertainty grew and the Fed maintained the rates unchanged.
Although it went past $64,000 earlier today, its progress could be halted over the past few hours and days if there’s no positive resolution on the war front.
The post Is Bitcoin (And Peace) In Trouble as Trump Warns Iran of Fresh Strikes? appeared first on CryptoPotato.
Every bullish signal is in place. Exchange supply is draining, whales are accumulating, ETF money is trickling in, and a landmark law sits on the Senate floor. And still XRP keeps losing support and failing at the same ceiling. Here is why the chart is winning the argument.
Summary
- XRP lost $1.15 on heavy volume and failed to reclaim it into the close.
- The $1.25 descending trendline remains the level that keeps rejecting rallies.
- Bullish fundamentals are real, but the market is not rewarding them yet.
- A decisive trendline break is needed before the chart confirms the story.
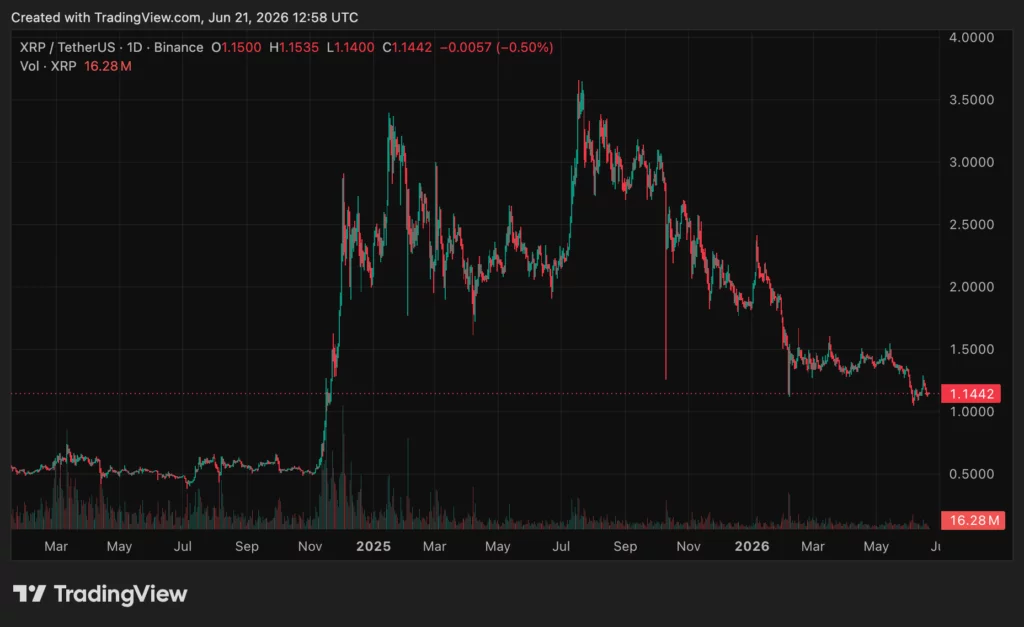
XRP broke below $1.15 on June 19, 2026, falling more than 3% on a volume spike roughly 170% above average, and the break mattered more than the size of the drop. That $1.15 level had been support, the floor buyers defended after a recent push above $1.20, and losing it on heavy volume turned a level that had held the price up into a level that now caps it.
It was the latest in a pattern that has defined XRP for months: every attempt to rally runs into a descending trendline near $1.25 and fails, every recovery stalls, and support levels give way one after another even as the fundamental case for XRP grows stronger.
Exchange supply is draining to multi-year lows, large holders are accumulating aggressively, exchange-traded fund money is flowing in, and the most important crypto legislation in American history sits on the Senate floor. And still the price cannot hold.
The chart is winning the argument against the story, and understanding why is the key to understanding XRP right now.
This piece works through that contradiction. It covers exactly what happened at the $1.15 break and the technical structure XRP is trapped in, the bullish fundamental case that keeps failing to move the price, why a market late in a downtrend stops responding to good news, the specific levels that now define the battle, and how to read a situation where strong fundamentals and weak price action point in opposite directions.
The goal is not to predict where XRP goes next but to explain why it behaves the way it does. The gap between XRP’s improving fundamentals and its deteriorating chart is one of the most instructive setups in crypto, and it teaches something important about how markets actually work when sentiment turns.
The break, and the structure XRP is trapped in
To understand why XRP cannot hold its levels, you have to see the technical structure it has been caught in, because that structure explains the repeated failures better than any single piece of news.
The June 19 break was specific and revealing. XRP fell about 3.4%, dropping from roughly $1.19 to around $1.14, with the sharpest selling arriving in a single burst when volume surged to roughly 170% above average and pushed the price decisively through the $1.15 support.

Buyers stepped in near $1.13 and managed to lift the price back toward $1.15 into the close, but the rebound failed to reclaim the broken level. That is the technically important detail: a support level that breaks and then rejects the price on the way back up has flipped into resistance, becoming a ceiling, not a floor.
This is the same pattern that has repeated at higher levels, where $1.25 was lost earlier and turned into the overhead resistance that has capped every rally since, and now $1.15 risks doing the same thing at a lower level. Each broken support becomes the next ceiling, and the price grinds lower through a staircase of failed floors.
The larger structure containing all of this is a year-long symmetrical triangle, a charting pattern in which the price oscillates within a narrowing range bounded by a descending line of lower highs above and a flatter line of support below. For XRP, the price action has compressed between support near $1.10 and resistance around $1.25, with a descending trendline near $1.25 that has rejected every recovery attempt for months, forming the series of lower highs that defines the downtrend.
This is the cage XRP is trapped in: it cannot break above the descending trendline near $1.25, so every rally fails there, and it keeps losing the support levels beneath it, so the floor keeps dropping.
The most important level on the entire chart is that descending trendline near $1.25, because XRP has failed below it repeatedly, and until the price decisively breaks above it, traders treat every rally as a test of resistance to be sold, not the start of a new uptrend. The structure, not any single news event, is what keeps defeating the price.
The bullish case that keeps failing
Here is what makes XRP’s chart so striking: the fundamental case for the asset has been getting stronger, not weaker, even as the price falls, and laying out that case sharpens the puzzle.
The on-chain and structural signals are clearly bullish. XRP held on exchanges has fallen to multi-year lows as coins move off trading venues into private wallets, which reduces the supply readily available to sell, a setup that is supposed to support prices.
That is the supply story behind the chart. Large holders have been accumulating aggressively, with wallets holding a million or more XRP controlling a record share of the circulating supply and adding well over a billion XRP over six months, the kind of conviction buying that bulls read as a positive sign.
Exchange-traded fund money has been flowing into XRP products, with XRP drawing inflows that outpaced other major altcoins on some days, signaling real institutional interest. That is the demand case for XRP, where ETF flows matter only if they become large enough to break the supply wall.
And underneath all of it sits the largest catalyst of all: the CLARITY Act, the crypto market-structure bill that would codify XRP’s status as a digital commodity into federal law, sitting on the Senate floor and representing a potential demand shock if it passes. That is the catalyst that could break the trendline.
By almost every fundamental measure, the case for XRP has been improving.
And yet the price keeps falling, which is the heart of the contradiction. XRP is down sharply over the past month even as exchange balances shrink, whales accumulate, ETF money arrives, and a transformative law advances.
The bullish signals are real, but they have not translated into price strength, and recovery attempts built on them keep failing at the same resistance.
This is the puzzle that frustrates XRP holders: every reason to be bullish is in place, the supply is tightening, the big holders are buying, the institutions are interested, the law is advancing, and none of it has stopped the price from grinding lower and losing support after support.
The fundamental case and the price action have completely diverged, with the story pointing up and the chart pointing down. That divergence is not a temporary anomaly to be dismissed.
It is itself a signal, and understanding what it means is the most important thing about XRP’s current situation.
Why a market late in a downtrend ignores good news
The explanation for the contradiction lies in market psychology, specifically in how markets behave late in a downtrend, and it is one of the most useful lessons a trader can internalize.
When an asset is no longer reacting positively to bullish news, that is often a characteristic sign of a late-stage downtrend, and it is exactly what XRP has been doing. In a healthy uptrend or a neutral market, good news lifts the price, because buyers are willing to act on it.
But when sentiment has turned negative and a downtrend is entrenched, the market stops responding to good news, because the marginal participant is a seller, not a buyer. Every rally attracts holders looking to exit at a better price, every piece of bullish news is met with selling into the strength, and the accumulated negative sentiment overwhelms the positive fundamentals.
XRP has been repeatedly failing to react positively to bullish supply data, which is precisely the behavior of a market where technical selling is overwhelming longer-term accumulation, and where traders have shifted to focusing on price action and levels instead of on fundamentals and narrative.
This is why XRP’s strong fundamentals have not saved its price: in the current sentiment regime, the fundamentals are simply not what the marginal trader is acting on. The supply tightening and whale accumulation are real, but they describe longer-term, patient positioning.
The day-to-day price is set by shorter-term traders who are selling rallies and respecting the downtrend, and right now the shorter-term selling is winning. The descending trendline near $1.25 has become a self-reinforcing level.
Because it has rejected every rally, traders expect it to reject the next one, so they sell into approaches to it, which makes the rejection happen, which reinforces the expectation. The market has, in effect, decided to trade XRP technically rather than fundamentally, and until that changes, the good news keeps arriving and the price keeps ignoring it.
This is not irrational; it is how markets behave when sentiment is negative and a technical structure has taken hold. It explains why “every bullish signal is in place and the price still falls” is not a contradiction but a recognizable late-downtrend pattern.
The levels that define the battle
With the structure and the psychology understood, the situation reduces to a small number of specific price levels, and watching them is how to read what happens next.
The single most important level is the descending trendline near $1.25, which has capped every rally for months and which defines the entire downtrend. A decisive break above $1.25, on strong volume, would change the conversation entirely, because it would mean XRP had finally broken the descending structure that has contained it.
That would flip the technical picture from “sell every rally” to “a new uptrend may be starting.” Until that happens, $1.25 is the ceiling, and traders will treat approaches to it as opportunities to sell, not as breakouts to chase.
Just below the current price, the recently broken $1.15 level now acts as resistance, the first hurdle bulls must reclaim, and beneath that, support is clustered between roughly $1.13 and $1.10, the zone buyers are trying to defend. The broader triangle is bounded by support near $1.10 and resistance near $1.25, so the price is compressed within that range, and a decisive break of either boundary would signal the next significant move.
The asymmetry in these levels is what defines the current battle. On the downside, if XRP loses the $1.13 to $1.10 support zone, the next levels of support sit lower, and a breakdown through the bottom of the year-long triangle would open the door to a deeper decline, accelerating the downtrend.
On the upside, the path is harder, because XRP must first reclaim the broken $1.15 level, then push through the resistance up to $1.25, and then decisively break the descending trendline that has rejected it repeatedly. That is a series of hurdles, not a single one.
This is why the near-term bias in the price action has been bearish even with bullish fundamentals: the downside requires only losing a nearby support, while the upside requires clearing a stack of resistances culminating in a trendline break. The levels to watch are therefore clear: $1.10 to $1.13 as the support that must hold, $1.15 as the first ceiling to reclaim, and $1.25 as the decisive level whose break would change everything.
Everything in between is the compression of a triangle reaching its resolution. For readers newer to technical setups, reading support and resistance is essential because these levels define where buyers and sellers repeatedly reveal themselves.
How to read fundamentals against price
The deeper lesson of XRP’s situation is about how to think when strong fundamentals and weak price action point in opposite directions, because this is a common and confusing situation that this case illustrates clearly.
The temptation for a fundamentals-focused observer is to conclude that the market is simply wrong, that the bullish supply data and the advancing law mean XRP must rise, and that the falling price is an irrational mistake to be ignored or bought. This is dangerous, because it dismisses the most direct evidence available, the price itself, which aggregates the actual decisions of all market participants.
When fundamentals and price diverge for an extended period, the price is telling you that something the fundamentals miss is dominating. In XRP’s case, that is the negative sentiment and technical selling that overwhelm the positive supply story.
Respecting that signal is wiser than insisting the market should agree with your fundamental analysis. The price action is not noise obscuring the fundamentals; it is information about how the market is actually weighing everything, including factors the bullish narrative leaves out, like the broad crypto downtrend and the macro headwind on XRP.
The wiser reading holds both the fundamentals and the price action as real and lets the price action govern the near-term while the fundamentals inform the longer-term possibility. XRP’s improving fundamentals truly could matter eventually, especially if the CLARITY catalyst lands and shifts sentiment, at which point the tightened supply could amplify an upside move, exactly the setup the bulls describe.
But until sentiment turns and the price confirms it by breaking the descending trendline, the fundamentals remain potential energy that the market is not yet acting on, and trading as though the bullish case is already winning ignores what the chart is plainly saying.
The synthesis is that XRP is a fundamentally improving asset trapped in a technically bearish structure, and the resolution depends on a catalyst strong enough to flip sentiment and break the trendline, most plausibly the CLARITY vote. Watching the price for that break, instead of assuming the fundamentals will force it, is the disciplined way to read the situation.
The fundamentals load the spring; the price tells you whether it has been released. None of this is investment advice; it is a frame for thinking clearly when the story and the chart disagree.
When the chart wins the argument
XRP cannot hold $1.15 for the same reason it could not hold $1.25 before it: the asset is trapped in a year-long descending structure, a symmetrical triangle bounded by resistance near $1.25 and support near $1.10, where a trendline of lower highs rejects every rally and each broken support becomes the next ceiling.
The June 19 break below $1.15 on heavy volume, with the failed attempt to reclaim it, was the latest turn of a pattern that has defined XRP for months. The price is grinding lower through a staircase of failed floors while every recovery stalls at resistance.
What makes the situation so instructive is that it happens against a genuinely bullish fundamental backdrop. Exchange supply is draining to multi-year lows, whales are accumulating a record share of the supply, ETF money is flowing in, and the CLARITY Act sits on the Senate floor as a potential demand shock.
By almost every fundamental measure, the case for XRP is strengthening, and yet the price keeps falling, because the asset is late in a downtrend where the market has stopped responding to good news. The marginal trader is a seller, and accumulated negative sentiment overwhelms the positive fundamentals.
This is not a contradiction but a recognizable pattern: when sentiment turns negative and a technical structure takes hold, fundamentals become potential energy the market is not yet acting on, and the chart wins the argument.
The resolution waits on a catalyst strong enough to flip sentiment and break the descending trendline near $1.25, most plausibly the CLARITY vote, and until that break comes, the disciplined reading is to respect what the price is saying.
The fundamentals have loaded the spring; the chart is still holding it down.
Frequently asked questions
Why did XRP break below $1.15?
On June 19, 2026, XRP fell about 3.4% from roughly $1.19 to around $1.15, with the sharpest selling arriving on a volume spike about 170% above average that pushed the price decisively through $1.15 support. Buyers stepped in near $1.13 but failed to reclaim the broken $1.15 level into the close. The break mattered because a support level that breaks and then rejects the price flips into resistance, becoming a new ceiling, continuing a months-long pattern of failed support levels.
What is the symmetrical triangle XRP is trapped in?
It is a year-long charting pattern in which XRP’s price has compressed between support near $1.10 and resistance near $1.25, bounded above by a descending trendline of lower highs. That trendline near $1.25 has rejected every rally attempt for months, defining the downtrend, while the price keeps losing support levels beneath it. The structure is the cage XRP is caught in: it cannot break above $1.25, and it keeps dropping through the floors below, grinding lower until the triangle resolves.
Why is XRP falling if the fundamentals are bullish?
Because XRP is late in a downtrend, where markets stop responding to good news. Exchange supply is draining, whales are accumulating, ETF money is flowing in, and the CLARITY Act is advancing, all bullish. But in a negative-sentiment downtrend, the marginal trader is a seller: rallies attract holders looking to exit, bullish news is sold into, and technical selling overwhelms longer-term accumulation. When an asset stops reacting positively to good news, it is a characteristic sign of a late-stage downtrend, which is exactly XRP’s behavior.
What levels matter most for XRP now?
The single most important level is the descending trendline near $1.25, which has capped every rally for months; a decisive break above it would change the technical picture entirely. The recently broken $1.15 is now the first resistance bulls must reclaim. Support is clustered between $1.13 and $1.10, the zone that must hold to prevent a deeper decline. The broader triangle runs between $1.10 support and $1.25 resistance, and a decisive break of either boundary signals the next major move.
What would it take for XRP to turn bullish?
A decisive break above the descending trendline near $1.25 on strong volume, which would flip the technical structure from “sell every rally” to a potential new uptrend. That most plausibly requires a catalyst strong enough to flip sentiment, most likely passage of the CLARITY Act, which would codify XRP’s commodity status and could trigger a demand shock that the tightened supply would amplify. Until the price confirms by breaking the trendline, the bullish fundamentals remain potential energy the market is not yet acting on.
Should I trust the fundamentals or the price?
When fundamentals and price diverge for an extended period, the price is telling you something the fundamentals miss is dominating, in XRP’s case negative sentiment and technical selling. Dismissing the falling price as an irrational mistake is dangerous, because the price aggregates all participants’ actual decisions. The wiser approach holds both as real: the fundamentals could matter eventually, especially if CLARITY lands, but until sentiment turns and the price confirms by breaking resistance, the near-term is governed by the chart. This is not investment advice.
As of June 21, 2026. Prices are volatile and move quickly; verify current levels before relying on this analysis. This article is information, not investment or trading advice.

Although the landscape is quietly and slowly improving, the spot exchange-traded funds tracking bitcoin’s performance ended the week once again in the red.
Ethereum’s negative trend was also extended, as the funds behind the two largest cryptocurrencies haven’t seen a single week in the green in a month and a half.
Bitcoin ETFs in Red (Again)
Even Monday recorded substantial net outflows, with $64.09 million leaving the BTC ETFs. This was somewhat surprising since the cryptocurrency’s price actually rose past $67,000 on that date, fueled by optimism from the deal announced by US President Trump between his country and Iran.
The only day in the green was actually Tuesday, with investors inserting $10.06 million into the financial vehicles. However, the trend reversed once again on Wednesday and Thursday, with withdrawals of $82.16 million and $90.66 million, respectively.
With Friday being a non-trading day, the week ended with a total net outflow of $226.84 million, marking the sixth consecutive week in the red since the one that ended on May 15. The total cumulative net inflows have declined during this time by a whopping $5 billion.
Perhaps the only positive conclusion from this is that the total outflows have declined from $1.72 billion during the first week of June to $316 million and the aforementioned $226.84 million in the last two.
The other notable development in the past week on the ETF front, aside from BlackRock’s new product, came from Franklin Templeton. The financial behemoth filed for two ETFs that will invest in US stocks and buy BTC with the dividends from those stocks.
Equity Bitcoin DRIP: proposed ETFs will invest in US stocks but then broad index of stocks pay out dvds the ETF will buy btc with that money. Trying it w innovation stocks too. Interesting.. https://t.co/bDpWOqijKK
— Eric Balchunas (@EricBalchunas) June 19, 2026
ETH ETFs in Red, Too
The spot Ethereum ETFs also ended the week in red, thus seeing a similar 6-week outflow-dominated streak. They had two days in the green, with Monday being the first as $22.50 million entered the products amid the growing peace optimism at the time.
Another $9.59 million went into the funds on Tuesday, but the tides turned once again on Wednesday and Thursday. The total net outflows for those days were $29.37 million and $12.77 million, as the week closed with a negative $10.05 million.
The cumulative total net inflows for the ETH ETFs are down from $12.09 billion on May 8 to $11.18 billion on June 18.
The post Bitcoin ETFs in Red for 6 Weeks in a Row Amid Major Filings From Franklin Templeton appeared first on CryptoPotato.
The Best WWII Sleeper Hit of 2026 Destroys the Competition With Digital Blitz

This Is My FINAL Bitcoin WARNING! (22 Hours Left)

When and How to See Strawberry Moon? Moon Rises June 29 as Final Micro Moon of 2026


-

 Business7 days ago
No Jackpot Winner as $257 Million Prize Rolls Over to $269 Million Monday Draw
-

 Fashion2 days ago
Weekend Open Thread: Miami – Corporette.com
-
 Crypto World7 days ago
Zimbabwe Requires Crypto Businesses to Register Annually Under New FIU Regulations
-
 Business1 day ago
Wall Street Week Ahead: Investors see Micron earnings as pulse check of AI rally momentum
-
 Entertainment7 days ago
Matt Damon’s Viral Sci-Fi Thriller Has Taken Over HBO Max
-

 Crypto World2 days ago
HIVE shares jump as $220M AI deal speeds Bitcoin mining pivot
-

 Tech7 days ago
As AI companies race to go public, who else is along for the ride?
-

 Business7 days ago
Anthropic staff to meet White House officials next week, Axios reports
-
 Crypto World7 days ago
Bitcoin could crash to $48,000, if this historical pattern is triggered
-
 NewsBeat7 days ago
what doctors are seeing in ebike crashes
-
 NewsBeat7 days ago
Warning of disruption as Cardiff Crossrail works to start
-
 NewsBeat7 days ago
Tributes to former deputy head teacher at Cambridge school among death and funeral notices
-
 Entertainment7 days ago
Kate Middleton Glare Goes Viral After Kids Booed At Royal Event
-

 Politics7 days ago
“Israel’s” ban on ICRC visits ruled illegal, but Knesset moves to stop them permanently
-
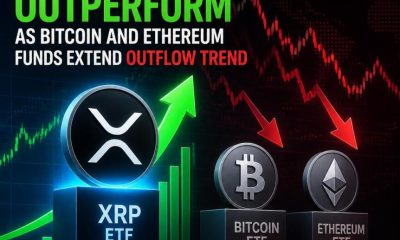
 Crypto World7 days ago
XRP ETFs Outperform As Bitcoin And Ethereum Funds Extend Outflow Trend
-

 Tech7 days ago
Over 400 Arch Linux packages compromised to push rootkit, infostealer
-

 News Videos7 days ago
Financial Accounting | Last Day Revision Strategy and Booster | CMA Inter – June 2026
-

 Sports7 days ago
Dick Advocaat’s Curacao scores first-ever World Cup goal against Germany
-

 Business7 days ago
Invesco Quality Income Fund Q1 2026 Commentary
-

 NewsBeat7 days ago
Singer Oliver Tree dies aged 32 in helicopter crash in Brazil
You must be logged in to post a comment Login